
BC-miR: Monitoring Breast Cancer-Related miRNA Profile in Blood Sera—A Prosperous Approach for Tumor Detection


Abstract
: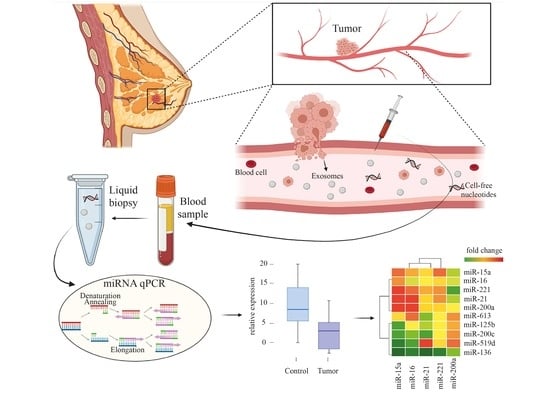
1. Introduction
2. Materials and Methods
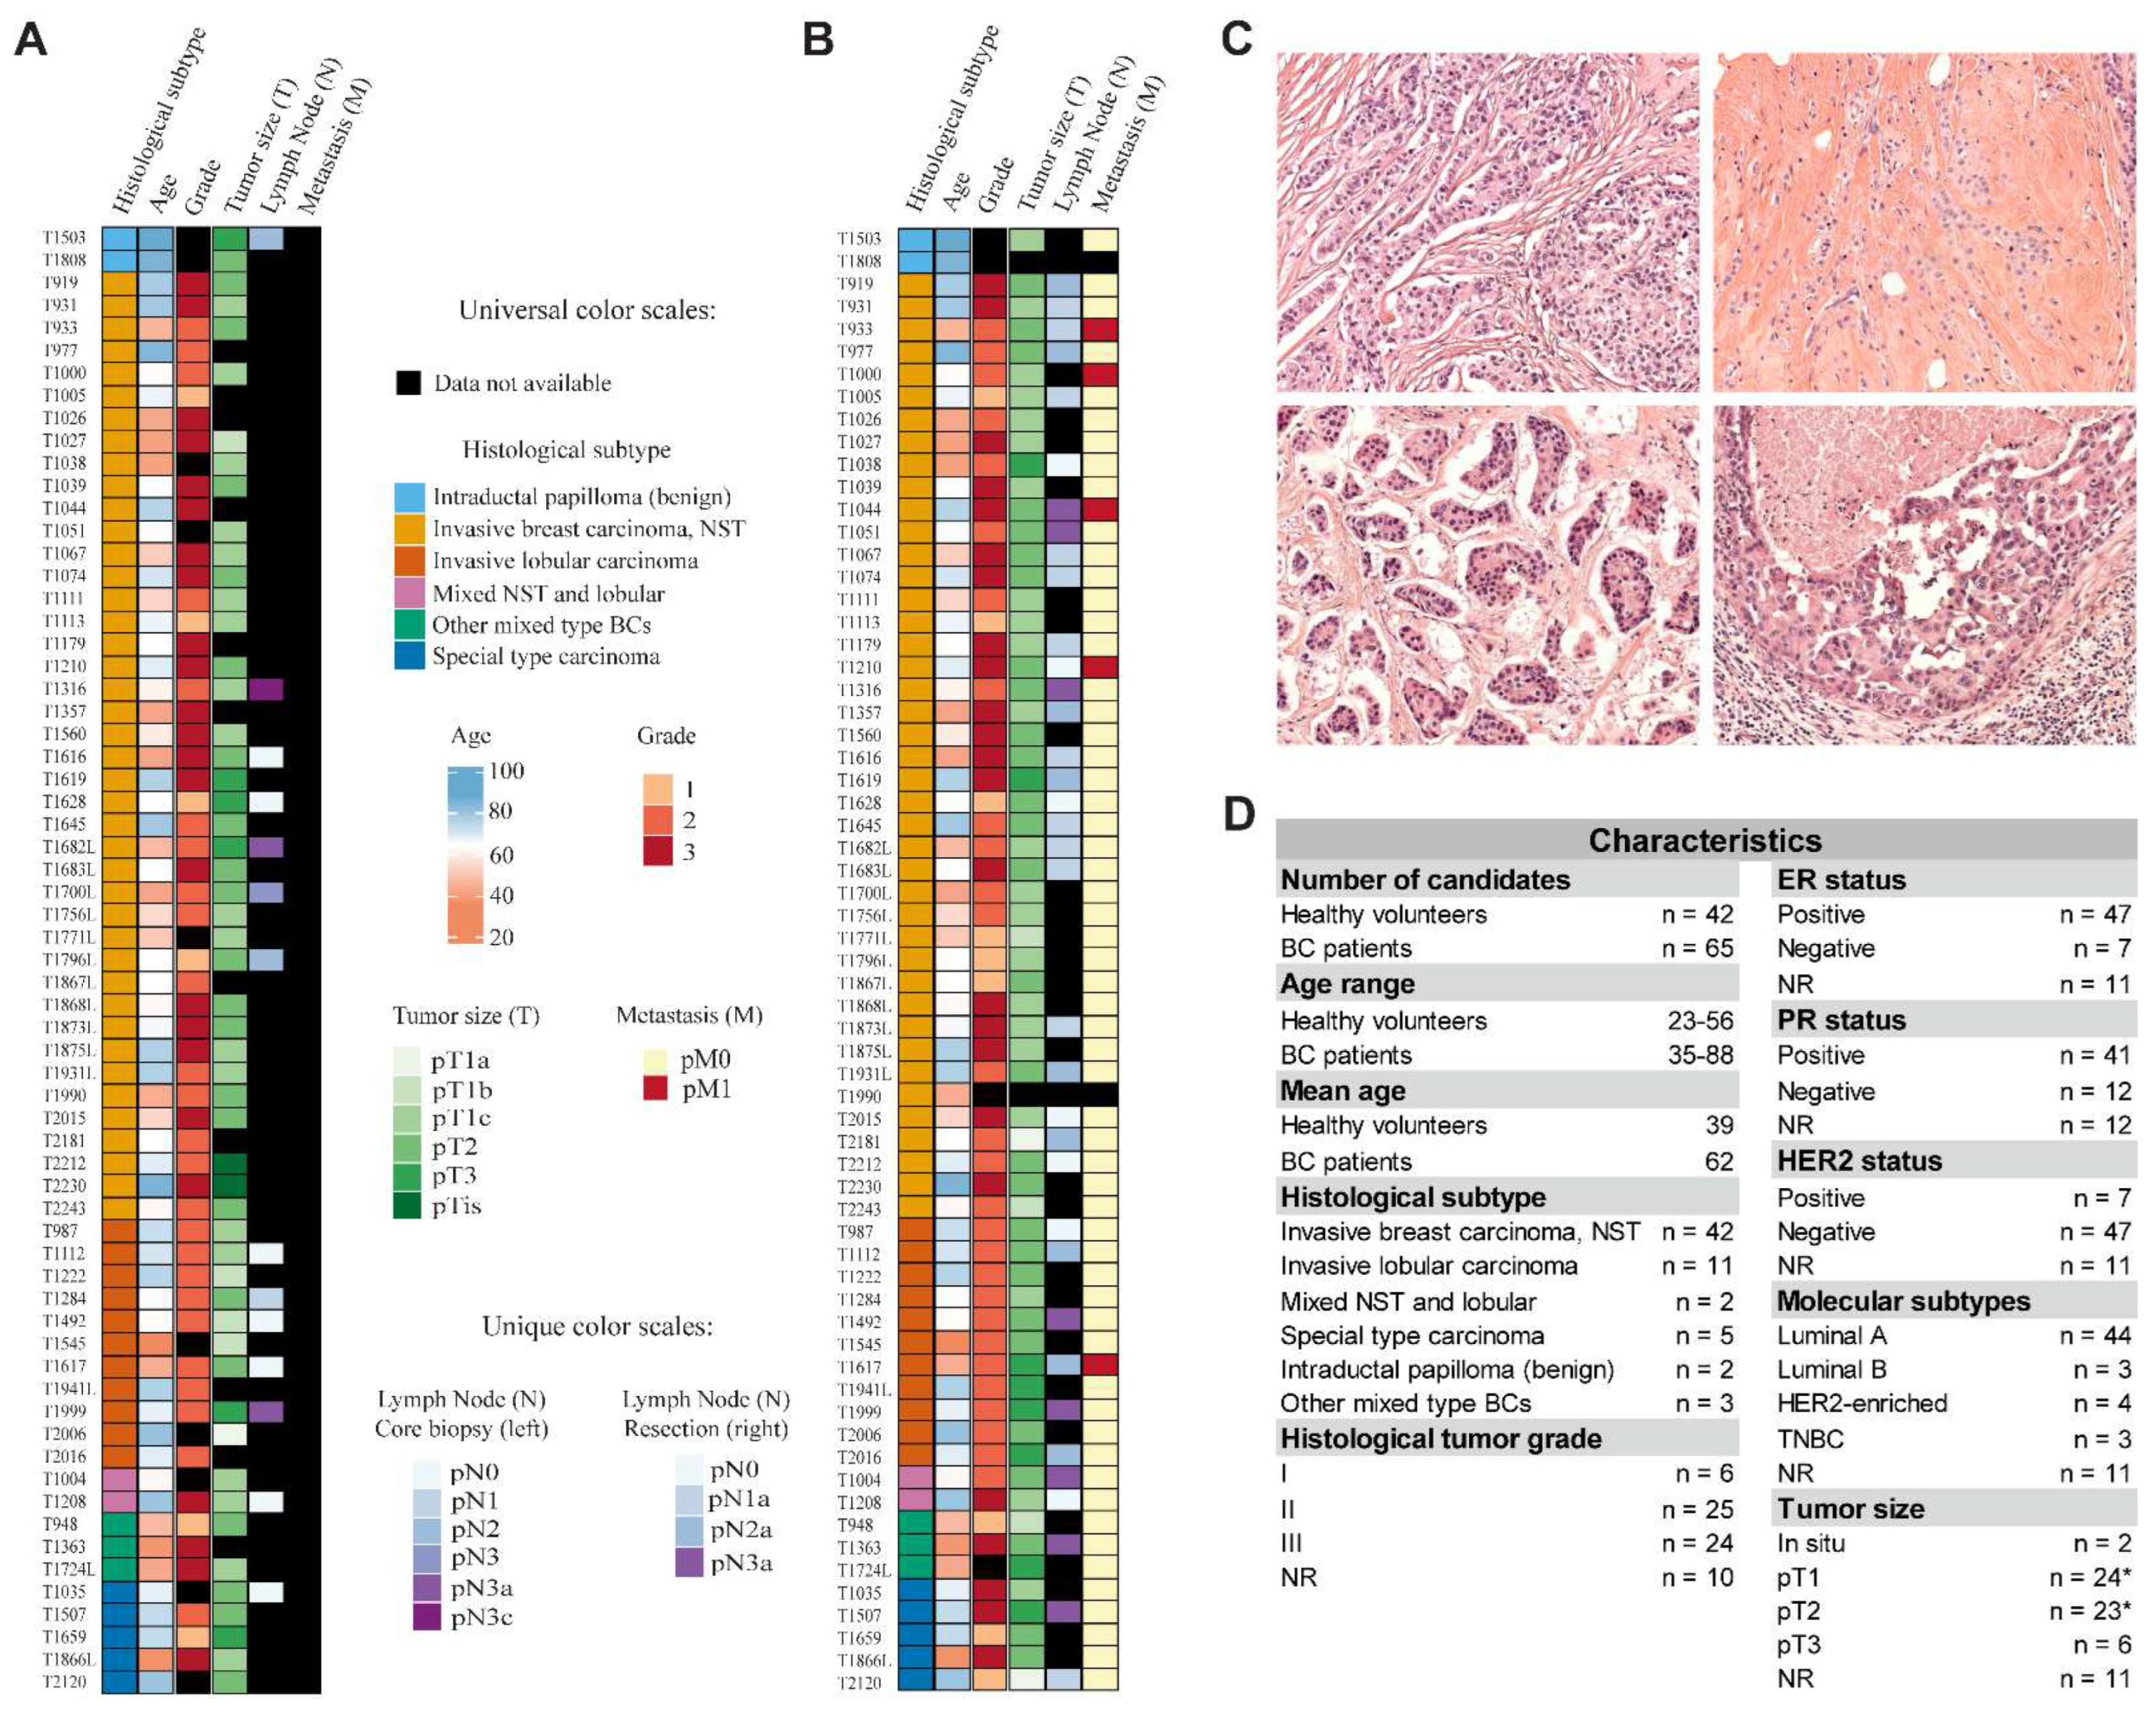
2.1. Cohort Characteristics
2.2. Hematoxylin and Eosin Staining of Tissue Specimens
2.3. Preparation of Blood Sera
2.4. miRNA Isolation, Reverse Transcription, and qPCR
2.5. Statistical Analyses
3. Results
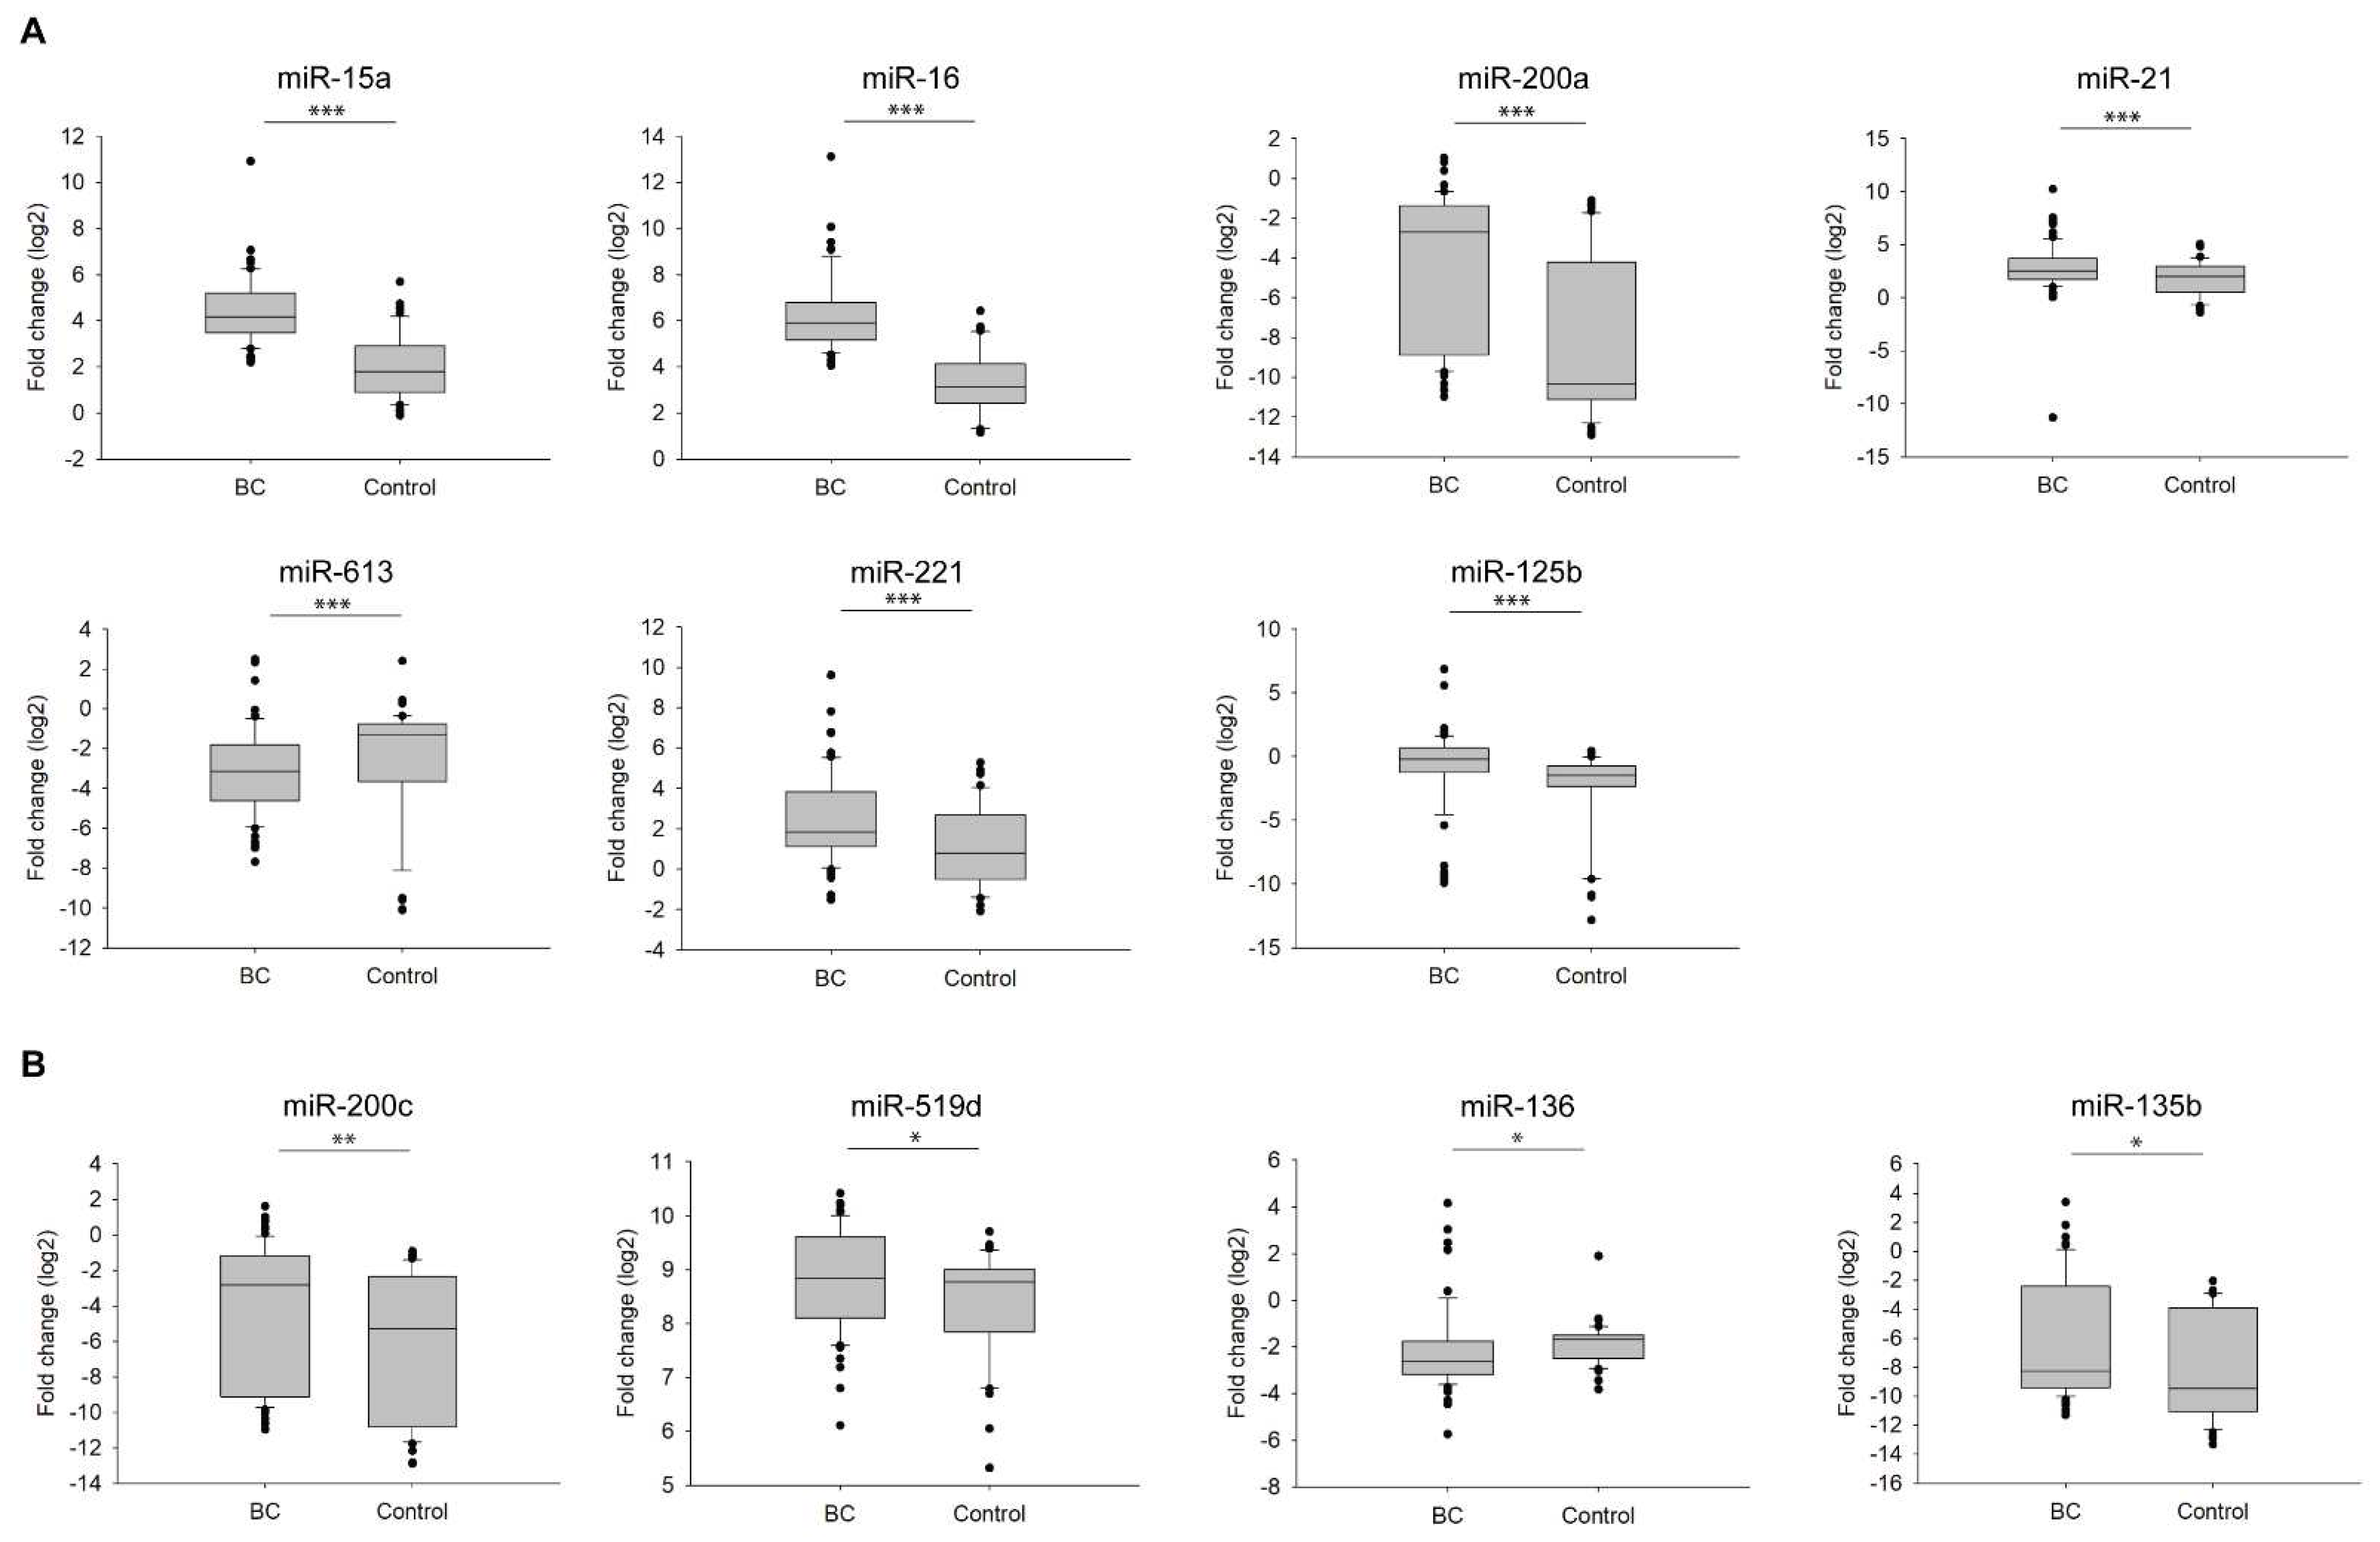
3.1. Circulating miRNA Expression Level Changes between Patients with Breast Cancer and Healthy Volunteers
3.2. Diagnostic Accuracy of Individual miRNAs
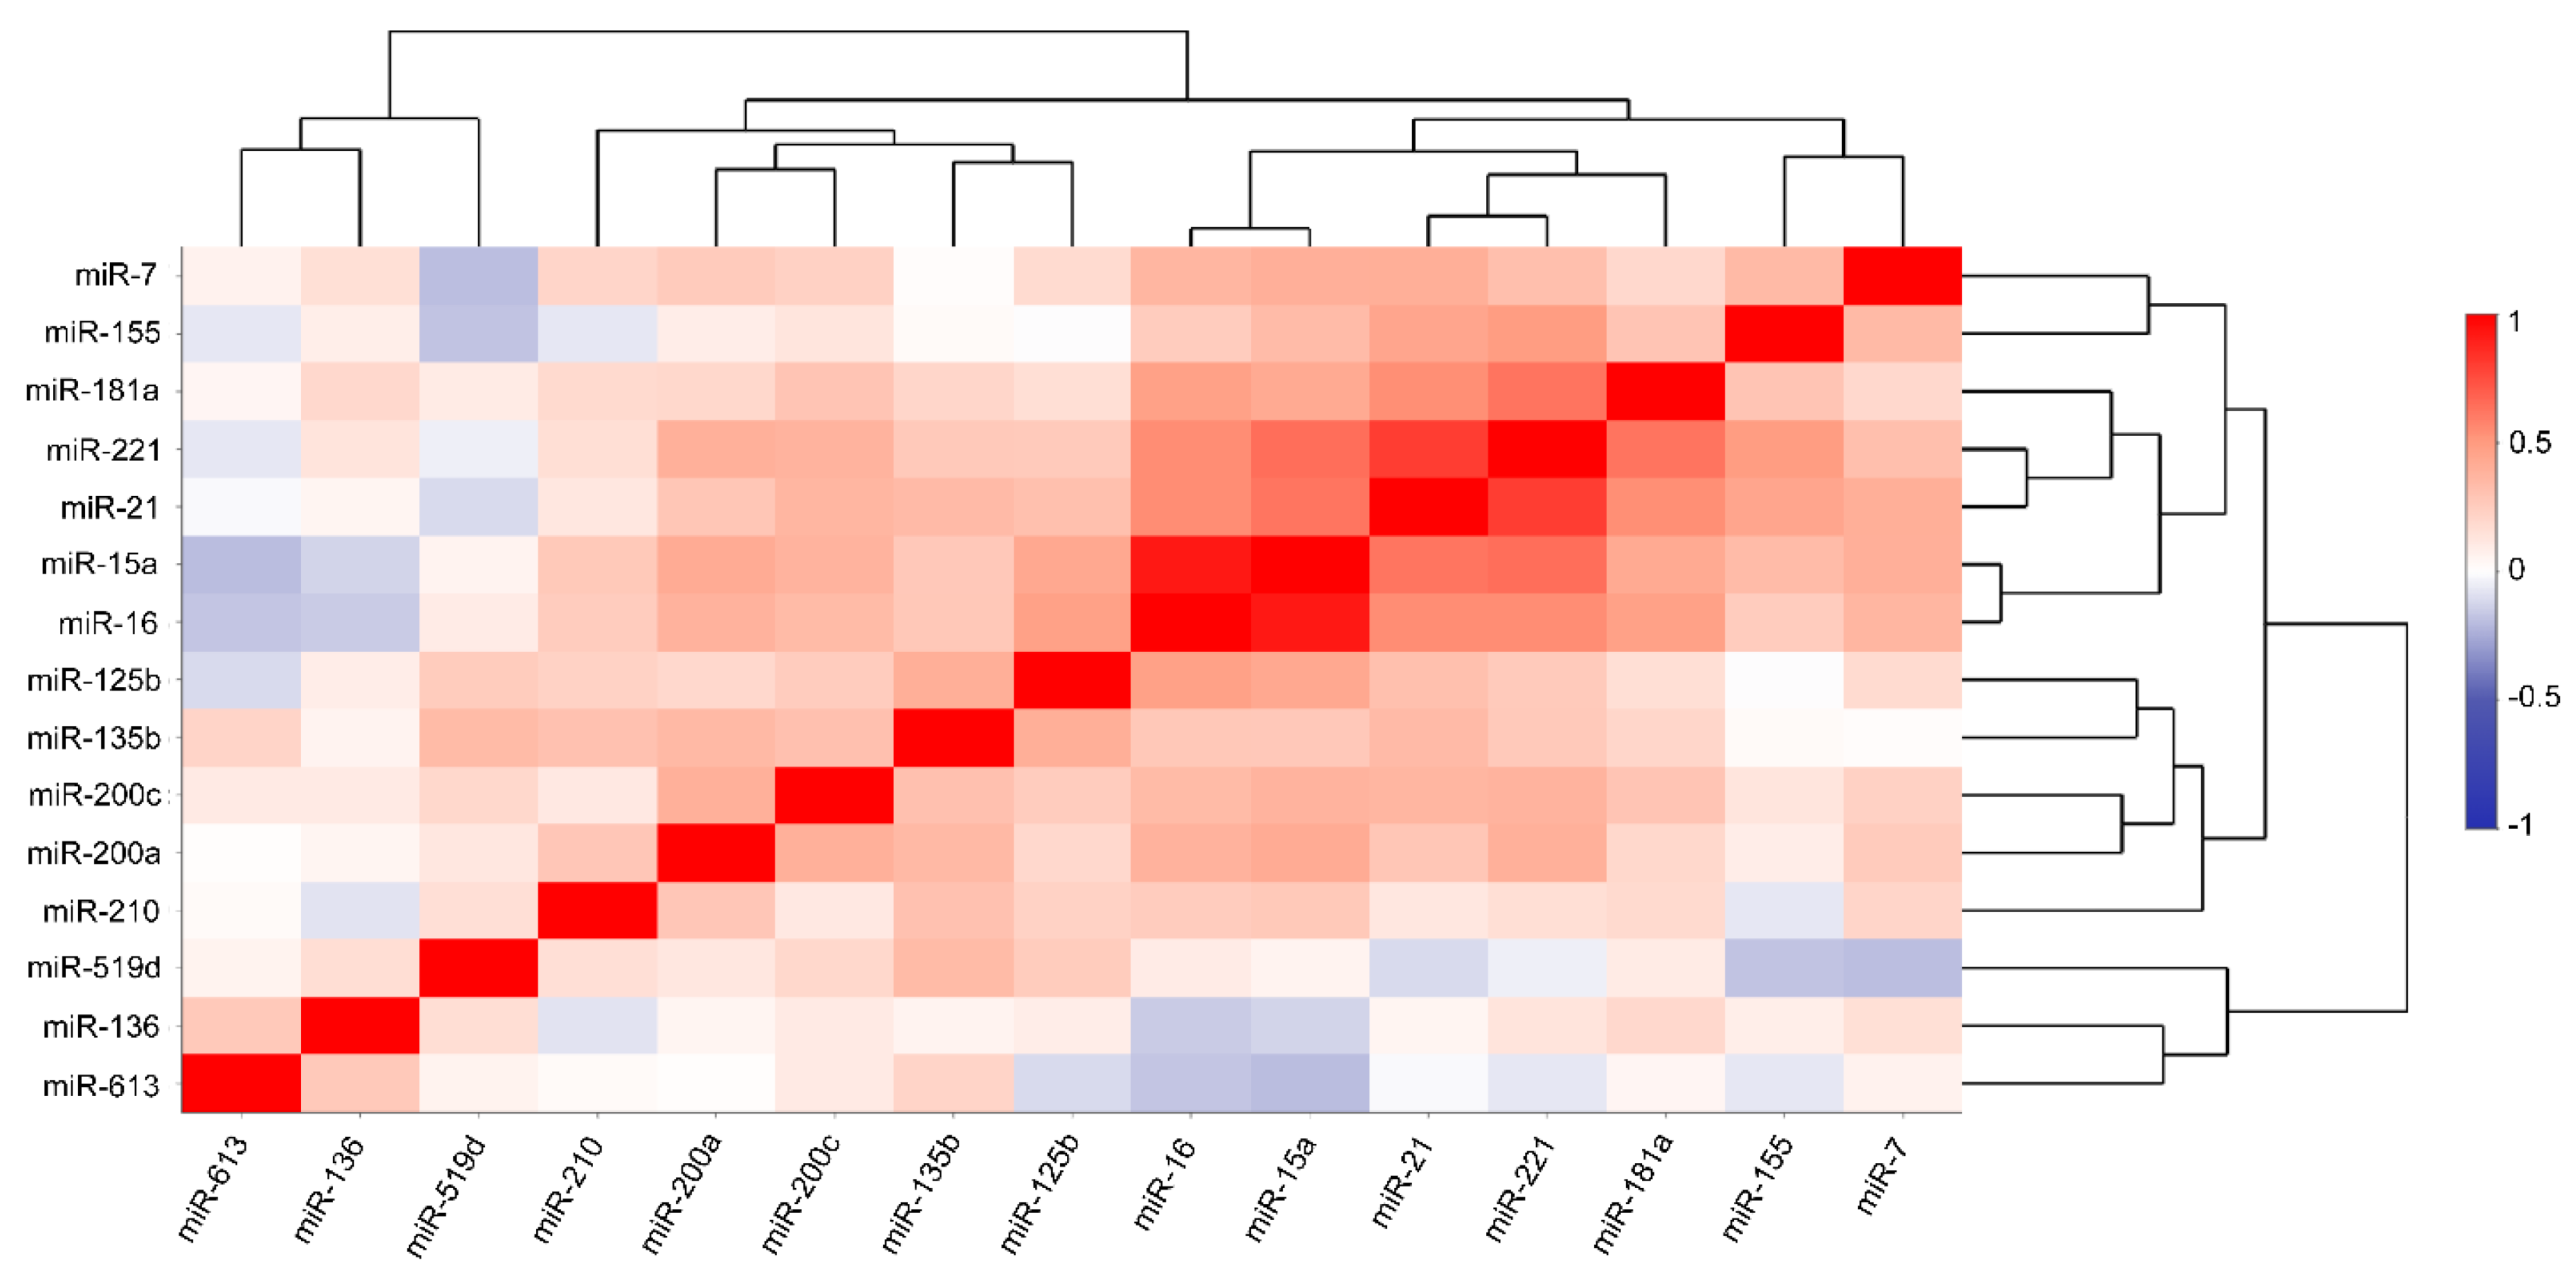
3.3. Correlation between the Desired miRNAs
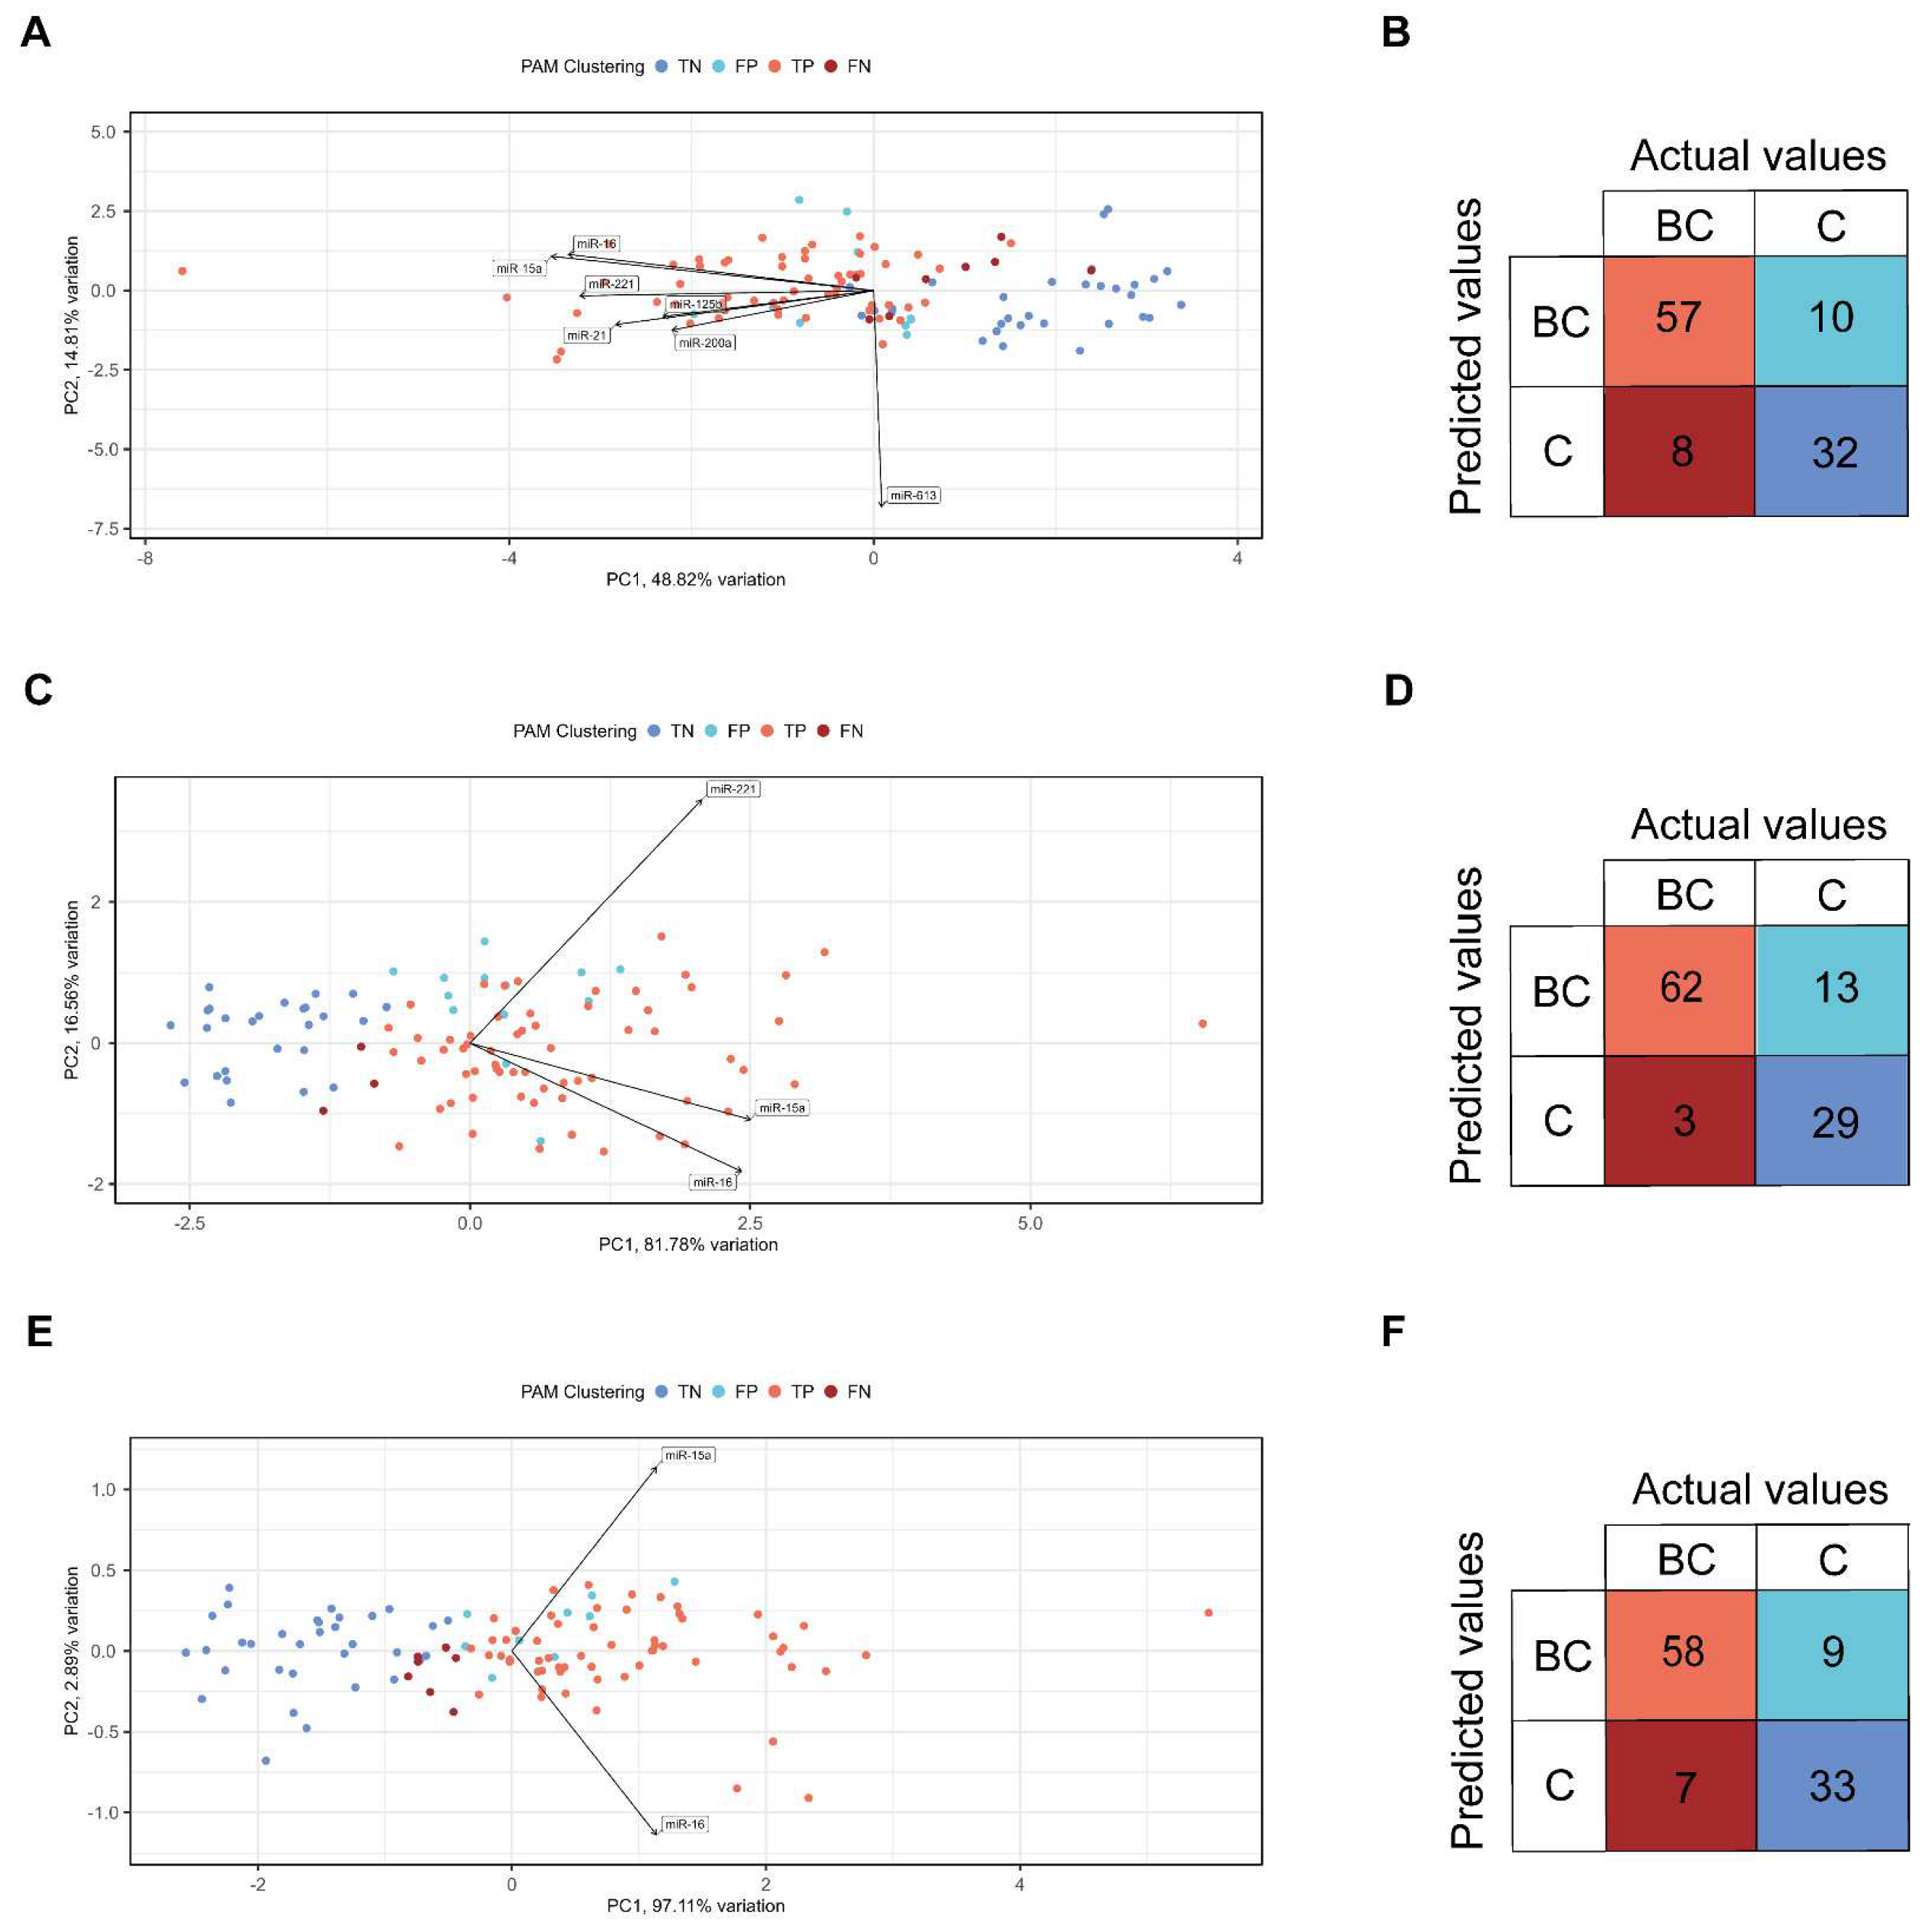
3.4. Expressional Changes and Diagnostic Accuracy of Multiple miRNAs
4. Discussion
Supplementary Materials
Author Contributions
Funding
Institutional Review Board Statement
Informed Consent Statement
Data Availability Statement
Acknowledgments
Conflicts of Interest
References
- Checka, C.M.; Chun, J.E.; Schnabel, F.R.; Lee, J.; Toth, H. The relationship of mammographic density and age: Implications for breast cancer screening. AJR Am. J. Roentgenol. 2012, 198, W292–W295. [Google Scholar] [CrossRef] [PubMed]
- Bartel, D.P. MicroRNAs: Genomics, biogenesis, mechanism, and function. Cell 2004, 116, 281–297. [Google Scholar] [CrossRef]
- Goldhirsch, A.; Wood, W.C.; Coates, A.S.; Gelber, R.D.; Thurlimann, B.; Senn, H.J.; Panel, m. Strategies for subtypes--dealing with the diversity of breast cancer: Highlights of the St. Gallen International Expert Consensus on the Primary Therapy of Early Breast Cancer 2011. Ann. Oncol. 2011, 22, 1736–1747. [Google Scholar] [CrossRef] [PubMed]
- Junqueira-Neto, S.; Batista, I.A.; Costa, J.L.; Melo, S.A. Liquid Biopsy beyond Circulating Tumor Cells and Cell-Free DNA. Acta Cytol. 2019, 63, 479–488. [Google Scholar] [CrossRef] [PubMed]
- Schwarzenbach, H.; Nishida, N.; Calin, G.A.; Pantel, K. Clinical relevance of circulating cell-free microRNAs in cancer. Nat. Rev. Clin. Oncol. 2014, 11, 145–156. [Google Scholar] [CrossRef]
- Priskin, K.; Polya, S.; Pinter, L.; Jaksa, G.; Csanyi, B.; Enyedi, M.Z.; Sagi-Zsigmond, E.; Sukosd, F.; Olah-Nemeth, O.; Kelemen, G.; et al. BC-Monitor: Towards a Routinely Accessible Circulating Tumor DNA-Based Tool for Real-Time Monitoring Breast Cancer Progression and Treatment Effectiveness. Cancers 2021, 13, 3489. [Google Scholar] [CrossRef]
- Cortez, M.A.; Calin, G.A. MicroRNA identification in plasma and serum: A new tool to diagnose and monitor diseases. Expert. Opin. Biol. Ther. 2009, 9, 703–711. [Google Scholar] [CrossRef]
- Hanke, M.; Hoefig, K.; Merz, H.; Feller, A.C.; Kausch, I.; Jocham, D.; Warnecke, J.M.; Sczakiel, G. A robust methodology to study urine microRNA as tumor marker: MicroRNA-126 and microRNA-182 are related to urinary bladder cancer. Urol. Oncol 2010, 28, 655–661. [Google Scholar] [CrossRef]
- Zubakov, D.; Boersma, A.W.M.; Choi, Y.; van Kuijk, P.F.; Wiemer, E.A.C.; Kayser, M. MicroRNA markers for forensic body fluid identification obtained from microarray screening and quantitative RT-PCR confirmation. Int. J. Legal. Med. 2010, 124, 217–226. [Google Scholar] [CrossRef]
- Park, N.J.; Zhou, H.; Elashoff, D.; Henson, B.S.; Kastratovic, D.A.; Abemayor, E.; Wong, D.T. Salivary microRNA: Discovery, Characterization, and Clinical Utility for Oral Cancer Detection. Clin. Cancer Res. 2009, 15, 5473–5477. [Google Scholar] [CrossRef] [Green Version]
- Mitchell, P.S.; Parkin, R.K.; Kroh, E.M.; Fritz, B.R.; Wyman, S.K.; Pogosova-Agadjanyan, E.L.; Peterson, A.; Noteboom, J.; O’Briant, K.C.; Allen, A.; et al. Circulating microRNAs as stable blood-based markers for cancer detection. Proc. Natl. Acad. Sci. USA 2008, 105, 10513–10518. [Google Scholar] [CrossRef] [PubMed]
- Turchinovich, A.; Weiz, L.; Burwinkel, B. Extracellular miRNAs: The mystery of their origin and function. Trends Biochem. Sci. 2012, 37, 460–465. [Google Scholar] [CrossRef] [PubMed]
- Griffiths-Jones, S.; Grocock, R.J.; van Dongen, S.; Bateman, A.; Enright, A.J. miRBase: MicroRNA sequences, targets and gene nomenclature. Nucleic Acids Res. 2006, 34, D140–D144. [Google Scholar] [CrossRef] [PubMed]
- Calin, G.A.; Dumitru, C.D.; Shimizu, M.; Bichi, R.; Zupo, S.; Noch, E.; Aldler, H.; Rattan, S.; Keating, M.; Rai, K.; et al. Frequent deletions and down-regulation of micro-RNA genes miR15 and miR16 at 13q14 in chronic lymphocytic leukemia. Proc. Natl. Acad. Sci. USA 2002, 99, 15524–15529. [Google Scholar] [CrossRef] [PubMed]
- Mehrgou, A.; Akouchekian, M. Therapeutic impacts of microRNAs in breast cancer by their roles in regulating processes involved in this disease. J. Res. Med. Sci 2017, 22, 130. [Google Scholar] [PubMed]
- Svoronos, A.A.; Engelman, D.M.; Slack, F.J. OncomiR or Tumor Suppressor? The Duplicity of MicroRNAs in Cancer. Cancer Res. 2016, 76, 3666–3670. [Google Scholar] [CrossRef]
- Yang, C.; Tabatabaei, S.N.; Ruan, X.; Hardy, P. The Dual Regulatory Role of MiR-181a in Breast Cancer. Cell Physiol. Biochem. 2017, 44, 843–856. [Google Scholar] [CrossRef]
- Gasparini, P.; Lovat, F.; Fassan, M.; Casadei, L.; Cascione, L.; Jacob, N.K.; Carasi, S.; Palmieri, D.; Costinean, S.; Shapiro, C.L.; et al. Protective role of miR-155 in breast cancer through RAD51 targeting impairs homologous recombination after irradiation. Proc. Natl. Acad. Sci. USA 2014, 111, 4536–4541. [Google Scholar] [CrossRef]
- Bisso, A.; Faleschini, M.; Zampa, F.; Capaci, V.; De Santa, J.; Santarpia, L.; Piazza, S.; Cappelletti, V.; Daidone, M.; Agami, R.; et al. Oncogenic miR-181a/b affect the DNA damage response in aggressive breast cancer. Cell Cycle 2013, 12, 1679–1687. [Google Scholar] [CrossRef]
- Luo, H.; Liang, H.; Chen, Y.; Chen, S.; Xu, Y.; Xu, L.; Liu, J.; Zhou, K.; Peng, J.; Guo, G.; et al. miR-7-5p overexpression suppresses cell proliferation and promotes apoptosis through inhibiting the ability of DNA damage repair of PARP-1 and BRCA1 in TK6 cells exposed to hydroquinone. Chem. Biol. Interact. 2018, 283, 84–90. [Google Scholar] [CrossRef]
- Patel, N.; Garikapati, K.R.; Pandita, R.K.; Singh, D.K.; Pandita, T.K.; Bhadra, U.; Bhadra, M.P. miR-15a/miR-16 down-regulates BMI1, impacting Ub-H2A mediated DNA repair and breast cancer cell sensitivity to doxorubicin. Sci. Rep. 2017, 7, 4263. [Google Scholar] [CrossRef] [PubMed]
- Reddy, S.D.; Ohshiro, K.; Rayala, S.K.; Kumar, R. MicroRNA-7, a homeobox D10 target, inhibits p21-activated kinase 1 and regulates its functions. Cancer Res. 2008, 68, 8195–8200. [Google Scholar] [CrossRef] [PubMed]
- Lee, K.M.; Choi, E.J.; Kim, I.A. microRNA-7 increases radiosensitivity of human cancer cells with activated EGFR-associated signaling. Radiother. Oncol. 2011, 101, 171–176. [Google Scholar] [CrossRef]
- Zhu, S.; Wu, H.; Wu, F.; Nie, D.; Sheng, S.; Mo, Y.Y. MicroRNA-21 targets tumor suppressor genes in invasion and metastasis. Cell Res. 2008, 18, 350–359. [Google Scholar] [CrossRef]
- Yang, L.; Zhao, W.; Wei, P.; Zuo, W.; Zhu, S. Tumor suppressor p53 induces miR-15a processing to inhibit neuronal apoptosis inhibitory protein (NAIP) in the apoptotic response DNA damage in breast cancer cell. Am. J. Transl. Res. 2017, 9, 683–691. [Google Scholar]
- Hua, K.; Jin, J.; Zhao, J.; Song, J.; Song, H.; Li, D.; Maskey, N.; Zhao, B.; Wu, C.; Xu, H.; et al. miR-135b, upregulated in breast cancer, promotes cell growth and disrupts the cell cycle by regulating LATS2. Int. J. Oncol. 2016, 48, 1997–2006. [Google Scholar] [CrossRef] [PubMed]
- Rivas, M.A.; Venturutti, L.; Huang, Y.W.; Schillaci, R.; Huang, T.H.; Elizalde, P.V. Downregulation of the tumor-suppressor miR-16 via progestin-mediated oncogenic signaling contributes to breast cancer development. Breast Cancer Res. 2012, 14, R77. [Google Scholar] [CrossRef] [PubMed]
- Li, X.; Xu, Y.; Ding, Y.; Li, C.; Zhao, H.; Wang, J.; Meng, S. Posttranscriptional upregulation of HER3 by HER2 mRNA induces trastuzumab resistance in breast cancer. Mol. Cancer 2018, 17, 113. [Google Scholar] [CrossRef]
- Scott, G.K.; Goga, A.; Bhaumik, D.; Berger, C.E.; Sullivan, C.S.; Benz, C.C. Coordinate suppression of ERBB2 and ERBB3 by enforced expression of micro-RNA miR-125a or miR-125b. J. Biol. Chem. 2007, 282, 1479–1486. [Google Scholar] [CrossRef]
- Yan, M.; Li, X.; Tong, D.; Han, C.; Zhao, R.; He, Y.; Jin, X. miR-136 suppresses tumor invasion and metastasis by targeting RASAL2 in triple-negative breast cancer. Oncol. Rep. 2016, 36, 65–71. [Google Scholar] [CrossRef]
- Volinia, S.; Galasso, M.; Sana, M.E.; Wise, T.F.; Palatini, J.; Huebner, K.; Croce, C.M. Breast cancer signatures for invasiveness and prognosis defined by deep sequencing of microRNA. Proc. Natl. Acad. Sci. USA 2012, 109, 3024–3029. [Google Scholar] [CrossRef] [PubMed] [Green Version]
- Jiang, W.G.; Davies, G.; Martin, T.A.; Parr, C.; Watkins, G.; Mason, M.D.; Mansel, R.E. Expression of membrane type-1 matrix metalloproteinase, MT1-MMP in human breast cancer and its impact on invasiveness of breast cancer cells. Int. J. Mol. Med. 2006, 17, 583–590. [Google Scholar] [CrossRef] [PubMed]
- Stinson, S.; Lackner, M.R.; Adai, A.T.; Yu, N.; Kim, H.J.; O’Brien, C.; Spoerke, J.; Jhunjhunwala, S.; Boyd, Z.; Januario, T.; et al. TRPS1 targeting by miR-221/222 promotes the epithelial-to-mesenchymal transition in breast cancer. Sci. Signal. 2011, 4, ra41. [Google Scholar] [CrossRef] [PubMed]
- Gregory, P.A.; Bert, A.G.; Paterson, E.L.; Barry, S.C.; Tsykin, A.; Farshid, G.; Vadas, M.A.; Khew-Goodall, Y.; Goodall, G.J. The miR-200 family and miR-205 regulate epithelial to mesenchymal transition by targeting ZEB1 and SIP1. Nat. Cell Biol. 2008, 10, 593–601. [Google Scholar] [CrossRef]
- Chu, C.; Liu, X.; Bai, X.; Zhao, T.; Wang, M.; Xu, R.; Li, M.; Hu, Y.; Li, W.; Yang, L.; et al. MiR-519d suppresses breast cancer tumorigenesis and metastasis via targeting MMP3. Int. J. Biol. Sci. 2018, 14, 228–236. [Google Scholar] [CrossRef] [PubMed]
- Xiong, H.; Yan, T.; Zhang, W.; Shi, F.; Jiang, X.; Wang, X.; Li, S.; Chen, Y.; Chen, C.; Zhu, Y. miR-613 inhibits cell migration and invasion by downregulating Daam1 in triple-negative breast cancer. Cell Signal. 2018, 44, 33–42. [Google Scholar] [CrossRef]
- Ordog, N.; Borsos, B.N.; Majoros, H.; Ujfaludi, Z.; Pankotai-Bodo, G.; Banko, S.; Sukosd, F.; Kuthi, L.; Pankotai, T. The clinical significance of epigenetic and RNAPII variabilities occurring in clear cell renal cell carcinoma as a potential prognostic marker. Transl. Oncol. 2022, 20, 101420. [Google Scholar] [CrossRef]
- Kirschner, M.B.; Kao, S.C.; Edelman, J.J.; Armstrong, N.J.; Vallely, M.P.; van Zandwijk, N.; Reid, G. Haemolysis during Sample Preparation Alters microRNA Content of Plasma. PLoS ONE 2011, 6, e24145. [Google Scholar] [CrossRef]
- Busk, P.K. A tool for design of primers for microRNA-specific quantitative RT-qPCR. Bmc Bioinformatics 2014, 15, 29. [Google Scholar] [CrossRef]
- The R Development Core Team. R: A Language and Environment for Statistical Computing; R Core Team: Vienna, Austria, 2021. [Google Scholar]
- Galili, T.; O’Callaghan, A.; Sidi, J.; Sievert, C. heatmaply: An R package for creating interactive cluster heatmaps for online publishing. Bioinformatics 2018, 34, 1600–1602. [Google Scholar] [CrossRef]
- Blighe, K.; Brown, A.-L.; Carey, V.; Hooiveld, G.; Lun, A. PCAtools: Everything Principal Components Analysis. 2022. Available online: https://bioconductor.org/packages/PCAtools/ (accessed on 7 July 2022).
- Kassambara, A.; Mundt, F. Factoextra: Extract and Visualize the Results of Multivariate Data Analyses. 2020. Available online: https://cloud.r-project.org/package=factoextra (accessed on 7 July 2022).
- Kuhn, M. Caret: Classification and Regression Training. 2022. Available online: https://mirrors.pku.edu.cn/cran/web/packages/caret/caret.pdf (accessed on 7 July 2022).
- Kern, F.; Fehlmann, T.; Solomon, J.; Schwed, L.; Grammes, N.; Backes, C.; Van Keuren-Jensen, K.; Craig, D.W.; Meese, E.; Keller, A. miEAA 2.0: Integrating multi-species microRNA enrichment analysis and workflow management systems. Nucleic Acids Res. 2020, 48, W521–W528. [Google Scholar] [CrossRef] [PubMed]
- Zhu, J.; Zheng, Z.B.; Wang, J.; Sun, J.H.; Wang, P.; Cheng, X.Y.; Fu, L.; Zhang, L.M.; Wang, Z.J.; Li, Z.Y. Different miRNA expression profiles between human breast cancer tumors and serum. Front. Genet 2014, 5, 149. [Google Scholar] [CrossRef]
- Carney, P.A.; Miglioretti, D.L.; Yankaskas, B.C.; Kerlikowske, K.; Rosenberg, R.; Rutter, C.M. Individual and combined effects of age, breast density, and hormone replacement therapy use on the accuracy of screening mammography. Ann. Intern. Med. 2003, 138, 771. [Google Scholar] [CrossRef] [PubMed]
- Yaffe, M.J.; Mainprize, J.G. Digital Tomosynthesis: Technique. Radiol. Clin. N. Am. 2014, 52, 489–497. [Google Scholar] [CrossRef]
- Kuhl, C.K.; Strobel, K.; Bieling, H.; Leutner, C.; Schild, H.H.; Schrading, S. Supplemental Breast MR Imaging Screening of Women with Average Risk of Breast Cancer. Radiology 2017, 283, 361–370. [Google Scholar] [CrossRef]
- Bahrami, A.; Aledavood, A.; Anvari, K.; Hassanian, S.M.; Maftouh, M.; Yaghobzade, A.; Salarzaee, O.; ShahidSales, S.; Avan, A. The prognostic and therapeutic application of microRNAs in breast cancer: Tissue and circulating microRNAs. J. Cell Physiol. 2018, 233, 774–786. [Google Scholar] [CrossRef]
- Zangouei, A.S.; Alimardani, M.; Moghbeli, M. MicroRNAs as the critical regulators of Doxorubicin resistance in breast tumor cells. Cancer Cell Int. 2021, 21, 213. [Google Scholar] [CrossRef] [PubMed]
- Braga, T.V.; Evangelista, F.C.G.; Gomes, L.C.; Araujo, S.S.D.; Carvalho, M.D.; Sabino, A.D. Evaluation of MiR-15a and MiR-16-1 as prognostic biomarkers in chronic lymphocytic leukemia. Biomed. Pharmacother. 2017, 92, 864–869. [Google Scholar] [CrossRef] [PubMed]
- Huang, S.; Zhou, D.; Li, Y.X.; Ming, Z.Y.; Li, K.Z.; Wu, G.B.; Chen, C.; Zhao, Y.N. In vivo and in vitro effects of microRNA-221 on hepatocellular carcinoma development and progression through the JAK-STAT3 signaling pathway by targeting SOCS3. J. Cell. Physiol. 2022, 237, 2000, Retraction in J. Cell. Physiol. 2019, 234, 3500–3514. [Google Scholar] [CrossRef] [PubMed]
- Sarkar, S.; Dubaybo, H.; Ali, S.; Goncalves, P.; Kollepara, S.L.; Sethi, S.; Philip, P.A.; Li, Y.W. Down-regulation of miR-221 inhibits proliferation of pancreatic cancer cells through up-regulation of PTEN, p27(kip1), p57(kip2), and PUMA. Am. J. Cancer Res. 2013, 3, 465–477. [Google Scholar]
- Zhou, X.; Wen, W.; Shan, X.; Zhu, W.; Xu, J.; Guo, R.H.; Cheng, W.F.; Wang, F.; Qi, L.W.; Chen, Y.; et al. A six-microRNA panel in plasma was identified as a potential biomarker for lung adenocarcinoma diagnosis. Oncotarget 2017, 8, 6513–6525. [Google Scholar] [CrossRef] [PubMed] [Green Version]


| Potential Biomarker Candidates in Breast Cancer Management | |||||
|---|---|---|---|---|---|
| Tumor Suppressor miRNAs | OncomiRs | ||||
| miRNAs | Particular Role(s) in BC | Ref(s) | miRNAs | Particular Role(s) in BC | Ref(s) |
| miR-7 | Suppression of mobility and invasiveness. Regulation of DNA repair. | [22,23] | miR-21 | Promoting cell invasion. | [24] |
| miR-15a | P53-mediated expression. Involved in DNA repair. | [21,25] | miR-135b | Cell growth stimulation and cell cycle disruption. | [26] |
| miR-16 | Cell cycle arrest and regulation of DNA repair. | [21,27] | miR-155 | Promoting cell migration and invasiveness. Regulation of DNA repair. | [18] |
| miR-125b | Prevention of HER-2 overexpression. Suppression of cell proliferation. | [28,29] | miR-181a | Suppression of DNA damage response. | [19] |
| miR-136 | Suppression of cell migration and invasion. | [30] | miR-210 | Increasing cell invasiveness and DNA repair regulation. | [31] |
| miR-181a | Prevention of cancer metastasis. | [32] | miR-221 | Promoting cell migration and invasion. | [33] |
| miR-200a | EMT inhibition. | [34] | |||
| miR-200c | EMT inhibition. | [34] | |||
| miR-519d | Suppression of cancer metastasis by targeting MMP-3. | [35] | |||
| miR-613 | Suppression of cell migration and invasion by targeting Daam1. | [36] | |||
| AUC | Cut-Off Value | Sensitivity | Specificity | St. Error a | Asymptotic Sign. b | Asymptotic 95% CI | ||
|---|---|---|---|---|---|---|---|---|
| Lower Bound | Upper Bound | |||||||
| miR-16 | 0.934 | 4.270 | 95.40% | 81.00% | 0.025 | 0.000 | 0.885 | 0.982 |
| miR-15a | 0.899 | 3.055 | 87.70% | 83.30% | 0.033 | 0.000 | 0.833 | 0.965 |
| miR-125b | 0.806 | −0.670 | 72.70% | 80.60% | 0.046 | 0.000 | 0.717 | 0.896 |
| miR-200a | 0.794 | −9.405 | 84.60% | 63.20% | 0.047 | 0.000 | 0.702 | 0.887 |
| miR-613 | 0.727 | −1.49 | 60.50% | 81.50% | 0.050 | 0.000 | 0.629 | 0.825 |
| miR-136 | 0.699 | −2.665 | 88.10% | 49.20% | 0.052 | 0.001 | 0.597 | 0.800 |
| miR-200c | 0.693 | −9.94 | 92.30% | 42.90% | 0.053 | 0.001 | 0.589 | 0.796 |
| miR-221 | 0.684 | 1.210 | 75.40% | 61.00% | 0.055 | 0.001 | 0.576 | 0.792 |
| miR-135b | 0.682 | −9.940 | 90.80% | 40.50% | 0.053 | 0.001 | 0.578 | 0.787 |
| miR-21 | 0.655 | 1.240 | 88.90% | 35.70% | 0.054 | 0.007 | 0.548 | 0.761 |
| miR-7 | 0.64 | −9.590 | 87.00% | 50.00% | 0.063 | 0.021 | 0.517 | 0.762 |
| miR-519d | 0.619 | 9.190 | 41.15% | 88.10% | 0.054 | 0.039 | 0.512 | 0.725 |
| miR-210 | 0.614 | −9.970 | 94.90% | 35.00% | 0.060 | 0.055 | 0.496 | 0.732 |
| miR-181a | 0.602 | −0.855 | 81.70% | 48.80% | 0.060 | 0.083 | 0.485 | 0.719 |
| miR-155 | 0.591 | −9.580 | 88.70% | 38.50% | 0.061 | 0.127 | 0.471 | 0.710 |
| AUC | Cut-Off Value | Sensitivity | Specificity | St. Error a | Asymptotic Sign. b | Asymptotic 95% CI | ||
|---|---|---|---|---|---|---|---|---|
| Lower Bound | Upper Bound | |||||||
| miR-15a+miR-16 | 0.884 | 3.305 | 92.20% | 72.60% | 0.024 | 0.000 | 0.838 | 0.930 |
| miR-16+miR-15a+miR-221 | 0.779 | 2.323 | 71.80% | 76.20% | 0.025 | 0.000 | 0.729 | 0.829 |
| miR-16+miR-15a+miR-21+miR-221 | 0.750 | 3.355 | 62.20% | 78.60% | 0.023 | 0.000 | 0.704 | 0.795 |
| miR-135b+miR-200a+miR-200c | 0.733 | −9.975 | 92.80% | 46.80% | 0.029 | 0.000 | 0.677 | 0.79 |
| miR-15a+miR-16+miR-200a | 0.707 | 3.305 | 61.50% | 81.70% | 0.029 | 0.000 | 0.651 | 0.763 |
| miR-15a+miR-16+miR-21+miR-125b | 0.703 | 3.265 | 56.50% | 81.40% | 0.025 | 0.000 | 0.654 | 0.751 |
| miR-21+miR-221 | 0.670 | 1.220 | 82.20% | 48.80% | 0.038 | 0.000 | 0.595 | 0.745 |
| miR-21+miR-181a+miR-221 | 0.635 | 1.220 | 63.20% | 58.70% | 0.032 | 0.000 | 0.572 | 0.698 |
Publisher’s Note: MDPI stays neutral with regard to jurisdictional claims in published maps and institutional affiliations. |
© 2022 by the authors. Licensee MDPI, Basel, Switzerland. This article is an open access article distributed under the terms and conditions of the Creative Commons Attribution (CC BY) license (https://creativecommons.org/licenses/by/4.0/).
Share and Cite
Borsos, B.N.; Páhi, Z.G.; Ujfaludi, Z.; Sükösd, F.; Nikolényi, A.; Bankó, S.; Pankotai-Bodó, G.; Oláh-Németh, O.; Pankotai, T. BC-miR: Monitoring Breast Cancer-Related miRNA Profile in Blood Sera—A Prosperous Approach for Tumor Detection. Cells 2022, 11, 2721. https://doi.org/10.3390/cells11172721
Borsos BN, Páhi ZG, Ujfaludi Z, Sükösd F, Nikolényi A, Bankó S, Pankotai-Bodó G, Oláh-Németh O, Pankotai T. BC-miR: Monitoring Breast Cancer-Related miRNA Profile in Blood Sera—A Prosperous Approach for Tumor Detection. Cells. 2022; 11(17):2721. https://doi.org/10.3390/cells11172721
Chicago/Turabian StyleBorsos, Barbara N., Zoltán G. Páhi, Zsuzsanna Ujfaludi, Farkas Sükösd, Alíz Nikolényi, Sarolta Bankó, Gabriella Pankotai-Bodó, Orsolya Oláh-Németh, and Tibor Pankotai. 2022. "BC-miR: Monitoring Breast Cancer-Related miRNA Profile in Blood Sera—A Prosperous Approach for Tumor Detection" Cells 11, no. 17: 2721. https://doi.org/10.3390/cells11172721