Article

Integrated Multi-Omics Signature Predicts Survival in Head and Neck Cancer

by
Ilda Patrícia Ribeiro
1,2,3,4,†,
Luísa Esteves
1,†,
Francisco Caramelo
2,3,5,
Isabel Marques Carreira
1,2,3,4 and
Joana Barbosa Melo
1,2,3,4,*
1
Cytogenetics and Genomics Laboratory, Institute of Cellular and Molecular Biology, Faculty of Medicine, University of Coimbra, 3000-548 Coimbra, Portugal
2
Coimbra Institute for Clinical and Biomedical Research (iCBR), Center of Investigation on Environment Genetics and Oncobiology (CIMAGO), Faculty of Medicine, University of Coimbra, 3000-548 Coimbra, Portugal
3
Center for Innovative Biomedicine and Biotechnology (CIBB), University of Coimbra, 3004-531 Coimbra, Portugal
4
Clinical Academic Center of Coimbra (CACC), 3000-370 Coimbra, Portugal
5
Laboratory of Biostatistics and Medical Informatics, iCBR-Faculty of Medicine, University of Coimbra, 3000-548 Coimbra, Portugal
*
Author to whom correspondence should be addressed.
These authors contributed equally to this work.
Cells 2022, 11(16), 2536; https://doi.org/10.3390/cells11162536
Submission received: 19 July 2022 / Revised: 4 August 2022 / Accepted: 15 August 2022 / Published: 16 August 2022
(This article belongs to the Special Issue Early Biomarkers of Cancer: Diagnosis and Progression)

Abstract

:
Head and Neck Cancer (HNC) is characterized by phenotypic, biological, and clinical heterogeneity. Despite treatment modalities, approximately half of all patients will die of the disease. Several molecular biomarkers have been investigated, but until now, without clinical translation. Here, we identified an integrative nine-gene multi-omics signature correlated with HNC patients’ survival independently of relapses or metastasis development. This prognosis multi-omic signature comprises genes mapped in the chromosomes 1q, 3p, 8q, 17q, 19p, and 19q and encompasses alterations at copy number, gene expression, and methylation. Copy number alterations in LMCD1-A1S and GRM7, the methylation status of CEACAM19, KRT17, and ST18, and the expression profile of RPL29, UBA7, FCGR2C, and RPSAP58 can predict the HNC patients’ survival. The difference higher than two years observed in the survival of HNC patients that harbor this nine-gene multi-omics signature can represent a significant step forward to improve patients’ management and guide new therapeutic targets development.

1. Introduction

Head and Neck Cancer (HNC) is a heterogeneous group of cancers, where more than 90% are squamous cell carcinomas arising from the epithelial mucosa at the upper aerodigestive tract [1]. Annually, HNC accounts for more than 650,000 new cases and 330,000 deaths worldwide [2]. These tumors, usually diagnosed in older patients with heavy tobacco and alcohol consumption, are facing a slow decrease globally probably due to the reduction in tobacco use [3]. Nevertheless, in developed countries, human papilloma virus (HPV)-positive oropharyngeal cancer has been increasing among younger people [3]. This neoplasm remains a substantial health and economic burden worldwide, given its high incidence and low survival rate, which have not significantly improved despite the new therapeutic strategies, such as the introduction of immune-checkpoint inhibitors and the progress in standard therapy like radiotherapy and the minimally invasive organ-sparing surgical techniques [4]. The prognosis of these patients is generally poor due to the frequent late diagnosis making therapy less effective and prone to recurrence. HNC patients with advanced disease have an average five-year survival rate of less than 50% [5,6]. The development and progression of HNC result from a multistep process of molecular accumulated alterations at different levels that compromise key cellular processes [7], namely, the accumulation of copy number alterations (CNAs), somatic mutations, and changes in methylation that consequently lead to variations in gene expression levels and downstream signaling pathways [8]. The advent of new omics technologies has allowed quantifying the number of specific molecules, such as genes, mRNA, protein, and metabolite levels of a complex and heterogeneous biological system, describing its intricate relationships and connections. In multifactorial pathologies, such as cancer, the analysis and integration of different omics layers are pivotal to deeply understanding the molecular mechanisms underlying the disease, opening new routes for a personalized diagnosis and treatment based on different molecular disease subtypes and patient stratification. Some studies, individually or combined, have decoded the molecular landscape of HNC using different omics strategies, like genomics [6,9,10,11], transcriptomics [12,13], proteomics [14,15], and DNA methylome [16,17,18], providing new insights of HNC pathophysiology and potential diagnostic and prognostic biomarkers. However, presently, little progress has been made in the translation of the molecular data to improve diagnostic and prognostic tools and to develop new therapeutic strategies for HNC patients [1]. The identification and validation of specific, robust, and integrative molecular signatures and prognosis biomarkers with clinical applicability is of utmost importance for HNC fragile patients to improve their survival and quality of life. In this study, we developed an integrative approach to analyze and combine multiple omics data, such as genomic, transcriptomic, and methylome data aiming to identify and validate a multi-omics signature related to the prognosis of HNC patients. By applying several statistical methods and machine learning approaches, we identify an integrative multi-omics signature correlated with HNC prognosis, presenting an association with patients’ survival.

2. Materials and Methods

2.1. Study Sample

The analyzed cohort is comprised of tumor tissue from 410 head and neck squamous cell carcinoma (HNSCC) patients, obtained from The Cancer Genome Atlas (TCGA). Data from copy number alterations, mRNA expression, and gene methylation were retrieved through the Genome Data Commons (GDC) Data Portal. These 410 cases were selected based on the availability of information regarding metastasis or relapse occurrence. The detailed description of the cohort in the study is presented in Table 1.

2.2. Statistical Analysis

2.2.1. Multi-Omics HNSCC Data Reduction

Data from CNAs were available as a set of chromosomic regions, therefore, the genes contained in these regions were determined using the Bioconductor’s Homo.sapiens package [19]. The frequency of alteration was determined for the identified genes, which were then filtered by their percentage of alteration-only those that were altered in at least 30% of patients were kept for further analysis. Considering methylation data, a hard threshold value of 0.3 methylation level was set, and only the genes that were altered in at least 40% of patients remained. Data from mRNA expression were filtered by removing the genes with over 50% null values.
After the initial reduction step, a table (integration table) that reunites the remaining alterations from each type of omics was created. Further stages were done to reduce the amount of data that remained. The correlation between variables was determined by Pearson’s correlation coefficient, and only the variables that were correlated to another with a coefficient larger than 0.8, indicating a strong correlation, were kept in the integration matrix. Variables that have weak correlation do not constitute a construct and are excluded because only robust components are to be kept.

2.2.2. Principal Components Analysis and Survival Analysis

A principal component analysis (PCA) was performed using the selected genes to reduce the number of variables and analyze the possible relationships between them. Afterwards, using the scores obtained for the first ten principal components (PCs), a clustering analysis was performed by a k-means method with a k++ initialization, using the software Orange Data Mining [20]. The two resulting clusters were assessed at the clinical level by performing survival analysis using the Kaplan-Meier method.

2.2.3. Classification Using the First Ten PCs as Predictors for Survival

Aiming to test the hypothesis that the first ten principal components (PCs) contained information that allowed to distinguish between the two clusters found, a classification algorithm based on a Random Forest (RF) method was applied to distinguish the two groups using the scores determined for first ten PCs as features. The performance of the model was evaluated using a Monte-Carlo method with 5000 iterations (9).

2.2.4. Selection of Genes for the Multi-Omics Signature

After establishing that the first ten PCs determined by PCA seemed to contain enough information to distinguish the two groups with different survival, the variable loadings were used to select the most contributing genetic regions. The loadings can be understood as weights of the genetic regions that contribute to the principal components. Therefore, the genetic alterations that contributed exclusively to each one of the first ten PCs were found by firstly selecting the alterations in the genes whose loadings were in the percentile 90 and, secondly, finding the ones that were present exclusively in one of the ten PCs.
For the RF model, the most important genetic alterations were selected using the Gini’s coefficient that was computed with a Variable Importance Plot. The bootstrapping algorithm was run 5000 times, and all variables with importance below 10,000 were filtered out.
A LASSO regression was then performed (1000 times), and the distribution of the number of models in which a particular genetic alteration was observed was employed for the final variable selection.

2.2.5. Evaluation of the Proposed Multi-Omics Signature

The prediction capacity of the multi-omics genetic signature composed of alterations present in nine genes was evaluated by applying two algorithms for statistical classification: A support vector machine (SVM) model and a random forest (RF) model, using the survival groups, identified in the clustering analysis, as the dependent variable. The performance of both models is reported for 5000 iterations (9).
A receiver operating characteristic (ROC) curve analysis was carried out for each of the genetic alterations included in the models to assess its individual separation ability. The Youden’s index was also computed from the ROC curve, aiming to establish the optimum cut-off values. In addition, a binary logistic regression was constructed using the nine-gene signature, which allows quantifying the influence of each gene in the distinction of the two groups. To obtain a reduced model, the genes that had no statistical significance were removed from the model and, in order to determine the hazard ratios (HR) for survival relating to these genes, a Cox regression model was constructed.

2.2.6. Association of the Obtained Clusters with the Metastatic Status of the Patients

Fisher’s exact test was employed to evaluate how the metastatic status of the patients was related to the two clusters. Furthermore, in each of the groups defined by the metastatic status, the survival of each cluster was evaluated through the Kaplan-Meier method.
All analyses were performed using R version 4.03, IBM® SPSS® Statistics version 24, and Orange Data Mining Toolbox. The significance level was established at 0.05.

3. Results

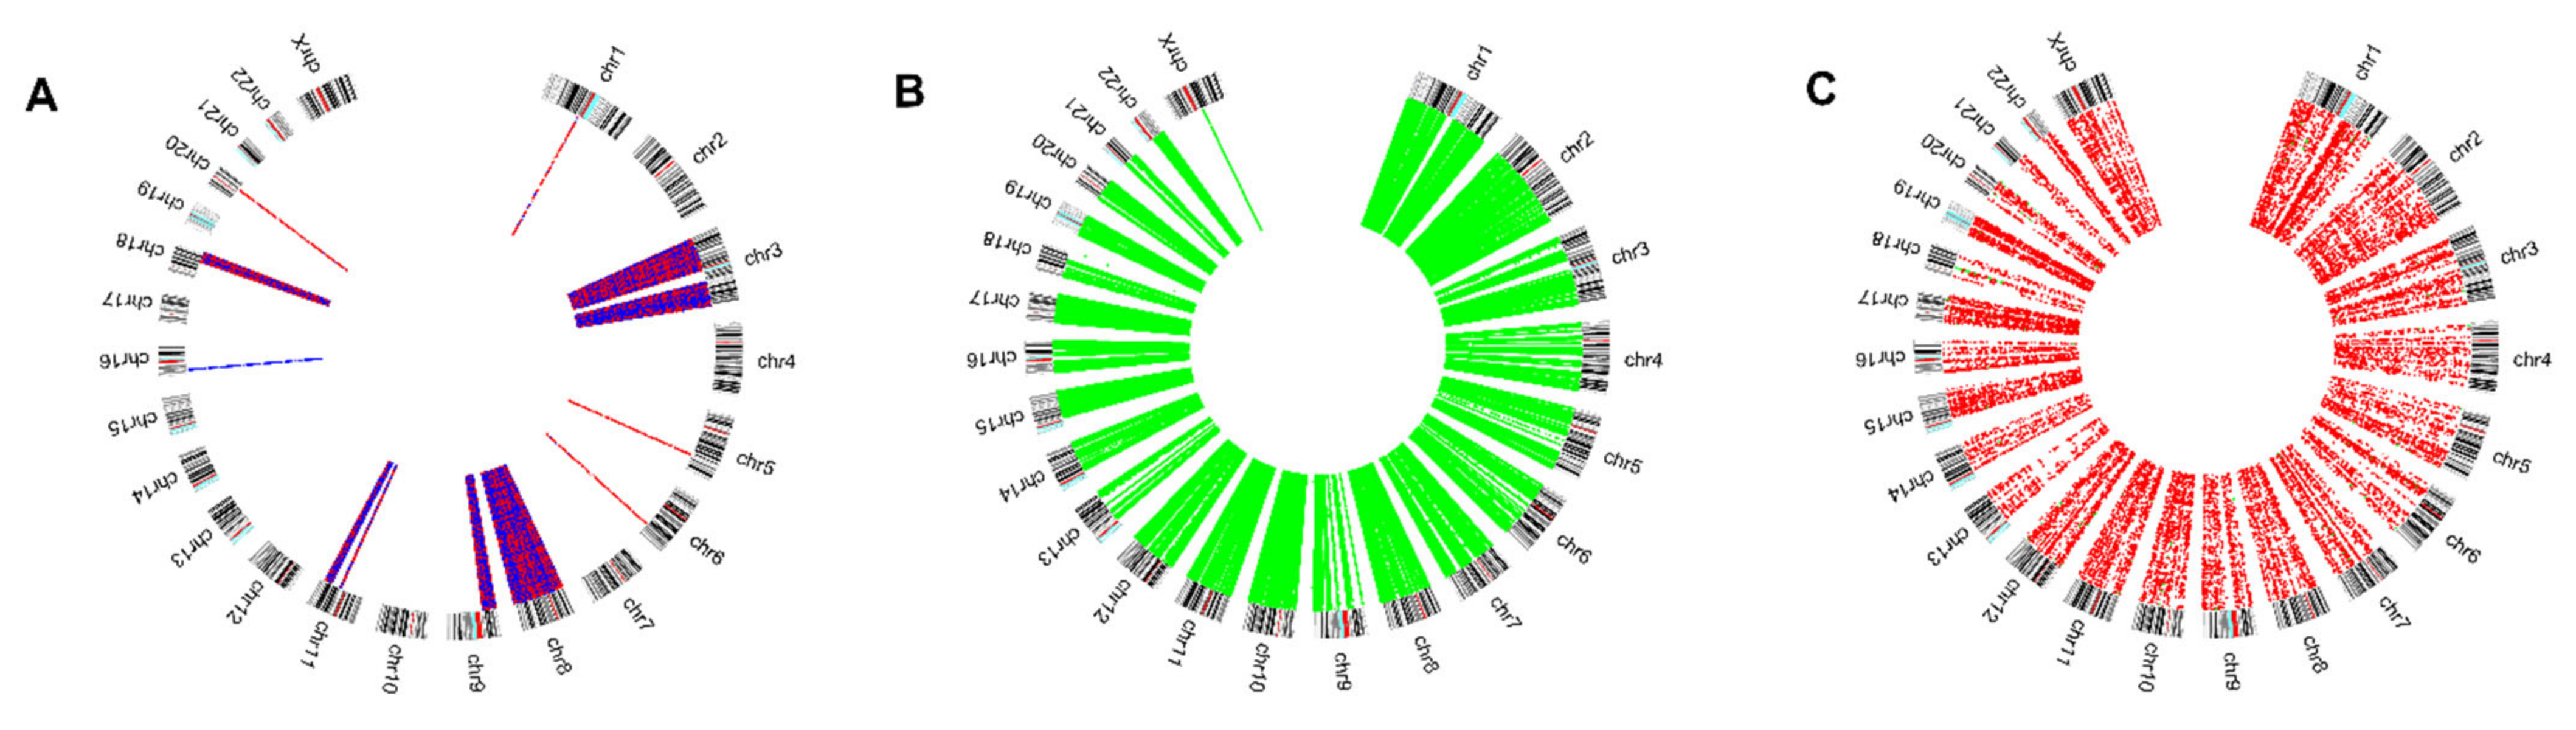
3.1. Multi-Omics HNSCC Data Reduction

Data from CNAs, mRNA expression, and gene methylation were retrieved from TCGA. After the initial data reduction step, 2193 genes were kept from the CNA data, 17,684 from the RNASeq dataset, and 13,043 genes resulted from the methylation data, summing a total of variables in the integration table.
Given the sheer amount of data, further reduction steps were carried out. Firstly, correlation analysis was performed, and only those variables that correlated to another, with a Pearson correlation coefficient larger than 0.8, were considered in further analysis. This resulted in a reduction to 8247 variables (Figure 1).

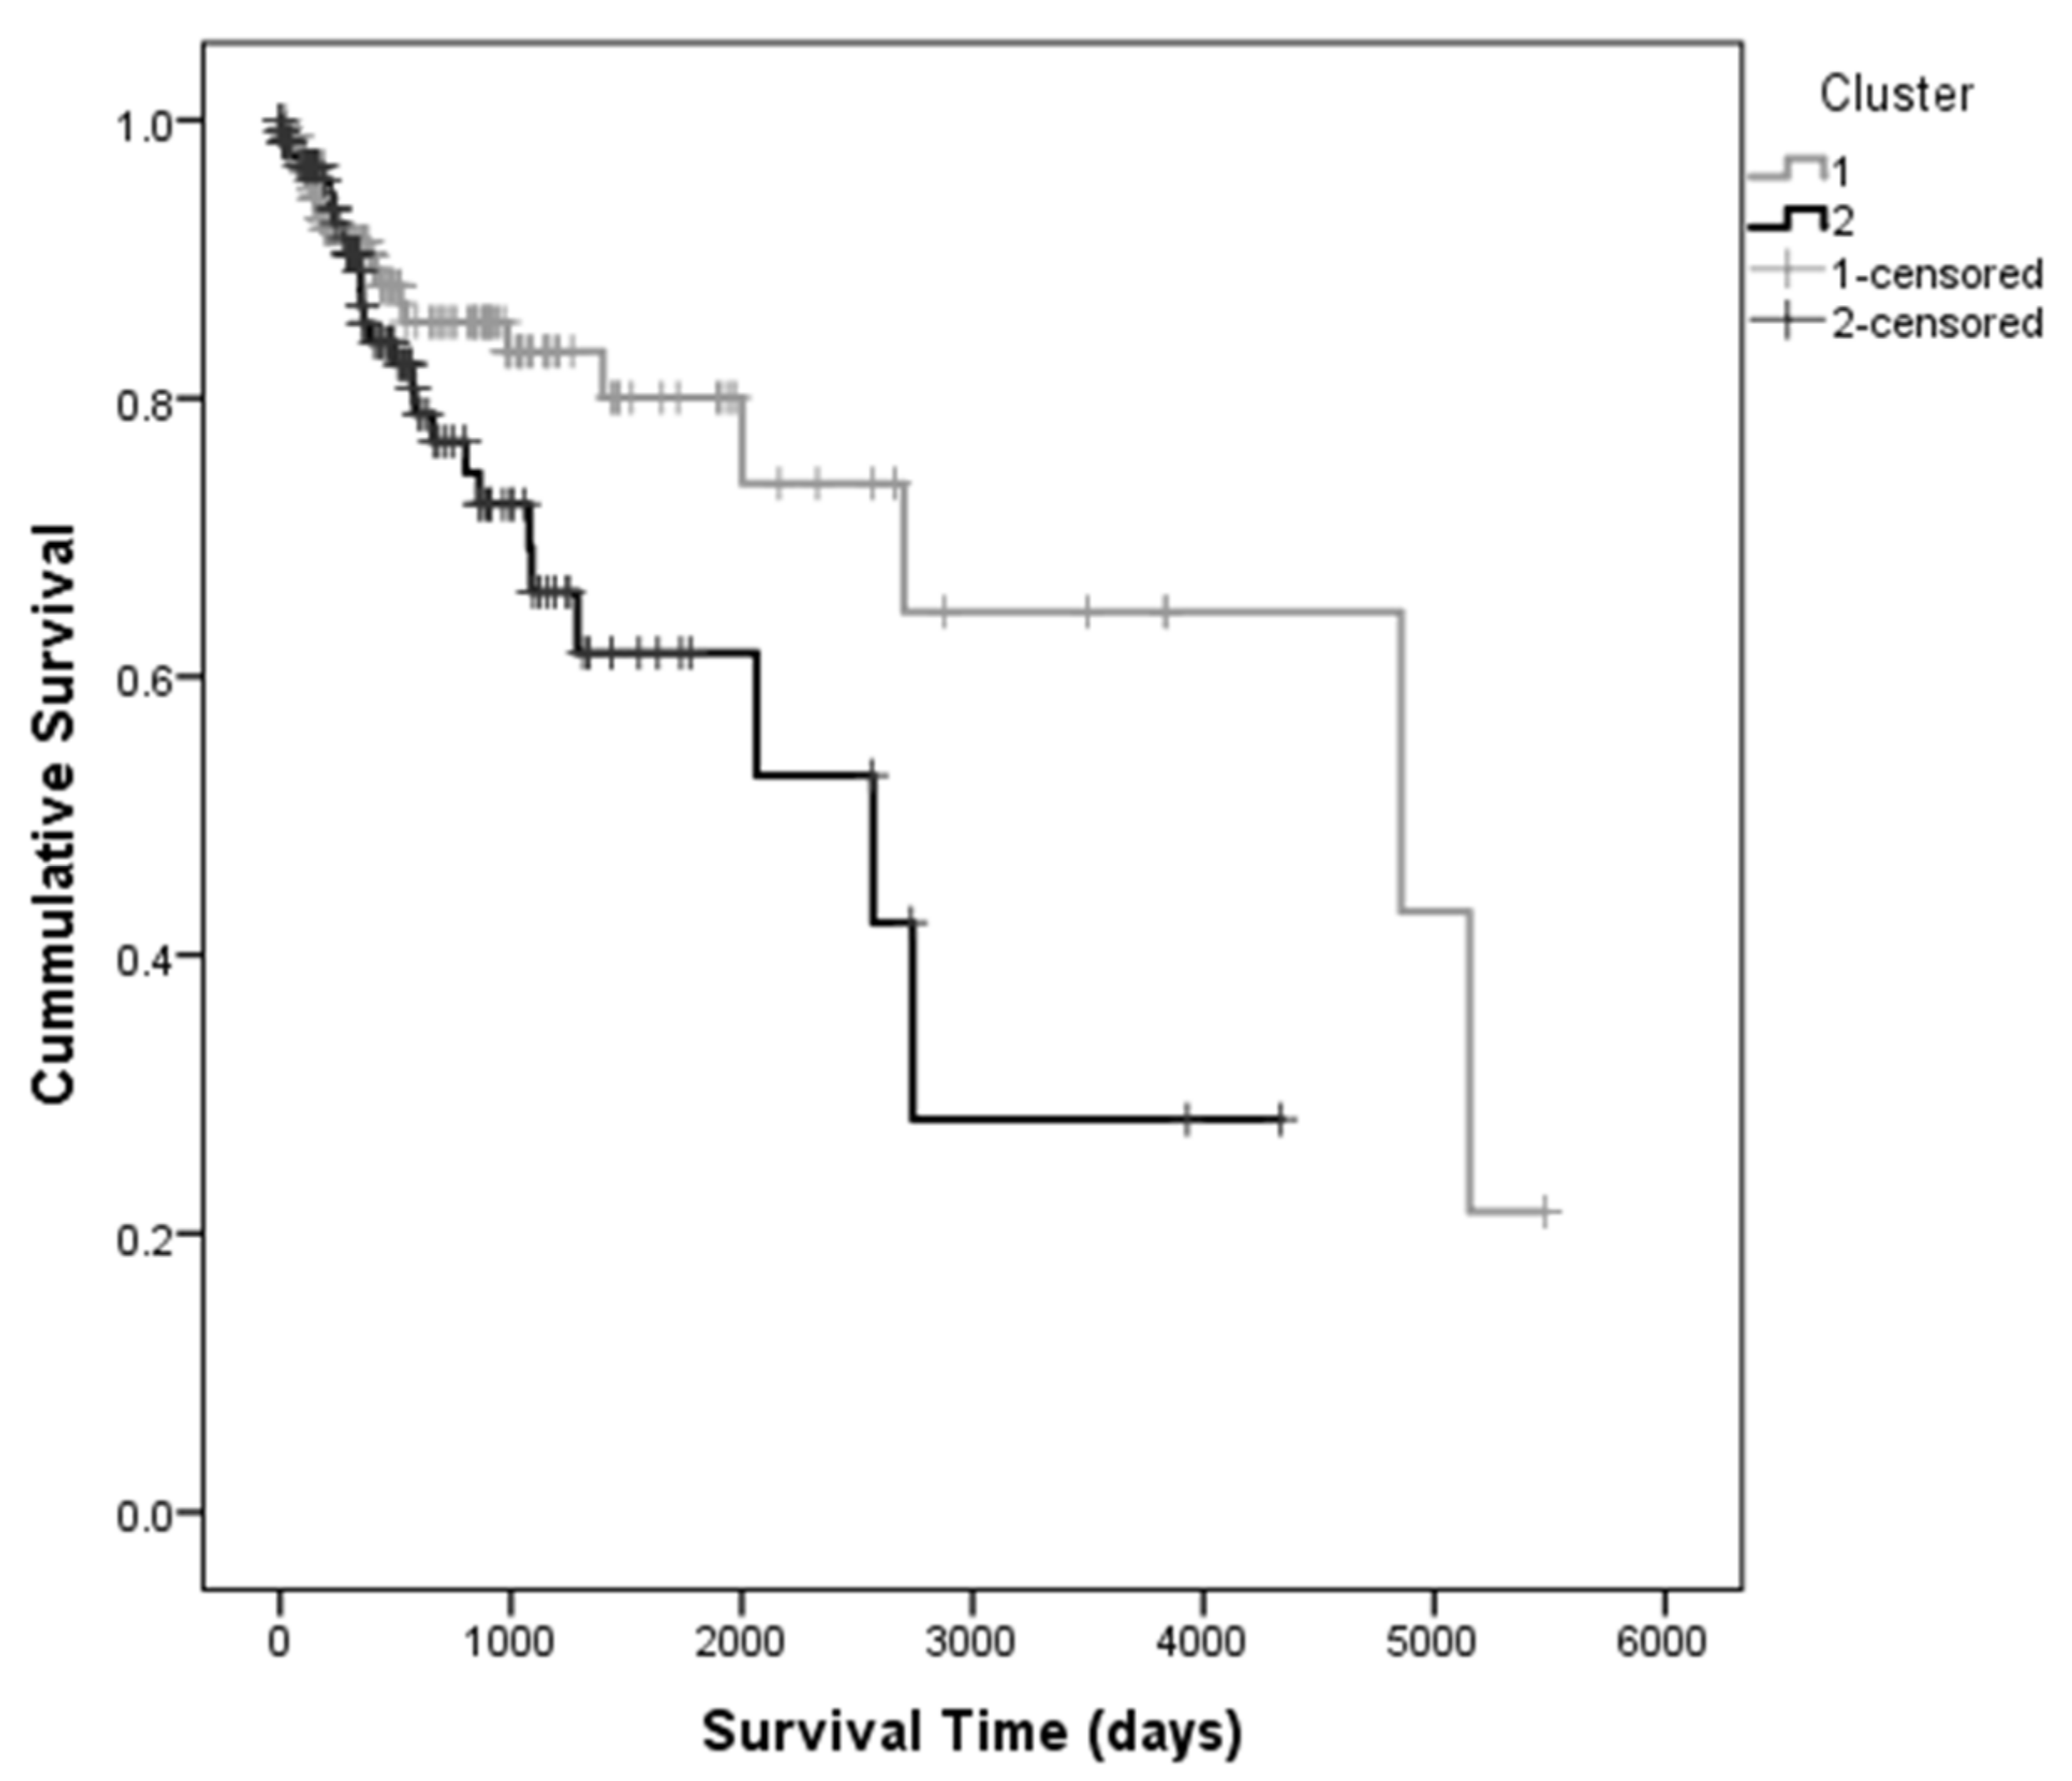
3.2. Principal Components Analysis and Survival Analysis

A principal components analysis was performed on the reduced integration table. A clustering algorithm was applied to the first ten principal components’ scores, resulting in two clusters with good separation (Figure 2) evaluated by the silhouette coefficient. The average silhouette coefficient is 0.533, which indicates good separation between clusters and good cohesion within each cluster. Cluster 1 includes 240 (58%) patients and Cluster 2 is composed of 170 patients (42%).
Survival analysis was performed using the Kaplan-Meier method to estimate the differences in the survival of the patients belonging to each of the clusters (Figure 3).
Survival analysis was performed using the Kaplan-Meier method to estimate the differences in the survival of the patients belonging to each of the clusters (Figure 3). In median, patients that belonged to Cluster 1 survived 836 days (approximately 2 years and 4 months) longer than those in Cluster 2 (Table 2). Log-rank, Breslow and Tarone tests did not show significant differences between the Kaplan-Meier curves (pLog Rank = 0.181, pBreslow = 0.615 and pTarone = 0.377, respectively), since for lower survival times, there is an overlap of the survival curves, which may be due to shorter follow-up times. However, since the median survival values indicate a clinically relevant difference (>2 years) between the two clusters, survival was considered as the clinical prognostic variable in the subsequent analysis.

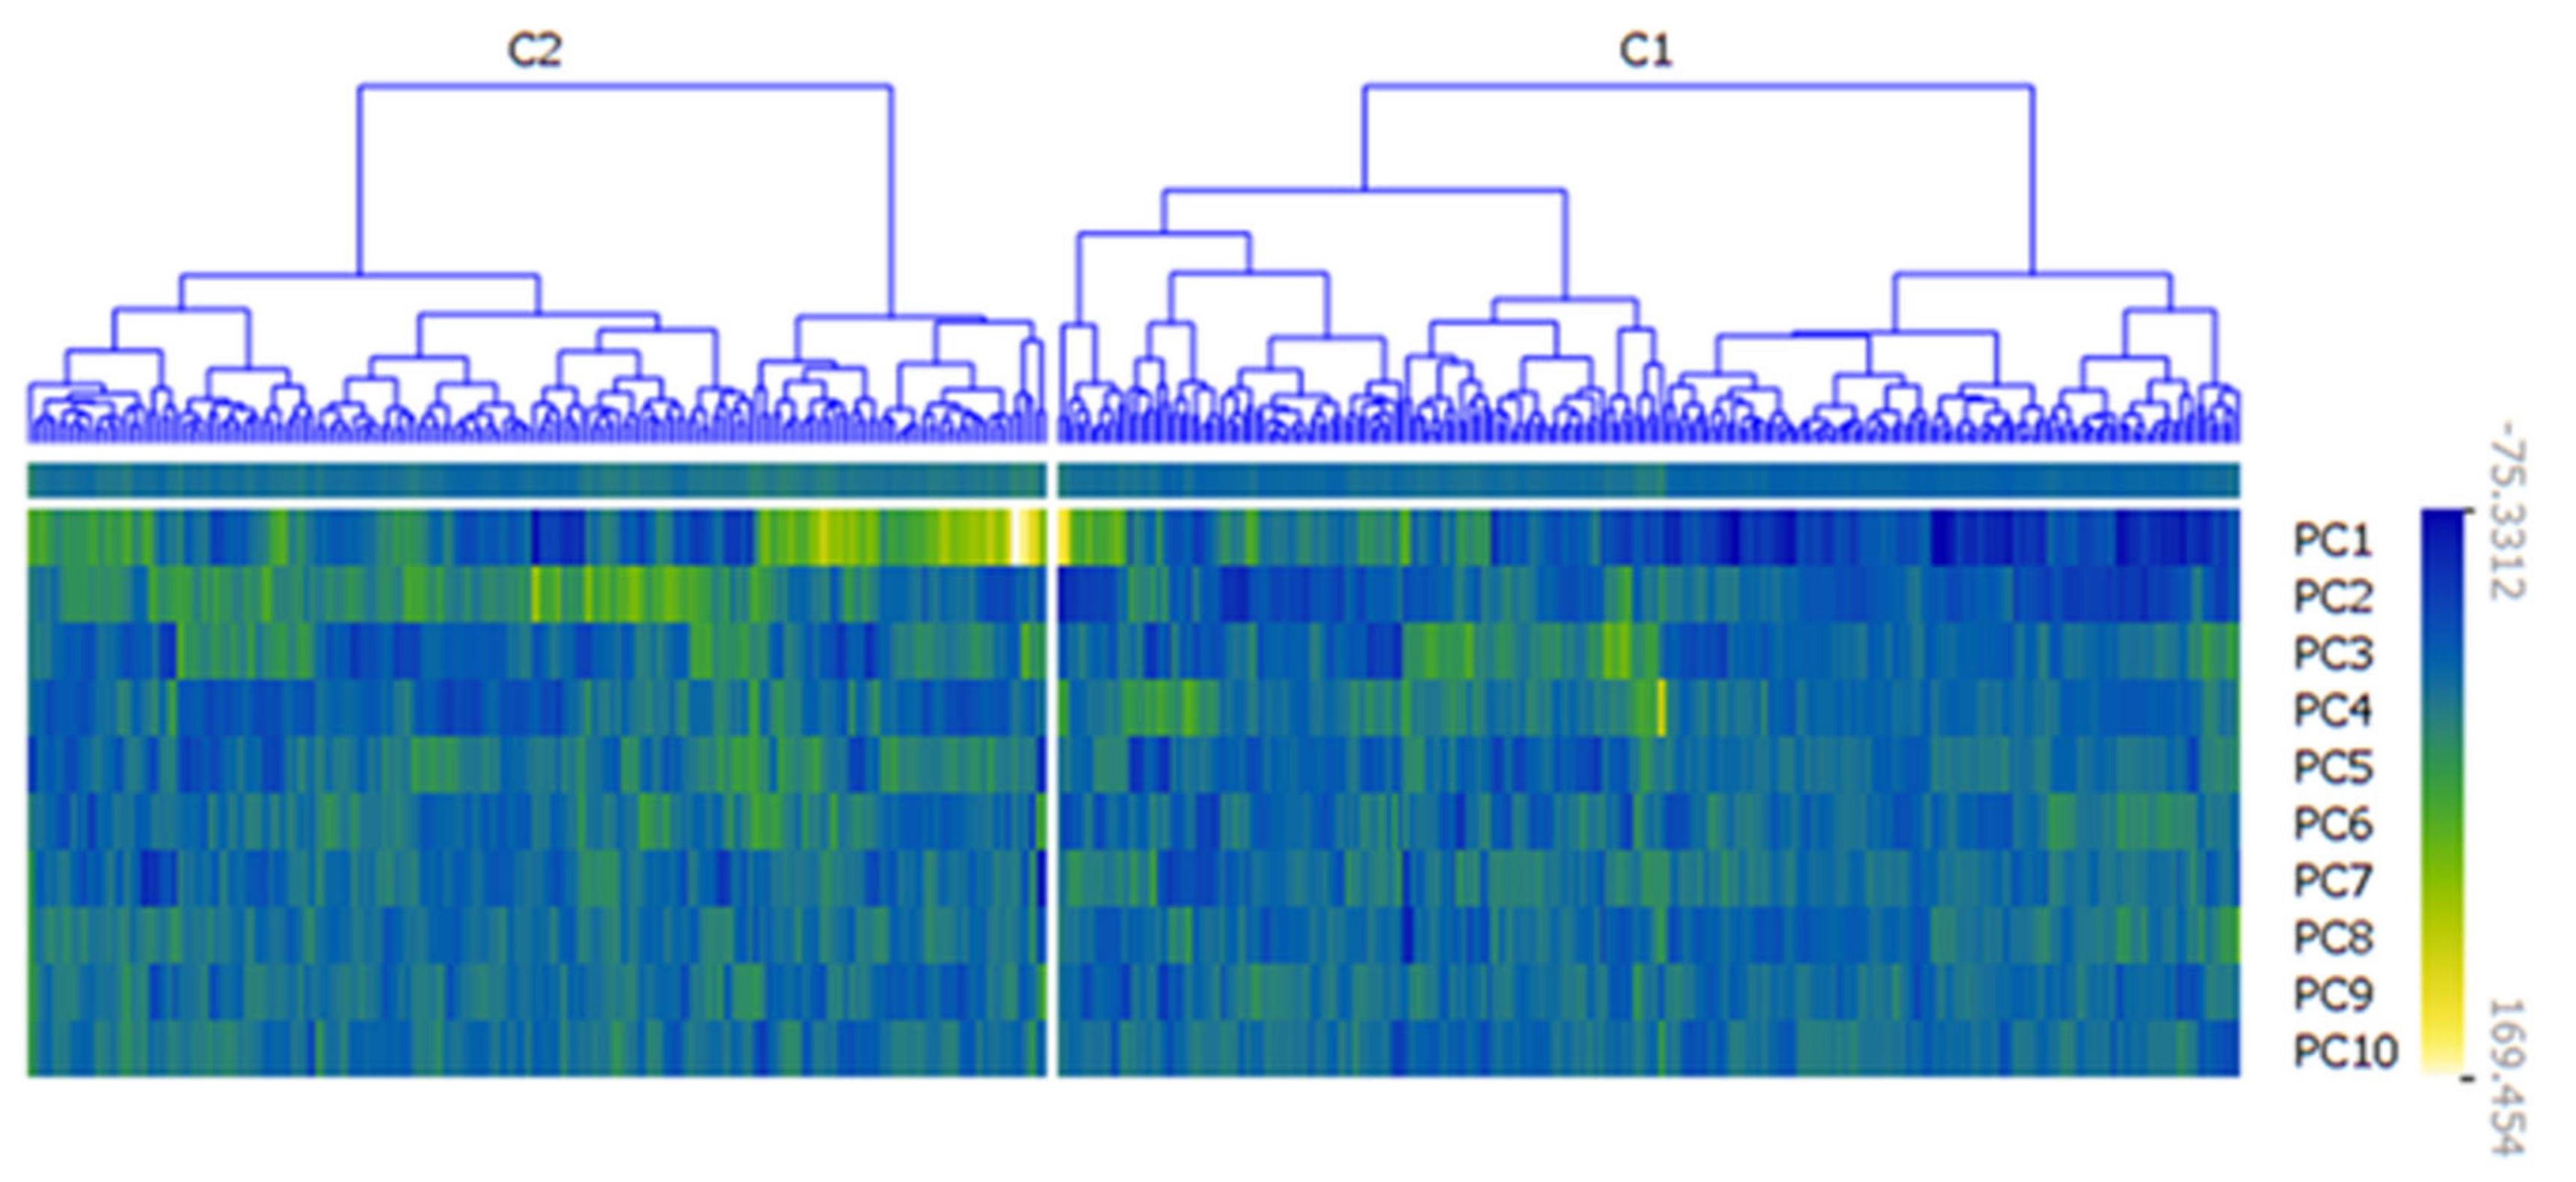
3.3. Classification Using the First Ten PCs as Predictors for Survival

Having associated the survival of the patients with the two clusters, a classification algorithm based on the Random Forest method was applied to the first ten principal components, using the clusters as the dependent variable. The goal of establishing the classification model was twofold: Obtain a way of predicting if a patient belongs to the cluster with greater survival time or the other, and determine which genes are associated with this distinction. According to the statistics obtained by cluster analysis, the groups have good separability and the first ten PCs are good predictors of the clusters that are related to survival (Table 3). These results (Table 3) indicate that the molecular alterations presented in the integration table and contribute exclusively to these PCs, will allow the distinction between the two groups.

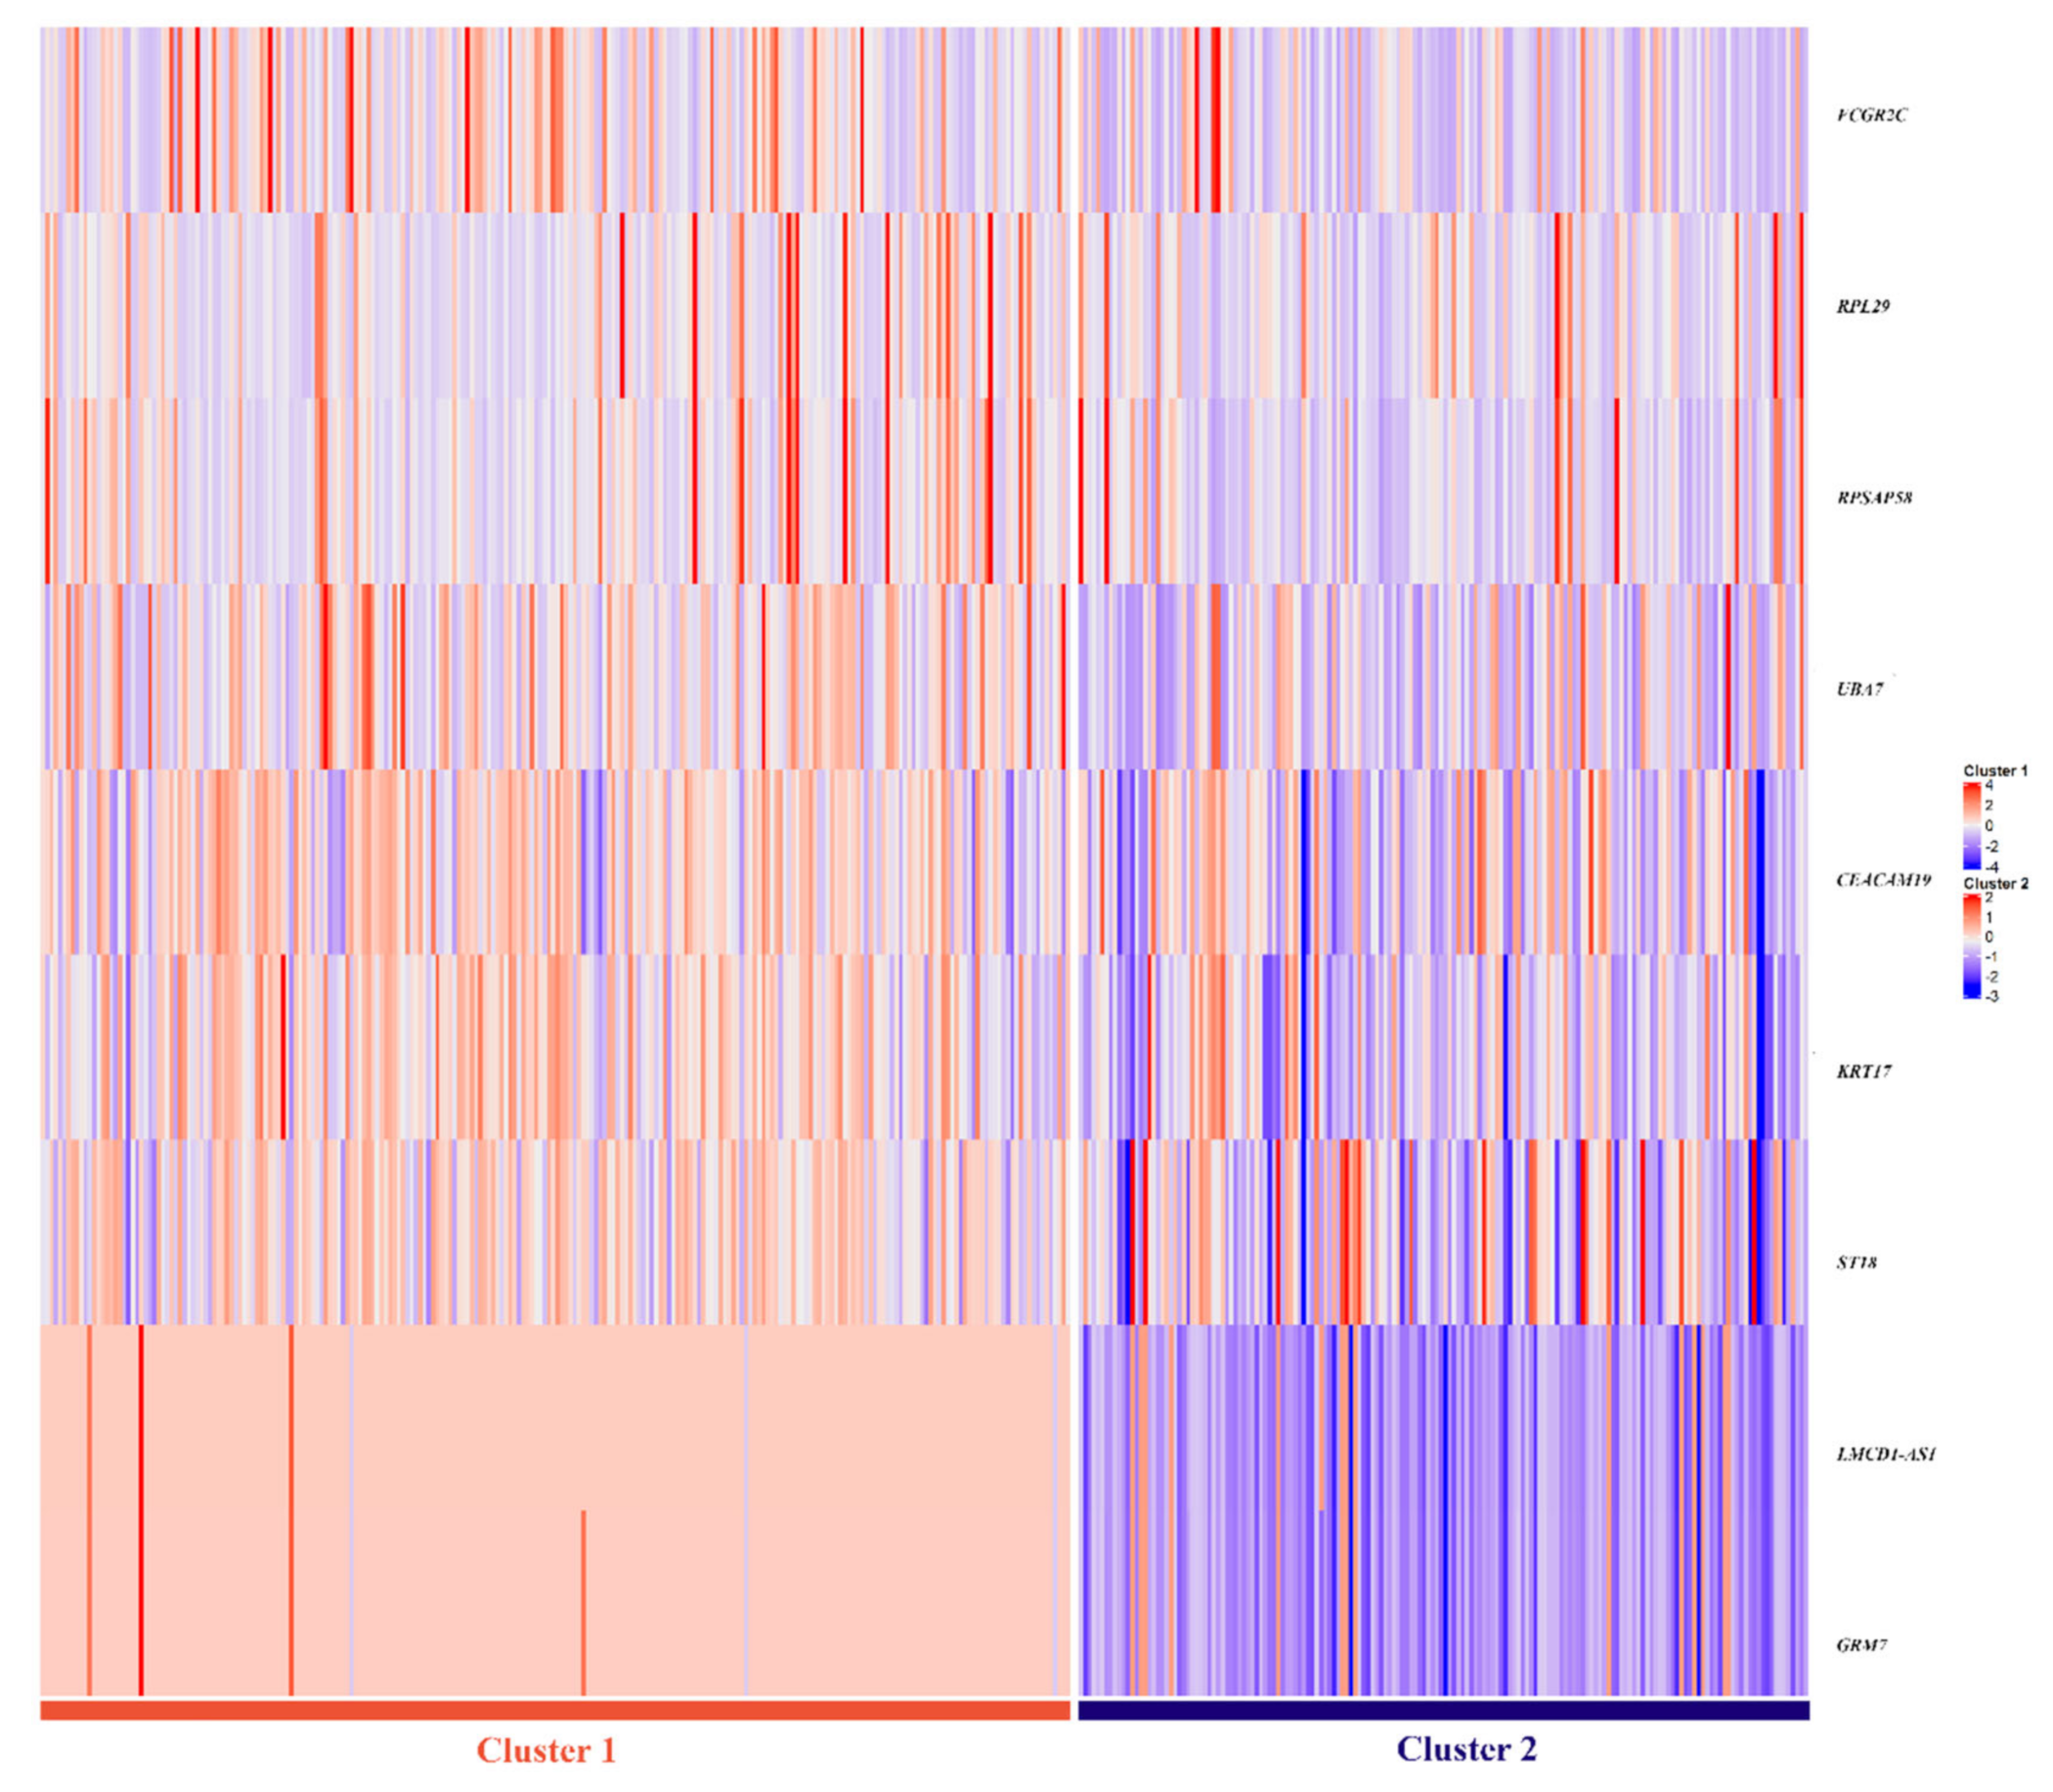
3.4. Selection of Genes for the Multi-Omics Signature

Each PC is a linear combination of all genes. Therefore, by analyzing the loadings (weights) of each gene to a specific PC, it is possible to select those genes that contribute the most. The genes that contribute mostly to each one of the first ten PCs were determined, which resulted in 2562 variables. Then, an importance plot routine based on the Gini’s coefficient was applied to these data, and a set of 398 variables was selected by filtering out all variables with importance below 10,000.
A Lasso regression analysis was performed across 1000 runs, and the genes that were included in the largest number of models were selected. Resorting to classification techniques allowed identifying nine genes that included genetic alterations observed in all of the three selected omics. This genetic signature included the copy number alterations found in LMCD1-A1S (3p26.1) and GRM7 (3p26.1) genes, the gene expression of RPL29 (3p21.1), UBA7(3p21.31), FCGR2C (1q23.2), and RPSAP58 (19p12) genes as well as the methylation of CEACAM19 (19q13.31), KRT17 (17q21.2), and ST18 (8q11.23) genes.

3.5. Assessment of Prediction Value of Proposed Multi-Omics Signature

The selected nine-gene multi-omics signature was evaluated as a good predictor for the two clusters creating two different classification models-one using SVM and another using Random Forest (Table 4). The signature shows excellent prediction ability, with mean accuracies of 96% (95% CI = [0.9519; 0.9808]) and 95% (95% CI = [0.9423; 0.9712]) in the test set, respectively. In Figure 4, a heatmap portrays the differences between the nine gene-signature between both clusters, where two different omics profiles are easily distinguishable.
To evaluate the separation ability of each gene, a ROC curve analysis was performed, using the two cluster groups as the dependent variable. The area under the curve (AUC) for each of the genes along with the respective 95% confidence interval, are represented in Table 5. All genes seem to have a good individual separation capacity, especially the CNAs observed in GMR7 and LMCD1-AS1 genes.
By calculating the maximum of Youden’s index for each gene, an optimum cut-off point for the distinction between the two survival groups was established (Table 6).
A logistic regression model was built using the nine-gene signature, aiming to measure the significance of the variables in the prediction. The genes that were found to be non-significant (p > 0.05) were excluded from the logistic model, thus, only four of the initial genes were chosen to be included. The copy number alterations present in LMCD1-AS1, methylation status of CEACAM19, as well as the expression profiles of RPL29 and FCGR2C were found to be statistically significant for the distinction between survival groups (Table 7).
The resulting logistic model shows an overall accuracy of 95.9%. The null model’s accuracy was 58.5%. According to the Hosmer-Lemeshow goodness of fit test, the model has a good fit for the data with a p-value greater than 0.05 (p = 0.948). When taking together the four independent variables in the logistic model, they account for 93.9% of the variance in the tumors tested (Nagelkerke R2 = 0.930), meaning that they explain 93% of the reason why a patient belongs to their respective survival group.
By observing the adjusted Odds Ratios (ORadj) determined for the model in Table 7, it can be inferred that when the value measured for a given gene (either copy number alteration, expression, or methylation levels) is below its optimum cut-off point, the odds that this patient belongs to Cluster 2 is increased. Meaning that the patients that have either log 2 copy number alteration levels above −0.150 for the gene LMCD1-AS1, measured genetic expression levels above 6885.475 and 33.152 for RPL29 and FCGR2C, respectively, or a methylation level higher than 0.625 in CEACAM19 have a higher probability of belonging to Cluster 1, which signifies a higher likelihood of survival for that patient.
ORadj for LMCD1-AS1 is considerably larger than the ones calculated for the other three genes included in the model. This is due to the high degree of separation for the patients above and below the optimum cut point: Essentially, all patients in Cluster 1 have log2 copy number values over the cut-off point.
The Cox regression model built with the four genes included in the logistic regression model showed statistical significance (p = 0.002). RPL29 showed a significant effect upon survival time (p < 0.001) with HR = 0.000042. The HR for LMCD1-AS1, FCGR2C and CEACAM19 are, respectively, −0.678, −0.000175, and 0.871, however, they are not statistically significant.

3.6. Association of the Obtained Clusters with Metastatic Status of the Patients

Fisher’s exact test showed no significance for the association between the metastatic status of the patients and their belonging to a given cluster (p = 0.428). Additionally, the survival in each of the metastasis groups was evaluated separately, with the clusters as dependent variables (Figure 5). For the group that developed metastasis the median survival time for Cluster 1 was 823 days (95% CI = [110.7; 1535.3]) and for Cluster 2 it was 606 days (95% CI = [497.18; 714.82]). In the case of the patients that did not develop metastasis during the time of follow-up, the median survival time of Cluster 1 was 4856 days (95% CI = [1131.56; 8589.44]) and, in Cluster 2 it was 2570 days (95% CI = [938.99; 4201.01]). These findings suggest that the clusters identified are not related to the metastatic status, and the clusters may comprise different mechanisms that significantly impact the survival time.

4. Discussion

The integration of multi-dimensional datasets seems to give better statistical and biological results than the analysis of a single molecular layer [21]. Nowadays, there are still several challenges in dealing with multi-omics integrative analyses due to the complexity of biological systems, the technological limitations, the significant amount of biological variables, and the rather reduced number of biological samples [21]. In the HNC field, little progress has been made in utilizing the multi-omics signatures to improve diagnostic tools or therapeutic interventions. Thus, the main aim of our study was to integrate different omics layers, namely genomic, epigenomic and transcriptomic data, to draw a more comprehensive view of the biological processes of head and neck carcinogenesis and consequently to identify an integrative multi-omics signature with predictive impact on patient survival. We developed a multi-omics approach based on statistical and machine learning methods using TCGA-HNC data from 410 patients, for which complete information on clinical and molecular features was available. We identified an integrative nine-gene multi-omics signature correlated with HNC patients’ survival independently of relapses or metastasis development. This prognosis multi-omics signature comprises genes mapped in the chromosomes 1q, 3p, 8q, 17q, 19p, and 19q, and encompasses alterations at copy number, gene expression and methylation. Based on this multi-omics signature that includes:
(i)
copy number alterations in LMCD1-A1S (3p26.1) and GRM7 (3p26.1) genes;
(ii)
gene expression of FCGR2C (1q23.2), RPL29 (3p21.1), UBA7(3p21.31), and RPSAP58 (19p12);
(iii)
methylation of ST18 (8q11.23), KRT17 (17q21.2), and CEACAM19 (19q13.31) genes,
we were able to identify HNC patients with differences in survival higher than two years and consequently with better or worse prognosis.
Additionally, each of the genes had representation in the other two omics that were not included in the model for that particular gene, and their values were in line with what was expected. For example, LMCD1-A1S and GRM7 are both located in the same chromosomic region (3p26.1). We were able to determine that this region exhibited a clear predominance of loss of genetic material in relation to the amplification. By observing the expression and methylation profiles for these genes, we were also able to find that they are frequently under-expressed and hyper-methylated.
Recurrent genomic and epigenomic alterations in some specific chromosomal regions are commonly observed in HNC [6,9,10,16,22,23,24], which has already been reported in the chromosomes presented in our multi-omics signature, key genes for cancer progression. However, HNC remains a highly lethal cancer owing to the lack of validated diagnosis and prognosis biomarkers with clinical utility. To the best of our knowledge, our study is the first to report this nine gene multi-omics signature related with the patients’ survival, independently of metastasis/relapse development. The genes included in this multi-omics signature are associated with known signaling pathways that seem to be linked to cancer, namely DNA Double-Strand Break Repair, Cytoskeletal Signaling, CREB Pathway, Keratinization, Gene Expression, Metabolism of Proteins, Signaling in Gap Junctions and Protein Ubiquitylation. Our results, through the integration of three different biological levels of data, give a step forward in the understanding of the molecular basis of head and neck tumorigenesis, as well as in the identification of prognosis biomarkers, which might have a great impact on patients’ management and with direct application in the clinical routine practice.
Our study has some potential limitations, such as the fact that we are analyzing as a single tumor entity, sampling from different anatomic locations in the head and neck region, from different tumor stages, and different treatment modalities as well as we are not taking into account the presence of risk factors that could have influence in the patients’ survival. However, considering the individual effect of each of these nine genes for the prediction of patients’ survival, we verified using a logistic regression model that four genes are statistically significant. Therefore, deletion in LMCD1-AS1, absence of hyper methylation in CEACAM19, and subexpression of RPL29 and FCGR2C were found to be related to unfavorable survival in these patients. Some of these genes are already related to cancer, namely, high expression of CEACAM19 in tumor breast samples [25] and gastric cancer tissues [26]. In order to determine the influence of the variables in the prediction of survival, we performed Cox’s regression with the aim to prove the association of the variables to the distinction between the two groups, having already proven that they are distinct at the time of survival level, by using the Kaplan-Meier method. Gene RPL29 was shown to have an adverse effect on survival, augmenting the chance of death by 23,809 times. LMCD1-AS1, CEACAM19, and FCGR2C showed no significance, which could be due to the sample size since they showed high HR values.
Some of the nine genes have already been associated with survival outcomes in other studies related to cancer. For example, RPL29 has been included in a five-gene model that allows for the distinction of high- and low-risk groups with different survival outcomes in HNC patients [27]. Another study found that the overexpression of KRT17 is associated with the proliferation and invasion and related to poor survival of non-small cell lung cancer patients [28]. In esophageal squamous cell carcinoma the upregulation of protein KRT17 was found to be detrimental to survival [29]. Recently, the downregulation of ST18 was associated with short event-free survival in acute myeloid leukemia [30]. Furthermore, breast cancer patients with low UBA7 expression levels were shown to have a poor prognosis and low overall survival [31].
Further studies are needed to understand the molecular mechanism of these genes in the HNC carcinogenesis as well as to validate their role in patients’ survival, including external validation, which is lacking in our study. To the best of our knowledge, TCGA is the most thorough repository of cancer data in existence and there is a lack of equally complete publicly available databases that contain information on the three omics analyzed in this paper for the same cohort of patients.
In conclusion, we report an integrative multi-omics analysis of HNC tumors from a total of 410 patients included in the TCGA database. The analysis and integration of the complex genomic, epigenetic, and transcriptomic data reveal a multi-omics signature with genes mapped at chromosomes 1, 3, 8, 17, and 19 that together allow to differentiate the patients according to their survival and independently of metastases or relapses development. A major finding of our study is the differences in survival of HNC patients that harbor copy number alterations in LMCD1-A1S (3p26.1) and GRM7 (3p26.1) genes, gene expression of FCGR2C (1q23.2), RPL29 (3p21.1), UBA7 (3p21.31), and RPSAP58 (19p12) and methylation of ST18 (8q11.23), KRT17 (17q21.2), and CEACAM19 (19q13.31), which could help in the clinical management of the patients.

Author Contributions

Conceptualization: I.P.R., I.M.C. and J.B.M.; Formal analysis: I.P.R., L.E. and F.C.; Funding acquisition: J.B.M.; Resources: I.M.C. and J.B.M.; Visualization: L.E. and F.C.; Writing—original draft: I.P.R. and L.E.; Writing—review and editing: F.C., I.M.C. and J.B.M. All authors have read and agreed to the published version of the manuscript.

Funding

This research received no external funding.

Institutional Review Board Statement

Not applicable.

Informed Consent Statement

Not applicable.

Data Availability Statement

The datasets analyzed during the current study are available in the GDC Data Portal repository, https://portal.gdc.cancer.gov/ (accessed on 19 July 2019).

Conflicts of Interest

The authors declare no conflict of interest.

References

  1. Plath, M.; Gass, J.; Hlevnjak, M.; Li, Q.; Feng, B.; Hostench, X.P.; Bieg, M.; Schroeder, L.; Holzinger, D.; Zapatka, M.; et al. Unraveling most abundant mutational signatures in head and neck cancer. Int. J. Cancer 2021, 148, 115–127. [Google Scholar] [CrossRef] [PubMed]
  2. Bray, F.; Ferlay, J.; Soerjomataram, I.; Siegel, R.L.; Torre, L.A.; Jemal, A. Global cancer statistics 2018: GLOBOCAN estimates of incidence and mortality worldwide for 36 cancers in 185 countries. CA Cancer J. Clin. 2018, 68, 394–424. [Google Scholar] [CrossRef] [PubMed]
  3. Global Burden of Disease Cancer Collaboration; Fitzmaurice, C.; Allen, C.; Barber, R.M.; Barregard, L.; Bhutta, Z.A.; Brenner, H.; Dicker, D.J.; Chimed-Orchir, O.; Dandona, R.; et al. Global, Regional, and National Cancer Incidence, Mortality, Years of Life Lost, Years Lived With Disability, and Disability-Adjusted Life-years for 32 Cancer Groups, 1990 to 2015: A Systematic Analysis for the Global Burden of Disease Study. JAMA Oncol. 2017, 3, 524–548. [Google Scholar] [CrossRef] [PubMed]
  4. Chow, L.Q.M. Head and Neck Cancer. N. Engl. J. Med. 2020, 382, 60–72. [Google Scholar] [CrossRef]
  5. Braakhuis, B.J.; Brakenhoff, R.H.; Leemans, C.R. Second field tumors: A new opportunity for cancer prevention? Oncologist 2005, 10, 493–500. [Google Scholar] [CrossRef]
  6. Ribeiro, I.P.; Esteves, L.; Santos, A.; Barroso, L.; Marques, F.; Caramelo, F.; Melo, J.B.; Carreira, I.M. A seven-gene signature to predict the prognosis of oral squamous cell carcinoma. Oncogene 2021, 40, 3859–3869. [Google Scholar] [CrossRef]
  7. Ribeiro, I.P.; Barroso, L.; Marques, F.; Melo, J.B.; Carreira, I.M. Early detection and personalized treatment in oral cancer: The impact of omics approaches. Mol. Cytogenet. 2016, 9, 85. [Google Scholar] [CrossRef]
  8. Costa, R.L.; Boroni, M.; Soares, M.A. Distinct co-expression networks using multi-omic data reveal novel interventional targets in HPV-positive and negative head-and-neck squamous cell cancer. Sci. Rep. 2018, 8, 15254. [Google Scholar] [CrossRef]
  9. Ribeiro, I.P.; Caramelo, F.; Esteves, L.; Menoita, J.; Marques, F.; Barroso, L.; Migueis, J.; Melo, J.B.; Carreira, I.M. Genomic predictive model for recurrence and metastasis development in head and neck squamous cell carcinoma patients. Sci. Rep. 2017, 7, 13897. [Google Scholar] [CrossRef]
  10. Cancer Genome Atlas Network. Comprehensive genomic characterization of head and neck squamous cell carcinomas. Nature 2015, 517, 576–582. [Google Scholar] [CrossRef]
  11. Yang, J.; Chen, Y.; Luo, H.; Cai, H. The Landscape of Somatic Copy Number Alterations in Head and Neck Squamous Cell Carcinoma. Front. Oncol. 2020, 10, 321. [Google Scholar] [CrossRef]
  12. You, G.R.; Cheng, A.J.; Lee, L.Y.; Huang, Y.C.; Liu, H.; Chen, Y.J.; Chang, J.T. Prognostic signature associated with radioresistance in head and neck cancer via transcriptomic and bioinformatic analyses. BMC Cancer 2019, 19, 64. [Google Scholar] [CrossRef]
  13. Guo, H.; Li, C.; Su, X.; Huang, X. A Five-mRNA Expression Signature to Predict Survival in Oral Squamous Cell Carcinoma by Integrated Bioinformatic Analyses. Genet. Test. Mol. Biomark. 2021, 25, 517–527. [Google Scholar] [CrossRef]
  14. Ribeiro, I.P.; Esteves, L.; Anjo, S.I.; Marques, F.; Barroso, L.; Manadas, B.; Carreira, I.M.; Melo, J.B. Proteomics-based Predictive Model for the Early Detection of Metastasis and Recurrence in Head and Neck Cancer. Cancer Genom. Proteom. 2020, 17, 259–269. [Google Scholar] [CrossRef]
  15. Bohnenberger, H.; Kaderali, L.; Strobel, P.; Yepes, D.; Plessmann, U.; Dharia, N.V.; Yao, S.; Heydt, C.; Merkelbach-Bruse, S.; Emmert, A.; et al. Comparative proteomics reveals a diagnostic signature for pulmonary head-and-neck cancer metastasis. EMBO Mol. Med. 2018, 10, e8428. [Google Scholar] [CrossRef]
  16. Ribeiro, I.P.; Caramelo, F.; Marques, F.; Domingues, A.; Mesquita, M.; Barroso, L.; Prazeres, H.; Juliao, M.J.; Baptista, I.P.; Ferreira, A.; et al. WT1, MSH6, GATA5 and PAX5 as epigenetic oral squamous cell carcinoma biomarkers—A short report. Cell. Oncol. 2016, 39, 573–582. [Google Scholar] [CrossRef]
  17. Worsham, M.J.; Chen, K.M.; Datta, I.; Stephen, J.K.; Chitale, D.; Gothard, A.; Divine, G. The biological significance of methylome differences in human papilloma virus associated head and neck cancer. Oncol. Lett. 2016, 12, 4949–4956. [Google Scholar] [CrossRef]
  18. Bai, G.; Song, J.; Yuan, Y.; Chen, Z.; Tian, Y.; Yin, X.; Niu, Y.; Liu, J. Systematic analysis of differentially methylated expressed genes and site-speci fi c methylation as potential prognostic markers in head and neck cancer. J. Cell. Physiol. 2019, 234, 22687–22702. [Google Scholar] [CrossRef]
  19. Bioconductor Core Team. Homo. Sapiens: Annotation Package for the Homo.Sapiens Object; R package version 1.3.1. 2015. Available online: https://bioconductor.org/packages/release/data/annotation/html/Homo.sapiens.html (accessed on 18 July 2022).
  20. Demsar, J.C.T.; Erjavec, A.; Gorup, C.; Hocevar, T.; Milutinovic, M.; Mozina, M.; Polajnar, M.; Toplak, M.; Staric, A.; Stajdohar, M.; et al. Orange: Data Mining Toolbox in Python. J. Mach. Learn. Res. 2013, 14, 2349–2353. [Google Scholar]
  21. Bersanelli, M.; Mosca, E.; Remondini, D.; Giampieri, E.; Sala, C.; Castellani, G.; Milanesi, L. Methods for the integration of multi-omics data: Mathematical aspects. BMC Bioinform. 2016, 17 (Suppl. S2), 15. [Google Scholar] [CrossRef]
  22. Vincent-Chong, V.K.; Salahshourifar, I.; Woo, K.M.; Anwar, A.; Razali, R.; Gudimella, R.; Rahman, Z.A.; Ismail, S.M.; Kallarakkal, T.G.; Ramanathan, A.; et al. Genome wide profiling in oral squamous cell carcinoma identifies a four genetic marker signature of prognostic significance. PLoS ONE 2017, 12, e0174865. [Google Scholar] [CrossRef]
  23. Ribeiro, I.P.; Marques, F.; Caramelo, F.; Pereira, J.; Patricio, M.; Prazeres, H.; Ferrao, J.; Juliao, M.J.; Castelo-Branco, M.; de Melo, J.B.; et al. Genetic gains and losses in oral squamous cell carcinoma: Impact on clinical management. Cell. Oncol. 2014, 37, 29–39. [Google Scholar] [CrossRef] [PubMed]
  24. Califano, J.; van der Riet, P.; Westra, W.; Nawroz, H.; Clayman, G.; Piantadosi, S.; Corio, R.; Lee, D.; Greenberg, B.; Koch, W.; et al. Genetic progression model for head and neck cancer: Implications for field cancerization. Cancer Res. 1996, 56, 2488–2492. [Google Scholar] [CrossRef]
  25. Estiar, M.A.; Esmaeili, R.; Zare, A.A.; Farahmand, L.; Fazilaty, H.; Zekri, A.; Jafarbeik-Iravani, N.; Majidzadeh, A.K. High expression of CEACAM19, a new member of carcinoembryonic antigen gene family, in patients with breast cancer. Clin. Exp. Med. 2017, 17, 547–553. [Google Scholar] [CrossRef]
  26. Zhao, H.; Xu, J.; Wang, Y.; Jiang, R.; Li, X.; Zhang, L.; Che, Y. Knockdown of CEACAM19 suppresses human gastric cancer through inhibition of PI3K/Akt and NF-kappaB. Surg. Oncol. 2018, 27, 495–502. [Google Scholar] [CrossRef]
  27. Zhong, Q.; Zhou, L.; Zhu, D. Identification of prognostic marker genes in head and neck squamous cell carcinoma: A study based on TCGA database and experimental validation. J. Oral Pathol. Med. 2021, 50, 891–901. [Google Scholar] [CrossRef]
  28. Wang, Z.; Yang, M.; Lei, L.; Fei, L.; Zheng, Y.; Huang, W.; Li, Z.; Liu, C.; Xu, H. Overexpression of KRT17 promotes proliferation and invasion of non-small cell lung cancer and indicates poor prognosis. Cancer Manag. Res. 2019, 11, 7485–7497. [Google Scholar] [CrossRef]
  29. Liu, Z.; Yu, S.; Ye, S.; Shen, Z.; Gao, L.; Han, Z.; Zhang, P.; Luo, F.; Chen, S.; Kang, M. Keratin 17 activates AKT signalling and induces epithelial-mesenchymal transition in oesophageal squamous cell carcinoma. J. Proteom. 2020, 211, 103557. [Google Scholar] [CrossRef] [PubMed]
  30. Stratmann, S.; Yones, S.A.; Garbulowski, M.; Sun, J.; Skaftason, A.; Mayrhofer, M.; Norgren, N.; Herlin, M.K.; Sundström, C.; Eriksson, A.; et al. Transcriptomic analysis reveals proinflammatory signatures associated with acute myeloid leukemia progression. Blood Adv. 2022, 11, 152–164. [Google Scholar] [CrossRef] [PubMed]
  31. Lin, M.; Li, Y.; Qin, S.; Jiao, Y.; Hua, F. Ubiquitin-like modifier-activating enzyme 7 as a marker for the diagnosis and prognosis of breast cancer. Oncol. Lett. 2020, 19, 2773–2784. [Google Scholar] [CrossRef]
Figure 1. Circos plots representing the copy number alterations (A), methylation (B), and expression level (C) profiles of the genes kept after correlation analysis.
Cells 11 02536 g001
Figure 2. Heatmap representing the clusters obtained using the first ten principal components. Two clusters were found: Cluster 1 (C1) and Cluster 2 (C2), which, according to average silhouette coefficient (0.533), present good separation and good cohesion.
Cells 11 02536 g002
Figure 3. Kaplan-Meier curves determined for each cluster found using the first ten principal components of the PCA, indicating that patients in Cluster 1 survive, in median, 2 years and 4 months longer than those in Cluster 2 Patients belonging to Cluster 1are represented in grey and Cluster 2 is represented in black.
Cells 11 02536 g003
Figure 4. Heatmap representing the genetic profiles of the two clusters, for the nine gene signature. Lower values are represented in blue, whereas red indicates higher values. Two distinct signatures are observable, with a prevalence of lower values in Cluster 2.
Cells 11 02536 g004
Figure 5. Kaplan-Meier survival curves for the group that developed metastasis (A) and for the group that did not present metastasis during the time of follow-up (B). Patients belonging to Cluster 1 are represented in grey and Cluster 2 is represented in black. Patients that did not develop metastasis or relapse in Clusters 1 and 2 present well distinguished survival profiles, as opposed to patients that did.
Cells 11 02536 g005
Table 1. Clinic-pathologic characteristics of study population.
Patients (n = 410)
n (%) n (%)
Gender HPV
Male304 (74)Positive79 (19.5)
Female106 (26)Negative
NA
329 (80)
2 (0.5)
Age at diagnosis (Years) Anatomic Subsite
<60185 (45)Oral Tongue
Larynx
Oral Cavity
Floor of mouth
Tonsil
Base of tongue
Buccal Mucosa
Alveolar Ridge
Hypopharynx
Oropharynx
Hard Palate
Lip
104 (25)
≥60225 (55)88 (21)
Tobacco 54 (13)
Yes306 (75)45 (11)
No
NA
96 (23)
8 (2)
37 (9)
23 (6)
Alcohol 19 (5)
Yes280(68)15 (4)
No120 (29)8 (2)
NA10 (2)8 (2)
TNM stage 7 (2)
I19 (5)2 (0.5)
II72 (18)
III82 (20)
IV226 (55)
NA11 (3)
Metastasis
Yes102 (25)
No308 (75)
Table 2. Means and medians for survival times for the two clusters found in the data.
MeanMedian
95% Confidence Interval 95% Confidence Interval
ClusterEstimateStd. ErrorLower BoundUpper BoundEstimateStd. ErrorLower BoundUpper Bound
12879.300276.3792337.5983421.0032900.000702.4341523.2294276.771
22085.443252.9011589.7572581.1282064.000652.289785.5133342.487
Overall2633.589214.9992212.1913054.9872319.000378.6961576.7573061.243
Survival was determined by the Kaplan-Meier method and is shown in days. Cluster 1 patients survive, in median, up to 2 years and 4 months longer than patients found in Cluster 2.
Table 3. Evaluation metrics for test set using RF classification in the first ten PCs.
Minimum1st QuantileMedianMean3rd QuantileMaximum
Accuracy0.86540.95190.96150.96240.98081.0000
Sensitivity0.75000.90380.94230.93380.96151.0000
Specificity0.88460.98081.00000.99101.00001.0000
Accuracy, sensitivity, and specificity are reported across 5000 runs.
Table 4. Evaluation metrics for the test sets from SVM and RF classification using the nine gene multi-omics signature.
Minimum1st QuantileMedianMean3rd QuantileMaximum
ModelSVMRFSVMRFSVMRFSVMRFSVMRFSVMRF
Accuracy0.86540.83650.95190.94230.96150.95190.96240.95480.98080.97121.00001.0000
Sensitivity0.75000.69230.90380.92310.94230.94230.93380.93730.96150.96151.00001.0000
Specificity0.88460.75000.98080.96151.00000.98080.99100.97231.00000.98081.00001.0000
Accuracy, sensitivity, and specificity are reported for 5000 runs. This signature shows high predictive ability, with the mean accuracies being 96% and 95% in the test set, respectively, for SVM and RF.
Table 5. AUC and corresponding 95% Confidence Interval (95% CI) for the genes in the multi-omics model.
95% CI
GeneAUCLowerHigher
GRM7 (CNA)0.9590.9350.983
LMCD1-AS1 (CNA)0.9560.9310.981
RPL29 (RNASeq)0.6580.6050.711
UBA7 (RNAseq)0.7260.6770.774
FCGR2C (RNASeq)0.7210.6720.770
RPSAP58 (RNASeq)0.7170.6670.767
CEACAM19 (Methylation)0.7230.6740.772
KRT17 (Methylation)0.7670.7210.813
ST18 (Methylation)0.7030.6510.755
AUC: Area under the ROC curve. Good individual separation capability for patient survival is shown for the nine genes, with AUC higher than 65%.
Table 6. Optimum cut-off points determined for each gene included in the multi-omics signature.
GeneGRM7LMCD1-AS1RPL29RPSAP58FCGR2CUBA7CEACAM19KR17ST18
Cut-off point−0.150−0.1506885.4757082.37833.152618.5470.6250.3440.573
Table 7. Variables included in the logistic regression model and respective coefficients determined by the model.
BS.E.p-ValueORadj95% CI ORadj
LowerUpper
RPL292.2090.6680.0019.1052.45633.749
FCGR2C1.7290.5960.0045.6351.75218.120
LMCD1-AS17.5280.896<0.0011859.334321.16110,764.458
CEACAM192.6680.8120.00114.4052.93570.707
Constant−7.1161.138<0.0010.001
B stands for the regression coefficient, S.E. for standard error and ORadj stands for the adjusted odds ratio. The copy number alterations present in LMCD1-AS1, methylation status of CEACAM19 as well as the expression profiles of RPL29 and FCGR2C are statistically significant for the distinction between survival groups (p-value < 0.05).
Publisher’s Note: MDPI stays neutral with regard to jurisdictional claims in published maps and institutional affiliations.

