
CFTR Rescue by Lumacaftor (VX-809) Induces an Extensive Reorganization of Mitochondria in the Cystic Fibrosis Bronchial Epithelium

 , , , , , and
Abstract
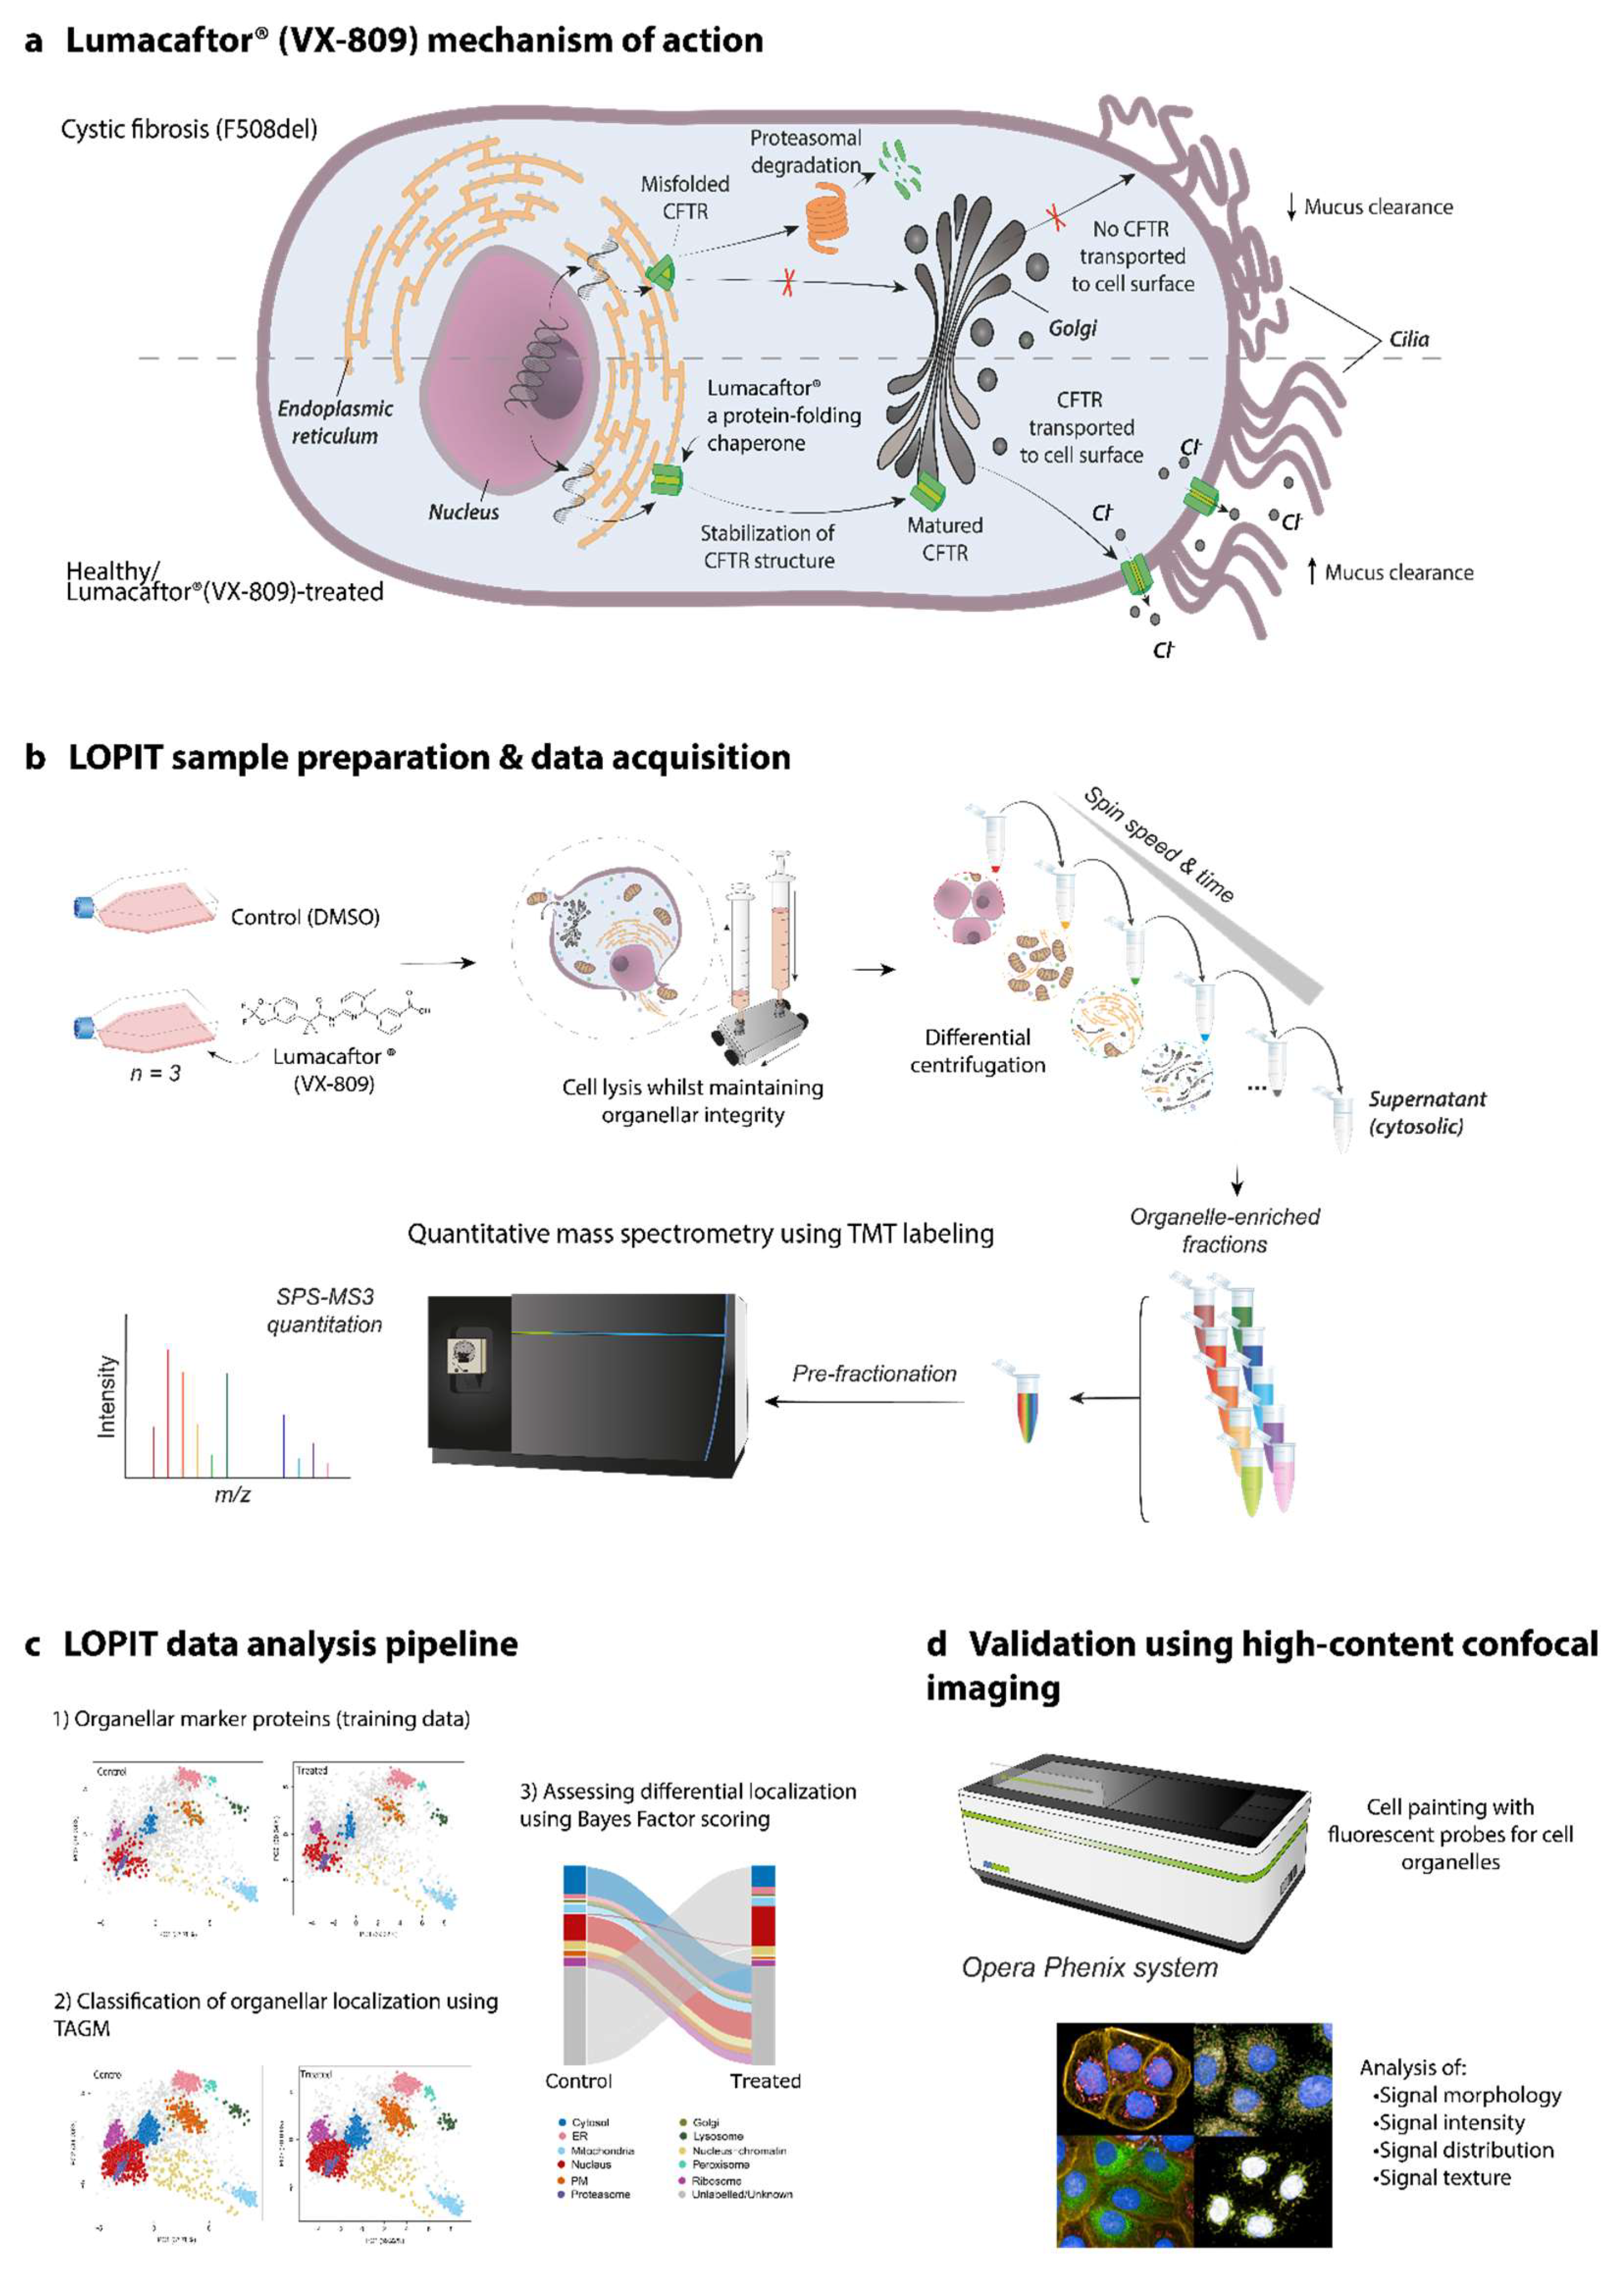
:1. Introduction
1.1. CFTR Biogenesis
1.2. Protein Alterations in CF
2. Results
2.1. Relative Protein Expression Data
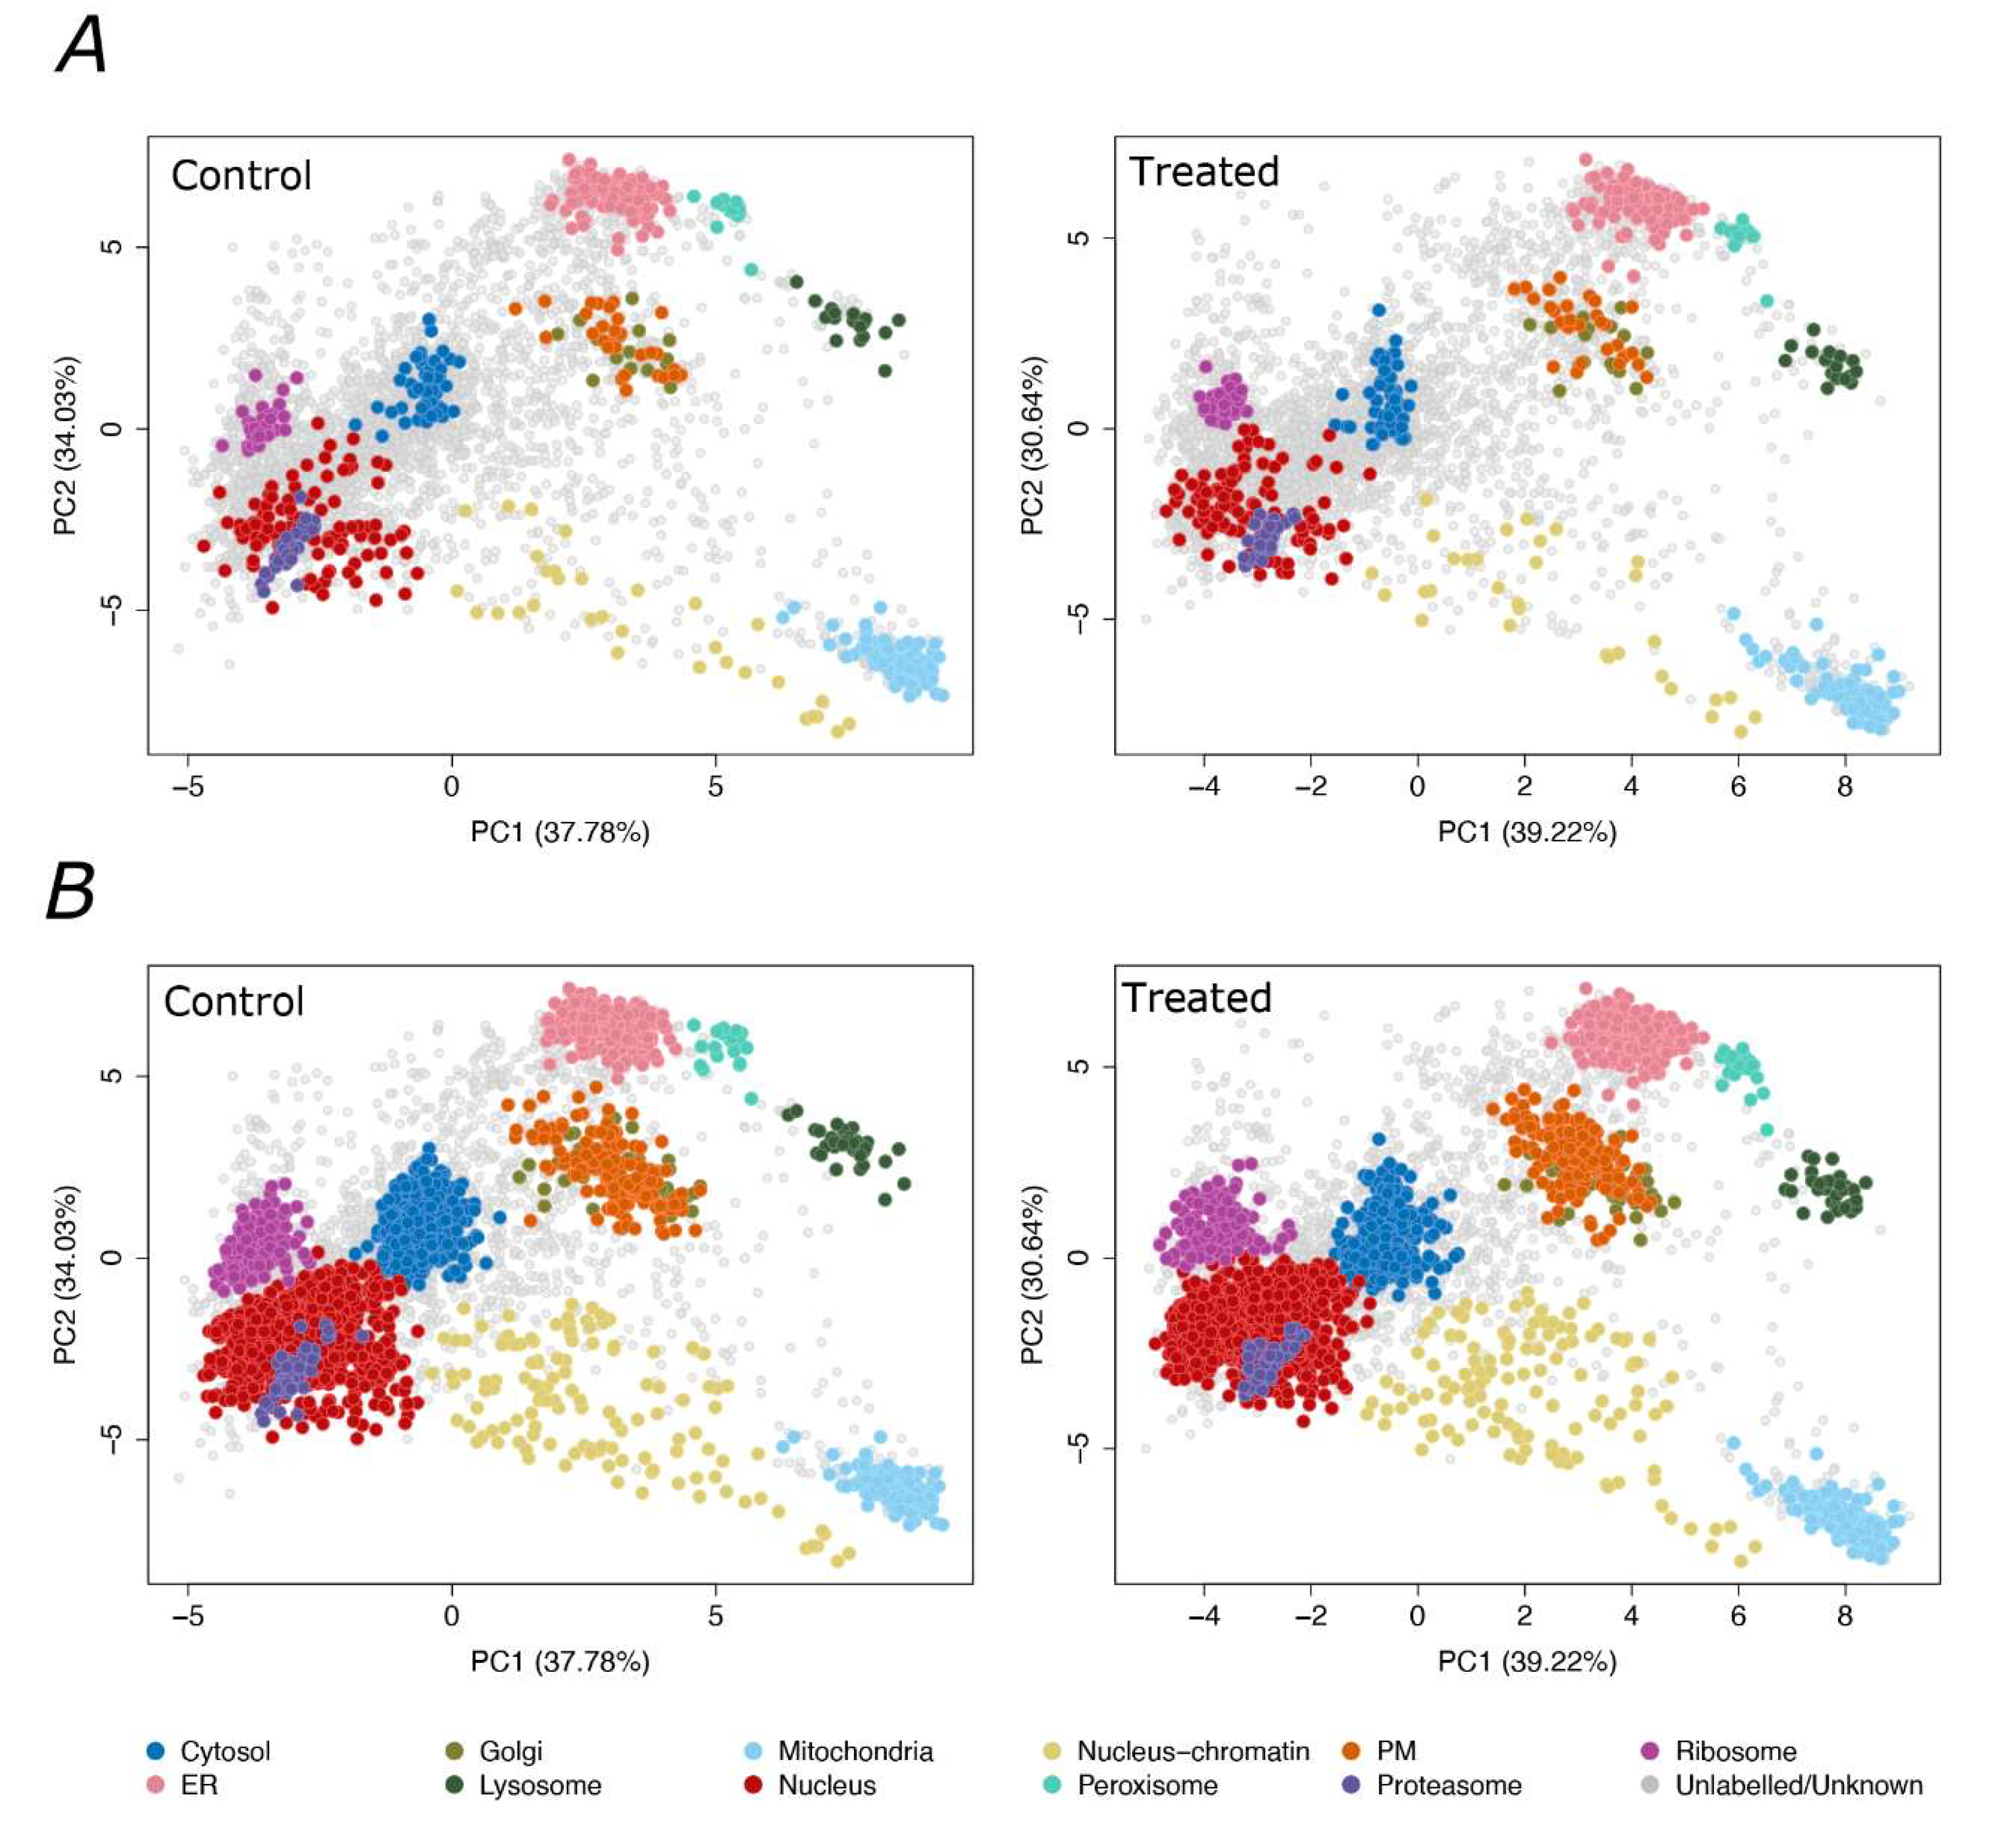
2.2. LOPIT-DC for F508del-CFTR CFBE41o- Cells
2.3. The CFBE41o- Subcellular Proteome before and after VX-809 Treatment
2.4. Identification of Differential Localized Proteins
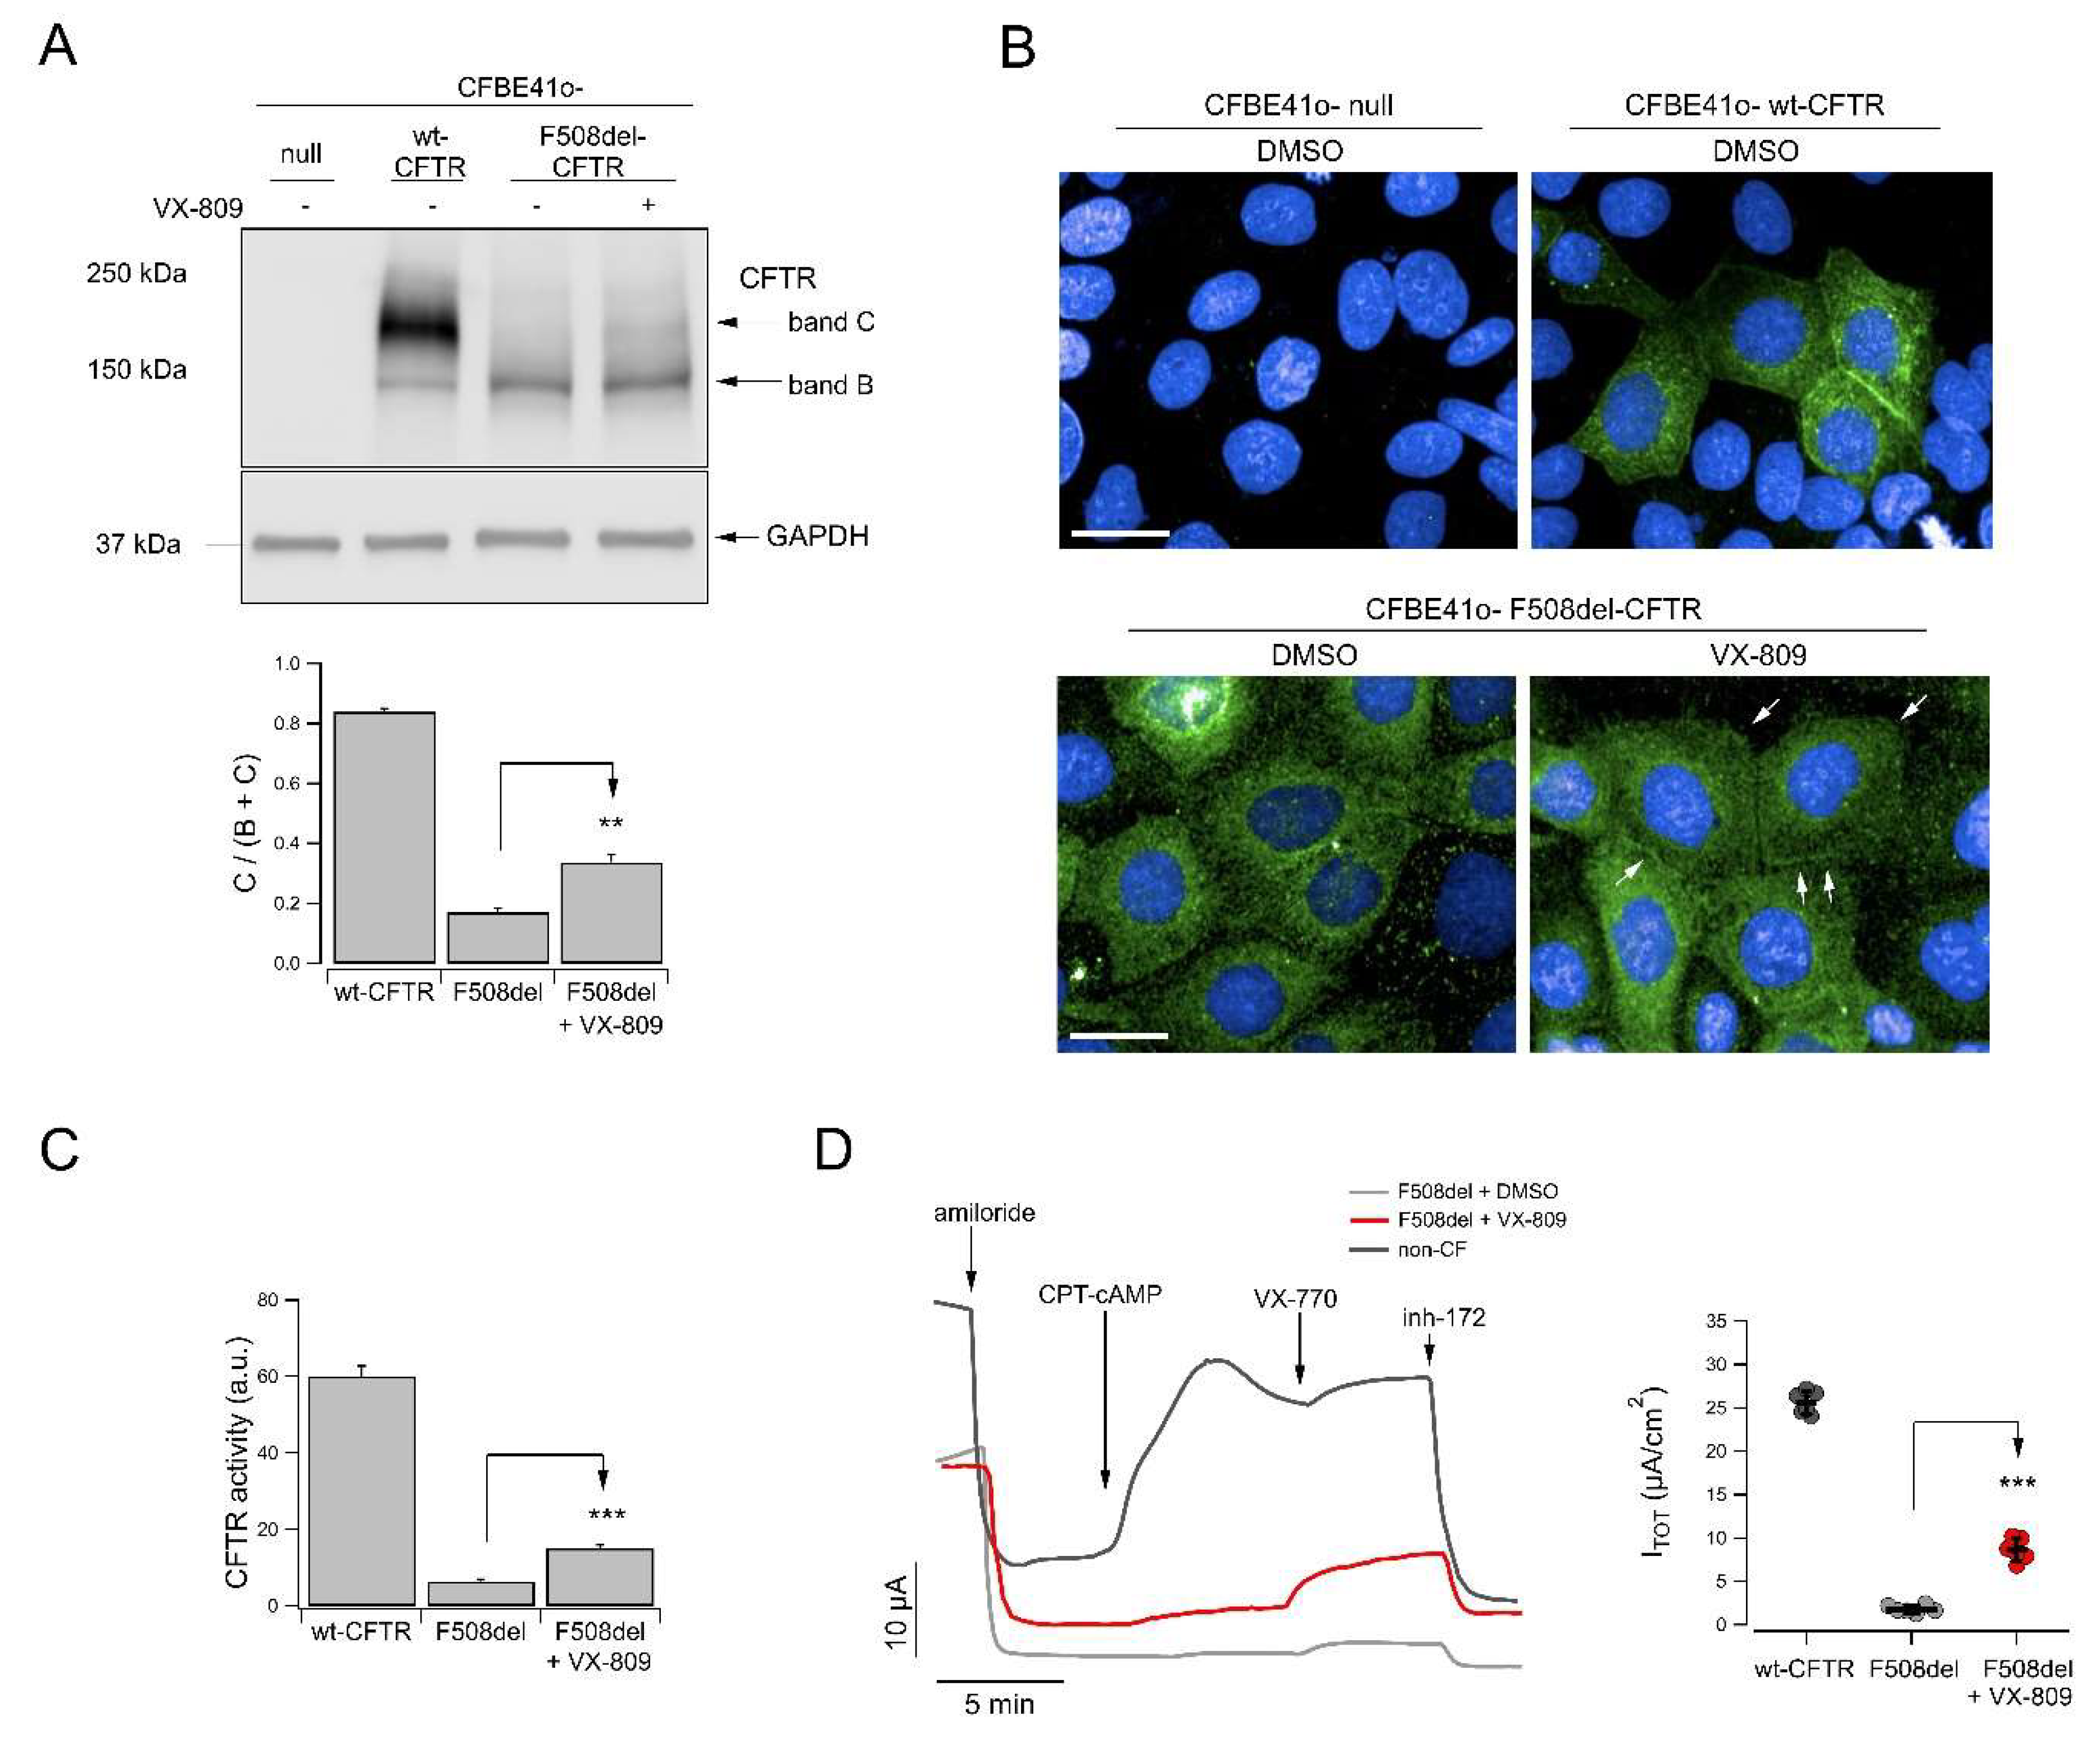
2.5. CFTR Expression and Localization
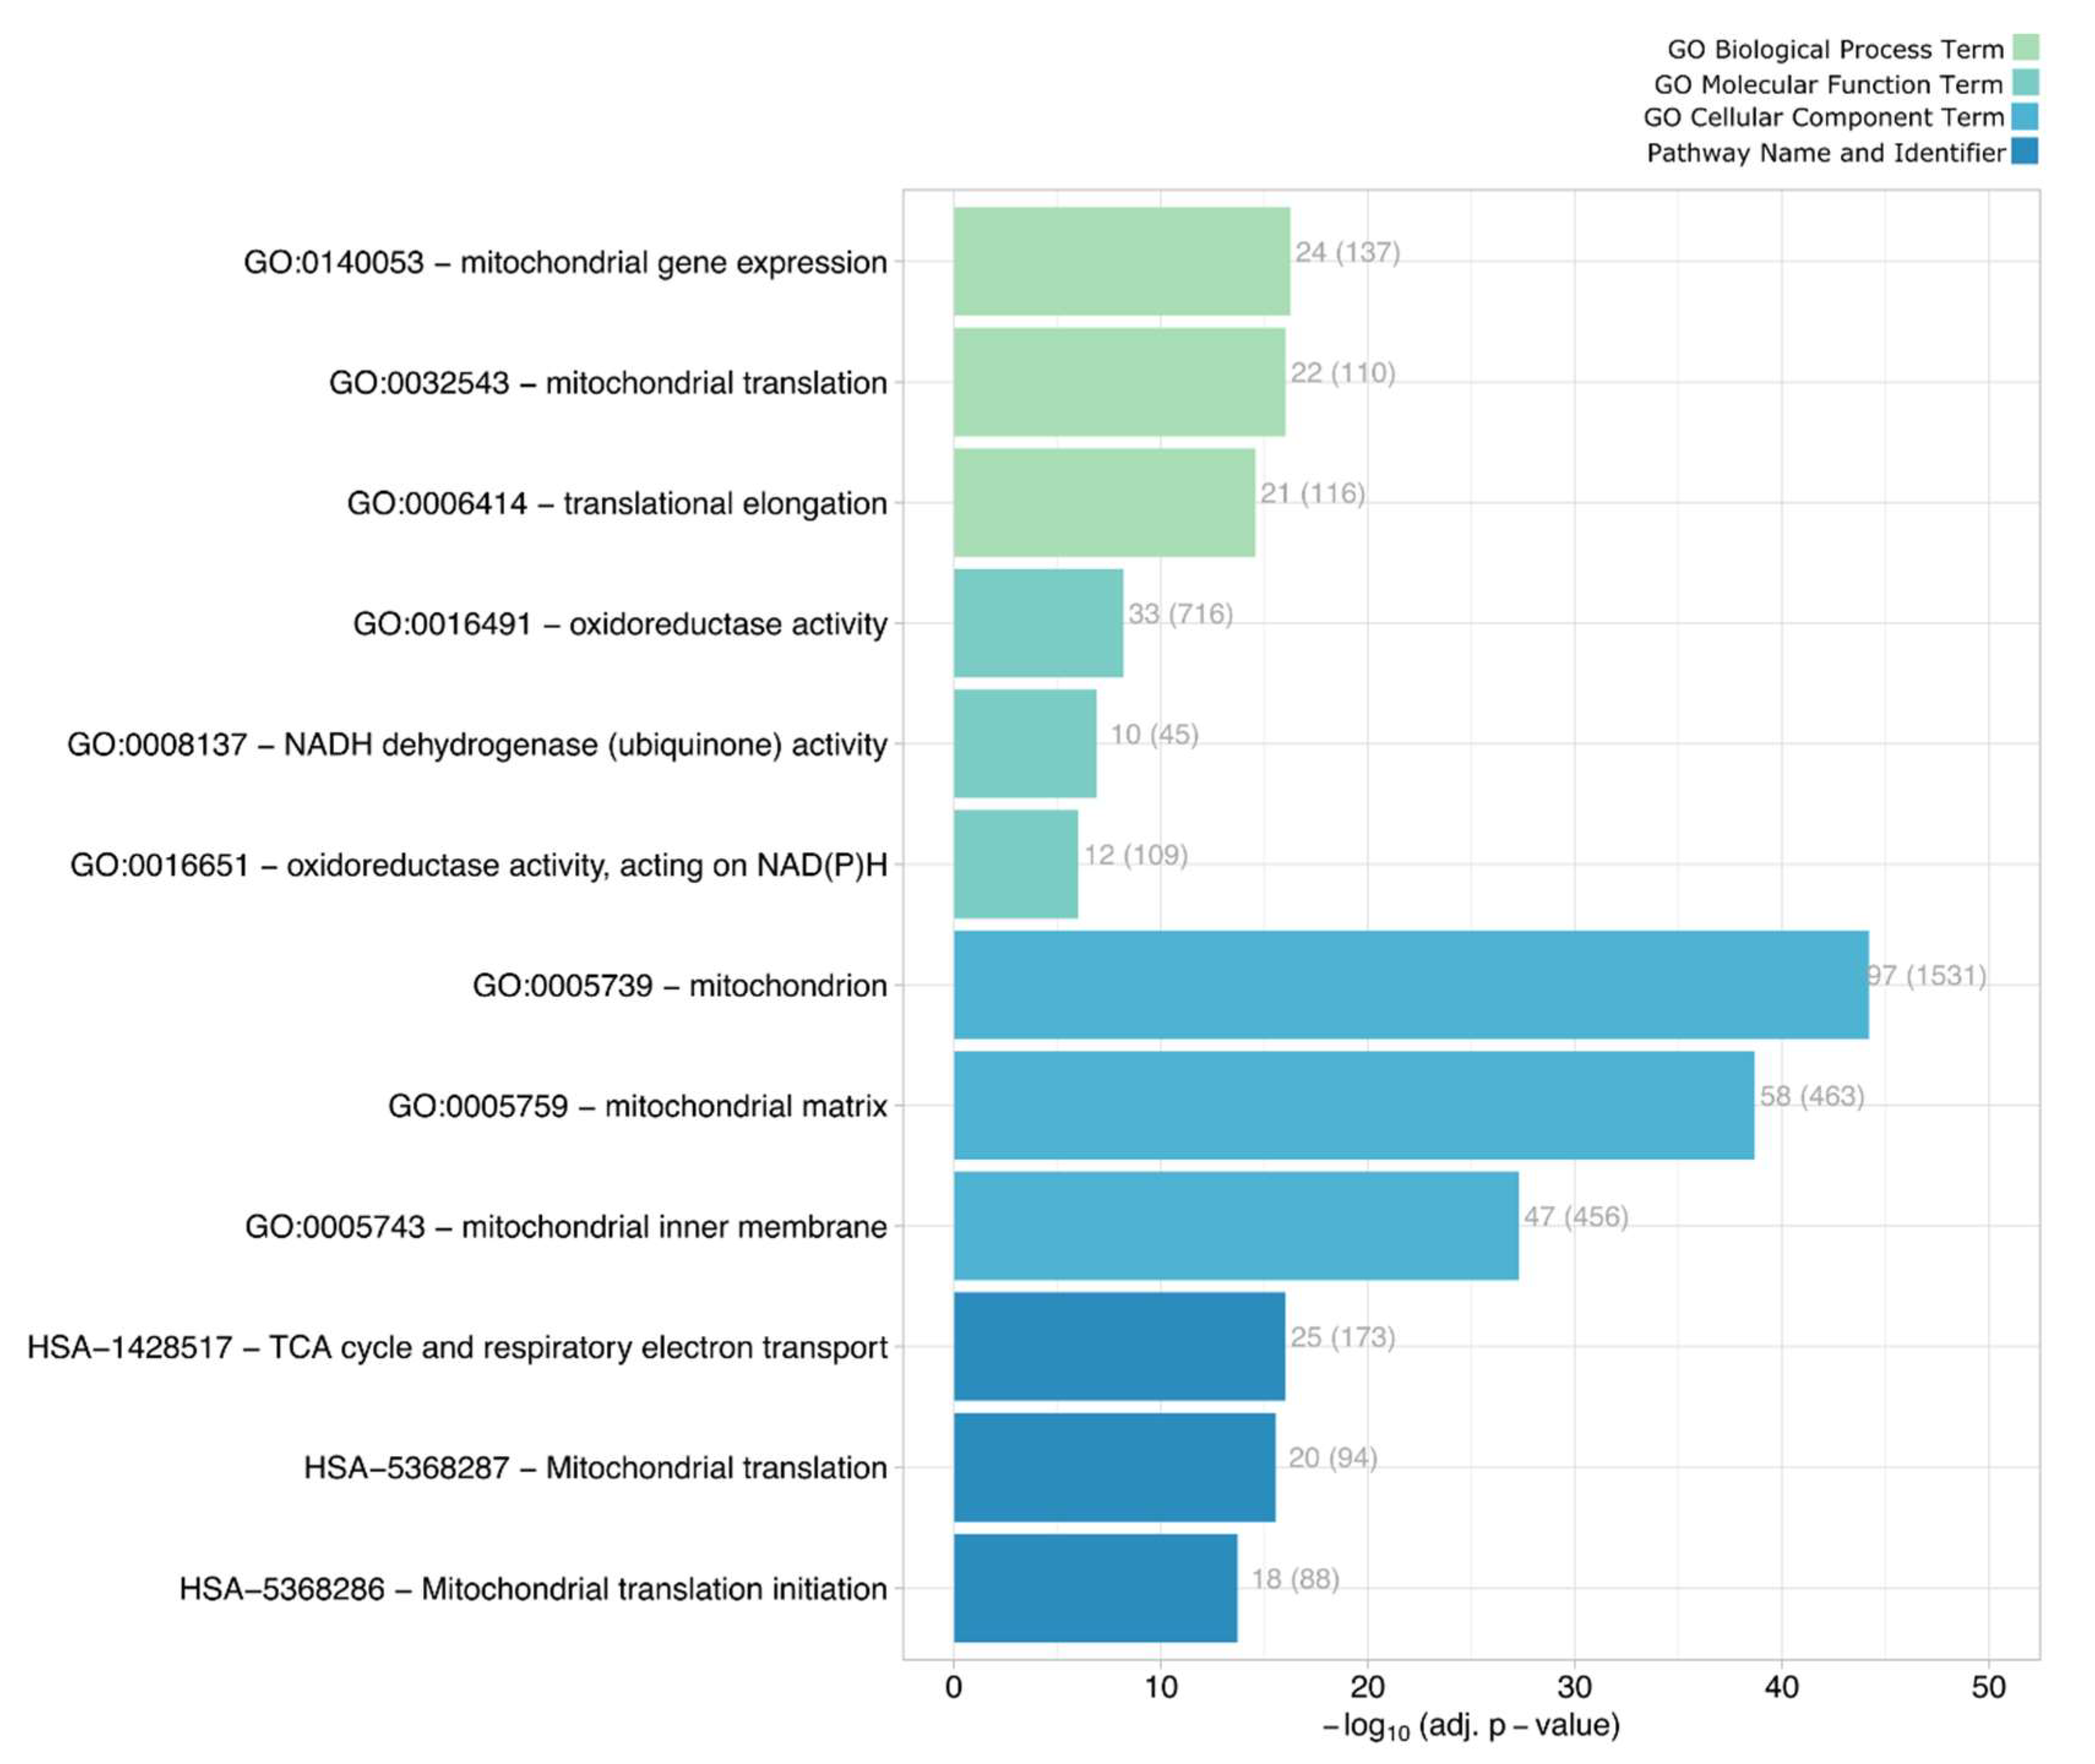
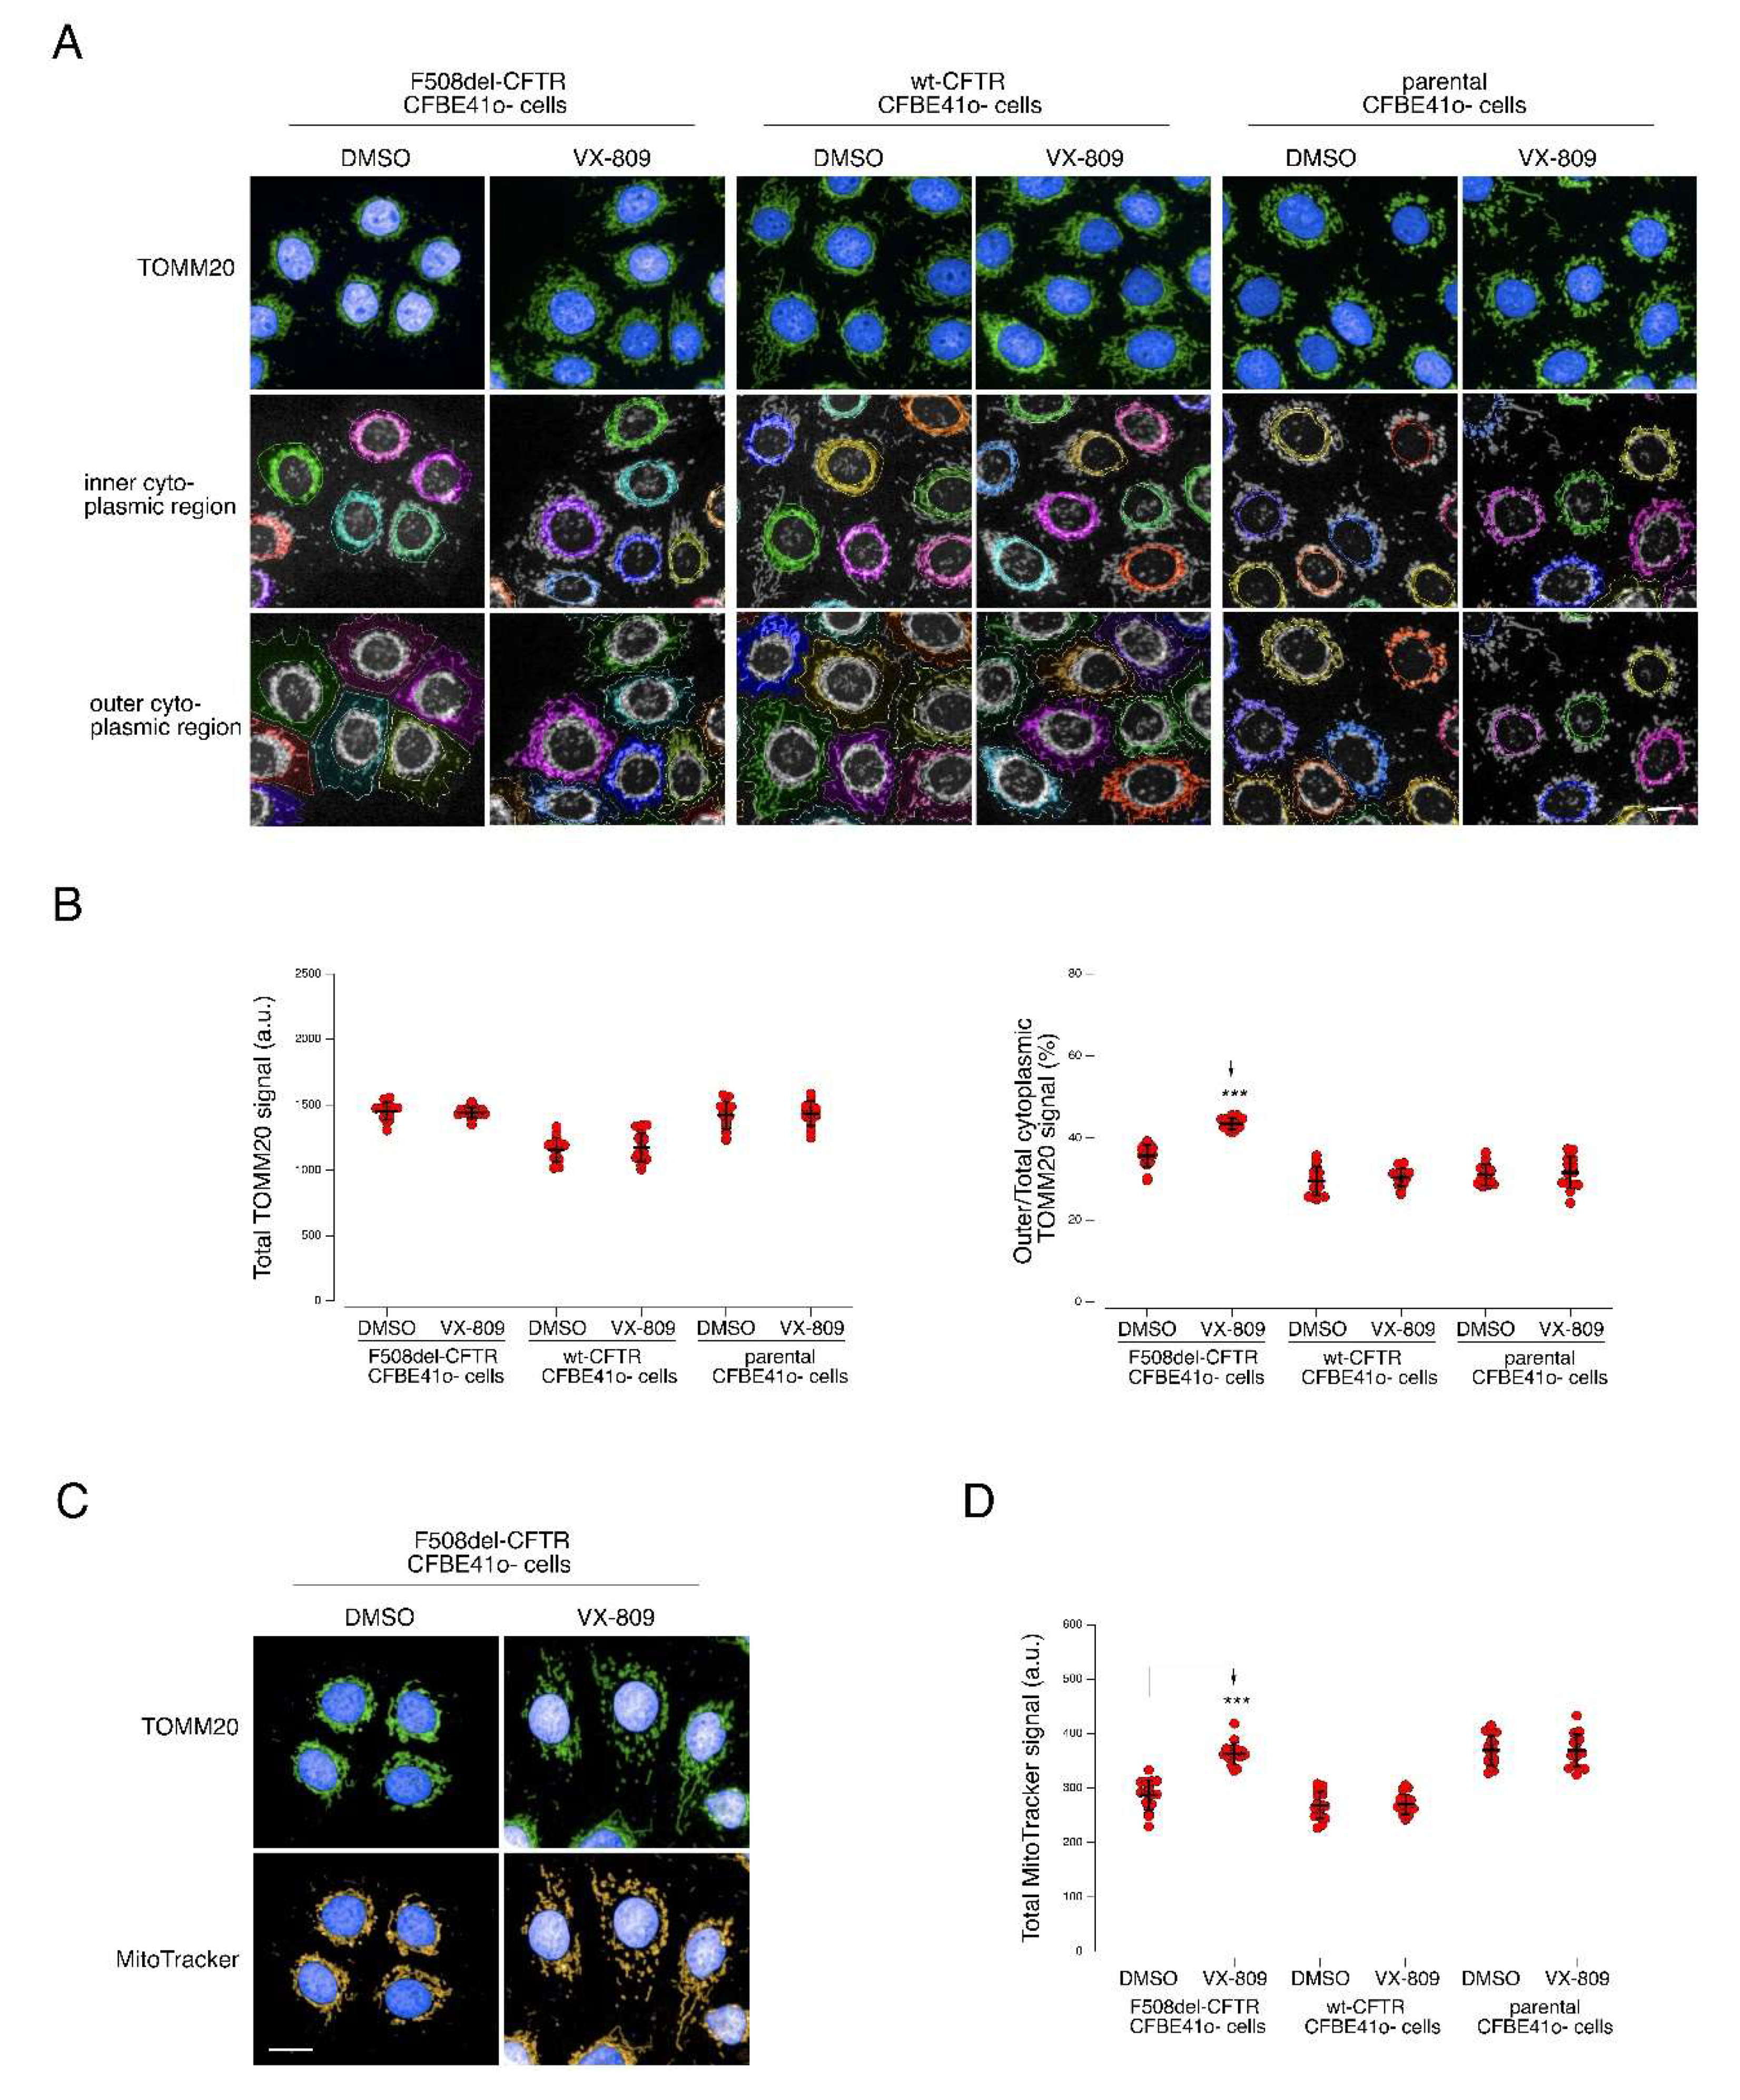
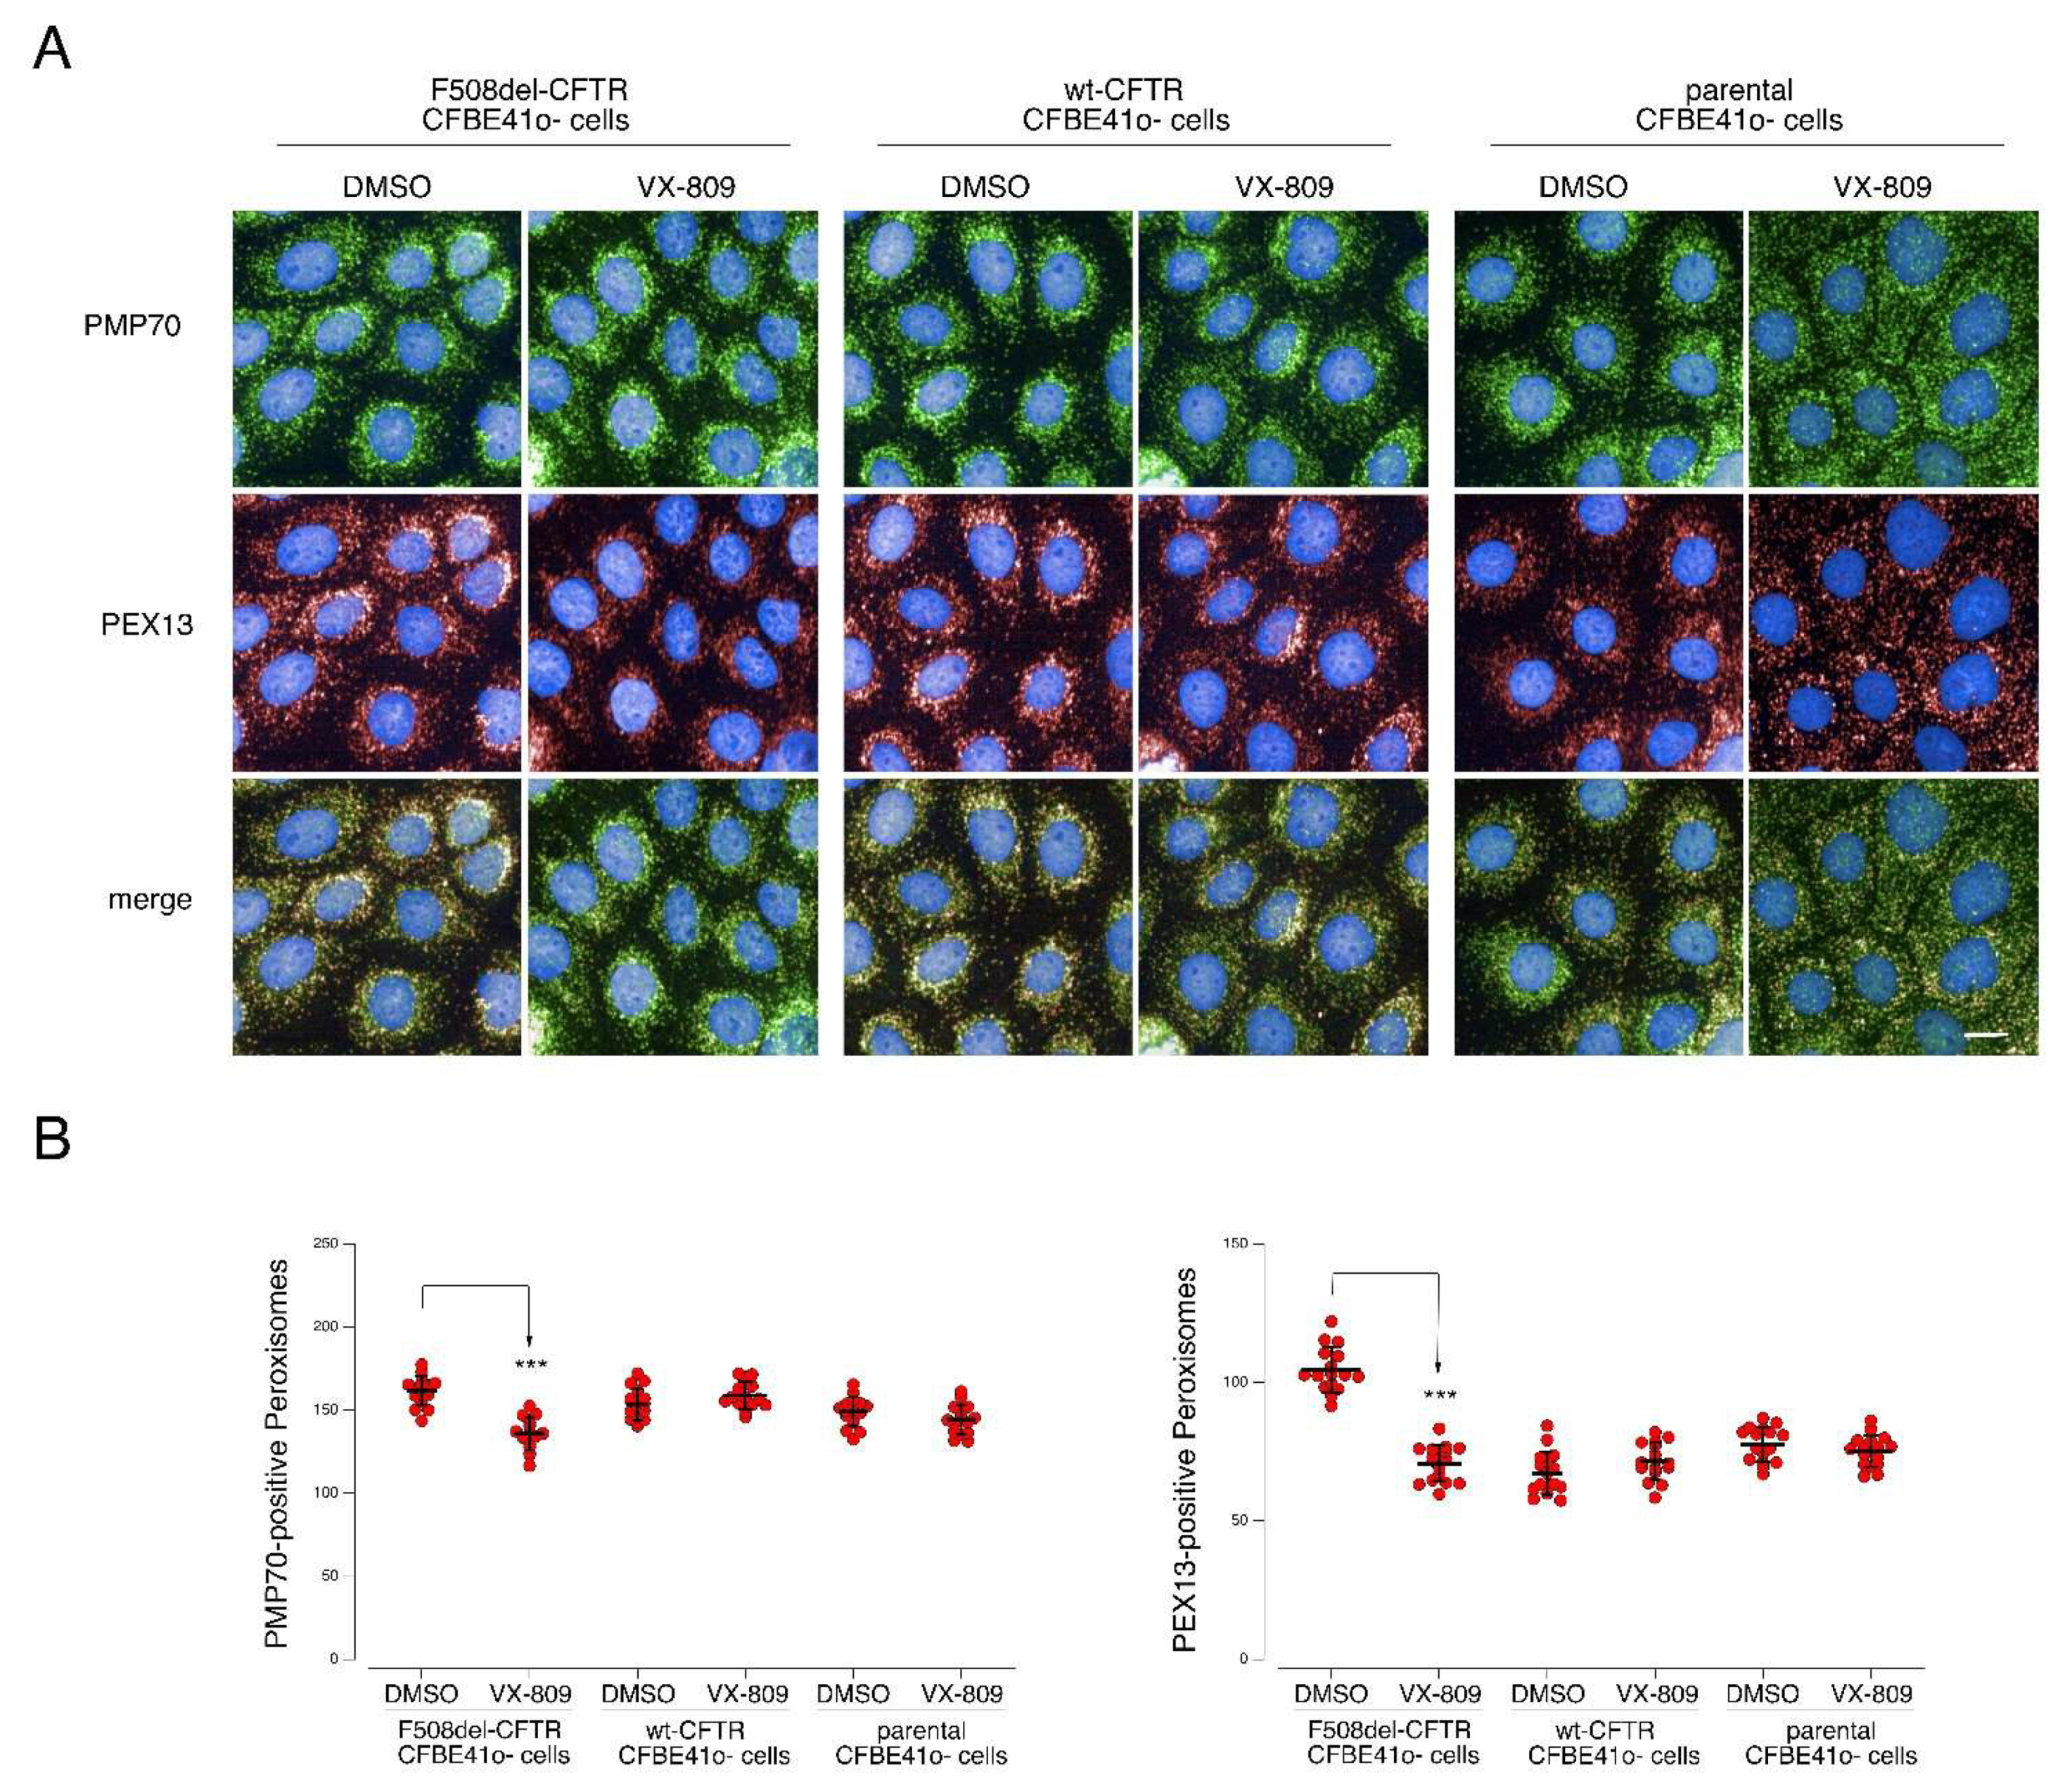
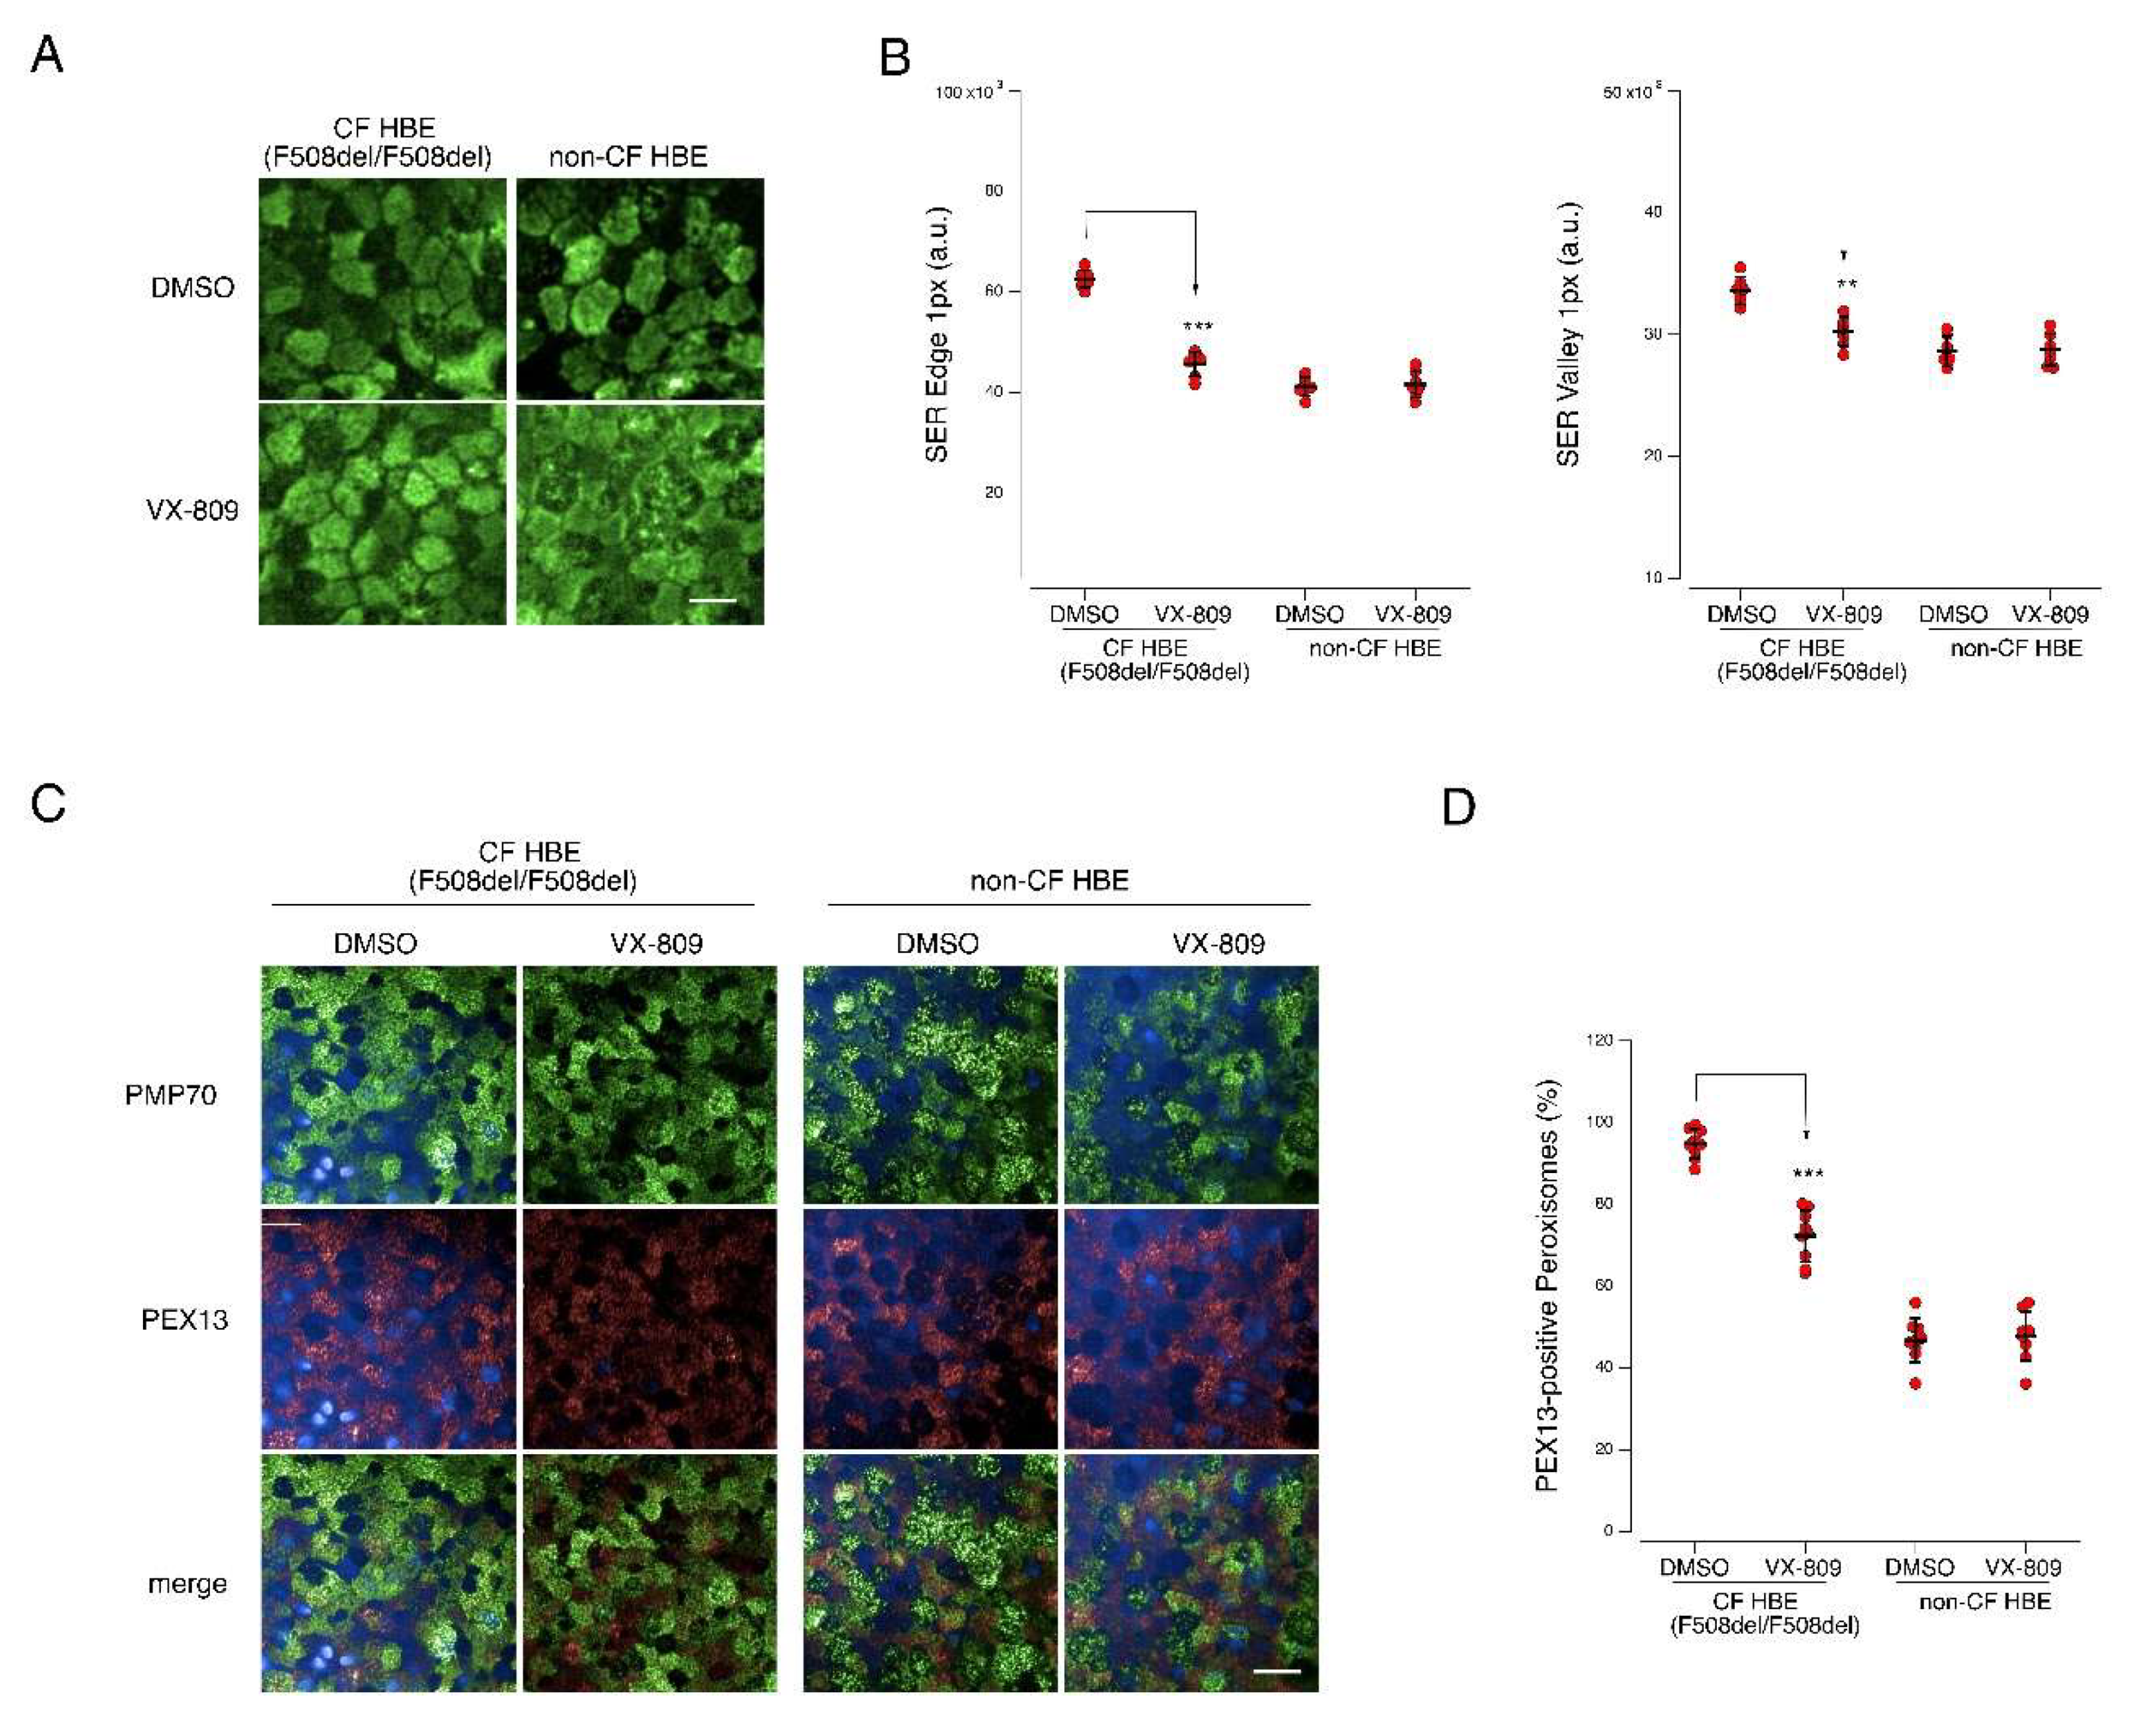
2.6. Mitochondrial and Peroxisomal Reorganization
3. Discussion
4. Materials and Methods
4.1. Chemicals, Reagents and Instruments
4.2. CFBE41o- Cell Culture
4.3. Expression Proteomics: Sample Preparation and SWATH Data Acquisition
4.4. SWATH Data Analysis
4.5. LOPIT-DC
Cell Culture and VX-809 Treatment
4.6. Cell Lysis and Subcellular Fractionation
4.7. Evaluation of Organelles Separation through Western-Blot (WB)
4.8. Protein Digestion and TMT Labelling
4.9. Peptide Fractionation and LC-MS/MS Analysis
4.10. LOPIT-DC Data Processing
4.11. Statistical Analysis of Differential Localization
4.12. Enrichment Analysis
4.13. YFP-Based Assay for CFTR Activity
4.14. CFTR Localization
4.15. Western Blot for the Evaluation of VX-809 Corrector Activity
4.16. Culture and Differentiation of Primary Bronchial Epithelial Cells
4.17. Analysis of CFTR-Mediated Transepithelial Ion Transport in Primary Bronchial Epithelial Cells
4.18. Analysis of Mitochondria Network and Peroxisomal Distribution
Supplementary Materials
Author Contributions
Funding
Institutional Review Board Statement
Informed Consent Statement
Data Availability Statement
Acknowledgments
Conflicts of Interest
References
- CONSORTIUM, TCFGA. Worldwide survey of the delta F508 mutation--report from the cystic fibrosis genetic analysis consortium. Am. J. Hum. Genet. 1990, 47, 354–359. Available online: http://www.ncbi.nlm.nih.gov/pubmed/2378364%0Ahttp://www.pubmedcentral.nih.gov/articlerender.fcgi?artid=PMC1683705 (accessed on 30 July 2021).
- Lukacs, G.; Chang, X.; Bear, C.; Kartner, N.; Mohamed, A.; Riordan, J.; Grinstein, S. The delta F508 mutation decreases the stability of cystic fibrosis transmembrane conductance regulator in the plasma membrane. Determination of functional half-lives on transfected cells. J. Biol. Chem. 1993, 268, 21592–21598. [Google Scholar] [CrossRef]
- Kleizen, B.; van Willigen, M.; Mijnders, M.; Peters, F.; Grudniewska, M.; Hillenaar, T.; Thomas, A.; Kooijman, L.; Peters, K.W.; Frizzell, R.; et al. Co-Translational Folding of the First Transmembrane Domain of ABC-Transporter CFTR is Supported by Assembly with the First Cytosolic Domain. J. Mol. Biol. 2021, 433, 166955. [Google Scholar] [CrossRef]
- Kaminskyy, V.; Zhivotovsky, B. Proteases in autophagy. Biochim. Biophys. Acta BBA Proteins Proteom. 2012, 1824, 44–50. [Google Scholar] [CrossRef]
- Vashist, S.; Ng, D.T. Misfolded proteins are sorted by a sequential checkpoint mechanism of ER quality control. J. Cell Biol. 2004, 165, 41–52. [Google Scholar] [CrossRef] [Green Version]
- Farinha, C.M.; Matos, P.; Amaral, M.D. Control of cystic fibrosis transmembrane conductance regulator membrane trafficking: Not just from the endoplasmic reticulum to the Golgi. FEBS J. 2013, 280, 4396–4406. [Google Scholar] [CrossRef]
- Ameen, N.; Silvis, M.; Bradbury, N.A. Endocytic trafficking of CFTR in health and disease. J. Cyst. Fibros. 2007, 6, 1–14. [Google Scholar] [CrossRef] [Green Version]
- Engevik, A.C.; Goldenring, J.R. Trafficking Ion Transporters to the Apical Membrane of Polarized Intestinal Enterocytes. Cold Spring Harb. Perspect. Biol. 2017, 10, a027979. [Google Scholar] [CrossRef] [Green Version]
- Okiyoneda, T.; Veit, G.; Sakai, R.; Aki, M.; Fujihara, T.; Higashi, M.; Susuki-Miyata, S.; Miyata, M.; Fukuda, N.; Yoshida, A.; et al. Chaperone-Independent Peripheral Quality Control of CFTR by RFFL E3 Ligase. Dev. Cell 2018, 44, 694.e7–708.e7. [Google Scholar] [CrossRef] [Green Version]
- Hanrahan, J.W.; Sampson, H.M.; Thomas, D.Y. Novel pharmacological strategies to treat cystic fibrosis. Trends Pharmacol. Sci. 2013, 34, 119–125. [Google Scholar] [CrossRef]
- Gentzsch, M.; Chang, X.-B.; Cui, L.; Wu, Y.; Ozols, V.V.; Choudhury, A.; Pagano, R.E.; Riordan, J.R. Endocytic Trafficking Routes of Wild Type and ΔF508 Cystic Fibrosis Transmembrane Conductance Regulator. Mol. Biol. Cell 2004, 15, 2684–2696. [Google Scholar] [CrossRef]
- Pankow, S.; Bamberger, C.; Yates, J.R. A posttranslational modification code for CFTR maturation is altered in cystic fibrosis. Sci. Signal. 2019, 12, eaan7984. [Google Scholar] [CrossRef]
- Liessi, N.; Pedemonte, N.; Armirotti, A.; Braccia, C. Proteomics and Metabolomics for Cystic Fibrosis Research. Int. J. Mol. Sci. 2020, 21, 5439. [Google Scholar] [CrossRef]
- Fiedorczuk, K.; Chen, J. Mechanism of CFTR correction by type I folding correctors. Cell 2022, 185, 158.e11–168.e11. [Google Scholar] [CrossRef]
- Ren, H.Y.; Grove, D.E.; De La Rosa, O.; Houck, S.A.; Sopha, P.; Van Goor, F.; Hoffman, B.J.; Cyr, D.M. VX-809 corrects folding defects in cystic fibrosis transmembrane conductance regulator protein through action on membrane-spanning domain. Mol. Biol. Cell 2013, 24, 3016–3024. [Google Scholar] [CrossRef]
- Geladaki, A.; Britovšek, N.K.; Breckels, L.M.; Smith, T.S.; Vennard, O.L.; Mulvey, C.M.; Crook, O.M.; Gatto, L.; Lilley, K.S. Combining LOPIT with differential ultracentrifugation for high-resolution spatial proteomics. Nat. Commun. 2019, 10, 331. [Google Scholar] [CrossRef] [Green Version]
- Marinko, J.T.; Huang, H.; Penn, W.D.; Capra, J.A.; Schlebach, J.P.; Sanders, C.R. Folding and Misfolding of Human Membrane Proteins in Health and Disease: From Single Molecules to Cellular Proteostasis. Chem. Rev. 2019, 119, 5537–5606. [Google Scholar] [CrossRef]
- Kincaid, M.M.; Cooper, A.A. Misfolded Proteins Traffic from the Endoplasmic Reticulum (ER) Due to ER Export Signals. Mol. Biol. Cell 2007, 18, 455–463. [Google Scholar] [CrossRef] [Green Version]
- Schröder, M.; Kaufman, R.J. The mammalian unfolded protein response. Annu. Rev. Biochem. 2005, 74, 739–789. [Google Scholar] [CrossRef]
- Wang, X.; Terpstra, E.J. Ubiquitin receptors and protein quality control. J. Mol. Cell. Cardiol. 2013, 55, 73–84. [Google Scholar] [CrossRef] [Green Version]
- Sharma, M.; Pampinella, F.; Nemes, C.; Benharouga, M.; So, J.; Du, K.; Bache, K.G.; Papsin, B.; Zerangue, N.; Stenmark, H.; et al. Misfolding diverts CFTR from recycling to degradation: Quality control at early endosomes. J. Cell Biol. 2004, 164, 923–933. [Google Scholar] [CrossRef] [Green Version]
- Braccia, C.; Tomati, V.; Caci, E.; Pedemonte, N.; Armirotti, A. SWATH label-free proteomics for cystic fibrosis research. J. Cyst. Fibros. 2018, 18, 501–506. [Google Scholar] [CrossRef]
- De Duve, C. Tissue Fraction-Past and Present. J. Cell Biol. 1971, 50, 20d–55d. [Google Scholar] [CrossRef] [Green Version]
- Trotter, M.W.B.; Sadowski, P.G.; Dunkley, T.P.J.; Groen, A.J.; Lilley, K.S. Improved sub-cellular resolution via simultaneous analysis of organelle proteomics data across varied experimental conditions. Proteomics 2010, 10, 4213–4219. [Google Scholar] [CrossRef]
- Breckels, L.M.; Mulvey, C.M.; Lilley, K.S.; Gatto, L. A Bioconductor workflow for processing and analysing spatial proteomics data [version 2; referees: 2 approved]. F1000Research 2018, 5, 2926. [Google Scholar] [CrossRef]
- Shin, J.J.H.; Crook, O.M.; Borgeaud, A.C.; Cattin-Ortolá, J.; Peak-Chew, S.Y.; Breckels, L.M.; Gillingham, A.K.; Chadwick, J.; Lilley, K.S.; Munro, S. Spatial proteomics defines the content of trafficking vesicles captured by golgin tethers. Nat. Commun. 2020, 11, 1–13. [Google Scholar] [CrossRef]
- Bradbury, N.A. Intracellular CFTR: Localization and Function. Physiol. Rev. 1999, 79, S175–S191. [Google Scholar] [CrossRef]
- Crook, O.M.; Smith, T.; Elzek, M.; Lilley, K.S. Moving Profiling Spatial Proteomics Beyond Discrete Classification. Proteomics 2020, 20, e1900392. [Google Scholar] [CrossRef]
- Capurro, V.; Tomati, V.; Sondo, E.; Renda, M.; Borrelli, A.; Pastorino, C.; Guidone, D.; Venturini, A.; Giraudo, A.; Bertozzi, S.M.; et al. Partial Rescue of F508del-CFTR Stability and Trafficking Defects by Double Corrector Treatment. Int. J. Mol. Sci. 2021, 22, 5262. [Google Scholar] [CrossRef]
- Pedemonte, N.; Lukacs, G.L.; Du, K.; Caci, E.; Zegarra-Moran, O.; Galietta, L.J.; Verkman, A. Small-molecule correctors of defective F508-CFTR cellular processing identified by high-throughput screening. J. Clin. Investig. 2005, 115, 2564–2571. [Google Scholar] [CrossRef]
- Favia, M.; de Bari, L.; Bobba, A.; Atlante, A. An Intriguing Involvement of Mitochondria in Cystic Fibrosis. J. Clin. Med. 2019, 8, 1890. [Google Scholar] [CrossRef] [Green Version]
- Valdivieso, A.G.; Santa-Coloma, T.A. CFTR activity and mitochondrial function. Redox Biol. 2013, 1, 190–202. [Google Scholar] [CrossRef] [Green Version]
- Atlante, A. Mitochondria and cystic fibrosis transmembrane conductance regulator dialogue: Some news. J. Rare Dis. Res. Treat. 2016, 1, 23–29. [Google Scholar] [CrossRef]
- Kleme, M.L.; Sané, A.; Garofalo, C.; Seidman, E.; Brochiero, E.; Berthiaume, Y.; Levy, E. CFTR Deletion Confers Mitochondrial Dysfunction and Disrupts Lipid Homeostasis in Intestinal Epithelial Cells. Nutrients 2018, 10, 836. [Google Scholar] [CrossRef] [Green Version]
- Giedt, R.J.; Pfeiffer, D.R.; Matzavinos, A.; Kao, C.-Y.; Alevriadou, B.R. Mitochondrial Dynamics and Motility Inside Living Vascular Endothelial Cells: Role of Bioenergetics. Ann. Biomed. Eng. 2012, 40, 1903–1916. [Google Scholar] [CrossRef] [Green Version]
- Kuznetsov, A.V.; Hermann, M.; Saks, V.; Hengster, P.; Margreiter, R. The cell-type specificity of mitochondrial dynamics. Int. J. Biochem. Cell Biol. 2009, 41, 1928–1939. [Google Scholar] [CrossRef]
- Waterham, H.R.; Ebberink, M.S. Genetics and molecular basis of human peroxisome biogenesis disorders. Biochim. Biophys. Acta BBA Mol. Basis Dis. 2012, 1822, 1430–1441. [Google Scholar] [CrossRef] [Green Version]
- Lee, M.Y.; Sumpter, R.; Zou, Z.; Sirasanagandla, S.; Wei, Y.; Mishra, P.; Rosewich, H.; I Crane, D.; Levine, B. Peroxisomal protein PEX 13 functions in selective autophagy. EMBO Rep. 2016, 18, 48–60. [Google Scholar] [CrossRef] [Green Version]
- Patergnani, S.; Vitto, V.A.; Pinton, P.; Rimessi, A. Mitochondrial Stress Responses and “Mito-Inflammation” in Cystic Fibrosis. Front. Pharmacol. 2020, 11. [Google Scholar] [CrossRef]
- Atlante, A.; Favia, M.; Bobba, A.; Guerra, L.; Casavola, V.; Reshkin, S.J. Characterization of mitochondrial function in cells with impaired cystic fibrosis transmembrane conductance regulator (CFTR) function. J. Bioenerg. Biomembr. 2016, 48, 197–210. [Google Scholar] [CrossRef]
- McKelvey, M.C.; Weldon, S.; McAuley, D.; Mall, M.A.; Taggart, C.C. Targeting Proteases in Cystic Fibrosis Lung Disease. Paradigms, Progress, and Potential. Am. J. Respir. Crit. Care Med. 2020, 201, 141–147. [Google Scholar] [CrossRef] [Green Version]
- Yuan, L.; Zou, C.; Ge, W.; Liu, Y.; Hu, B.; Wang, J.; Lin, B.; Li, Y.; Ma, E. A novel cathepsin L inhibitor prevents the progression of idiopathic pulmonary fibrosis. Bioorganic Chem. 2019, 94, 103417. [Google Scholar] [CrossRef]
- Hannaford, J.; Guo, H.; Chen, X. Involvement of cathepsins B and L in inflammation and cholesterol trafficking protein NPC2 secretion in macrophages. Obesity 2012, 21, 1586–1595. [Google Scholar] [CrossRef]
- Weiss-Sadan, T.; Maimoun, D.; Oelschlagel, D.; Kaschani, F.; Misiak, D.; Gaikwad, H.; Ben-Nun, Y.; Merquiol, E.; Anaki, A.; Tsvirkun, D.; et al. Cathepsins Drive Anti-Inflammatory Activity by Regulating Autophagy and Mitochondrial Dynamics in Macrophage Foam Cells. Cell. Physiol. Biochem. 2019, 53, 550–572. [Google Scholar] [CrossRef] [Green Version]
- Schwanhäusser, B.; Gossen, M.; Dittmar, G.; Selbach, M. Global analysis of cellular protein translation by pulsed SILAC. Proteomics 2009, 9, 205–209. [Google Scholar] [CrossRef]
- Snider, J.; Wang, D.; Bogenhagen, D.F.; Haley, J.D. Pulse SILAC Approaches to the Measurement of Cellular Dynamics. Adv. Exp. Med. Biol. 2019, 1140, 575–583. [Google Scholar] [CrossRef]
- Pedemonte, N.; Bertozzi, F.; Caci, E.; Sorana, F.; Di Fruscia, P.; Tomati, V.; Ferrera, L.; Rodríguez-Gimeno, A.; Berti, F.; Pesce, E.; et al. Discovery of a picomolar potency pharmacological corrector of the mutant CFTR chloride channel. Sci. Adv. 2020, 6, eaay9669. [Google Scholar] [CrossRef] [Green Version]
- Galietta, L.J.V.; Haggie, P.M.; Verkman, A.S. Green fluorescent protein-based halide indicators with improved chloride and iodide affinities. FEBS Lett. 2001, 499, 220–224. [Google Scholar] [CrossRef] [Green Version]
- Sondo, E.; Tomati, V.; Caci, E.; Esposito, A.I.; Pfeffer, U.; Pedemonte, N.; Galietta, L.J.V. Rescue of the mutant CFTR chloride channel by pharmacological correctors and low temperature analyzed by gene expression profiling. Am. J. Physiol. Physiol. 2011, 301, C872–C885. [Google Scholar] [CrossRef] [Green Version]
- Wu, J.X.; Song, X.; Pascovici, D.; Zaw, T.; Care, N.; Krisp, C.; Molloy, M. SWATH Mass Spectrometry Performance Using Extended Peptide MS/MS Assay Libraries. Mol. Cell. Proteom. 2016, 15, 2501–2514. [Google Scholar] [CrossRef] [Green Version]
- Pang, Z.; Chong, J.; Zhou, G.; de Lima Morais, D.A.; Chang, L.; Barrette, M.; Gauthier, C.; Jacques, P.-É.; Li, S.; Xia, J. MetaboAnalyst 5.0: Narrowing the gap between raw spectra and functional insights. Nucleic Acids Res. 2021, 49, W388–W396. [Google Scholar] [CrossRef]
- Gentleman, R.C.; Carey, V.J.; Bates, D.M.; Bolstad, B.; Dettling, M.; Dudoit, S.; Ellis, B.; Gautier, L.; Ge, Y.; Gentry, J.; et al. Bioconductor: Open software development for computational biology and bioinformatics. Genome Biol. 2004, 5, R80. [Google Scholar] [CrossRef] [PubMed] [Green Version]
- Gatto, L.; Lilley, K.S. MSnbase-an R/Bioconductor package for isobaric tagged mass spectrometry data visualization, processing and quantitation. Bioinformatics 2011, 28, 288–289. [Google Scholar] [CrossRef] [PubMed] [Green Version]
- Aitchison, J. The Statistical Analysis of Compositional Data. J. R. Stat. Soc. Ser. B 1982, 44, 139–160. [Google Scholar] [CrossRef]
- Kass, R.E.; Raftery, A.E. Bayes Factors. J. Am. Stat. Assoc. 1995, 90, 773. [Google Scholar] [CrossRef]
- Stegle, O.; Denby, K.J.; Cooke, E.J.; Wild, D.L.; Ghahramani, Z.; Borgwardt, K.M. A Robust Bayesian Two-Sample Test for Detecting Intervals of Differential Gene Expression in Microarray Time Series. J. Comput. Biol. 2010, 17, 355–367. [Google Scholar] [CrossRef]
- Pathan, M.; Keerthikumar, S.; Ang, C.-S.; Gangoda, L.; Quek, C.Y.; Williamson, N.A.; Mouradov, D.; Sieber, O.M.; Simpson, R.J.; Salim, A.; et al. FunRich: An open access standalone functional enrichment and interaction network analysis tool. Proteomics 2015, 15, 2597–2601. [Google Scholar] [CrossRef]
- Sondo, E.; Falchi, F.; Caci, E.; Ferrera, L.; Giacomini, E.; Pesce, E.; Tomati, V.; Bertozzi, S.M.; Goldoni, L.; Armirotti, A.; et al. Pharmacological Inhibition of the Ubiquitin Ligase RNF5 Rescues F508del-CFTR in Cystic Fibrosis Airway Epithelia. Cell Chem. Biol. 2018, 25, 891.e8–905.e8. [Google Scholar] [CrossRef]
- Tomati, V.; Caci, E.; Ferrera, L.; Pesce, E.; Sondo, E.; Cholon, D.M.; Quinney, N.L.; Boyles, S.E.; Armirotti, A.; Ravazzolo, R.; et al. Thymosin α-1 does not correct F508del-CFTR in cystic fibrosis airway epithelia. JCI Insight 2018, 3, e98699. [Google Scholar] [CrossRef] [Green Version]
- Ma, T.; Thiagarajah, J.R.; Yang, H.; Sonawane, N.D.; Folli, C.; Galietta, L.; Verkman, A. Thiazolidinone CFTR inhibitor identified by high-throughput screening blocks cholera toxin–induced intestinal fluid secretion. J. Clin. Investig. 2002, 110, 1651–1658. [Google Scholar] [CrossRef]
- Perez-Riverol, Y.; Csordas, A.; Bai, J.; Bernal-Llinares, M.; Hewapathirana, S.; Kundu, D.J.; Inuganti, A.; Griss, J.; Mayer, G.; Eisenacher, M.; et al. The PRIDE database and related tools and resources in 2019: Improving support for quantification data. Nucleic Acids Res. 2019, 47, D442–D450. [Google Scholar] [CrossRef]


| Accession | Protein Name | Gene |
|---|---|---|
| Q8WVM0 | Dimethyladenosine transferase 1, mitochondrial | TFB1M |
| Q9Y3B7 | 39S ribosomal protein L11 | MRPL11 |
| U3KQ69 | Mitochondrial GTPase 1 | MTG1 |
| Q969S9 | Ribosome-releasing factor 2 | GFM2 |
| Q96E29 | Transcription termination factor 3 | MTERF3 |
| O75616 | GTPase Era | ERAL1 |
| Q4G0N4 | NAD kinase 2 | NADK2 |
| Q5T440 | Putative transferase CAF17 | IBA57 |
| Q96D53 | Atypical kinase COQ8B | COQ8B |
| Q96DV4 | 39S ribosomal protein L38 | MRPL38 |
| Q8TAE8 | Growth arrest and DNA damage-inducible protein | GADD45GIP1 |
| Q96HY7 | 2-oxoglutarate dehydrogenase E1 | DHTKD1 |
| P82933 | 28S ribosomal protein S9, mitochondrial | MRPS9 |
| Organelle | Antigen | Supplier (Product Number) | Gene Name | MW (kDa) | Source | Dilution for WB |
|---|---|---|---|---|---|---|
| Cytosol | Alpha-Enolase | Cell signalling (3010) | ENO1 | 47 | Rabbit | 1:1000 |
| Golgi | Syntaxin-6 | Abcam (ab140607) | STX6 | 32 | Rabbit | 1:1000 |
| Plasma membrane | Alph-a1 Na+/K+ ATPase | Abcam (ab76020) | ATP1A1 | 100 | Rabbit | 1:5000 |
| ER | Calreticulin | Abcam (ab92341) | CARL | 55 | Rabbit | 1:1000 |
| Chromatin | Histone H2A | Abcam (ab18975) | HIST1H2AG | 14 | Rabbit | 1:1000 |
| Endosome | Early endosome antigen 1 | Abcam (ab109110) | EEA1 | 170 | Rabbit | 1:1000 |
| Lysosome | Lysosome-associated membrane glycoprotein 1 | Cell signalling (3243) | LAMP1 | 100 | Rabbit | 1:1000 |
| Nuclear–non-chromatin | Fibrillarin | Cell signalling (2639) | FBL | 37 | Rabbit | 1:1000 |
| Nuclear envelope | Prelamin-A/C | Abcam (ab108922) | LMNA | 70 | Rabbit | 1:1000 |
| Mitochondria | Cytochrome c oxidase subunit 4 isoform 1 (COX 1V) | Cell signalling (4850) | COX4I1 | 17 | Rabbit | 1:1000 |
Publisher’s Note: MDPI stays neutral with regard to jurisdictional claims in published maps and institutional affiliations. |
© 2022 by the authors. Licensee MDPI, Basel, Switzerland. This article is an open access article distributed under the terms and conditions of the Creative Commons Attribution (CC BY) license (https://creativecommons.org/licenses/by/4.0/).
Share and Cite
Braccia, C.; Christopher, J.A.; Crook, O.M.; Breckels, L.M.; Queiroz, R.M.L.; Liessi, N.; Tomati, V.; Capurro, V.; Bandiera, T.; Baldassari, S.; et al. CFTR Rescue by Lumacaftor (VX-809) Induces an Extensive Reorganization of Mitochondria in the Cystic Fibrosis Bronchial Epithelium. Cells 2022, 11, 1938. https://doi.org/10.3390/cells11121938
Braccia C, Christopher JA, Crook OM, Breckels LM, Queiroz RML, Liessi N, Tomati V, Capurro V, Bandiera T, Baldassari S, et al. CFTR Rescue by Lumacaftor (VX-809) Induces an Extensive Reorganization of Mitochondria in the Cystic Fibrosis Bronchial Epithelium. Cells. 2022; 11(12):1938. https://doi.org/10.3390/cells11121938
Chicago/Turabian StyleBraccia, Clarissa, Josie A. Christopher, Oliver M. Crook, Lisa M. Breckels, Rayner M. L. Queiroz, Nara Liessi, Valeria Tomati, Valeria Capurro, Tiziano Bandiera, Simona Baldassari, and et al. 2022. "CFTR Rescue by Lumacaftor (VX-809) Induces an Extensive Reorganization of Mitochondria in the Cystic Fibrosis Bronchial Epithelium" Cells 11, no. 12: 1938. https://doi.org/10.3390/cells11121938