Article

Measurement of Chromosomal Arms and FISH Reveal Complex Genome Architecture and Standardized Karyotype of Model Fish, Genus Carassius

by
Martin Knytl
* and
Nicola Reinaldo Fornaini
Department of Cell Biology, Faculty of Science, Charles University, 12843 Prague, Czech Republic
*
Author to whom correspondence should be addressed.
Cells 2021, 10(9), 2343; https://doi.org/10.3390/cells10092343
Submission received: 1 August 2021 / Revised: 20 August 2021 / Accepted: 29 August 2021 / Published: 7 September 2021
(This article belongs to the Collection Non-human Chromosome Analysis)

Abstract

:
The widely distributed ray-finned fish genus Carassius is very well known due to its unique biological characteristics such as polyploidy, clonality, and/or interspecies hybridization. These biological characteristics have enabled Carassius species to be successfully widespread over relatively short period of evolutionary time. Therefore, this fish model deserves to be the center of attention in the research field. Some studies have already described the Carassius karyotype, but results are inconsistent in the number of morphological categories for individual chromosomes. We investigated three focal species: Carassius auratus, C. carassius and C. gibelio with the aim to describe their standardized diploid karyotypes, and to study their evolutionary relationships using cytogenetic tools. We measured length ( q + p l e n g t h ) of each chromosome and calculated centromeric index (i value). We found: (i) The relationship between q + p l e n g t h and i value showed higher similarity of C. auratus and C. carassius. (ii) The variability of i value within each chromosome expressed by means of the first quartile ( Q 1 ) up to the third quartile ( Q 3 ) showed higher similarity of C. carassius and C. gibelio. (iii) The fluorescent in situ hybridization (FISH) analysis revealed higher similarity of C. auratus and C. gibelio. (iv) Standardized karyotype formula described using m e d i a n value ( Q 2 ) showed differentiation among all investigated species: C. auratus had 24 metacentric (m), 40 submetacentric ( s m ), 2 subtelocentric ( s t ), 2 acrocentric (a) and 32 telocentric (T) chromosomes ( 24 m + 40 s m + 2 s t + 2 a + 32 T ); C. carassius: 16 m + 34 s m + 8 s t + 42 T ; and C. gibelio: 16 m + 22 s m + 10 s t + 2 a + 50 T . (v) We developed R scripts applicable for the description of standardized karyotype for any other species. The diverse results indicated unprecedented complex genomic and chromosomal architecture in the genus Carassius probably influenced by its unique biological characteristics which make the study of evolutionary relationships more difficult than it has been originally postulated.

1. Introduction

Karyotype analysis is a fundamental approach by which chromosomes are arranged into homologous pairs with a respect to certain morphological categories. In the broader sense, the term karyotype is also referred to as a complete number of chromosomes describing typical taxon, species, biotype or individual [1]. Homologous chromosome pairs and morphological categories are determined based on the ratio of the long (q) and short (p) arm and the position of the centromere (centromeric index, i value). If the centromere is situated in median, submedian, subterminal or terminal region of the chromosome, the morphological category might be designated as metacentric (M, m), submetacentric ( s m ), subtelocentric ( s t ) or acrocentric (a)/telocentric ( t , T ), respectively [2]. Two edge points that are located on median and terminal position sensu stricto have centromeric index 50 (assigned as M) and 0 (assigned as T chromosomes), respectively [2]. In order to maximize the diagnostic information obtainable from a chromosome preparation, the precise arrangement of individual chromosomes within a single image might be used as a standardized format. The term karyogram can be also used for a graphical depiction of chromosome complements [3,4].
Knowledge of the karyotype is necessary in (cyto)genetics, or related fields, in order to study chromosomal rearrangements and abnormalities [5,6], the identification of sex chromosomes [7,8], and/or chromosome-specific genes [9]. Although chromosomal changes, (i.e., chromosomal losses, duplications, rearrangements), are strictly linked to a certain locus, without the knowledge of detailed karyotype, it is not possible to precisely identify chromosomal aberration, mutation or syndrome [10,11]. Heteromorphic sex chromosomes (morphologically distinct in male or female individuals) can be distinguished by classic cytogenetic procedures based on Giemsa-staining karyogram of both sexes and/or by chromosome painting and fluorescent in situ hybridization (FISH) [12,13]. Cytogenetic mapping and localization of single-copy gene regions in the genome generally reveal both intra- and interchromosomal rearrangements (i.e., inversions, insertions, deletions or duplications) determined using karyograms [9]. Moreover, gene loci, which have not yet been mapped within a genome, can be assigned to a specific chromosome within a standardized karyogram [14].
In some model vertebrate species, a low/moderate number of chromosomes, meaning up to approximately 50 chromosomes, of relatively large-size allows for easy identification of each chromosome according to q / p arm ratio and centromeric index [15]. Each chromosome is usually assigned a numeric code, necessary in evolutionary studies pertaining to patterns of orthologous chromosomes between species. Orthologous chromosomes are inferred to be descended from the same ancestral chromosome separated by a speciation event. This concept is also referred to as shared synteny. In a non-model organism with a high number of relatively small chromosomes, identification of chromosomes into categories are inconsistent (e.g., Knytl et al. [16] vs. Kobayasi et al. [17] vs. Ojima and Takai [18]), as is that case with cyprinid fish from the genus Carassius. Although a large number of studies describing Carassius karyotype, there is no study proposing a standardized karyogram based on exact measurements of the difference between q and p chromosome arm, arm ratio and centromeric index in any Carassius species.
The genus Carassius belongs to the monophyletic paleotetraploid tribe, Cyprinini sensu stricto [19], within the family Cyprinidae (ray-finned fishes, Teleostei). Several species have been described within the genus Carassius and three of them are widely used in cytogenetic research: (i) Carassius carassius (Crucian carp), native and threaten in many European countries [20,21], is diploid with chromosome number 2 n = 4 x = 100 [17], where n refers to the number of chromosomes in each gamete of extant species, and x refers to the number of chromosomes in a gamete of the most recent diploid ancestor of the extant species. Most members of the family Cyprinidae contain 25 chromosomes in each gamete, considered as the most recent diploid ancestral state of extant Carassius [22]. (ii) Carassius auratus (goldfish), well known for its colourful varieties, bizarre shapes of body and formation of domesticated and feral populations [23]. (iii) Carassius gibelio (Silver Prussian carp) has recently spread throughout most continental waters, as a result of relocation from native habitats most likely by humans [24,25,26,27]. In addition, Carassius auratus and C. gibelio form diploid ( 2 n = 4 x = 100 ), triploid ( 3 n = 6 x 150 ), and tetraploid biotypes ( 4 n = 8 x 200 ) [28,29,30].
Here we described standardized karyotype of diploid Carassius species with 100 chromosomes (C. auratus, C. carassius and C. gibelio) based on measuring of chromosomal q + p arm l e n g t h , q / p arm ratio, and i value. We performed FISH experiments with ribosomal probes, and analysed values of q + p l e n g t h and i in order to characterize the inter-species differences between three Carassius species, which commonly co-occur in European waters (C. carassius and C. gibelio), and bred/distributed worldwide as part of the pet trade (C. auratus).

2. Materials and Methods

2.1. Fish Sampling and Origin

Carassius auratus were obtained via the aquarium trade (transported to Czech Republic from Israel). Carassius carassius was captured in the Elbe River basin closed to the city Lysá nad Labem, Czech Republic [16,31] and in small pond in Helsinki, Finland [32]. Carassius gibelio originated from the Dyje Rive basin, South Moravia, Czech Republic [28].

2.2. Chromosome Analysis

Both males and females of each species (C. auratus, C. carassius, C. gibelio) were used for karyotype analysis. In C. auratus, mitotic activity was stimulated by intraperitoneal injection of 0.1 % CoCl 2 [32]. Somatic chromosomal complements were synchronized in metaphase of cell mitotic division using 0.1 % colchicine (Sigma, St. Louis, MO, USA). Chromosome suspension was generated from the cephalic kidney [33] and stored in fixative solution (methanol: acetic acid, 3:1) at 20 °C, before being observed on a glass slide and stained with 5% Giemsa solution in 1× PBS. The chromosome suspensions used in this study have been used in prior analyses of C. carassius and C. gibelio [16,28,31,32] meaning that chromosomal suspensions were stored 3–7 years in 20 °C. Chromosomal suspensions were spun in a centrifuge, and fresh methanol and acetic acid were added every three months to maintain the constant ratio of methanol and acetic acid in fixative solution.

2.3. Measurements of q + p Chromosomal Arm Length

Photos of mitotic metaphase were taken using a Leica DFC 7000T camera and Leica DM6 microscope equipped with a EL6000 (metal halide) fluorescence illumination. A total of ten high-quality photos were taken for each species, five male and five female metaphases, from which measurements of the length of q and p chromosomal arms were taken. The centromere of each chromosome was identified as the narrowest part of a chromosome (Figure S2). Both arms of each chromatid (i.e., long arm 1 ( q 1 ), long arm 2 ( q 2 ), short arm 1 ( p 1 ), short arm 2 ( p 2 )) were measured using ImageJ (V 1.53i) [34]. Chromosomal length ( l e n g t h ), difference between q and p arm (d), q / p arm ratio (r) and centromeric index (i) were calculated according following formulas adopted from Levan et al. [2]:
p = p 1 + p 2 2 q = q 1 + q 2 2
l e n g t h = p + q d = q p r = q p i = 100 r + 1
Measurements of p, q, l e n g t h , d, r, and i were calculated as values in pixels from each image/metaphase and were further analyzed using R software for statistical computing (V 4.1.0) [35] and RStudio environment (V 1.4.1717) [36]. The i value was selected as a crucial characteristics for karyotypic analysis because it generally ranges from 0 to 50 [2]. The r value generally ranges from 1 to and thus this value is not suitable for graphical expression of results. The l e n g t h and i value were used for calculation of an arithmetic mean of l e n g t h ( m e a n _ l e n g t h ) and an arithmetic mean of i ( m e a n _ i ) separately for each Carassius species. The m e a n _ l e n g t h and m e a n _ i of each species were plotted (plot function in R).

2.4. Standardized Carassius Karyotype

  Two highest i values (one chromosomal pair) were dissected from each of the metaphases (ten metaphases in total) and put into additional data frame as a numeric vector. This group of i values were identified as chromosome 1 (hereafter chr1). The third and fourth highest i values were dissected from each metaphase and identified as chr2 and so on up to two chromosomes with the lowest i values identified as chr50. This function(){} is named Select_chrome and shown in the supplemental results. All i values of each identified chromosome were plotted (boxplot function in R) separately in each species. The default interquartile range 1.5 was used for elimination of extreme values (errors). Output value ( $ s t a t s ) was called in R. The i values within the the minimum ( Q 0 ), first quartile ( Q 1 ), median ( Q 2 ), third quartile ( Q 3 ) and maximum ( Q 4 ) were investigated in detail, especially if some i values of each individual chromosome were shared among focal Carassius species. Chromosomal categories (M, m, s m , s t , a and T) were determined according Q 2 of i values in each Carassius species. A morphological category of each chromosome was determined according chromosomal nomenclature Levan et al. [2]. The following Table 1 shows boundaries between each morphological category:

2.5. Preparation of 5S and 28S Ribosomal Probes

New 5S PCR primers 5S_F (5 –CAGGGTGGTATGGCCGTAGG–3 ) and 5S_R (5 –AGCGCCCGATCTCGTCTGAT–3 ) were designed according to the 5S gene of the western clawed frog, Xenopus tropicalis. The X. tropicalis genomic sequence is available on Xenbase, accessed on 11 June 2020 (http://www.xenbase.org). The 28S primers 28S_A (5 –AAACTCTG GTGGAGGTCCGT–3 ) and 28S_B (5 –CTTACCAAAAGTGGCCCACTA–3 ) used in this study were designed by Naito et al. [37]. Total genomic DNA (gDNA) was extracted from pectoral fin tissue using the DNeasy Blood & Tissue Kit (Qiagen, Hilden, Germany) according to manufacturer’s instructions. Carassius gibelio and X. tropicalis gDNA were used as a template for 5S and 28S PCR amplification, respectively. Primers were made by Integrated DNA Technologies (Coralville, IA, USA). The PPP Master Mix (Top-Bio, Prague, Czech Republic) was used for efficient amplification of ribosomal gene fragments. The temperature profile for the non-labelling amplification of the 5S and 28S loci followed Top-Bio instructions: initial denaturation step for 1 min at 94 °C, followed by 35 cycles (94 °C for 15 s, 53 °C for 15 s and 72 °C for 40 s) and a final extension step at 72 °C for 7 min. The obtained PCR products were separated on a 1.25% agarose gel with TA buffer and extracted from the gel using MicroElute Gel Extraction Kit (Omega Bio-tek, Norcross, GA, USA) according to manufacturer’s instructions. The PCR amplicons were sequenced and mapped using blastn algorithm for finding out of the locus- and species-specificity of amplification. Subsequently, the 5S and 28S ribosomal DNA (rDNA) loci were indirectly labelled by Digoxigenin-11-dUTP (Roche, Mannheim, Germany) and Biotin-16-dUTP (Jena Bioscience, Jena, Germany), respectively, by PCR reaction again. Taq DNA polymerase (Top-Bio) was used for labelling instead of The PPP Master Mix which was used for non-labelling amplification. Conditions for labelling PCR of the 5S and 28S loci were adopted from Sember et al. [38] and slightly modified as follows: initial denaturation step for 3 min at 94 °C, followed by 30 cycles (94 °C for 30 s, 53 °C for 30 s and 72 °C for 40 s) with final extension step at 72 °C for 10 min. The PCR product was separated on an 1% agarose gel with TBE buffer and purified using E.Z.N.A. Cycle Pure Kit (Omega Bio-tek) according to manufacturer’s instructions.

2.6. Fluorescent In Situ Hybridization

Cell suspensions prepared from each Carassius species were spread onto clean microscopic slides, which were subsequently used for FISH on the same day. The 5S probe from C. gibelio was used for chromosomal spreads of C. auratus, C. carassius and C. gibelio. The 28S probe from X. tropicalis was used for C. auratus, C. carassius and C. gibelio chromosomal spreads. In total 44 μ L of the hybridization mixture containing 100 ng of either 5S or 28S rDNA probe, 50% deionized formamide, 2× SSC, 10% dextran sulphate and water was placed on a slide and covered with a 24 × 50 mm coverslip. Both probe and chromosomal DNA were denatured in a PCR machine with special block for slides at 70 °C for 5 min [9]. Hybridization, post-hybridization washing, blocking reaction and visualization of 5S and 28S rDNA signals were carried out as described in Knytl et al. [39]. The Digoxigenin-11-dUTP/Biotin-16-dUTP labelled probe was detected by Anti-Digoxigenin-Fluorescein (Roche)/CYTM 3-Streptavidin (Invitrogen, Camarillo, CA, USA), respectively, diluted according to manufacturer’s instructions. Chromosomes were counterstained with ProLongTM Diamond Antifade Mountant with DAPI (Invitrogen by Thermo Fisher Scientific, Waltham, MA, USA). At least 20 metaphase spreads in total were analysed per individual.

3. Results

3.1. Karyotype Analysis

Number of chromosomes in all studied species (C. auratus, C. carassius and C. gibelio) was uniform ( 2 n = 4 x = 100 ) Figure S1. We did not find any differences in chromosomal morphology between male and female individuals. This finding confirmed homomorphic sex chromosomes at least in diploid biotypes of the genus Carassius.

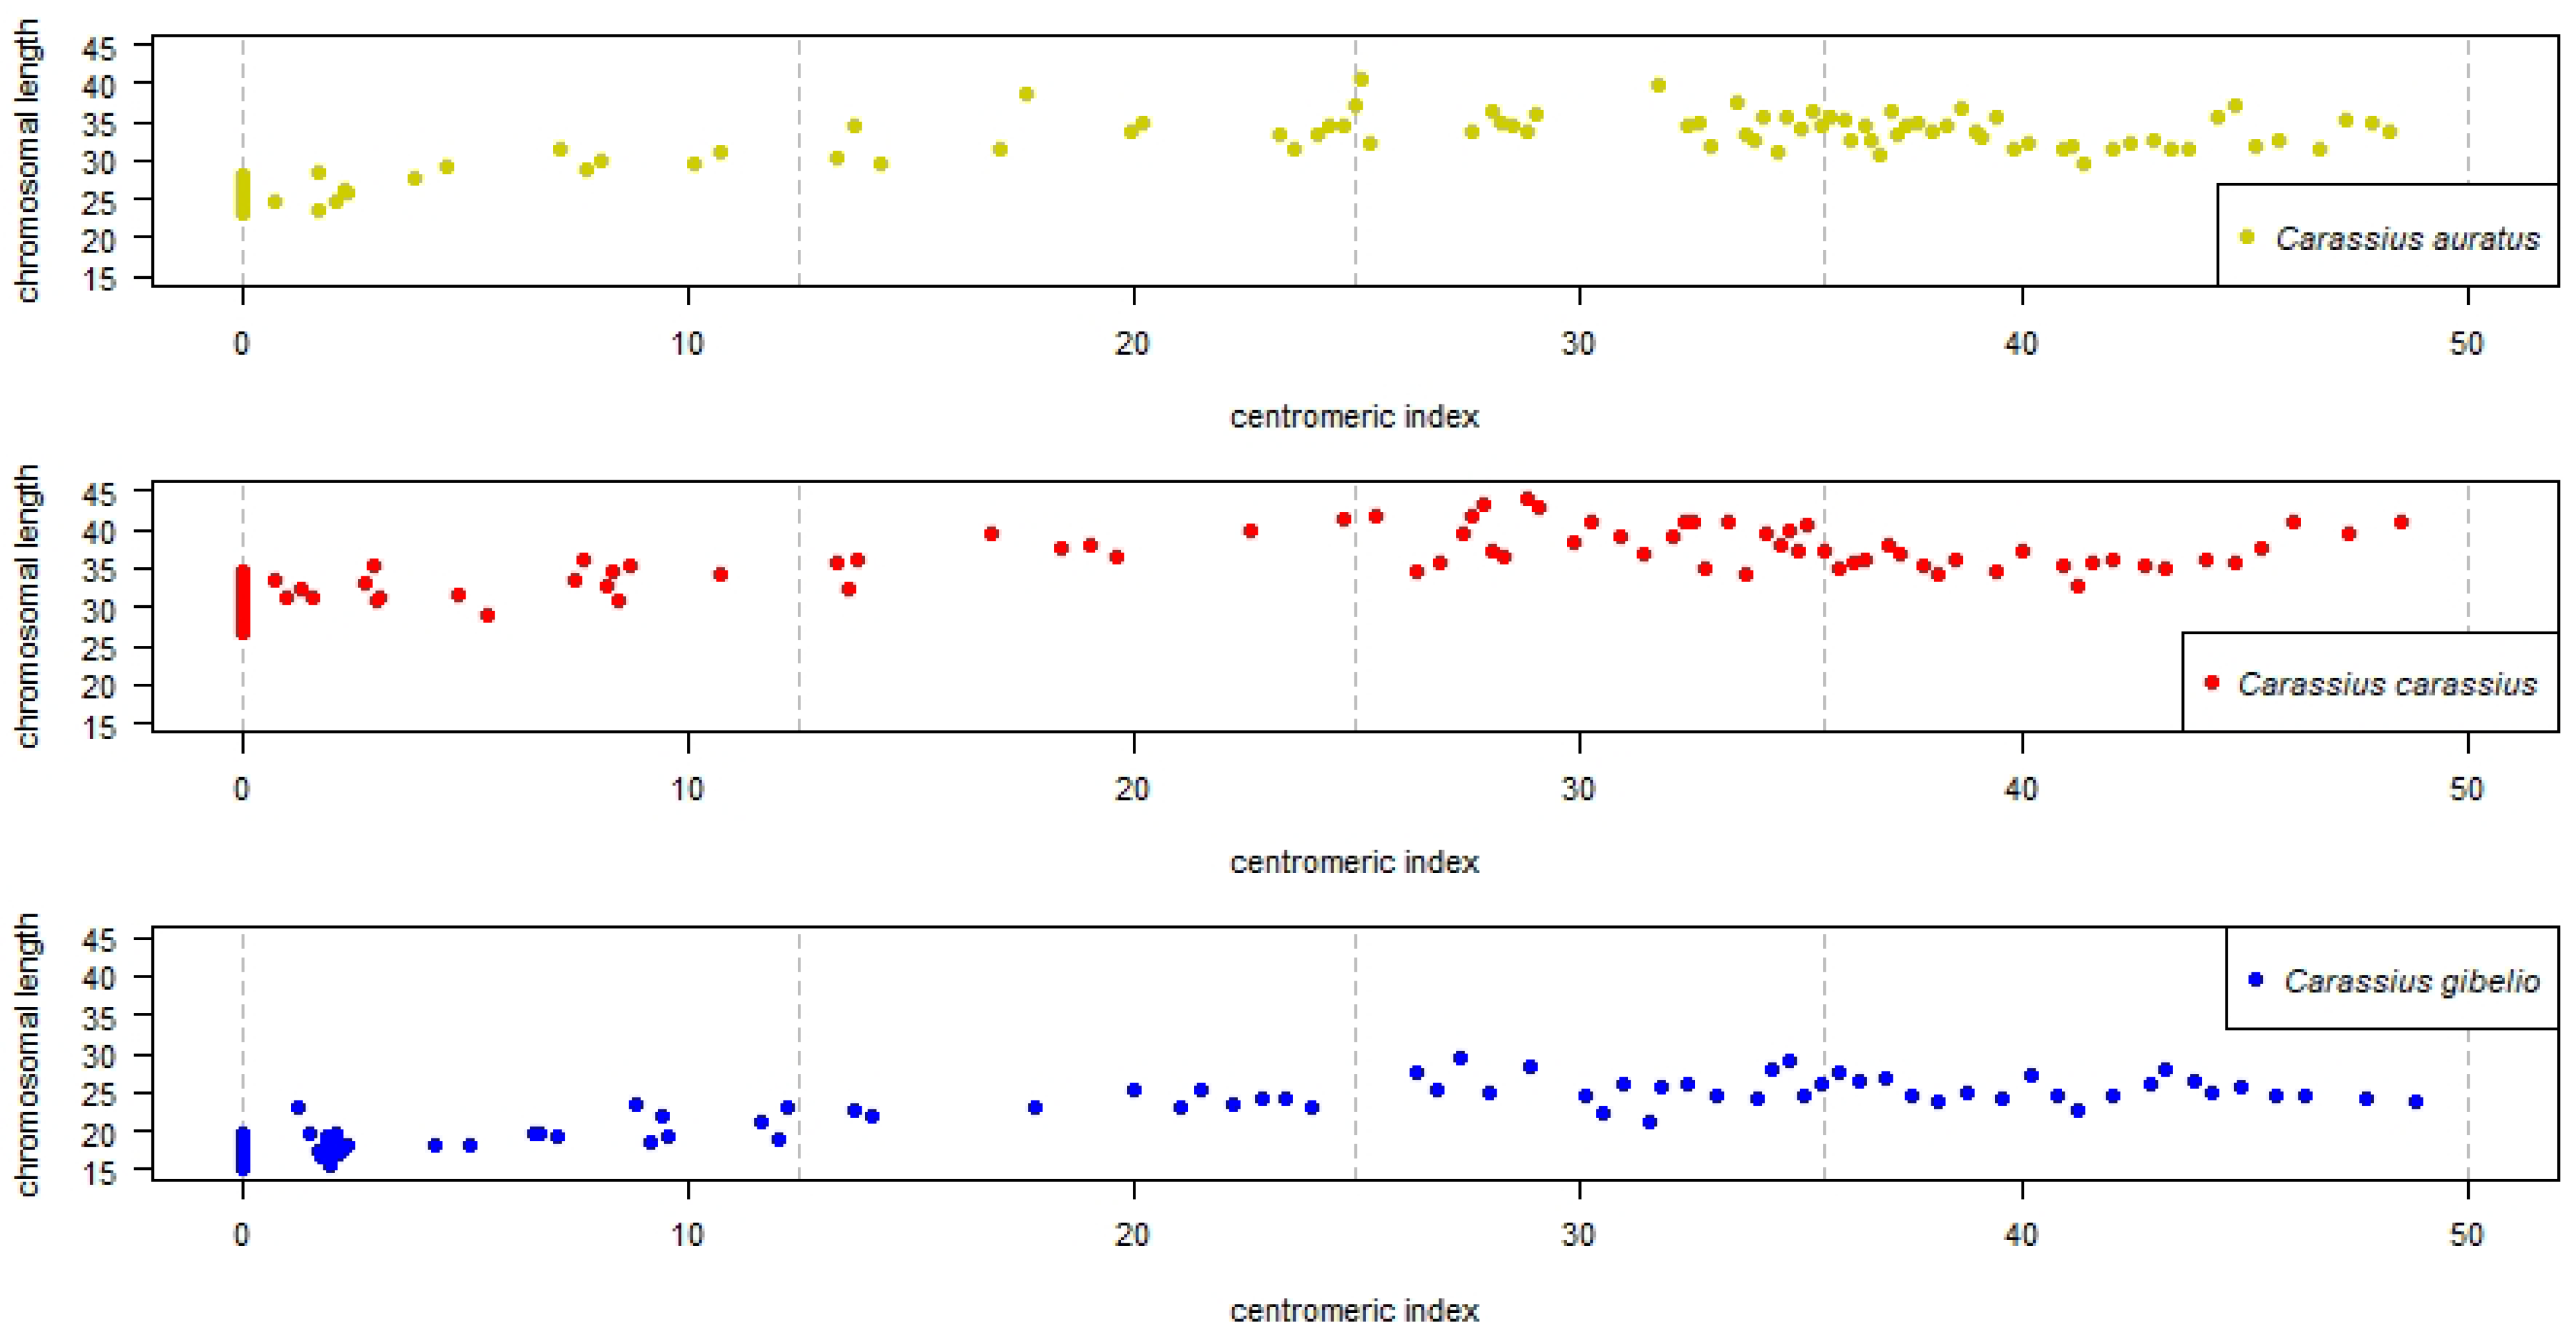
3.2. Interspecies Variability Based on Chromosomal Length

Detailed description of R analysis including R scripts are given in Supplementary Results. All steps outlining how the measured values were calculated and processed into tables and plots are shown on the C. auratus dataset. The m e a n _ i and m e a n _ l e n g t h of each individual chromosome were plotted onto x axis and y axis, respectively, (Figure 1). Morphological chromosomal categories m, s m , s t , a and T are present in each species. Extreme category, such as T, is represented by 19, 26, and 25 chromosomes of C. auratus, C. carassius and C. gibelio, respectively (i.e., 19, 26, and 25 points lie on gray dashed vertical lines of interval 0). The T chromosomes have small m e a n _ l e n g t h , approaching 0. Other chromosomal categories, such as M, are not represented in any species—no i value reached 50, with the highest i of 48.778 found in chromosome 1 of C. gibelio. Chromosomal length of C. auratus, C. carassius, and C. gibelio range from 23.340 40.614 , 26.799 44.092 , and 15.205 29.496 , respectively. It is evident that chromosomes of C. gibelio are generally smaller (mean of q + p length was 21.36) than those of both C. auratus ( 31.53 ) and C. carassius ( 35.05 ). For the minimum of errors we calculated m e a n _ l e n g t h and m e a n _ i from a group of ten measured q + p values, i.e., each dot on Figure 1 is arithmetic mean resulted from ten measured q + p values. Potential influences on chromosomal length are discussed (Section 4).

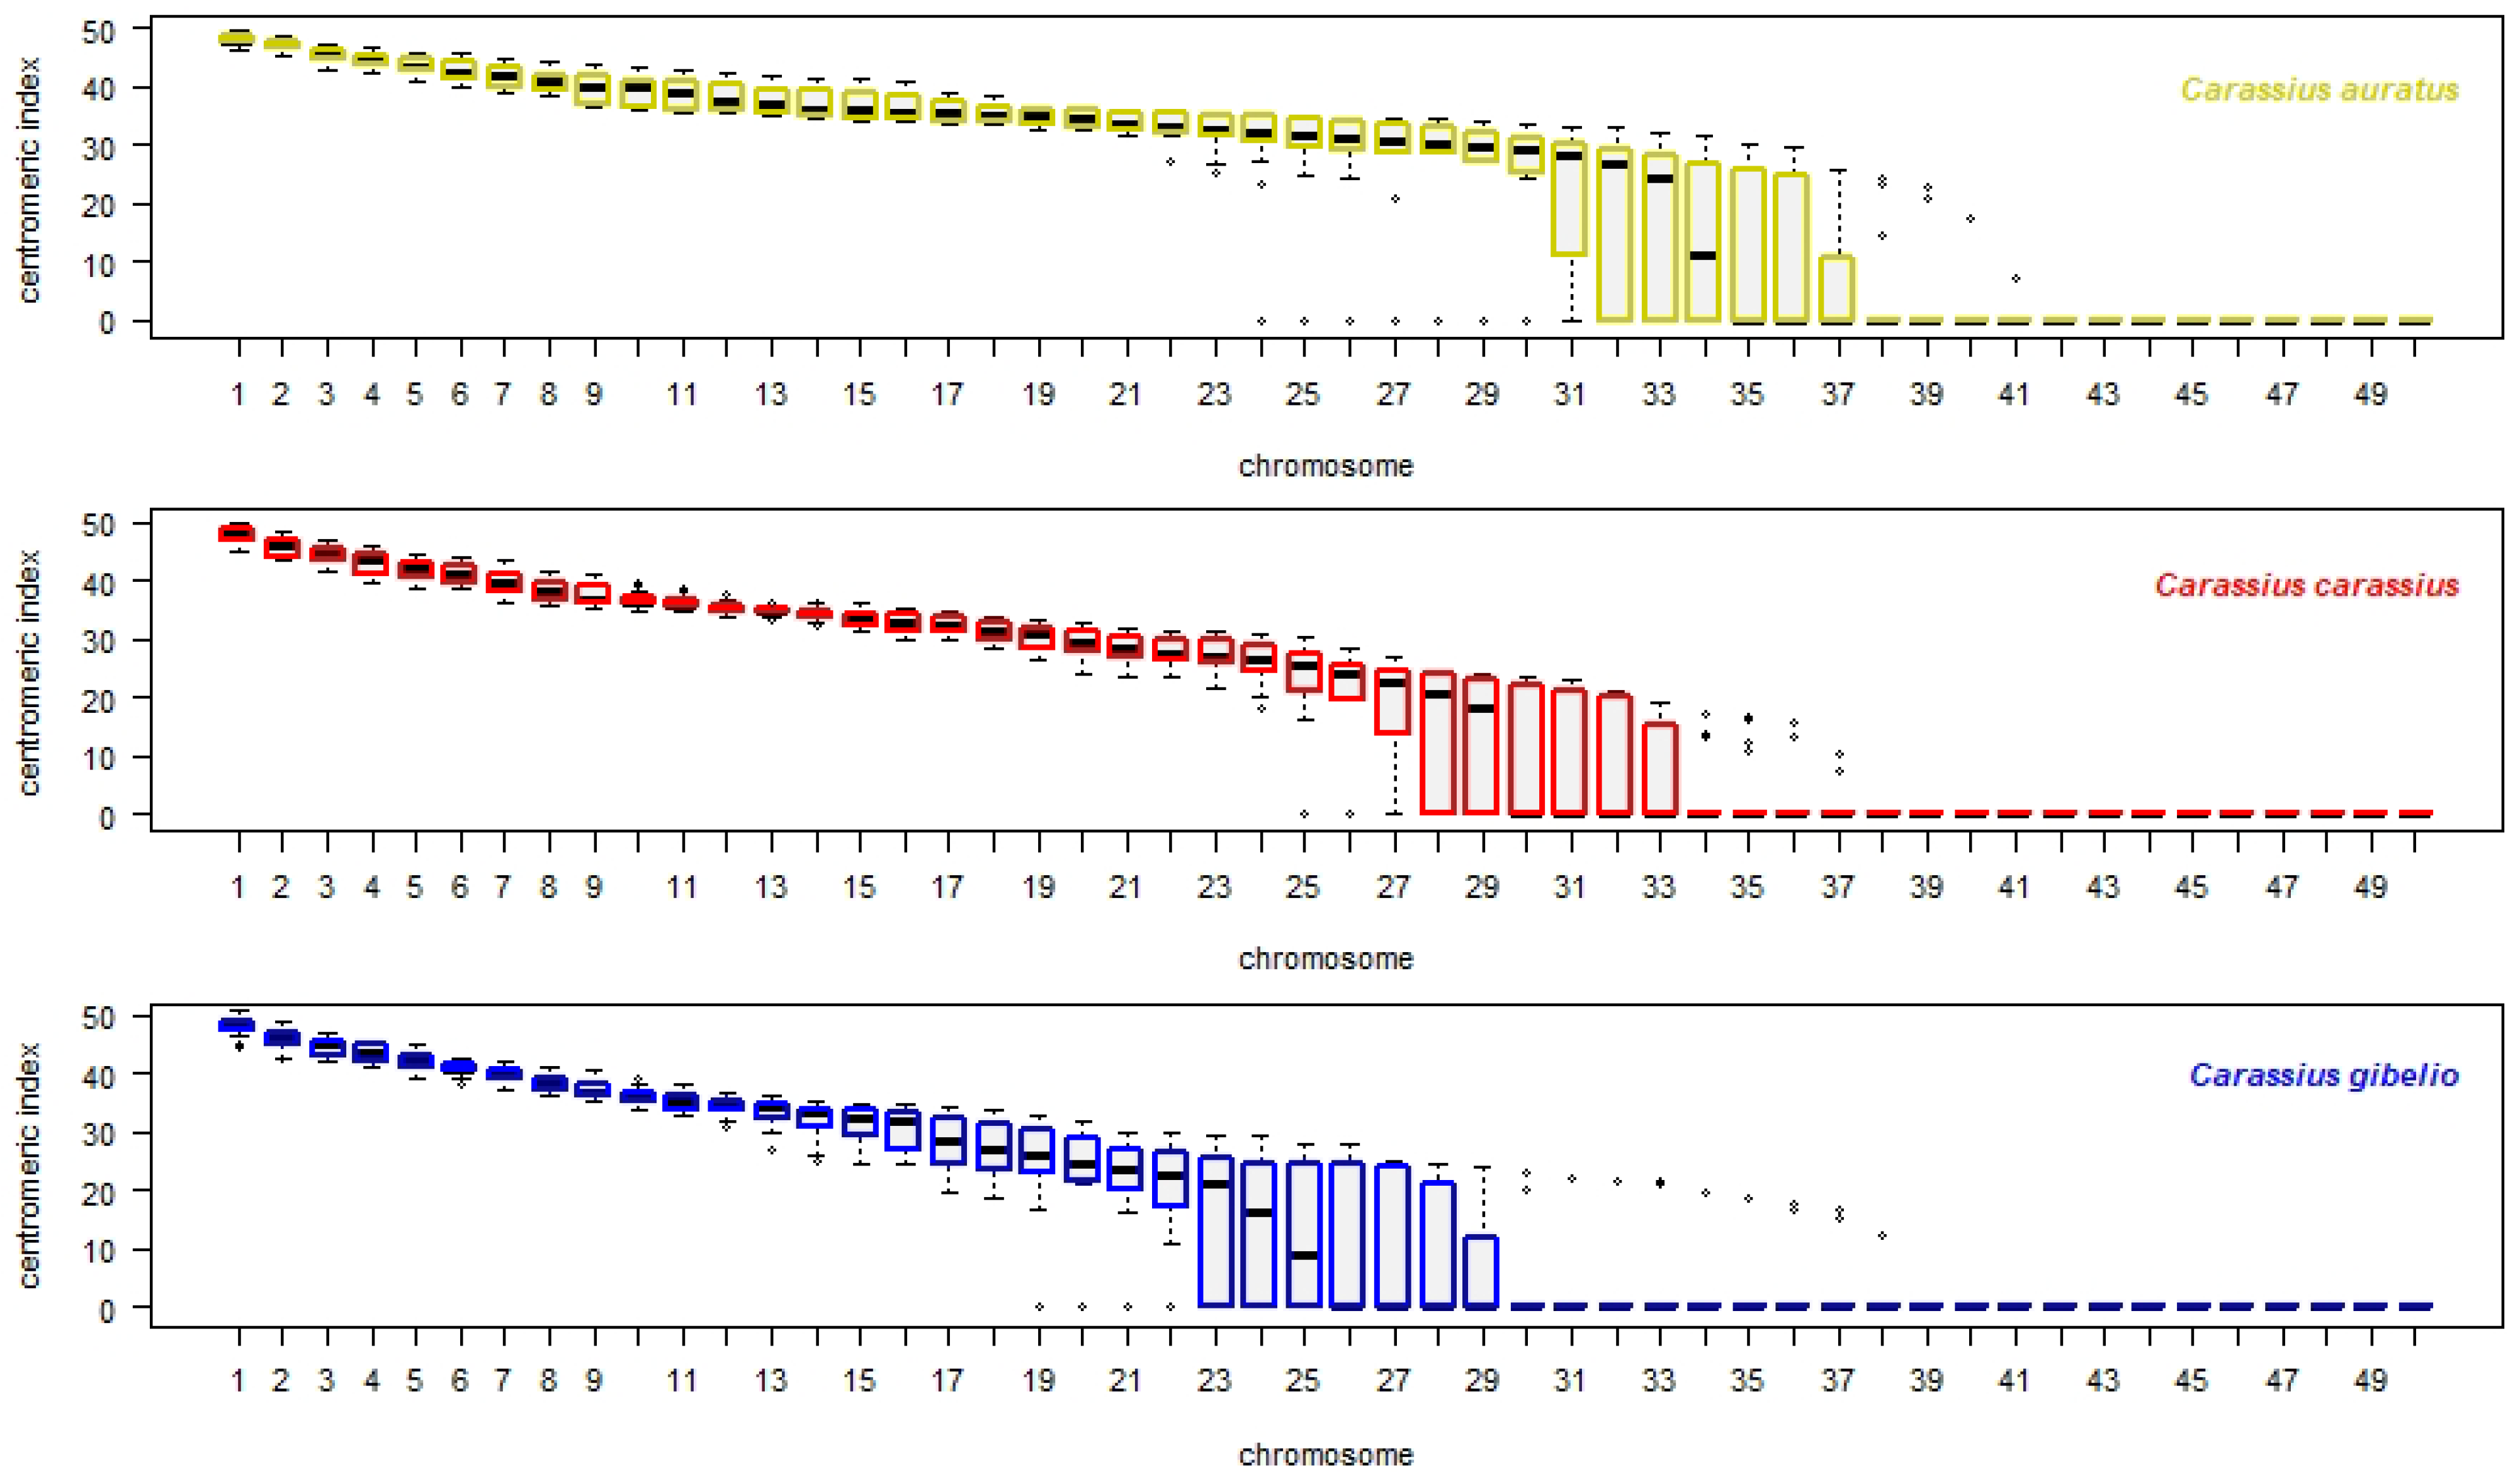
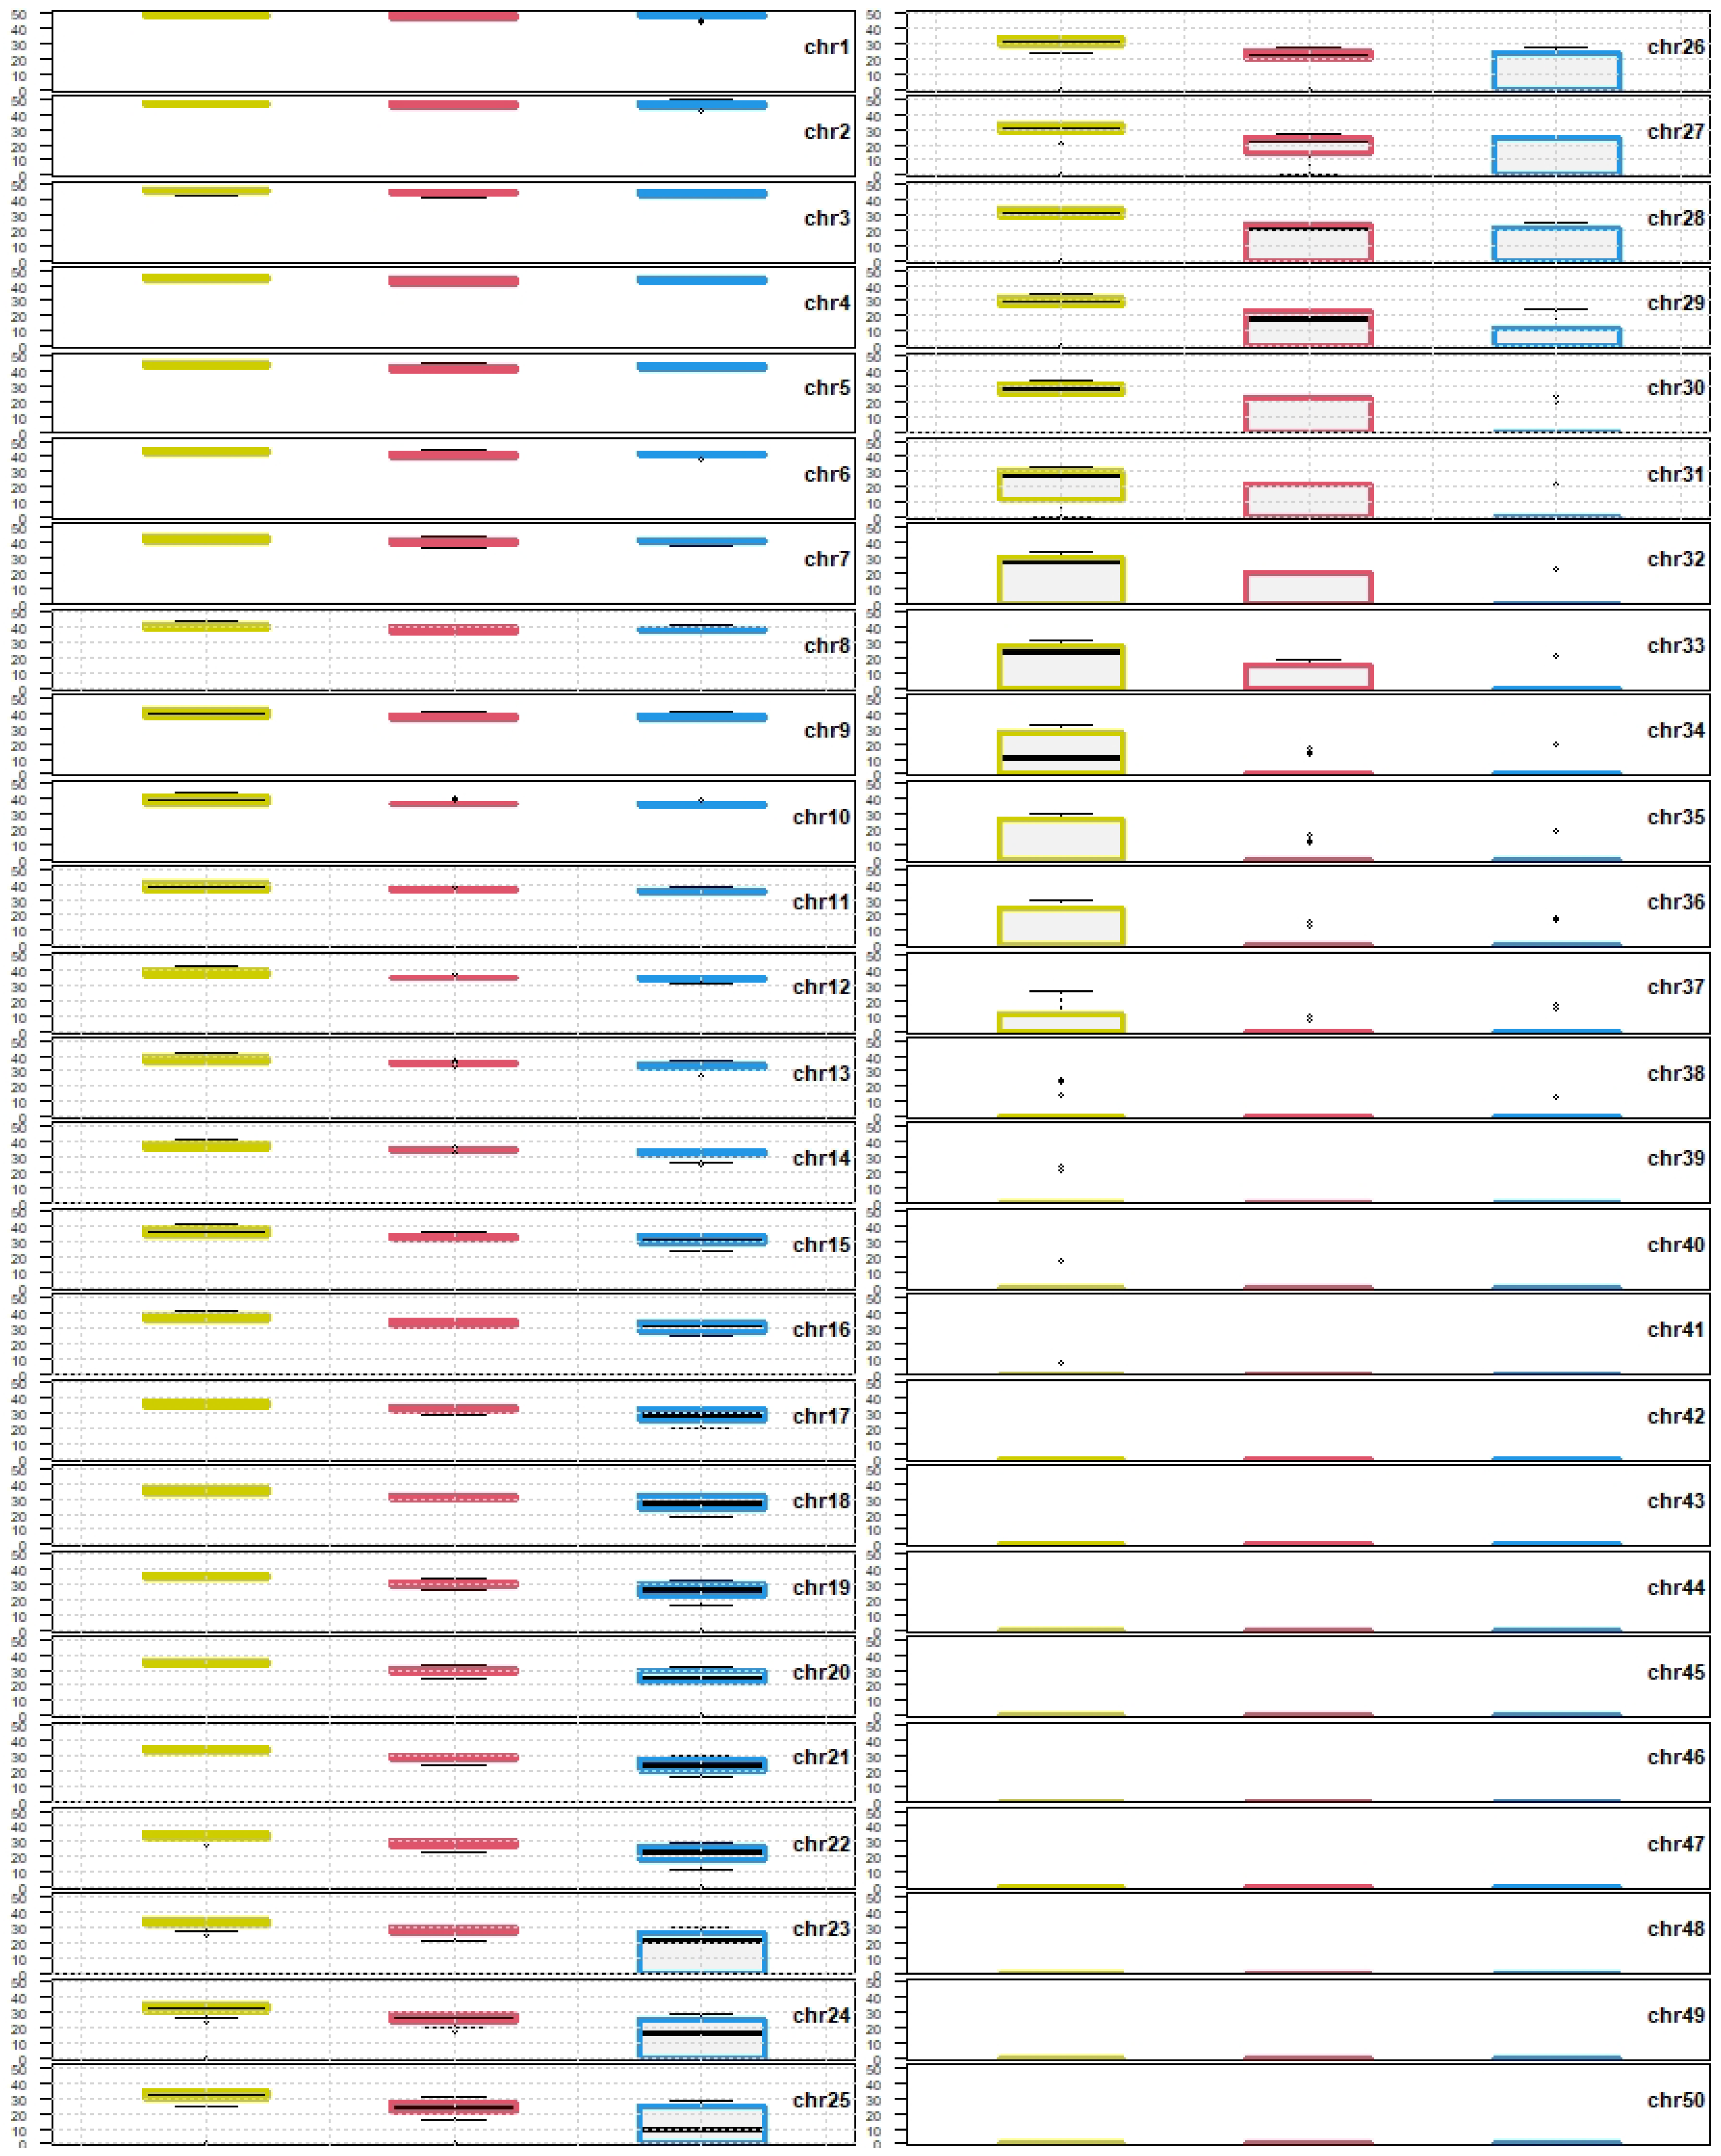
3.3. Interspecies Variability Based on Centromeric Index Linked to Individual Chromosomes of the Whole Chromosomal Complement, and Standardized Carassius Karyotype

The i values were assigned to each individual chromosome by dissection of chr1–50 from each metaphase (also Section 2.4, R protocol is described in the section of R analysis of Supplementary Results) and plotted onto x and y axis (Figure 2). Each box depicts a group of chromosomes dependent on i values ordered from most metacentric chromosomes on the left side of plots (chr1) to most telocentric chromosomes on the right side of plots (chr50). In general, each species has six to seven chromosomes that were highly variable in i, i.e., chr31–37 in C. auratus, chr27–33 in C. carassius and chr23–29 in C. gibelio. The Q 1 and Q 3 cover i values from 0 to 29.342 in C. auratus, from 0 to 23.9 in C. carassius and from 0 to 25.747 in C. gibelio. Carassius auratus has the highest variability of i value.
If some i values are shared among C. auratus, C. carassius and C. gibelio, the range of i values of each individual chromosome (chr1–50) from ten metaphases were compared with the range of i values of other two orthologs of each of other two species (ten metaphases from each species). The Q 1 Q 3 range of i value within chr1 of C. auratus was compared with the Q 1 Q 3 range of i value within chr1 of C. carassius and C. gibelio, similarly the Q 1 Q 3 range of i value within chr2 of C. auratus was compared with the Q 1 Q 3 range of i value of C. carassius and C. gibelio etc. up to the Q 1 Q 3 range of i value within chr50 of C. auratus, C. carassius and C. gibelio. As an additional analysis, multi-plot with 50 separate box plots (chr1–50) was generated, each box plot was composed of orthologous chromosomes of all three species (Figure 3).
Based on i value (Figure 1 and Figure 3), we concluded that:
  • Each orthologous chromosome of C. carassius and C. gibelio shared i values within Q 1 Q 3 range and therefore we consider that karyotypes of C. carassius and C. gibelio to be more similar based on i value.
  • Chromosomes 12–30 of C. auratus were represented by different i values within Q 1 Q 3 range those of C. carassius and C. gibelio. Therefore, we consider the karyotypes of C. auratus to be most variable for this parameter.
  • Chromosomes 8, 11 and 31 of C. auratus were represented by different i values within Q 1 Q 3 range those of C. gibelio but C. carassius shared i values in these chromosomes with both C. auratus and C. gibelio.
The Q 2 range ( m e d i a n ) of i value was used for determination of a standardized karyotype formula. Chromosome1 of C. auratus, C. carassius and C. gibelio with m e d i a n of i value 47.87 ( C A U _ m e d i a n _ i column of Table 2), 48.28 ( C C A _ m e d i a n _ i ) and 48.55 ( C G I _ m e d i a n _ i ), respectively, were identified as m chromosomes in all three Carassius species ( C A U _ c a t e g o r y , C C A _ c a t e g o r y , C G I _ c a t e g o r y columns of Table 2). Karyotypes all three Carassius species were different in the number of chromosomal categories sensu Levan et al. [2]. The number of chromosomes in categories found out by arithmetic mean (Figure 1) slightly differed from the number of chromosomes in categories determined by Q 2 range (Figure 2). The Q 2 range eliminated errors and thus we inferred standardized karyotype formula according to the Q 2 range.
Carassiusauratus : 24 m + 40 s m + 2 s t + 2 a + 32 T
Carassiuscarassius : 16 m + 34 s m + 8 s t + 42 T
Carassiusgibelio : 16 m + 22 s m + 10 s t + 2 a + 50 T

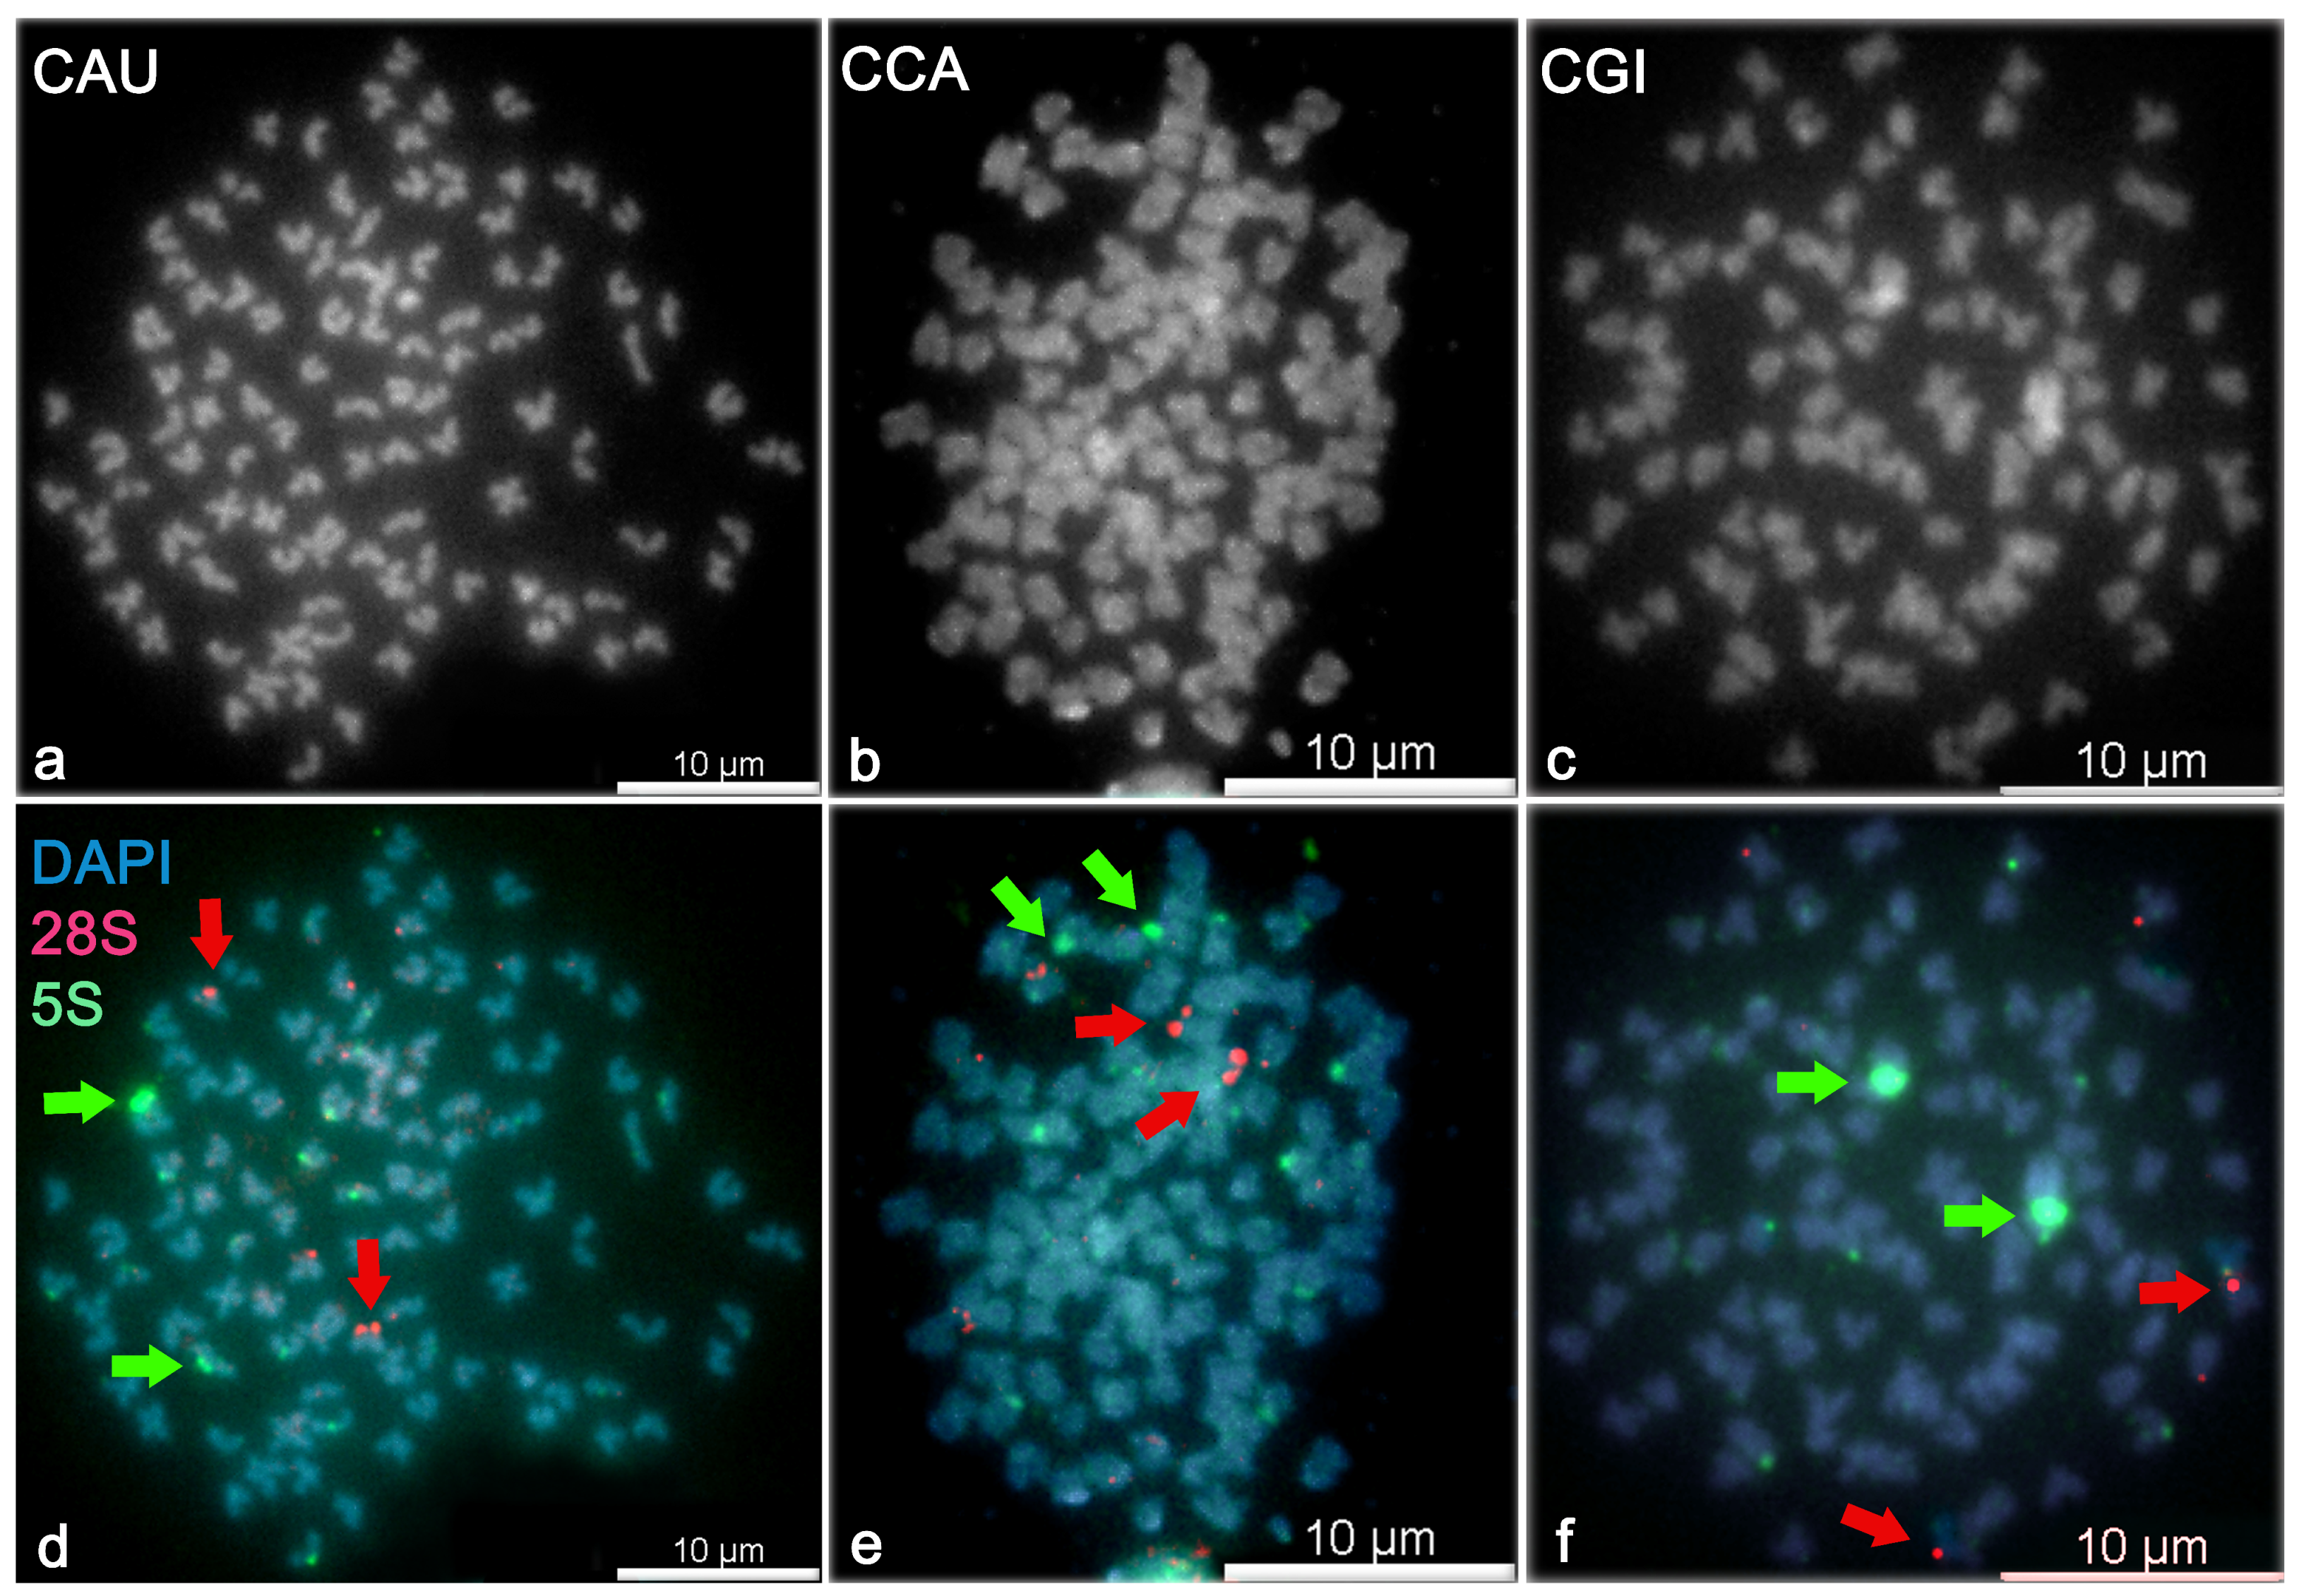
3.4. Fluorescent In Situ Hybridization with 5S and 28S Ribosomal Probes

The PCR amplification of 28S and 5S rDNA locus resulted consistently in approximately 300 bp long fragments. Searches, using the blastn algorithm, confirmed the locus- and species-specificity of each amplicon: 100% identity with 28S rRNA of X. tropicalis (accession numbers XR_004223792–XR_004223798), 95% identity with sequence of 5S rRNA of C. gibelio (accession number DQ659261). The amplified 5S rDNA sequence was deposited to the NCBI/GenBank database (accession number BankIt2492026 5s, MZ927820). Mapping of the 5S and 28S loci showed different patterns in the number and position within each investigated Carassius species (Figure 4). No differences between males and females were detected. The q + p arms of the FISH images were measured on chromosomes that bear positive rDNA loci because the FISH protocol involves denaturation step after which chromosomal structure is disrupted due to high temperature. The rDNA positive loci are mostly accumulated at the pericentromeric chromosomal region in Carassius and another cyprinid fishes [32,40,41] and thus the identification of the centromere and measurement of the q + p arms are precise on rDNA positive chromosomes. The i value of rDNA positive chromosomes (arrows on Figure 4) were assigned to the closest i value of the standardized karyotype from Table 2.
Summary of 5S rDNA (corresponding to non-nucleolar region). We found:
  • Two more intensive (strong) 5S rDNA signals at the p arm of s m chromosomes (chr28, i value = 30.06 ) and eight weak signals in C. auratus.
  • Two strong 5S rDNA signals at the p arm of s m chromosomes (chr19, i value = 30.60 ) and six weak signals in C. carassius.
  • Two strong 5S rDNA signals at the p arm of s m chromosomes (chr17, i value = 30.00 ) and eight weak signals in C. gibelio.
Summary of 28S rDNA (corresponding to nucleolar organizer region). We found:
  • two strong 28S rDNA signals at the p arm of two s m chromosomes (chr16, i value = 35.69 ) and two weak signals in C. auratus.
  • two strong 28S rDNA signals at the p arm of two s m chromosomes (chr13, i value = 34.72 ) and four weak signals in C. carassius.
  • two strong 28S rDNA signals at the pericentromeric region of two T chromosomes (in the range of chr26–50, i value = 0 ) and two weak 28S rDNA signals in C. gibelio.

4. Discussion

Diploid vs. polyploid biotypes—sexual vs. asexual reproduction—genetic vs. environmental sex determination: All these natural phenomena make Carassius a valuable experimental model for evolutionary studies. The study of these aforementioned unique characteristics of Carassius require basic cytogenetic techniques such as chromosome preparations and/or karyotype. Diploid biotypes of the genus Carassius have a karyotype consisting of 100 chromosomes (e.g., [28], this study), with some exceptions, i.e., 50, 94, 98, 102 or 104 chromosomes [22,42,43,44,45,46]. Karyotype formula of diploid Carassius is inconsistently defined by several authors (Table 3) and q + p arms have not been measured. An application of a technique of measurement, and the following determination of standardized karyotype is needed in order to clear up genome architecture and its evolution.
We generated a revised karyotype as a result of novel measurement and using statistical programming we described standardized karyotype of three species (C. auratus, C. carassius and C. gibelio). We measured the length of each individual chromosome of each species and identified each chromosome using i value. Groups of i values were divided into quartiles Q 0 Q 4 . Our results based on m e d i a n ( Q 2 ) of i value for each chromosome revealed three different karyotypes; not one of these three karyotypes corresponded to any of the previously published karyotypes from Table 3. The karyotype of C. auratus had 24 m , 40 s m , 2 s t , 2 a and 32 T chromosomes (shortened formula 24 m + 40 s m + 36 s t T). The karyotype of C. carassius had 16 m , 34 s m , 8 s t and 42 T chromosomes (shortened formula 16 m + 34 s m + 50 s t T). The karyotype of C. gibelio possessed 16 m , 22 s m , 10 s t , 2 a and 50 T chromosomes (shortened formula 16 m + 22 s m + 62 s t T). These standardized karyotypes are likely highly reproducible and could be applied to the reconstruction of cytogenetic maps, comparative cytogenetics and genomics, or cytotaxonomy and karyosystematics. The designed R scripts (Supplementary Results) could be applied to the description of standardized karyotype for another species with relatively high number of chromosomes similar to that of Carassius.
In the wider range of i values ( Q 1 Q 3 ) for each chromosome, we found karyotypes of C. carassius and C. gibelio more similar, as both C. carassius and C. gibelio shared some i values within Q 1 Q 3 range of corresponding orthologous counterparts. The i values in Q 1 Q 3 of chr8 and chr11–31 in C. auratus were significantly different those of i values in Q 1 Q 3 of C. carassius and C. gibelio (Figure 2 and Figure 3). This finding indicates higher divergence of C. auratus karyotype based on i value. The i value divergence might be supported by distinct origin of the samples used in this investigation—C. auratus used in this study was imported from Israel and was domesticated in ancient China [23]. Both C. carassius and C. gibelio used in this study originated from Europe and mostly from the Czech Republic (only four individuals of C. carassius were caught in Finland). A phylogenetic study of Asian–European Carassius suggests a closer evolutionary relationship exists between diploid C. auratus and diploid C. gibelio compared to C. carassius and diploid C. auratus/gibelio [66]. Thus, phylogenetic distance does not reflect i value divergence in C. carassius, as demonstrated in this study. The higher similarity between C. carassius and C. gibelio i values could be caused by hybridization, as previously confirmed by molecular genetic and cytogenetic tools in several European Carassius populations [16,67,68]. Although, we can not exclude a hybrid origin for diploid Carassius individuals.
In addition, female meiotic drive might also affect i values [69]. Chromosomes of particular morphology might be preferentially transmitted to the egg during meiosis and the chromosomal complement of new offspring can be rapidly changed. Interestingly, polyploid Carassius biotypes have variable numbers of microchromosomes [16] which results in odd or variable chromosome numbers within polyploid Carassius [28]. The uniform chromosome numbers, we have described in diploid Carassius, are in accordance with expectations that female meiotic drive has never been shown in diploid Carassius.
We also showed a relationship between the mean of i value and the mean of q + p chromosomal length. Chromosomes of C. gibelio had smaller size (mean of chromosomal length was 21.36 ) those of C. auratus ( 31.53 ) and C. carassius ( 35.05 , Figure 1). This difference in chromosomal length in Carassius might be promoted by altered chromatin spiralisation and condensation during cell cycle, especially during interphase and mitosis [70,71,72]. In this study, chromosomes were synchronized in metaphase by colchicine but some chromosomes can be fixed in prometaphase, early metaphase or late metaphase and we assume that slight differences in chromosomal length can be present in different Carassius species. The length of chromosomes might theoretically be influenced by storage time if the ratio or concentration of acetic acid and methanol is slightly changed [72]. To avoid these inaccuracies and preserving the chromosome suspension, we used a fixative solution with an acetic acid:methanol ratio of 1:3. This ratio was restored through the addition of fresh acetic acid and methanol. In addition, we statistically processed metaphases with different storage times, for which we found no difference in chromosome length. For the case of standardized karyotype, all previous negative effects that influence q + p arm length can be discounted because even if the length of chromosome had changed, the position of the centromere remains identical, thus i values never change [2]. In addition, the i value errors were eliminated through analysis of the median Q 2 range.
The correct order of chromosomes in Carassius karyograms remains difficult to determine. For our purposes, we arranged chromosomes according to decreasing i values. As such, chr1 has the highest i value and chr50 has the lowest i value. Using this approach describes a shared synteny of i value among C. auratus, C. carassius and C. gibelio (Figure 3). This method of numbering of chromosomes according i value in Carassius can be modified in future studies such as the numbering in human decreasingly according to q + p chromosomal length [73].
FISH analysis revealed two large non-nucleolar 5S loci and two large nucleolar 28S ribosomal loci in each of the Carassius species that were investigated; this indicates functional diploidy in evolutionary tetraploid biotype. Two strong rDNA signals were found in other studies which described Carassius karyotype [32,40,74]. The number of 5S rDNA loci (strong and weak signals in total) ranged from eight to ten, and 28S rDNA loci ranged from four to six, with a single chromosome-bearing rDNA locus differing in each Carassius species. We found higher similarity in a number of rDNA loci in C. auratus and C. gibelio, i.e., ten 5S and four 28S rDNA signals in these two species. Carassius carassius possessed eight 5s and six 28S rDNA signals. Knytl et al. [32] identified 18 5S and four 28S rDNA loci in diploid C. carassius originating from Finland waters. Spoz et al. [40] pointed out ten 5S and four 28S rDNA loci in C. carassius from Poland. Chinese C. auratus has 2–8 5S rDNA signals [74]. This study brought the first report of the FISH analysis used on diploid European C. gibelio, which belongs to phylogentically very diverse taxonomic group [66]. Our results showed variability in the number and position of ribosomal tandem repeats in Carassius which is in accordance with other rDNA studies [32,40,74]. This variability in rDNA loci has been shown between species of the same genus [38] and even between individuals of the same species for 18S and 28S loci [75,76]. The present variability of rDNA loci can be attributed to degree in heterochromatin condensation and nucleolar activity during mitosis [77].
Overall, we have described a standardized karyotype of three species of Carassius genus: C. auratus, C. carassius and C. gibelio. We compared these three species using cytogenetic tools: The arithmetic mean of the length of q + p chromosomal arm showed higher similarity of C. auratus and C. carassius, and a difference of C. gibelio (Figure 1). Analysis of median of the i value showed higher similarity of C. carassius and C. gibelio, and higher difference of C. auratus (Figure 2 and Figure 3). FISH confirmed a higher similarity of C. auratus to C. gibelio, compared to C. carassius (Figure 4). Thus, we can conclude that the genus Carassius has a very complex cytogenetic background, which can be distinguished using cytogenetic tools, with some inconsistencies in measuring propinquity and congeniality. The findings presented here are consistent with the presence of great genome variability and plasticity. Such geneome variability could be attributed to the occurance of rare natural phenomena such as interspecies hybridization, polyploidization, and/or alternation of reproduction modes within the genus Carassius [16,43,78,79].

Supplementary Materials

The following are available online at https://www.mdpi.com/article/10.3390/cells10092343/s1, Figure S1: Giemsa-stained chromosome metaphases (B&W) used for long (q) and short (p) chromosome arms measurement. The Figure shows one representative metaphase for each sex of each species. Each chromosome has a working numeric code 1–100. Metaphases show 100 chromosomes in (a) Carassius auratus (CAU) male, (b) C. auratus female, (c) C. carassius (CCA) male, (d) C. carassius female, (e) C. gibelio (CGI) male and (f) C. gibelio female, white circles in (f) indicate centromeric regions assigned as the narrowest part of chromosome. Figure S2: Giemsa-stained chromosome dissected from metaphase. Graphical example of the measurement of metacentric chromosome with four chromosomal arms (two chromatids). Two thin lines which lead through all four arms cross in the centromeric region—the narrowest part of chromosome. Long arm 1 ( q 1 ), long arm 2 ( q 2 ), short arm 1 ( p 1 ), short arm 2 ( p 2 ) have 14.8, 13.6, 12.6 and 12.4 pixels, respectively. Calculation of the q + p arm length is shown at the top right of the figure. Table S1: Carassius auratus q + p lengths were dissected from each metaphase and added into separate table. The last column ( m e a n _ l e n g t h ) shows arithmetic mean of length used for dot plot (Figure 1). Table S2: Carassius auratus i values were dissected from each metaphase and added into separate table. The last column ( m e a n _ i ) shows arithmetic mean of the i value used for dot plot (Figure 1).

Author Contributions

Conceptualization, M.K.; methodology, M.K. and N.R.F.; software, M.K.; validation, M.K.; formal analysis, M.K.; investigation, M.K. and N.R.F.; data curation, M.K.; writing—original draft preparation, M.K.; writing—review and editing, M.K., N.R.F.; visualization, M.K.; supervision, M.K.; project administration, M.K. All authors have read and agreed to the published version of the manuscript.

Funding

This research received no external funding.

Institutional Review Board Statement

All experimental procedures involving fish were approved by the Institutional Animal Care and Use Committee of the Czech Academy of Sciences, Institute of Animal Physiology and Genetics, according to the directives from the State Veterinary Administration of the Czech Republic, permit number 124/2009, and by the permit number CZ 00221 issued by the Ministry of Agriculture of the Czech Republic. M.K. is a holder of the Certificate of professional competence to design experiments according to §15d(3) of the Czech Republic Act No. 246/1992 coll. on the Protection of Animals against Cruelty (Registration number CZ 03973), provided by the Ministry of Agriculture of the Czech Republic.

Informed Consent Statement

Not applicable.

Data Availability Statement

Sanger sequencing data are available on-line at the NCBI database, accessed on 26 August 2021 (https://www.ncbi.nlm.nih.gov/). All data generated by R Studio are not presented in this study and they may be available on request from the corresponding author. All steps generating data frames and plots in R were summarized on-line on GitHub, accessed on 26 August 2021 (https://www.github.com/) available on request. Basic q + p arm measurements can be provided in the form of RData file as R workspace, also upon request.

Acknowledgments

We are very grateful to Evans lab (Department od Biology, McMaster University, Canada) which helped us with the basis of computational programming in R (namely Ben J. Evans, Caroline M.S. Cauret and Xue-Ying Song). We thank very much Adrian Forsythe (Department of Zoology, Evolutionary Biology Center, Uppsala University, Sweden) for English correction. We thank Abhishek Koladiya (Department of Immunomonitoring and Flow Cytometry, Institute of Hematology and Blood Transfusion, Czech Republic) for improvement R scripts. Furthermore, we thank MDPI Production Team (especially Liu and Jing) for figuring out LATEX issues, and Editorial Board of Cells for quick and positive feedback.

Conflicts of Interest

The authors declare no conflict of interest.

References

  1. Delaunay, L. Comparative karyological study of species Muscari Mill. and Bellevalia Lapeyr. Bull. Tiflis Bot. Gard. 1922, 2, 1–32. (In Russian) [Google Scholar]
  2. Levan, A.; Fredga, K.; Sandberg, A.A. Nomenclature for centromeric position on chromosomes. Hereditas 1964, 52, 201–220. [Google Scholar] [CrossRef]
  3. White, M.J.D. Animal Cytology and Evolution, 3rd ed.; Cambridge University Press: Cambridge, UK, 1973; p. 468. [Google Scholar]
  4. White, M.J.D. The Chromosomes, 6th ed.; Chapman Hall: London, UK, 1973; p. 188. [Google Scholar]
  5. Kretschmer, R.; Gunski, R.J.; Garnero, A.D.V.; de Freitas, T.R.O.; Toma, G.A.; Cioffi, M.D.B.; de Oliveira, E.H.C.; O’Connor, R.E.; Griffin, D.K. Chromosomal Analysis in Crotophaga ani (Aves, Cuculiformes) Reveals Extensive Genomic Reorganization and an Unusual Z-Autosome Robertsonian Translocation. Cells 2020, 10, 4. [Google Scholar] [CrossRef] [PubMed]
  6. O’Connor, R.E.; Kiazim, L.G.; Rathje, C.C.; Jennings, R.L.; Griffin, D.K. Rapid Multi-Hybridisation FISH Screening for Balanced Porcine Reciprocal Translocations Suggests a Much Higher Abnormality Rate Than Previously Appreciated. Cells 2021, 10, 250. [Google Scholar] [CrossRef] [PubMed]
  7. Cauret, C.M.; Gansauge, M.T.; Tupper, A.S.; Furman, B.L.; Knytl, M.; Song, X.Y.; Greenbaum, E.; Meyer, M.; Evans, B.J.; Wilson, M. Developmental Systems Drift and the Drivers of Sex Chromosome Evolution. Mol. Biol. Evol. 2020, 37, 799–810. [Google Scholar] [CrossRef]
  8. Augstenová, B.; Pensabene, E.; Kratochvíl, L.; Rovatsos, M. Cytogenetic Evidence for Sex Chromosomes and Karyotype Evolution in Anguimorphan Lizards. Cells 2021, 10, 1612. [Google Scholar] [CrossRef] [PubMed]
  9. Knytl, M.; Tlapakova, T.; Vankova, T.; Krylov, V. Silurana Chromosomal Evolution: A New Piece to the Puzzle. Cytogenet. Genome Res. 2018, 156, 223–228. [Google Scholar] [CrossRef]
  10. Gillberg, C. Chromosomal disorders and autism. J. Autism Dev. Disord. 1998, 28, 415–425. [Google Scholar] [CrossRef]
  11. Erkilic, N.; Gatinois, V.; Torriano, S.; Bouret, P.; Sanjurjo-Soriano, C.; Luca, V.D.; Damodar, K.; Cereso, N.; Puechberty, J.; Sanchez-Alcudia, R.; et al. A Novel Chromosomal Translocation Identified due to Complex Genetic Instability in iPSC Generated for Choroideremia. Cells 2019, 8, 1068. [Google Scholar] [CrossRef]
  12. Sember, A.; Bertollo, L.A.C.; Ráb, P.; Yano, C.F.; Hatanaka, T.; de Oliveira, E.A.; Cioffi, M.D.B. Sex Chromosome Evolution and Genomic Divergence in the Fish Hoplias malabaricus (Characiformes, Erythrinidae). Front. Genet. 2018, 9, 71. [Google Scholar] [CrossRef]
  13. Miura, I.; Shams, F.; Lin, S.M.; Cioffi, M.D.B.; Liehr, T.; Al-Rikabi, A.; Kuwana, C.; Srikulnath, K.; Higaki, Y.; Ezaz, T. Evolution of a Multiple Sex-Chromosome System by Three-Sequential Translocations among Potential Sex-Chromosomes in the Taiwanese Frog Odorrana swinhoana. Cells 2021, 10, 661. [Google Scholar] [CrossRef]
  14. Seroussi, E.; Knytl, M.; Pitel, F.; Elleder, D.; Krylov, V.; Leroux, S.; Morisson, M.; Yosefi, S.; Miyara, S.; Ganesan, S.; et al. Avian Expression Patterns and Genomic Mapping Implicate Leptin in Digestion and TNF in Immunity, Suggesting That Their Interacting Adipokine Role Has Been Acquired Only in Mammals. Int. J. Mol. Sci. 2019, 20, 4489. [Google Scholar] [CrossRef] [PubMed]
  15. Tymowska, J. Polyploidy and cytogenetic variation in frogs of the genus Xenopus. In Amphibian Cytogenetics and Evolution; Green, D.M., Sessions, S.K., Eds.; Academic Press: San Diego, CA, USA, 1991; pp. 259–297. [Google Scholar]
  16. Knytl, M.; Kalous, L.; Symonová, R.; Rylková, K.; Ráb, P. Chromosome studies of European cyprinid fishes: Cross-species painting reveals natural allotetraploid origin of a Carassius female with 206 chromosomes. Cytogenet. Genome Res. 2013, 139, 276–283. [Google Scholar] [CrossRef] [PubMed]
  17. Kobayasi, H.; Kawashima, Y.; Takeuchi, N. Comparative Chromosome Studies in the Genus Carassius, Especially with a Finding of Polyploidy in the Ginbuna (C. auratus langsdorfii). Jpn. J. Ichthyol. 1970, 17, 153–160. [Google Scholar] [CrossRef]
  18. Ojima, Y.; Takai, A. Further cytogenetical studies on the origin of the gold-fish. Proc. Jpn. Academy. Ser. B Phys. Biol. Sci. 1979, 55, 346–350. [Google Scholar] [CrossRef]
  19. Yang, L.; Sado, T.; Vincent Hirt, M.; Pasco-Viel, E.; Arunachalam, M.; Li, J.; Wang, X.; Freyhof, J.; Saitoh, K.; Simons, A.M.; et al. Phylogeny and polyploidy: Resolving the classification of cyprinine fishes (Teleostei: Cypriniformes). Mol. Phylogenet. Evol. 2015, 85, 97–116. [Google Scholar] [CrossRef] [PubMed]
  20. Lusk, S.; Hanel, L.; Lojkásek, B.; Lusková, V.; Muška, M. The Red List of Lampreys and Fishes of the Czech Republic. In Red List of Threatened Species of the Czech Republic, Vertebrates; Němec, M., Chobot, K., Eds.; Příroda: Prague, Czech Republic, 2017; Chapter 34; pp. 51–82. [Google Scholar]
  21. Sayer, C.D.; Copp, G.H.; Emson, D.; Godard, M.J.; Ziȩba, G.; Wesley, K.J. Towards the conservation of crucian carp Carassius carassius: Understanding the extent and causes of decline within part of its native English range. J. Fish Biol. 2011, 79, 1608–1624. [Google Scholar] [CrossRef] [PubMed]
  22. Ohno, S.; Muramoto, J.; Christian, L.; Atkin, N.B. Diploid-tetraploid relationship among old-world members of the fish family Cyprinidae. Chromosoma 1967, 23, 1–9. [Google Scholar] [CrossRef]
  23. Balon, E.K. About the oldest domesticates among fishes. J. Fish Biol. 2004, 65, 1–27. [Google Scholar] [CrossRef]
  24. Lusková, V.; Lusk, S.; Halačka, K.; Vetešník, L. Carassius auratus gibelio—The most successful invasive fish in waters of the Czech Republic. Russ. J. Biol. Invasions 2010, 1, 176–180. [Google Scholar] [CrossRef]
  25. Tarkan, A.S.; Güler Ekmekçi, F.; Vilizzi, L.; Copp, G.H. Risk screening of non-native freshwater fishes at the frontier between Asia and Europe: First application in Turkey of the fish invasiveness screening kit. J. Appl. Ichthyol. 2014, 30, 392–398. [Google Scholar] [CrossRef]
  26. Card, J.T.; Hasler, C.T.; Ruppert, J.L.; Donadt, C.; Poesch, M.S. A Three-pass electrofishing removal strategy is not effective for eradication of prussian Carp in a North American stream network. J. Fish Wildl. Manag. 2020, 11, 485–493. [Google Scholar] [CrossRef]
  27. Haynes, G.D.; Gongora, J.; Gilligan, D.M.; Grewe, P.; Moran, C.; Nicholas, F.W. Cryptic hybridization and introgression between invasive Cyprinid species Cyprinus carpio and Carassius auratus in Australia: Implications for invasive species management. Anim. Conserv. 2012, 15, 83–94. [Google Scholar] [CrossRef]
  28. Kalous, L.; Knytl, M. Karyotype diversity of the offspring resulting from reproduction experiment between diploid male and triploid female of silver Prussian carp, Carassius gibelio (Cyprinidae, Actinopterygii). Folia Zool. 2011, 60, 115–121. [Google Scholar] [CrossRef]
  29. Xiao, J.; Zou, T.; Chen, Y.; Chen, L.; Liu, S.; Tao, M.; Zhang, C.; Zhao, R.; Zhou, Y.; Long, Y.; et al. Coexistence of diploid, triploid and tetraploid crucian carp (Carassius auratus) in natural waters. BMC Genet. 2011, 12, 20. [Google Scholar] [CrossRef] [PubMed]
  30. Jiang, F.F.; Wang, Z.W.; Zhou, L.; Jiang, L.; Zhang, X.J.; Apalikova, O.V.; Brykov, V.A.; Gui, J.F. High male incidence and evolutionary implications of triploid form in northeast Asia Carassius auratus complex. Mol. Phylogenet. Evol. 2013, 66, 350–359. [Google Scholar] [CrossRef]
  31. Knytl, M.; Kalous, L.; Rab, P. Karyotype and chromosome banding of endangered crucian carp, Carassius carassius (Linnaeus, 1758) (Teleostei, Cyprinidae). Comp. Cytogenet. 2013, 7, 205–213. [Google Scholar] [CrossRef] [PubMed]
  32. Knytl, M.; Kalous, L.; Rylková, K.; Choleva, L.; Merilä, J.; Ráb, P. Morphologically indistinguishable hybrid Carassius female with 156 chromosomes: A threat for the threatened crucian carp, C. carassius, L. PLoS ONE 2018, 13, e0190924. [Google Scholar] [CrossRef] [PubMed]
  33. Bertollo, L.; Cioffi, M. Direct chromosome preparation from freshwater teleost fishes. In Fish Cytogenetic Techniques: Ray-Fin Fishes and Chondrichthyans; Ozouf-Costaz, C., Pisano, E., Foresti, F., Foresti, L.D.A.T., Eds.; CRC Press: Enfield, CT, USA, 2015; pp. 21–26. [Google Scholar]
  34. Schneider, C.A.; Rasband, W.S.; Eliceiri, K.W. NIH Image to ImageJ: 25 years of image analysis. Nat. Methods 2012, 9, 671–675. [Google Scholar] [CrossRef] [PubMed]
  35. R Core Team. R: A Language and Environment for Statistical Computing; R Core Team: Vienna, Austria, 2020; Available online: https://www.R-project.org (accessed on 20 August 2021).
  36. RStudio Team. RStudio: Integrated Development Environment for R; RStudio, PBC.: Boston, MA, USA, 2019; Available online: http://www.rstudio.com (accessed on 20 August 2021).
  37. Naito, E.; Dewa, K.; Ymanouchi, H.; Kominami, R. Ribosomal ribonucleic acid (rRNA) gene typing for species identification. J. Forensic Sci. 1992, 37, 396–403. [Google Scholar] [CrossRef] [PubMed]
  38. Sember, A.; Bohlen, J.; Šlechtová, V.; Altmanová, M.; Symonová, R.; Ráb, P. Karyotype differentiation in 19 species of river loach fishes (Nemacheilidae, Teleostei): Extensive variability associated with rDNA and heterochromatin distribution and its phylogenetic and ecological interpretation. BMC Evol. Biol. 2015, 15, 1–22. [Google Scholar] [CrossRef]
  39. Knytl, M.; Smolík, O.; Kubíčková, S.; Tlapáková, T.; Evans, B.J.; Krylov, V. Chromosome divergence during evolution of the tetraploid clawed frogs, Xenopus mellotropicalis and Xenopus epitropicalis as revealed by Zoo-FISH. PLoS ONE 2017, 12, e0177087. [Google Scholar] [CrossRef] [PubMed]
  40. Spoz, A.; Boron, A.; Porycka, K.; Karolewska, M.; Ito, D.; Abe, S.; Kirtiklis, L.; Juchno, D. Molecular cytogenetic analysis of the crucian carp, Carassius carassius (Linnaeus, 1758) (Teleostei, Cyprinidae), using chromosome staining and fluorescence in situ hybridisation with rDNA probes. Comp. Cytogenet. 2014, 8, 233–248. [Google Scholar] [CrossRef] [PubMed]
  41. Sember, A.; Pelikánová, Š.; de Bello Cioffi, M.; Šlechtová, V.; Hatanaka, T.; Do Doan, H.; Knytl, M.; Ráb, P. Taxonomic Diversity Not Associated with Gross Karyotype Differentiation: The Case of Bighead Carps, Genus Hypophthalmichthys (Teleostei, Cypriniformes, Xenocyprididae). Genes 2020, 11, 479. [Google Scholar] [CrossRef]
  42. Makino, S. Notes on the chromosomes of some fresh-water Teleosts. Jpn. J. Genet. 1934, 9, 100–103. [Google Scholar]
  43. Cherfas, N.B. Natural triploidy in females of the unisexual form of silver crucian carp (Carassius auratus gibelio Bloch). Genetika 1966, 2, 16–24. [Google Scholar]
  44. Chiarelli, B.; Ferrantelli, O.; Cucchi, C. The caryotype of some teleostea fish obtained by tissue culture in vitro. Experientia 1969, 25, 426–427. [Google Scholar] [CrossRef]
  45. Raicu, P.; Taisescu, E.; Banarescu, P. Carassius carassius and Carassius auratus, a pair of diploid and tetraploid representative species (Pices, Cyprinidae). Cytologia 1981, 46, 233–240. [Google Scholar] [CrossRef]
  46. Fister, S.; Soldatovic, B. Karyotype analysis of male and diploid female Carassius auratus gibelio, Bloch (Pisces, Cyprinidae) caught in the Danube at Belgrade, evidence for the existence of a bisexual population. Acta Vet. Beogr. 1991, 41, 81–90. [Google Scholar]
  47. Makino, S. A Karyological Study of Gold-fish of Japan. Cytologia 1941, 12, 96–111. [Google Scholar] [CrossRef]
  48. Ohno, S.; Atkin, N.B. Comparative DNA values and chromosome complements of eight species of fishes. Chromosoma 1966, 18, 455–466. [Google Scholar] [CrossRef]
  49. Ojima, Y.; Hitotsumachi, S.; Makino, S. Cytogenetic Studies in Lower Vertebrates. I A Preliminary Report on the Chromosomes of the Funa (Carassius auratus) and Gold-fish (A Revised Study). Proc. Jpn. Acad. 1966, 42, 62–66. [Google Scholar] [CrossRef]
  50. Ojima, Y.; Hitotsumachi, S. Cytogenetic studies in lower vertebrates. IV. a note on the chromosomes of the carp (cyprinus carpio) in comparison with those of the funa and the goldfish (Carassius auratus). Jpn. J. Genet. 1967, 42, 163–167. [Google Scholar] [CrossRef]
  51. Arai, R.; Fujiki, A. Chromosomes of three races of Goldfish, Kuro-demekin, Sanshiki- demekin and Ranchu. Bull. Natl. Sci. Mus. Ser. A Zool. 1977, 3, 187–192. [Google Scholar]
  52. Ojima, Y.; Ueda, T.; Narikawa, T. A Cytogenetic Assessment on the Origin of the Gold-fish. Proc. Jpn. Acad. Ser. B 1979, 55, 58–63. [Google Scholar] [CrossRef]
  53. Ojima, Y.; Yamano, T. The assignment of the nucleolar organizer in the chromosomes of the funa (Carassius, cyprinidae, pisces). Proc. Jpn. Acad. Ser. B 1980, 56, 551–556. [Google Scholar] [CrossRef]
  54. Zan, R.G.; Song, Z. Analysis and comparison between the karyotypes of Cyprinus carpio and Carassius auratus as well as Aristichthys nobilis and Hypophthalmichthys molitrix. Acta Genet. Sin. 1980, 7, 72–77. [Google Scholar]
  55. Zan, R.G. Studies of sex chromosomes and C-banding karyotypes of two forms of Carassius auratus in Kunming Lake. Acta Genet. Sin. 1982, 9, 32–39. [Google Scholar]
  56. Wang, R.F.; Shi, L.M.; He, W.S. A Comparative Study of the Ag-NORS of Carassius auratus from Different Geographic Districts. Zool. Res. 1988, 9, 165–169. [Google Scholar]
  57. Kasama, M.; Kobayasi, H. Hybridization Experiment Between Female Crucian Carp and Male Grass Carp. Nippon. Suisan Gakkaishi Jpn. Ed. 1989, 55, 1001–1006. [Google Scholar] [CrossRef]
  58. Kasama, M.; Kobayasi, H. Hybridization experiment between Carassius carassius female and Gnathopogon elongatus elongatus male. Jpn. J. Ichthyol. 1990, 36, 419–426. [Google Scholar] [CrossRef]
  59. Kasama, M.; Kobayashi, H. Hybridization experiment between Gnathopogon elongatus elongatus female and Carassius carassius male. Jpn. J. Ichthyol. 1991, 38, 295–300. [Google Scholar] [CrossRef]
  60. Hafez, R.; Labat, R.; Quillier, R. Cytogenetic study of some species of Cyprinidae from the Midi-Pyrenees region. Bull. Soc. D’Hist. Nat. Toulouse 1978, 114, 122–159. [Google Scholar]
  61. Sofradžija, A.; Berberović, L.; Hadžiselimović, R. Hromosomske garniture karaša (Carassius carassius) i babuške (Carassius auratus gibelio). Ichthyologia 1978, 10, 135–148. [Google Scholar]
  62. Mayr, B.; Ráb, P.; Kalat, M. NORs and counterstain-enhanced fluorescence studies in Cyprinidae of different ploidy level. Genetica 1986, 69, 111–118. [Google Scholar] [CrossRef]
  63. Kobayasi, H.; Ochi, H.; Takeuchi, N. Chromosome studies in the genus Carassius: Comparison of C. auratus grandoculis, C. auratus buergeri, and C. auratus langsdorfii. Jpn. J. Ichthyol. 1973, 20, 6. [Google Scholar] [CrossRef]
  64. Boron, A. Karyotypes of diploid and triploid silver crucian carp Carassius auratus gibelio (Bloch). Cytobios 1994, 80, 117–124. [Google Scholar]
  65. Boron, A.; Szlachciak, J.; Juchno, D.; Grabowska, A.; Jagusztyn, B.; Porycka, K. Karyotype, morphology, and reproduction ability of the Prussian carp, Carassius gibelio (Actinopterygii: Cypriniformes: Cyprinidae), from unisexual and bisexual populations in Poland. Acta Ichthyol. Piscat. 2011, 41, 19–28. [Google Scholar] [CrossRef]
  66. Kalous, L.; Bohlen, J.; Rylková, K.; Petrtýl, M. Hidden diversity within the Prussian carp and designation of a neotype for Carassius gibelio (Teleostei: Cyprinidae). Ichthyol. Explor. Freshwaters 2012, 23, 11–18. [Google Scholar]
  67. Papoušek, I.; Vetešník, L.; Halačka, K.; Lusková, V.; Humpl, M.; Mendel, J. Identification of natural hybrids of gibel carp Carassius auratus gibelio (Bloch) and crucian carp Carassius carassius (L.) from lower Dyje River floodplain (Czech Republic). J. Fish Biol. 2008, 72, 1230–1235. [Google Scholar] [CrossRef]
  68. Wouters, J.; Janson, S.; Lusková, V.; Olsén, K.H. Molecular identification of hybrids of the invasive gibel carp Carassius auratus gibelio and crucian carp Carassius carassius in Swedish waters. J. Fish Biol. 2012, 80, 2595–2604. [Google Scholar] [CrossRef] [PubMed]
  69. King, M. Species Evolution: The Role of Chromosome Change; Cambridge University Press: Cambridge, UK, 1993; p. 336. [Google Scholar]
  70. Cremer, T.; Cremer, C. Chromosome territories, nuclear architecture and gene regulation in mammalian cells. Nat. Rev. Genet. 2001, 2, 292–301. [Google Scholar] [CrossRef] [PubMed]
  71. Chevret, E.; Volpi, E.; Sheer, D. Mini review: Form and function in the human interphase chromosome. Cytogenet. Genome Res. 2000, 90, 13–21. [Google Scholar] [CrossRef]
  72. Claussen, U.; Michel, S.; Mhlig, P.; Westermann, M.; Grummt, U.W.; Kromeyer-Hauschild, K.; Liehr, T. Demystifying chromosome preparation and the implications for the concept of chromosome condensation during mitosis. Cytogenet. Genome Res. 2002, 98, 136–146. [Google Scholar] [CrossRef] [PubMed]
  73. Tjio, J.H.; Levan, A. The chromosome number of man. Hereditas 1956, 42, 1–6. [Google Scholar] [CrossRef]
  74. Zhu, H.P.; Ma, D.M.; Gui, J.F. Triploid origin of the gibel carp as revealed by 5S rDNA localization and chromosome painting. Chromosome Res. 2006, 14, 767–776. [Google Scholar] [CrossRef]
  75. Mantovani, M.; Abel, L.D.D.S.; Moreira-Filho, O. Conserved 5S and variable 45S rDNA chromosomal localisation revealed by FISH in Astyanax scabripinnis (Pisces, Characidae). Genetica 2005, 123, 211–216. [Google Scholar] [CrossRef]
  76. Gromicho, M.; Coutanceau, J.P.; Ozouf-Costaz, C.; Collares-Pereira, M.J. Contrast between extensive variation of 28S rDNA and stability of 5S rDNA and telomeric repeats in the diploid-polyploid Squalius alburnoides complex and in its maternal ancestor Squalius pyrenaicus (Teleostei, Cyprinidae). Chromosome Res. 2006, 14, 297–306. [Google Scholar] [CrossRef]
  77. Schmid, M.; Vitelli, L.; Batistoni, R. Chromosome banding in amphibia. XI. Constitutive heterochromatin, nucleolus organizers, 18S + 28S and 5S ribosomal RNA genes in Ascaphidae, Pipidae, Discoglossidae and Pelobatidae. Chromosoma 1987, 95, 271–284. [Google Scholar] [CrossRef]
  78. Zhou, L.; Wang, Y.; Gui, J.F. Genetic Evidence for Gonochoristic Reproduction in Gynogenetic Silver Crucian Carp (Carassius auratus gibelio Bloch) as Revealed by RAPD Assays. J. Mol. Evol. 2000, 51, 498–506. [Google Scholar] [CrossRef]
  79. Daněk, T.; Kalous, L.; Veselý, T.; Krásová, E.; Reschová, S.; Rylková, K.; Kulich, P.; Petrtýl, M.; Pokorová, D.; Knytl, M. Massive mortality of Prussian carp Carassius gibelio in the upper Elbe basin associated with herpesviral hematopoietic necrosis (CyHV-2). Dis. Aquat. Org. 2012, 102, 87–95. [Google Scholar] [CrossRef] [PubMed]
Figure 1. Relationship between centromeric index (i) and chromosomal length ( l e n g t h ). Top plot shows chromosomes of Carassius auratus in yellow, middle plot shows chromosomes of C. carassius in red and bottom plot shows chromosomes of C. gibelio in blue. Chromosomal categories are bounded by gray dashed vertical lines which define intervals 0–12.5, 12.5–25, 25–37.5 and 37.5–50 corresponding to acrocentric (a), subtelocentric ( s t ), submetacentric ( s m ) and metacentric (m) chromosomes, respectively. Both plotted i value and l e n g t h are presented as an arithmetic mean of each chromosome.
Cells 10 02343 g001
Figure 2. Intrachromosomal variability of i displayed on a whole chromosomal complement. Top plot shows haploid chromosomal complement (50 chromosomes) of C. auratus in yellow, middle plot shows 50 chromosomes of C. carassius in red and bottom plot shows 50 chromosomes of C. gibelio in blue. Each chromosome is linked to i value (y axis). Upper and lower whiskers show extreme values, the minimum ( Q 0 ) and maximum ( Q 4 ), respectively, boxes involve the first quartile ( Q 1 ) and the third quartile ( Q 3 ) group of values. Black line within box indicates m e d i a n value of the dataset ( Q 2 ). Outliers (errors) are drawn as black points.
Cells 10 02343 g002
Figure 3. Box plots composed of orthologous chromosomes of each species. Chromosomes are ordered decreasingly according to the i value. Chromosomes on the top left of the figure are the most metacentric, chromosome 1 (chr1), chromosomes on the bottom right of the figure are the most telocentric (chr50). Yellow, red and blue boxes represents C. auratus, C. carassius and C. gibelio, respectively. Each chromosome is linked to i value (y axis). Upper ( Q 0 ) and lower ( Q 4 ) whiskers show extreme values, boxes involve Q 1 and Q 3 group of values. The black line within boxes indicates m e d i a n value of the dataset ( Q 2 ). Outliers (errors) are drawn as black points. The grid in some box plots represents significantly different i values within the Q 1 Q 3 range. Box plots without the grid share some i values within the Q 1 Q 3 range.
Cells 10 02343 g003
Figure 4. Double-colour fluorescent in situ hybridization with 5S and 28S ribosomal probes. DAPI-counterstained metaphase spreads show 100 chromosomes (B&W) in (a) C. auratus (CAU), (b) C. carassius (CCA) and (c) C. gibelio (CGI). The 5S (green) probe shows two more intensive (strong) signals and eight, six and eight less intensive (weak) signals in (d) C. auratus, (e) C. carassius and (f) C. gibelio, respectively. The 28S rDNA probe (red) reveals two strong signals and two, four and two weak signals in (d) C. auratus, (e) C. carassius and (f) C. gibelio, respectively. Green and red arrows correspond to 5S and 28S ribosomal loci, respectively.
Cells 10 02343 g004
Table 1. Chromosomal nomenclature used for determination of chromosomal categories according to Levan et al. [2].
Centromeric PositionArm RatioCentromeric IndexChromosome Category
median sensu stricto1.0050M (metacentric sensu stricto)
median1.01–1.7049.9–37.51m (metacentric)
submedian1.71–3.0037.50–25.01sm (submetacentric)
subterminal3.01–7.0025.00–12.51st (subtelocentric)
terminal>7.0112.50–0.01a/t (acro-/telocentric)
terminal sensu stricto0T (telocentric sensu stricto)
Table 2. Table of values used for determination of standardized karyotype. Each m e d i a n ( Q 2 ) of i values corresponds to certain chromosomal category of chr1–50. The m e d i a n s of i value are sorted decreasingly. CAU = C. auratus, CCA = C. carassius, CGI = C. gibelio, m = metacentric, sm = submetacentric, st = subtelocentric, a = acrocentric, T = telocentric sensu stricto.
CAU_median_iCCA_median_iCGI_median_iCAU_categoryCCA_categoryCGI_category
chromosome147.8748.2848.55mmm
chromosome247.0745.6846.12mmm
chromosome345.7444.7444.99mmm
chromosome444.8143.5243.47mmm
chromosome543.4642.1142.53mmm
chromosome642.4341.0840.89mmm
chromosome741.6339.5839.89mmm
chromosome840.8437.9038.42mmm
chromosome940.1336.8136.91msmsm
chromosome1039.6736.1735.84msmsm
chromosome1138.7535.7935.41msmsm
chromosome1237.6535.1934.73msmsm
chromosome1336.7734.8634.25smsmsm
chromosome1436.1934.3633.36smsmsm
chromosome1535.8833.6632.61smsmsm
chromosome1635.7132.7031.90smsmsm
chromosome1735.4832.2228.62smsmsm
chromosome1835.2131.2326.86smsmsm
chromosome1934.8730.5426.07smsmsm
chromosome2034.3329.1124.42smsmst
chromosome2133.4528.5423.45smsmst
chromosome2233.0327.4122.83smsmst
chromosome2332.7826.8621.37smsmst
chromosome2431.9526.2516.52smsmst
chromosome2531.4125.229.19smsma
chromosome2631.0824.000.00smstT
chromosome2730.7022.570.00smstT
chromosome2830.1120.620.00smstT
chromosome2929.7518.130.00smstT
chromosome3028.960.000.00smTT
chromosome3128.170.000.00smTT
chromosome3226.870.000.00smTT
chromosome3324.410.000.00stTT
chromosome3411.190.000.00aTT
chromosome350.000.000.00TTT
chromosome360.000.000.00TTT
chromosome370.000.000.00TTT
chromosome380.000.000.00TTT
chromosome390.000.000.00TTT
chromosome400.000.000.00TTT
chromosome410.000.000.00TTT
chromosome420.000.000.00TTT
chromosome430.000.000.00TTT
chromosome440.000.000.00TTT
chromosome450.000.000.00TTT
chromosome460.000.000.00TTT
chromosome470.000.000.00TTT
chromosome480.000.000.00TTT
chromosome490.000.000.00TTT
chromosome500.000.000.00TTT
Table 3. Previously published karyotypes of diploid C. auratus, C. carassius and C. gibelio including information about sex and locality of the investigated individuals. NA = information not available, F = female, M = male.
KaryotypeSexLocalityReferences
 C. auratus
2 n = 94 NAJapan[42,47]
2 n = 96 –104F, MNA[48]
2 n = 100 ( 12 m + 36 s m + 52 s t a ) F, MJapan[49,50]
2 n = 104 ( 46 m + 16 s m + 42 a ) F, MNA[22]
2 n = 104 ( 20 m + 72 s m s t + 12 a ) NANA[44]
2 n = 100 ( 20 m + 40 s m + 40 a ) F, MNA[17]
2 n = 100 ( 16 m + 84 s m a ) NANA[51]
2 n = 100 ( 12 m + 36 s m + 52 s t a ) F, MChina[18,52,53]
2 n = 100 ( 22 m + 30 s m + 48 s t a ) F, MChina[54,55,56]
 C. carassius
2 n = 104 ( 20 m + 72 s m s t + 12 a ) NANA[44]
2 n = 100 ( 20 m + 40 s m + 40 a ) F, MNetherlands[17,57,58,59]
2 n = 100 ( 20 m + 44 s m + 36 a ) NAFrance[60]
2 n = 100 F, MBosnia[61]
2 n = 50 ( 20 m + 12 s m + 18 s t a ) NARomania[45]
2 n = 100 F, MCzech Republic[62]
2 n = 100 ( 20 m + 36 s m + 44 s t a ) F, MCzech Republic[16,31]
2 n = 100 ( 20 m + 36 s m + 44 s t a ) F, MPoland[40]
2 n = 100 ( 20 m + 36 s m + 44 s t a ) MFinland[32]
 C. gibelio
2 n = 94 F, MBelarus[43]
2 n = 100 ( 20 m + 40 s m + 40 a ) NARiver Amur[63]
2 n = 98 ( 48 m s t + 50 a ) NARomania[45]
2 n = 102 ( 24 m + 36 s m s t + 42 a ) FYugoslavia[46]
2 n = 104 ( 24 m + 36 s m s t + 44 a ) MYugoslavia[46]
2 n = 100 ( 14 m + 24 s m + 62 s t a ) F, MPoland[64]
2 n = 100 ( 26 m + 38 s m + 36 s t a ) F, MPoland[65]
Publisher’s Note: MDPI stays neutral with regard to jurisdictional claims in published maps and institutional affiliations.

