

Plasma Treated Cattle Slurry Moderately Increases Cereal Yields


Faculty of Applied Ecology, Agricultural Sciences, and Biotechnology, Inland Norway University of Applied Sciences, 2418 Elverum, Norway
*
Author to whom correspondence should be addressed.
Agronomy 2023, 13(6), 1549; https://doi.org/10.3390/agronomy13061549
Submission received: 4 May 2023
/
Revised: 30 May 2023
/
Accepted: 1 June 2023
/
Published: 2 June 2023
(This article belongs to the Special Issue Cropping Systems and Agronomic Management Practices of Field Crops)
Abstract
:Plasma treatment offers an approach to enhance the nitrogen (N) content of livestock slurry and biogas digestate, thereby increasing the efficacy of organic fertilizers. This innovative method is used to produce nitrogen-enriched organic fertilizer (NEO) containing a double concentration of plant-available N. Over three years, we conducted a comprehensive study in 14 spring wheat and barley field trials in Norway. The primary objective was to assess and compare the cereal grain yield achieved by applying NEO to other conventional fertilizers. The NEO utilized in our research was derived from the unit developed by the Norwegian company N2 Applied. The results indicated that 120 kg N ha−1 in NEO yielded in the same range of cereal grains as 95 kg N ha−1 in mineral fertilizer. Moreover, the combination of untreated slurry and 55 kg N ha−1 in mineral fertilizer Opti-NS yielded the same as 120 kg N ha−1 in NEO. Surprisingly a combination of 12 kg N ha−1 in mineral fertilizer at sowing day and 108 kg N ha−1 in NEO at the three-leaf stage led to a higher yield in spring wheat than 120 kg N ha−1 NEO spread at sowing day in two out of three experimental years. Moreover, applying NEO directly to plants has shown no visible signs of harm. Lastly, filtering the slurry resulted in higher cereal grain yields than the untreated slurry. In conclusion, despite possessing the same N content, utilizing NEO yielded a 15–20% lower cereal grain yield than mineral fertilizer. Nonetheless, 20–30% more yield than the native amount of cattle slurry it derived. However, we have observed an unexplained loss of approximately 17% of the nitrogen in NEO, which does not translate into increased grain yield or nitrogen productivity.
1. Introduction
Global food production systems encounter numerous challenges due to rising food demand, which coincides with population growth [1]. Simultaneously, the detrimental effects of global warming and soil degradation are progressively diminishing production capacity [2]. In this context, agroecosystems face substantial societal pressure to foster sustainable food production [3,4,5,6].
The beneficial impact of nitrogen (N) fertilization on plant productivity has been extensively studied and widely acknowledged [7,8]. Moreover, the availability of nitrogen (N) is a fundamental necessity in plant production [9,10], and as such, the utilization of N in agroecosystems has undergone a significant transformation in recent decades [11]. Nevertheless, the excessive application of nitrogen fertilizers can give rise to significant drawbacks and unfavorable outcomes, despite their initial positive effects [12]. Beyond that, the production process of mineral fertilizers results in environmental pollution, disturbance of natural processes, and substantially adverse effects on biodiversity and the climate [13]. This clarifies the necessity of developing sustainable agricultural amendments based on organic principles.
Over the last twelve years, the Norwegian company N2 Applied has developed a unit to enhance the nitrogen content of slurry or digestate, with electricity and air as the only inputs [14,15,16]. The process uses electrical energy to generate an air plasma, where oxygen and nitrogen combine to form a reactive nitrogen gas. The NOx is subsequently absorbed in the slurry as nitrate and nitrite, enriching the slurry with plant-available nitrogen and reducing the pH. The plasma-treated slurry is termed Nitrogen Enriched Organic fertilizers (NEO). The unit is currently accessible for scientific use and testing by producers, with plans for potential commercial availability in Europe in 2023.
The company reports that their units require 50 kWh of electricity per kg N added to the slurry. Consequently, based on an average addition of 1.65 kg N ton−1 slurry, the unit would require 82.5 kWh of electricity per ton of treated slurry. Additionally, the company reports that the N2 Applied unit has a daily 5–8 tons capacity.
Since NEO is a novel product, assessing its impact on plant yield and its effectiveness compared to conventional fertilizers, e.g., mineral fertilizers, cattle slurry, etc., is essential before considering its commercialization. Thus, to accomplish this, we at Inland Norway University of Applied Sciences (INN) conducted comprehensive trials to document and compare the effects of NEO on soil health [17,18] and plant yields in the growing chamber [19] and cereal and grass fields at different locations in Norway over three years (2020 to 2022).
The current study investigates and compares the effects of NEO made from cattle slurry on grain yields of spring barley (Hordeum vulgare L.) and spring wheat (Triticum aestivum L.), hereafter termed barley and wheat, to other conventional fertilizers used in agriculture. Additionally, we anticipate publishing the results from our grass trials in a forthcoming paper.
Since NEO is a novel product with potentially beneficial gains, its effects on plant yields should be elucidated before introducing it into the global markets. Therefore, this study aims to determine the effects of NEO made from cattle slurry on cereal yields in Norway compared to farmers’ alternatives, such as mineral fertilizers and untreated cattle slurry. Therefore, the research questions were: (1) What is the fertilization effect of NEO compared to the other alternatives; and (2) Can NEO be spread at three leaf stage without harming the plants, and if so, would such an application produce a higher yield than NEO spread at the sowing day.
We hypothesized that: (1) NEO could produce the same grain yields as mineral fertilizer, and (2) spreading NEO at the three-leaf stage does not harm the plants but instead boost growth and yield compared to spreading NEO on sowing day.
2. Materials and Methods
2.1. Experimental Design
The experimental design consisted of a randomized complete block design with four replicates, encompassing Series 1 and Series 2. In Series 1, the fertilizer plots measured 10 × 3 m, with a harvested area of 1.5 × 8.5 m within each plot. The larger plot size in Series 1 was necessary to facilitate extensive soil sampling for analyzing soil organisms and overall soil health. In Series 2, the fertilizer plots were smaller, measuring 2.5 × 8 m, with harvest plots at 1.5 × 6.5 m.
The results obtained in 2020 provided indicative evidence supporting the notion that filtered slurry yields positive effects. As a result, the plots receiving the filtered slurry treatment in 2020 were transformed into control treatments with no fertilizers in Series 1 for the 2021 and 2022 trials. Additionally, another finding from 2020 indicated that applying NEO at the three-leaf stage of grain plants resulted in lower yields than NEO applied on sowing day. Consequently, a separate series of trials in Series 2 was designed, omitting the NEO application at the three-leaf stage treatment. Furthermore, the N-level treatments in mineral fertilizers were increased to assess the nitrogen effect of NEO better.
2.2. Trials Location
2.3. Fertilizers
In the trials, we used the following fertilizers:
- Untreated slurry: Cattle Slurry from the Norwegian University of Life Sciences farm.
- NEO (Nitrogen Enriched organic fertilizer): This is the same slurry as «Untreated slurry» processed through the N2 Applied unit. The available nitrogen in NEO is around 50% ammonia, 30% nitrate, and 20% nitrite, and the acidity is down to around pH 5.2. The relative levels of nitrate and nitrite vary quite a lot. See Table 2.
- Mineral fertilizer 18-3-15: A commercially available mineral fertilizer produced by Yara [20] with 18% nitrogen (N), 3% phosphorus (P), and 15% potassium (K). The 18% N consists of slightly more ammonia than nitrate. This fertilizer was chosen due to the similarities in plant available nutrients to NEO.
- Mineral fertilizer Opti-NS (27-0-0) [21]: This is an N fertilizer combined with sulfur (S) (3.6%), where the N consists of equal amounts of ammonia and nitrate.
During the production process in N2-Applied’s plasma reactor, the untreated slurry undergoes filtering to remove solid particles larger than 5 mm using a screw press, which reduces the original volume by 10%. As a result, the filtered material has a consistency similar to soft coarse peat. This filtering, combined with the plasma treatment, transforms the liquid fertilizer into NEO, which exhibits enhanced soil permeation compared to the untreated liquid slurry.
To determine the appropriate quantities of NEO and other fertilizers for the different trial plots, the company sent samples to AnalyTech Environmental Laboratory in Denmark. In 2021 and 2022, the analysis was conducted on the untreated manure and the pre-produced NEO two weeks before their application in the experimental sites. Table 2 provides the nitrogen and pH values of NEO and untreated slurry for 2020, 2021, and 2022.
In 2020, N2 Applied conducted a test production of NEO in March and sent samples for nitrogen content testing to the Danish lab. The fertilizer amounts for the 2020 trials were calculated based on the results. Unfortunately, an error occurred during the production of NEO intended for the field trials, resulting in lower nitrogen content than initially calculated. As a result, the results from the 2020 trials remain valid but cannot be directly compared. Instead, they serve as supporting material for the results obtained in 2021 and 2022.
The primary objective of our studies was to assess the impact of NEO on crop yield in comparison to other farmer alternatives. Therefore, we established a baseline of 120 kg N ha−1 for both wheat and barley, considering it as a typical level for barley in Norway’s grain regions, albeit slightly lower than what is commonly used for spring wheat. To achieve the desired nitrogen level of 120 kg per hectare, approximately 40 tons of cattle slurry were processed through the N2 Applied’s plasma process unit after filtering. The process converted 40 tons of cattle slurry into 37 tons of NEO containing 120 kg of nitrogen.
In 2020, we conducted two trials in series 1. Unfortunately, due to the abovementioned production error, the nitrogen content in the cattle slurry-based treatments differed in 2020 compared to 2021 and 2022. Table 3 presents the treatments labeled (bold) in series 1 and 2 over three years.
Filtered slurry and NEO have different N contents from year to year. Considering this, adjustments were made to keep the nitrogen content per hectare constant from year to year as the most decisive factor.
In 2021 the N-content in NEO was 3.2 kg N ton−1, and we aimed for fertilization with 120 kg N ha−1 in NEO, accordingly 37.5 tons ha−1. As mentioned, 10% of cattle slurry is filtered through NEO production. Thus, the farmers’ alternative is to spread 41 tons ha−1 of untreated slurry. In 2021 the N-content in the untreated slurry was 1.5 kg N ton−1. This year, applying 41 tons ha−1 of untreated slurry to the trial plots provided 61.5 kg N/ha−1. In 2022 the NEO had 3.55 kg N ton−1, resulting in 34 tons ha−1 of NEO reaching 120 kg N ha−1. The untreated had 1.75 kg N ton−1, and with a 10% higher volume than NEO, we applied 37 tons ha−1 of untreated slurry—resulting in 65 kg N ha−1. With this clarification, we used 65 kg N ha−1 in the graph labels for the untreated slurry for 2021 and 2022.
It is also necessary to clarify a point regarding the mineral fertilizer plus NEO treatment (MiNEO120). In earlier testing of NEO, the N2 Applied company had experienced that NEO could be applied to cereals after germination. Therefore, we agreed to test this in series 1 by forming the MiNEO120 treatment, where we applied 12 kg N ha−1 in mineral fertilizer Yara Mila complete fertilizer 18-3-15 (Yara, Oslo, Norway) to the trial plots before sowing, combined with 108 kg N ha−1 in NEO applied at three leaves stage Zadoks GS13 [22]. All the other treatments were applied on sowing day by spreading the fertilizers on the trial plots and mixing them into the soil using a disc harrow. The grain was sown a few hours after fertilization.
2.4. Weather Conditions
Table 4 presents May’s average temperature, precipitation, and corresponding average values in all trial locations over 2020–2022. Series 1 had trials in Hamar and Årnes. In 2020, Hamar was 1.4 °C colder than average and had less than half of the normal precipitation. In 2021, Hamar and Årnes had a normal average temperature but about 20% more precipitation than normal. In 2022, Hamar had a normal average temperature but a dry month of May with 23.2 mm less precipitation than the normal 55 mm. The trials in Series 2 were in Tønsberg and Stjørdal. Tønsberg had 24 mm more rain than average in 2021 and about half the normal precipitation in 2022. Stjørdal had a dry month in May, with half the normal precipitation in 2021 and average rainfall in 2022 [23].
2.5. Data Handling, Statistics, and Analysis
Field trial data were first analyzed using ANOVA and Duncan’s multiple-range tests of the means. Then, the N effect of NEO was calculated against the nitrogen effect of mineral fertilizer. This was possible as we included a mineral fertilization ladder ranging from 0 kg N-min ha−1 to 120 kg N-min ha−1. Next, a linear regression model expressed the relationship between N provided in mineral fertilization (x axis) and grain yield (y axis). The same was done for the N yield data. The regression equations were then used to calculate the N effect of 120 kg N-min ha−1 provided in NEO based on yield and N yield data, respectively. This procedure was repeated for each of the trials and finally across all trials, with 95% confidence intervals. Statistical analyses were done in SPSS 28 software (© 2023 IBM (New York, NY, USA). Excel (© 2023 Microsoft (Seattle, WA, USA), and Minitab 21 (2023 Minitab, LLC (State College, PA, USA)), were used for the graphics. Finally, we analyzed samples from all the trial plots for N percentage with the Dumas method to find the Nitrogen yields.
3. Results
3.1. Barley and Wheat Grain and Nitrogen Yield—Series 1 2020
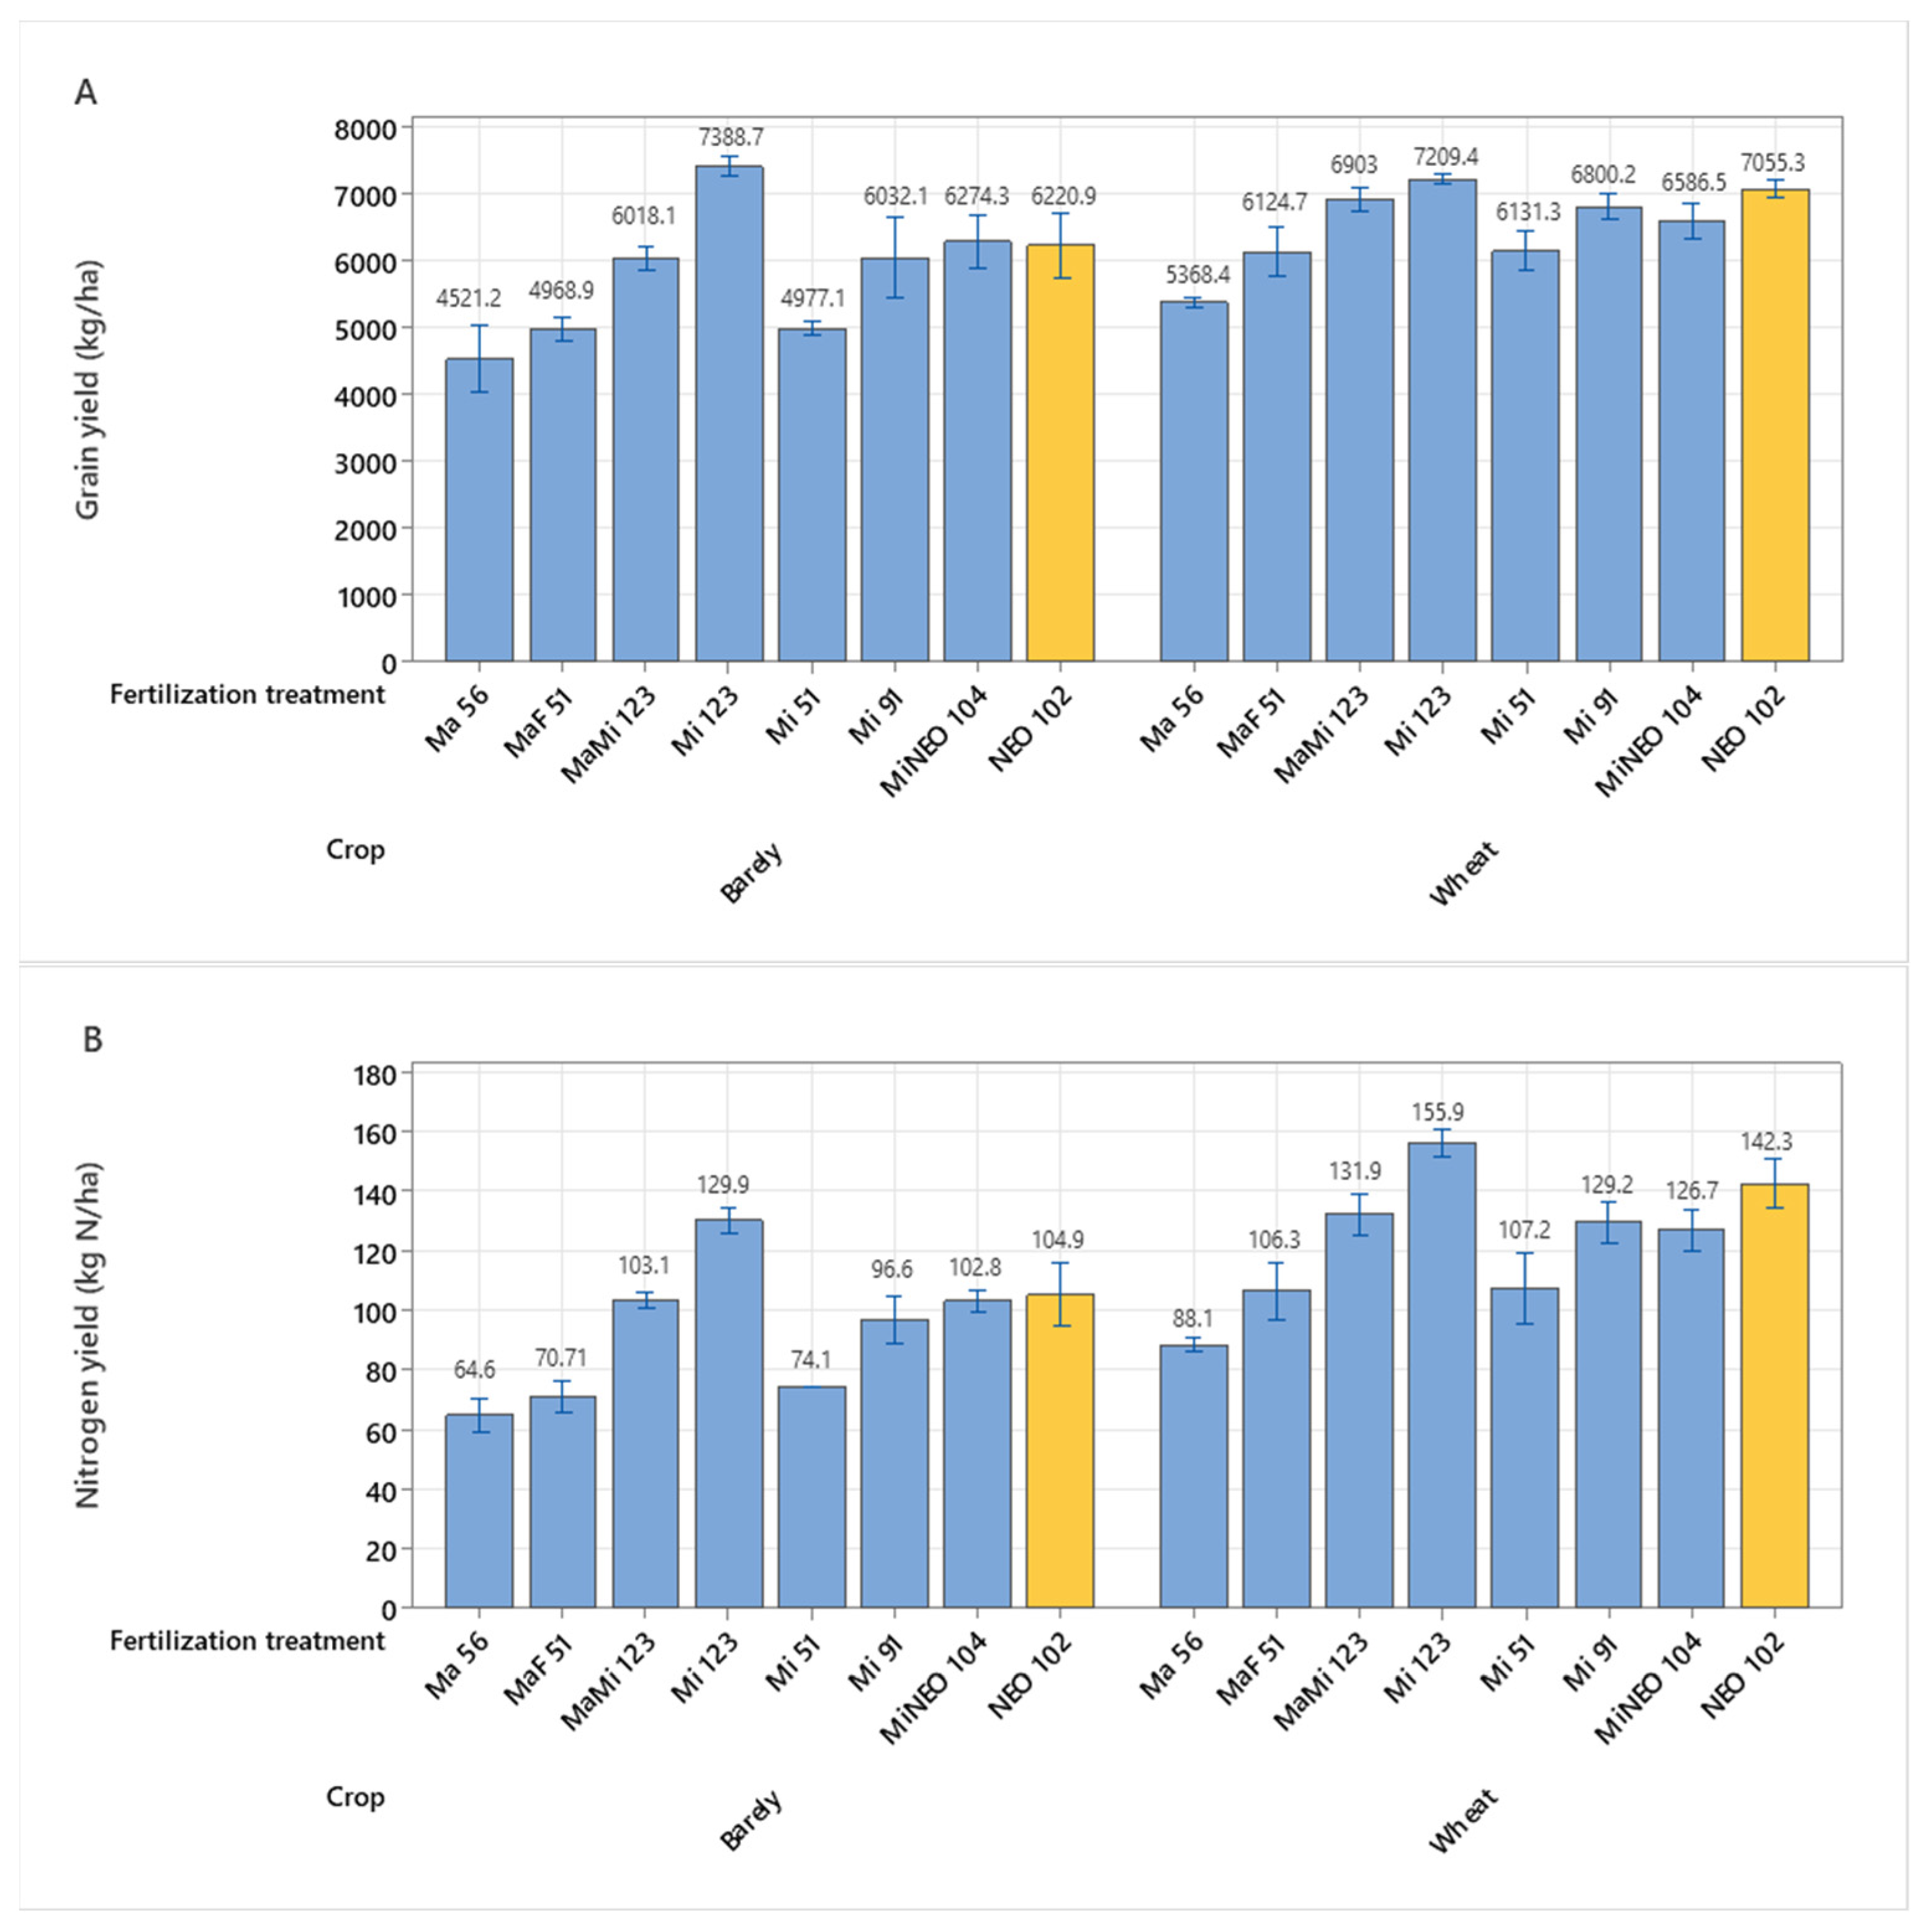
In 2020, when examining barley grain yield (Figure 2A), it was found that NEO102 produced a yield equivalent to that of MiNEO104, Mi91, and MaMi123. However, Mi123 exhibited a significantly higher yield than all other treatments. Additionally, MaF51 demonstrated a yield of 448 kg ha−1, which was significantly higher than that of Ma56.
When considering wheat grain yield (Figure 2A), it was observed that NEO102 yielded significantly more (469 kg ha−1) compared to MiNEO104 while producing a yield similar to that of Mi91 and MaMi123. However, once again, Mi123 displayed a significantly higher yield than the rest of the treatments. Notably, MaF51 demonstrated a significantly higher yield of 756 kg ha−1, surpassing that of Ma56.
The trend in nitrogen yield for barley and wheat (Figure 2B) followed a similar pattern to grain yield; however, the differences between the treatments became more pronounced.
3.2. Barley and Wheat Grain and Nitrogen Yield—Series One, 2021 and 2022
Here, we present the results from three separate trials conducted in barley and wheat as part of Series one in 2021 and 2022. We have analyzed the data separately for grain yield and nitrogen yield.
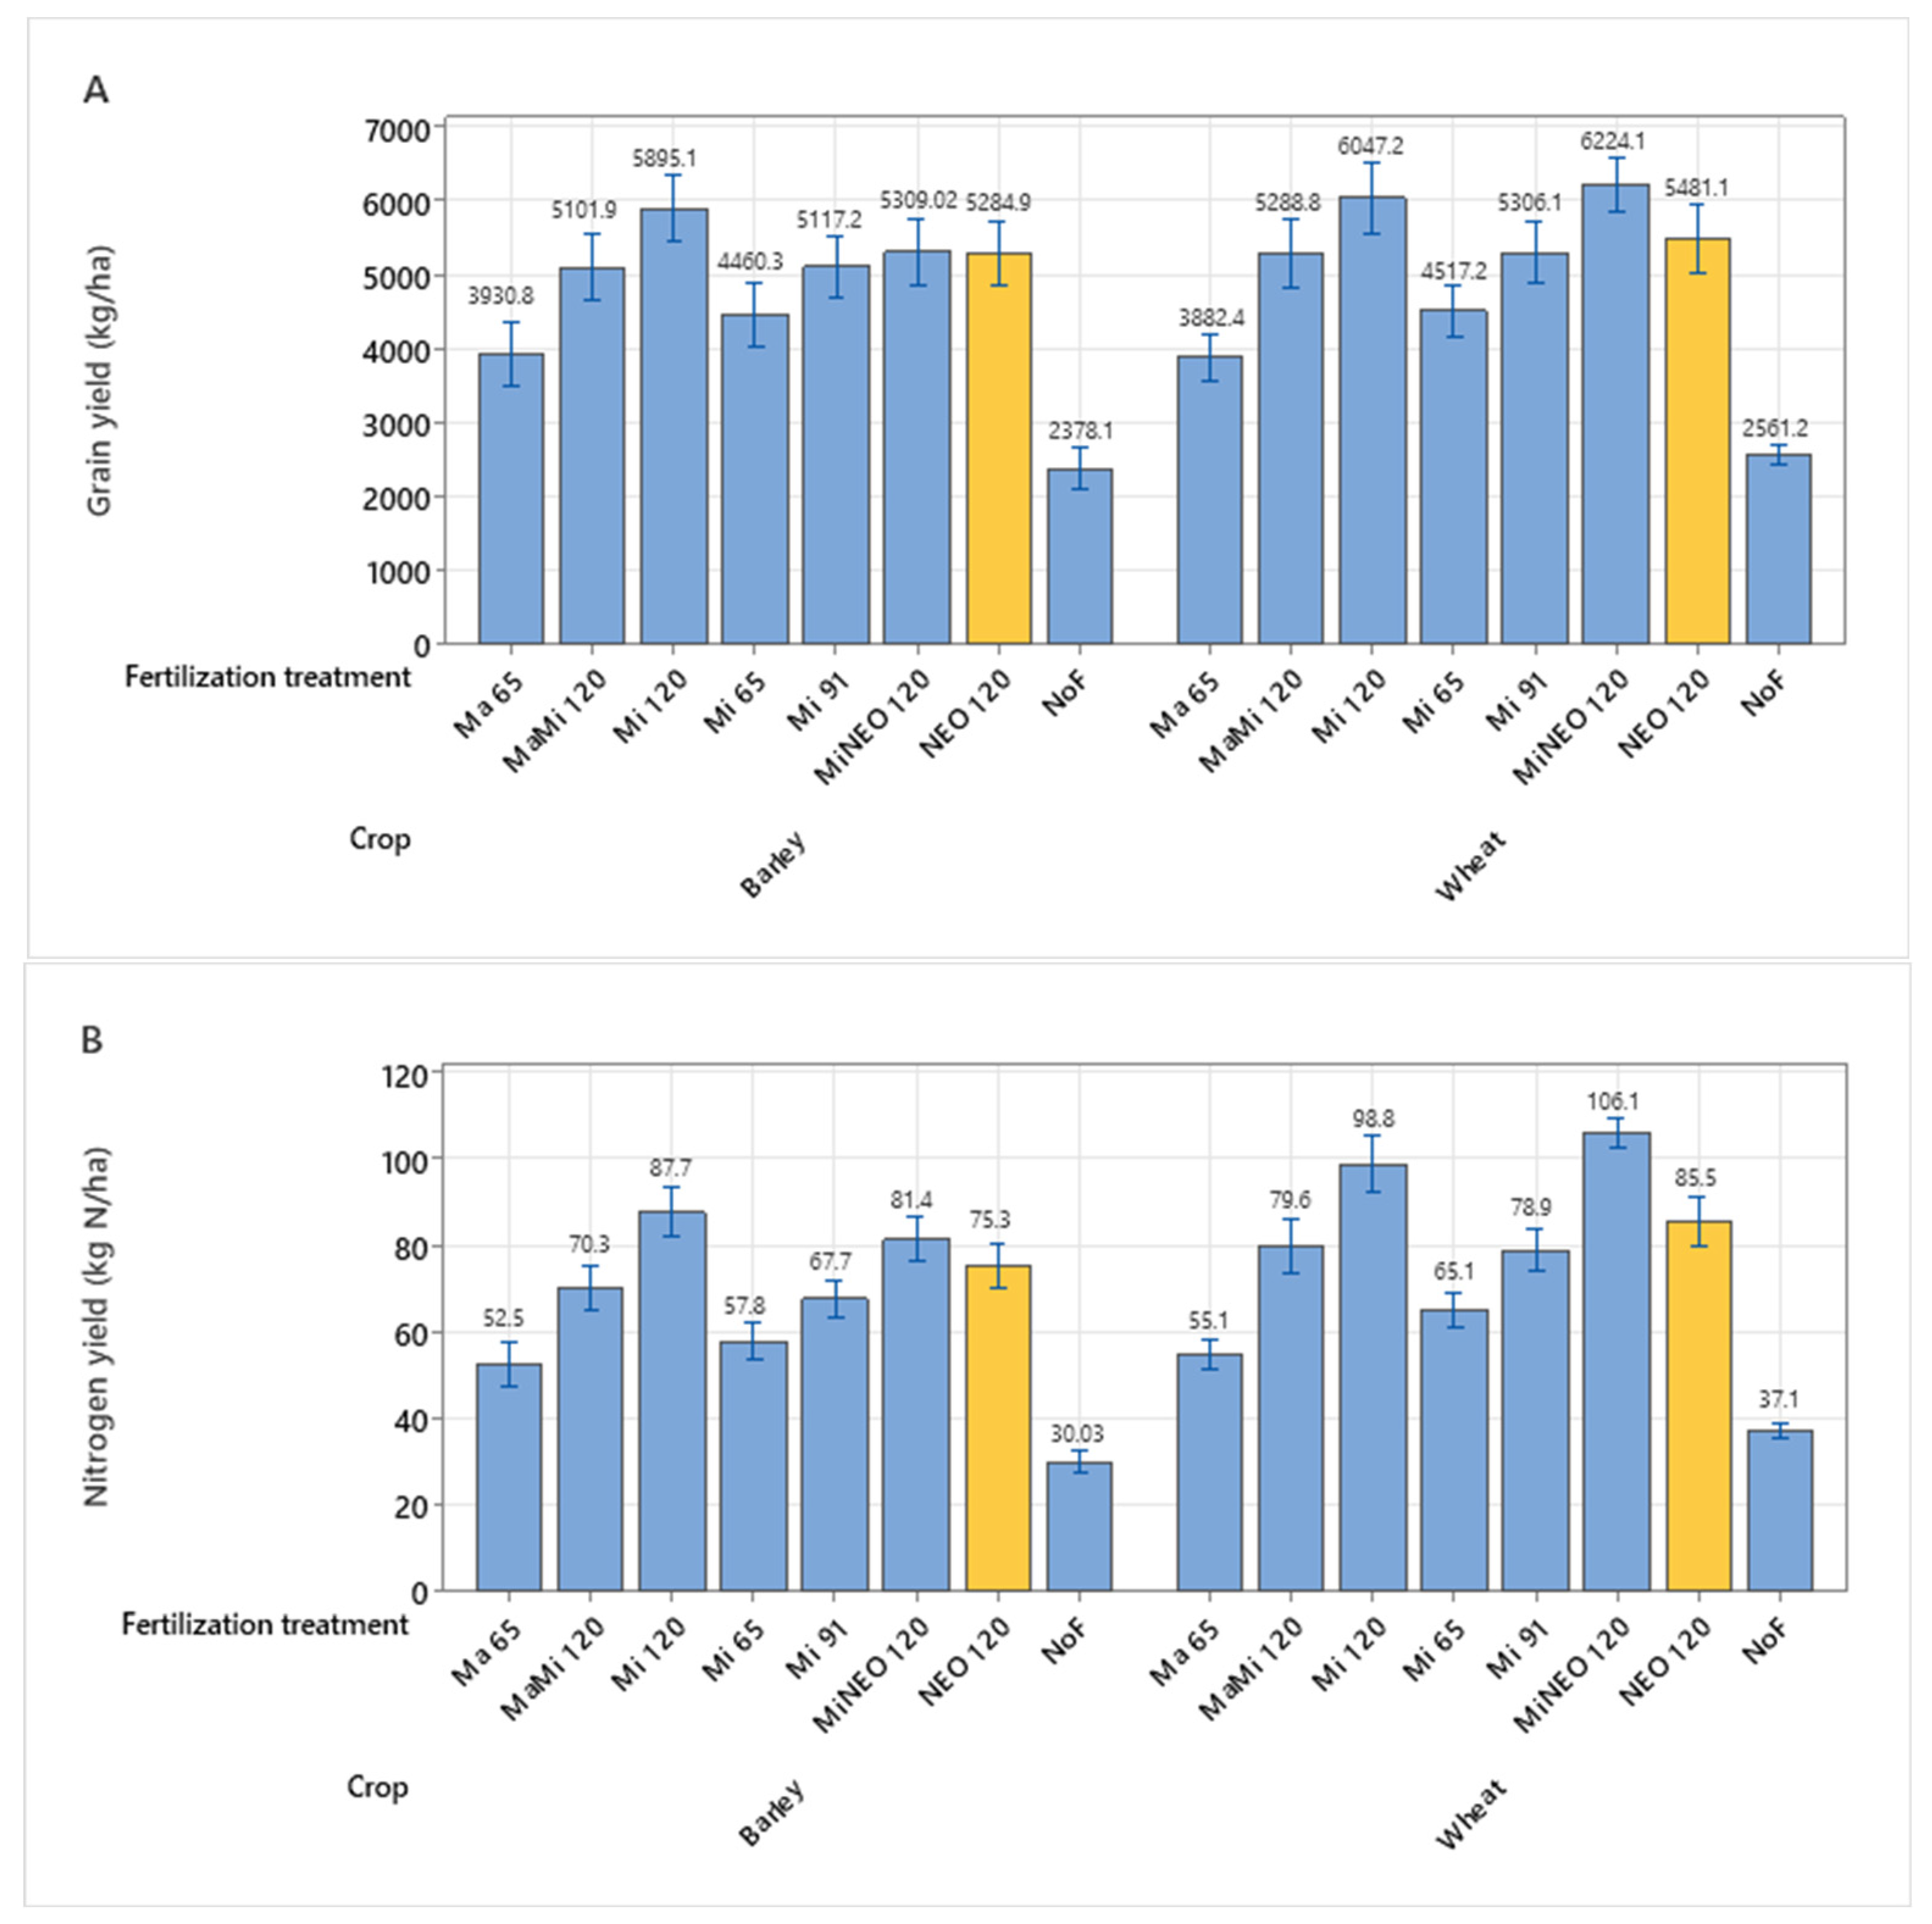
Regarding barley grain yield (Figure 3A) among the treatments, Mi120 demonstrated the highest yield, surpassing MiNEO120, NEO120, and MaMi120 by 586 kg ha−1, 610 kg ha−1, and 793 kg ha−1, respectively. Notably, MiNEO120 and NEO120 yielded alike, with both treatments significantly outperforming Ma65 and falling within the range of Mi91.
Furthermore, regarding wheat grain yield (Figure 3A), unlike the barley results, MiNEO120 yielded higher than other treatments; the difference was insignificant to Mi120, NEO120, and MaMi120. NEO120 yielded in the same range as Mi91 but significantly surpassed Ma65.
Regarding nitrogen barley yield (Figure 3B), the pattern observed mirrored that of grain yield, displaying similar trends across the treatments. However, considering the nitrogen wheat yield (Figure 3B), MiNEO120 exhibited the highest nitrogen yield, reaching 106.1 kg N ha−1. This result was significantly higher than both NEO120 and MaMi120, and it exceeded Mi120 by an additional 8.7 kg N ha−1, although the latter difference was insignificant.
3.3. Barley and Wheat Grain and Nitrogen Yield—Series Two, 2021–2022
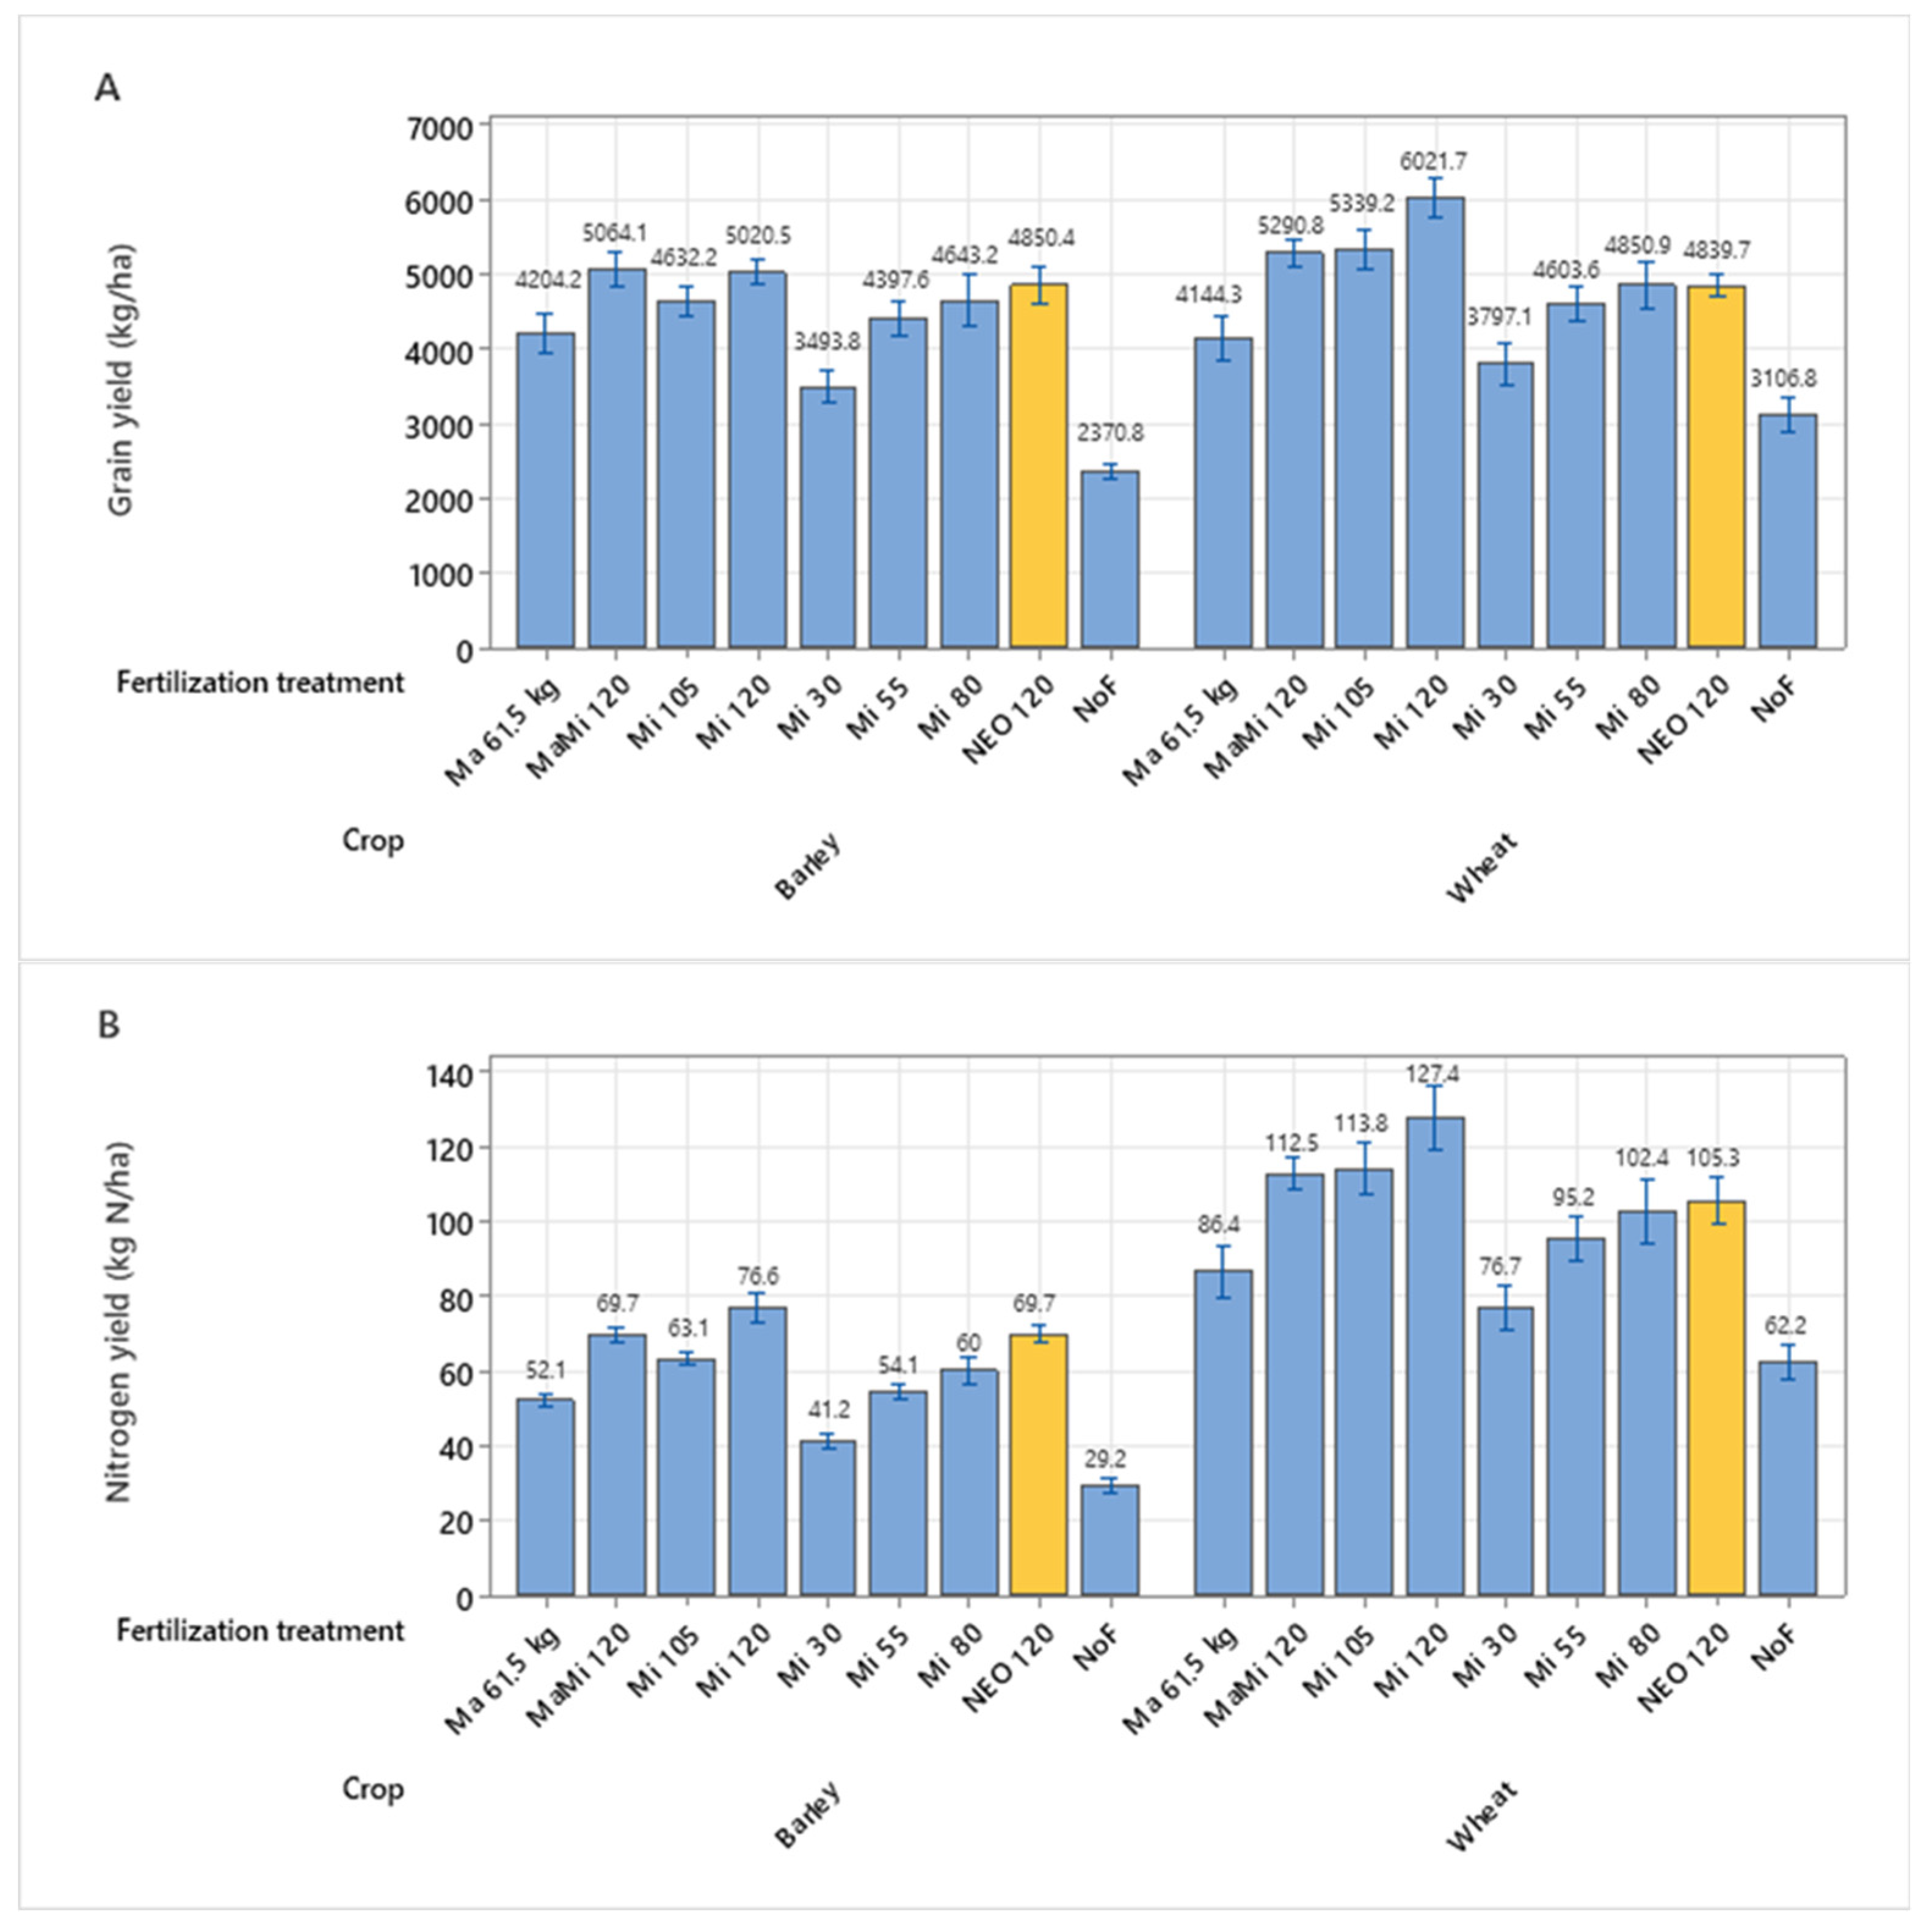
In series two of the experiments conducted in 2021 and 2022, the barley grain yield (Figure 4A) of MaMi120 was 5064 kg ha−1, which was similar to the yield of Mi120. However, Mi120 yielded only 170 kg ha−1 higher than NEO120, and the difference was not statistically significant. On the other hand, NEO120 produced a grain yield that fell between the yields of Mi105 and Mi120, with a significantly higher yield of 646 kg ha−1 compared to Ma65.
Regarding wheat grain yield (Figure 4A), MaMi120 yielded significantly higher (451 kg ha−1) than NEO120. On the other hand, NEO120 yielded similar to Mi80 but significantly higher (695 kg ha−1) than ma65.
A similar trend in barley and wheat grain yield was observed for nitrogen yield (Figure 4B). However, the differences between treatments were more pronounced, indicating increased variation in nitrogen yield.
3.4. Nitrogen Effects: Results from All 10 Trials in Series One and Two in 2021 and 2022
The Y axis in Figure 5 represents the nitrogen effect obtained from the range of mineral fertilizers. NEO120 exhibited an equivalent effect on grain yield as 95 kg N ha−1 in mineral fertilizer and the same effect on nitrogen yield as 100 kg N ha−1 in mineral fertilizer. In simpler terms, 95 kg N ha−1 in mineral fertilizer can be substituted with 120 kg N ha−1 in NEO when considering wheat and barley grain yield. Similarly, when assessing nitrogen yield, 100 kg N ha−1 in mineral fertilizer can be replaced by 120 kg N ha−1 in NEO.
Ma65 demonstrated a grain yield effect comparable to 50 kg N ha−1 in mineral fertilizer, but the nitrogen yield from Ma65 was slightly lower. MaMi120 also exhibited the same grain yield nitrogen effect as 95 kg N ha−1 in mineral fertilizer. However, the nitrogen yield from MaMi120 was slightly lower in comparison.
3.5. Sum up All Average Yields
The following table, Table 5, presents the average barley and wheat grain yields from the most noteworthy treatments in both series one and two in 2021 and 2022 (columns two and three) and series one only (columns four and five).
When considering the combined results from all trials in barley and wheat (columns two and three), MaMi120 yielded 5083 kg ha−1 barley grain and 5290 kg ha−1 wheat grain. These results were equivalent to the barley yield obtained from NEO120, while in wheat, MaMi120 outperformed NEO120 by 135 kg ha−1. MaMi120 and NEO120 yielded more than 1000 kg ha−1 compared to Ma65, with the largest increase observed in wheat. Mi120 yielded 425 kg ha−1 higher barley grain and 968 kg ha−1 higher wheat grain than NEO120.
Focusing on Series 1 alone (columns three and four), similar yield differences were observed as in the combined results. Additionally, we included the MiNEO120 treatment in this analysis. Regarding barley, MiNEO120 yielded similar to NEO120, while in wheat, it outperformed NEO120 by 743 kg ha−1 and MaMi120 by 935 kg ha−1. Remarkably, MiNEO120 even surpassed the wheat grain yield of Mi120.
4. Discussion
4.1. Nitrogen Fertilization Effect of NEO
The present studies aimed to determine the comparative variances in yield and fertilizer efficacy among NEO, mineral fertilizers, cattle slurry, and other farmers’ alternatives. The experiments were located in representative parts of Norway’s most crucial grain production areas. The intended nitrogen (N) application level for the study was set at 120 kg N ha−1, which aligns with the average N level commonly used for barley and is slightly lower (around 1–2 kg) than the average N level employed for wheat in practical farming within the region. The yields obtained from applying 120 kg N ha−1 using mineral fertilizer fell within the same range as those observed in the official Norwegian variety trials. [24].
During the initial two trials conducted in 2020, we observed a substantial increase in wheat yield when utilizing filtered slurry compared to the untreated slurry, with a difference of 756 kg ha−1. Similarly, in the case of barley, the filtered slurry resulted in a yield increase of 447 kg ha−1 compared to the untreated slurry. These findings indicate that by simply filtering the slurry, the fertilizer effect was enhanced by approximately 10–14 percent in barley and wheat, respectively. It is worth noting that despite the reduced volume and applied nitrogen amount due to filtration, the positive impact on yield was still significant. This phenomenon can be attributed to the reduced carbon-to-nitrogen (C/N) ratio observed in the filtered slurry, resulting in an enhanced nitrogen mineralization process [25,26]. This can elucidate a portion of the positive yield effect achieved by implementing the N2 Applied technology.
Our study focused on assessing the potential of NEO as a substitute for nitrogen (N) from mineral fertilizers. The results revealed that applying 120 kg N ha−1 in NEO resulted in a similar grain yield as using 95 kg N ha−1 in mineral fertilizer, which is a 20% reduction in yield compared to the 120 kg N ha−1 in mineral fertilizer. However, NEO exhibited slightly better performance when considering nitrogen yield, with 120 kg N-min ha−1 in NEO yielding comparable results to 100 kg N ha−1 in mineral fertilizer (a 16.7% reduction) [27,28,29].
We also examined the impact of combining untreated manure with mineral fertilizers on grain yield. Notably, applying 65 kg N ha−1 in untreated manure supplemented with 55 kg N ha−1 in mineral fertilizer yielded the same as using 95 kg N ha−1 in mineral fertilizer and 120 kg N ha−1 in NEO for both barley and wheat grain yield. Interestingly, within 120 kg N ha−1 in NEO, 60 kg N is added to the manure through plasma treatment. These findings indicate that NEO may suitably replace the combination of untreated manure with mineral fertilizers, which can be an effective strategy to reduce reliance on mineral fertilizers while maintaining comparable yields.
To further analyze the results, we examined the average wheat and barley yields, as presented in Figure 2, Figure 3 and Figure 4 and Table 5. Our grain trials set the targeted nitrogen value at 120 kg N ha−1. To achieve this level using NEO, we applied 37.5 tons ha−1 and 34 tons ha−1 in 2021 and 2022, respectively, considering the varying nitrogen content in NEO. Correspondingly, the amounts of untreated slurry applied were 41 tons ha−1 and 37 tons ha−1, resulting in an average of 39 tons ha−1 of untreated slurry. Using this information, we calculated the yields obtained from different combinations of 39 tons ha−1 of cattle slurry and mineral fertilizer:
When applying 39 tons ha−1 of untreated cattle slurry (Ma65), we harvested a barley yield of 4068 kg ha−1 and a wheat yield of 4013 kg ha−1. By combining 39 tons ha−1 of untreated slurry with mineral fertilizers (Opti-NS) up to 120 kg N ha−1 (MaMi120), we observed improved yields, with barley reaching 5083 kg ha−1 and wheat reaching 5290 kg ha−1.
To explore the potential of alternative fertilization techniques, we filtered 39 tons of untreated slurry. Then, we processed it through the N2 Applied unit, resulting in 35 tons of NEO with a nitrogen content of 120 kg N. Applying 35 tons ha−1 of NEO (NEO120) yielded a barley yield of 5068 kg ha−1 and a wheat yield of 5155 kg ha−1, the same level as the combination of cattle slurry and mineral fertilizer up to 120 kg N ha−1.
Furthermore, we examined the effects of solely using mineral fertilizers with a nitrogen content of 120 kg N ha−1, specifically Yara 18-3-15 (Mi120). This approach resulted in even higher yields, with barley reaching 5443 kg ha−1 and wheat reaching 6123 kg ha−1.
4.2. NEO at Three Leaf Stage
Interestingly, throughout our trials, we consistently observed no evidence of damage to barley and wheat plants when NEO was applied during the three-leaf stage. This finding indicates that applying NEO at this particular growth stage does not result in any discernible harm to the crops.
The treatment known as MiNEO120 involved the application of NEO (108 kg N ha−1) at the three-leaf stage, while a small quantity (12 kg N ha−1) of mineral fertilizer was applied on the sowing day. This approach yielded a crop production increase of 743 kg ha−1 compared to the sole application of NEO (NEO120) at sowing, based on six trials conducted in 2021 and 2022. Additionally, the MiNEO120 treatment demonstrated slightly higher wheat yields than the application of 120 kg N ha−1 as mineral fertilizer on the sowing day (Mi120). However, when it came to barley, no significant yield improvement was observed with the MiNEO120 treatment compared to the NEO120 treatment. In fact, the MiNEO120 treatment decreased yield by 586 kg ha−1 when compared to the Mi120 treatment.
In contrast, our trials conducted in 2020 using the MiNEO treatment with an N application rate of 104 kg N ha−1 resulted in significantly lower yields. Specifically, there was a decrease of 469 kg ha−1 compared to using the NEO102 treatment in wheat. However, in the case of barley, both treatments yielded approximately the same results in 2020. These findings highlight the diverse effects that different nitrogen application methods and rates can have on wheat and barley yields.
However, the high yield observed in the MiNEO120 treatment can be partially attributed to trial number three out of the six trials conducted in series one during 2021 and 2022. MiNEO120 yielded a notably higher yield in this particular trial than MiNEO120 in the remaining five trials. We have thoroughly analyzed the weather conditions in the weeks following sowing and the application of NEO in the MiNEO treatment. However, our investigation did not yield any definitive explanations for this discrepancy.
On the other hand, it is widely acknowledged that wheat has a later nitrogen uptake during the growing season compared to barley [30]. This difference in nitrogen absorption timing may help explain why MiNEO120 consistently resulted in higher wheat yields than barley in most of our trials. Another contributing factor could be the high nitrification potential of NEO, which leads to greater availability of plant-accessible nitrate over a concentrated period of 3–4 days following application [18]. This rapid release of nitrate may particularly benefit wheat [31,32].
It is important to note that all other fertilizer treatments, apart from MiNEO120, were applied solely on the sowing day. Therefore, our experiments do not provide insights into how these alternative treatments would have performed if they had been applied partially on the sowing day and partially at the three-leaf stage, similar to the MiNEO120 treatment. Consequently, the only valid comparison is between MiNEO120 and NEO120.
4.3. Limitations and Further Research
The ammonia and nitrate levels in NEO and the mineral fertilizer used in our experiments are similar. However, despite this similarity, it is astonishing that the crop yield obtained from 120 kg N ha−1 in NEO is equivalent to the yield achieved from just 95 kg N ha−1 in the mineral fertilizer. Furthermore, the yield obtained from 120 kg N ha−1 in NEO is the same as that obtained from the combination of untreated slurry and mineral fertilizer Opti-NS at the same nitrogen application rate. However, The nitrogen yields obtained from NEO were slightly superior, delivering an equivalent nitrogen effect as that of 100 kg N ha−1 in mineral fertilizer. This suggests that approximately 20 kg ha−1, corresponding to 17% of the plant-available nitrogen in NEO, is lost through other means.
Regrettably, we cannot provide a conclusive explanation for these unexpected outcomes. Notably, the low pH in NEO should typically mitigate the majority of ammonia leakage [33]. Nevertheless, one possibility to consider is that the high soil nitrification potential in the initial days following the application of NEO could lead to nitrate losses without adequate plant absorption. Additionally, there is a risk that nitrogen could be lost as nitrous oxide through denitrification, further exacerbating the situation. Therefore, additional research investigating the emissions or leaching potential of NEO is necessary to gain a clearer understanding of this phenomenon.
5. Conclusions
The current study aimed to investigate and compare the effects of Nitrogen Enriched Organic fertilizer (NEO) made from cattle slurry on barley and wheat grain yields to other conventional fertilizers used in agriculture. The results indicated that 120 kg N ha−1 in NEO yielded in the same range of cereal grains as 95 kg N ha−1 in mineral fertilizer. Moreover, the combination of untreated slurry and 55 kg N ha−1 in mineral fertilizer Opti-NS yielded the same as 120 kg N ha−1 in NEO. Surprisingly, the combination of 12 kg N ha−1 in mineral fertilizer applied at sowing, alongside 108 kg N ha−1 in NEO administered at the three-leaf stage, resulted in higher wheat yields compared to the application of 120 kg N ha−1 of NEO solely spread at sowing in two out of three experimental years. Additionally, the direct application of NEO onto the plants exhibited no observable signs of harm. Lastly, it is worth noting that filtering the slurry yielded higher cereal grain yields compared to using the untreated slurry. Thus, while NEO and mineral fertilizers have similar N content, utilizing NEO resulted in a cereal grain yield 15–20% lower than that achieved with mineral fertilizer. However, it still yielded 20–30% higher than the native amount of cattle slurry it originated. Nevertheless, it is worth noting that approximately 17% of the nitrogen in NEO appears to be lost through unidentified means without contributing to grain or nitrogen yields.
Author Contributions
Conceptualization, T.C. and S.Ø.S.; methodology, T.C. and S.Ø.S.; validation, T.C. and S.Ø.S.; formal analysis, H.M.; investigation, T.C.; data curation, S.Ø.S. and H.M.; writing—original draft preparation, T.C., S.Ø.S. and H.M.; writing—review and editing, T.C., S.Ø.S. and H.M.; visualization, T.C., S.Ø.S. and H.M.; supervision, S.Ø.S.; project administration, T.C.; funding acquisition, T.C. and S.Ø.S. All authors have read and agreed to the published version of the manuscript.
Funding
This research was funded by the Research Council of Norway (grant number 309640 Plasmabehandlet husdyrgjødsel—gjødselvirkning, miljøpåvirkning og klimagassutslipp) and the Company N2 Applied.
Data Availability Statement
The data is available upon request.
Acknowledgments
The authors would like to thank the staff at NLR Trøndelag, NLR Innlandet, NLR Østafjells, and NLR Viken for their help in conducting the field trials. We also thank Morten Tofastrud and Elisabeth Røe at Inland Norway University of Applied Sciences for their support in project administration. In addition, we would like to acknowledge the project’s funders.
Conflicts of Interest
The authors declare no conflict of interest.
References
- FAO. The Future of Food and Agriculture, Trends and Challenges; Food and Agriculture Organization of the United Nations: Rome, Italy, 2017; ISBN 978-92-5-109551-5. [Google Scholar]
- Intergovernmental Panel on Climate Change. Climate Change and Land: IPCC Special Report on Climate Change, Desertification, Land Degradation, Sustainable Land Management, Food Security, and Greenhouse Gas Fluxes in Terrestrial Ecosystems; Cambridge University Press: Cambridge, UK, 2022.
- Vermeir, I.; Verbeke, W. Sustainable Food Consumption: Exploring the Consumer “Attitude–Behavioral Intention” Gap. J. Agric. Environ. Ethics 2006, 19, 169–194. [Google Scholar] [CrossRef]
- Augustin, M.A.; Riley, M.; Stockmann, R.; Bennett, L.; Kahl, A.; Lockett, T.; Osmond, M.; Sanguansri, P.; Stonehouse, W.; Zajac, I.; et al. Role of food processing in food and nutrition security. Trends Food Sci. Technol. 2016, 56, 115–125. [Google Scholar] [CrossRef]
- Janker, J.; Mann, S.; Rist, S. Social sustainability in agriculture—A system-based framework. J. Rural Stud. 2019, 65, 32–42. [Google Scholar] [CrossRef]
- Rajic, S.; Đorđević, V.; Tomasevic, I.; Djekic, I. The role of food systems in achieving the sustainable development goals: Environmental perspective. Bus. Strategy Environ. 2022, 31, 988–1001. [Google Scholar] [CrossRef]
- Dong, N.-Q.; Lin, H.-X. Higher yield with less nitrogen fertilizer. Nat. Plants 2020, 6, 1078–1079. [Google Scholar] [CrossRef] [PubMed]
- Houlton, B.Z.; Almaraz, M.; Aneja, V.; Austin, A.T.; Bai, E.; Cassman, K.G.; Compton, J.E.; Davidson, E.A.; Erisman, J.W.; Galloway, J.N.; et al. A World of Cobenefits: Solving the Global Nitrogen Challenge. Earth’s Future 2019, 7, 865–872. [Google Scholar] [CrossRef] [PubMed] [Green Version]
- Bondada, B.R.; Oosterhuis, D.M. Canopy photosynthesis, specific leaf weight, and yield components of cotton under varying nitrogen supply. J. Plant Nutr. 2001, 24, 469–477. [Google Scholar] [CrossRef]
- Rütting, T.; Aronsson, H.; Delin, S. Efficient use of nitrogen in agriculture. Nutr. Cycl. Agroecosyst. 2018, 110, 1–5. [Google Scholar] [CrossRef] [Green Version]
- FAO. World Fertilizer Trends and Outlook to 2022; FAO: Rome, Italy, 2019. [Google Scholar]
- Upendra, M.S.; Rajan, G.; Gautam, P.P. Nitrogen Fertilization I: Impact on Crop, Soil, and Environment. In Nitrogen Fixation; Everlon Cid, R., Ademar Pereira, S., Eds.; IntechOpen: Rijeka, Croatia, 2019; Chapter 5. [Google Scholar]
- European Commission. Sustainable Use of Nutrients: The Common Agricultural Policy Supports Farmers in the Safe and Efficient Use of Nutrients. Available online: https://ec.europa.eu/info/food-farming-fisheries/sustainability/environmental-sustainability/low-input-farming/nutrients_en (accessed on 18 July 2022).
- Graves, D.B.; Bakken, L.B.; Jensen, M.B.; Ingels, R. Plasma Activated Organic Fertilizer. Plasma Chem. Plasma Process. 2019, 39, 1–19. [Google Scholar] [CrossRef]
- Ingels, R.; Graves, D.B. Improving the Efficiency of Organic Fertilizer and Nitrogen Use via Air Plasma and Distributed Renewable Energy. Plasma Med. 2015, 5, 257–270. [Google Scholar] [CrossRef] [Green Version]
- N2 Applied. Nitrogen Enriched Organic Fertiliser. Available online: https://n2applied.com/ (accessed on 19 July 2022).
- Mousavi, H.; Cottis, T.; Pommeresche, R.; Dörsch, P.; Solberg, S.Ø. Plasma-Treated Nitrogen-Enriched Manure Does Not Impose Adverse Effects on Soil Fauna Feeding Activity or Springtails and Earthworms Abundance. Agronomy 2022, 12, 2314. [Google Scholar] [CrossRef]
- Mousavi, H.; Solberg, S.Ø.; Cottis, T.; Dörsch, P. Nitrogen-Enriched Organic Fertilizer (NEO) Elevates Nitrification Rates Shortly after Application But Has No Lasting Effect on Nitrification in Agricultural Soils. Preprint. 2023. Available online: https://doi.org/10.21203/rs.3.rs-2565156/v1 (accessed on 10 March 2023).
- Mousavi, H.; Cottis, T.; Hoff, G.; Solberg, S.Ø. Nitrogen Enriched Organic Fertilizer (NEO) and Its Effect on Ryegrass Yield and Soil Fauna Feeding Activity under Controlled Conditions. Sustainability 2022, 14, 2005. [Google Scholar] [CrossRef]
- Yara. YaraMila™. Available online: https://www.yara.com/crop-nutrition/products-and-solutions/global-fertilizer-brands/yaramila/ (accessed on 20 July 2022).
- Yara International. Yara Opti NS. Available online: https://www.yara.no/gjoedsel/produkter/yarabela/yarabela-opti-ns-27-0-0-4s/ (accessed on 3 May 2023).
- Zadoks, J.C.; Chang, T.T.; Konzak, C.F. A decimal code for the growth stages of cereals. Weed Res. 1974, 14, 415–421. [Google Scholar] [CrossRef]
- yr.no. Norwegian Meteorological Institute and the Norwegian Broadcasting Corporation; Weather Data History. 2023. Available online: www.yr.no (accessed on 11 March 2023).
- Strand, E. Jord-Og Plantekultur 2021 Forsøk i Korn, Olje-Og Belgvekster, Engfrøavl Og Potet 2020; NIBIO: Amsterdam, The Netherlands, 2021; Available online: https://nibio.brage.unit.no/nibio-xmlui/handle/11250/2740694 (accessed on 11 March 2023).
- Watson, C.A.; Atkinson, D.; Gosling, P.; Jackson, L.R.; Rayns, F.W. Managing soil fertility in organic farming systems. Soil Use Manag. 2002, 18, 239–247. [Google Scholar] [CrossRef] [Green Version]
- Biswas, D.; Micallef, S.A. Safety and Practice for Organic Food; Academic Press: Cambridge, MA, USA, 2019. [Google Scholar]
- Sutton, M.; Howard, C.; Mason, K.; Brownlie, W.; Cordovil, C. Nitrogen Opportunities for Agriculture, Food & Environment. UNECE Guidance Document on Integrated Sustainable Nitrogen Management. 2022. Available online: https://nora.nerc.ac.uk/id/eprint/534033/ (accessed on 10 March 2023).
- Jackson, D.R.; Smith, K.A. Animal manure slurries as a source of nitrogen for cereals; effect of application time on efficiency. Soil Use Manag. 1997, 13, 75–81. [Google Scholar] [CrossRef]
- Ladha, J.K.; Pathak, H.J.; Krupnik, T.; Six, J.; van Kessel, C. Efficiency of Fertilizer Nitrogen in Cereal Production: Retrospects and Prospects. In Advances in Agronomy; Academic Press: Cambridge, MA, USA, 2005; Volume 87, pp. 85–156. [Google Scholar]
- Bosshard, C.; Sørensen, P.; Frossard, E.; Dubois, D.; Mäder, P.; Nanzer, S.; Oberson, A. Nitrogen use efficiency of 15N-labelled sheep manure and mineral fertiliser applied to microplots in long-term organic and conventional cropping systems. Nutr. Cycl. Agroecosyst. 2009, 83, 271–287. [Google Scholar] [CrossRef] [Green Version]
- Alcoz, M.M.; Hons, F.M.; Haby, V.A. Nitrogen Fertilization Timing Effect on Wheat Production, Nitrogen Uptake Efficiency, and Residual Soil Nitrogen. Agron. J. 1993, 85, 1198–1203. [Google Scholar] [CrossRef]
- Cox, W.J.; Reisenauer, H.M. Growth and ion uptake by wheat supplied nitrogen as nitrate, or ammonium, or both. Plant Soil 1973, 38, 363–380. [Google Scholar] [CrossRef]
- Fangueiro, D.; Hjorth, M.; Gioelli, F. Acidification of animal slurry—A review. J. Environ. Manag. 2015, 149, 46–56. [Google Scholar] [CrossRef] [PubMed]
Figure 1.
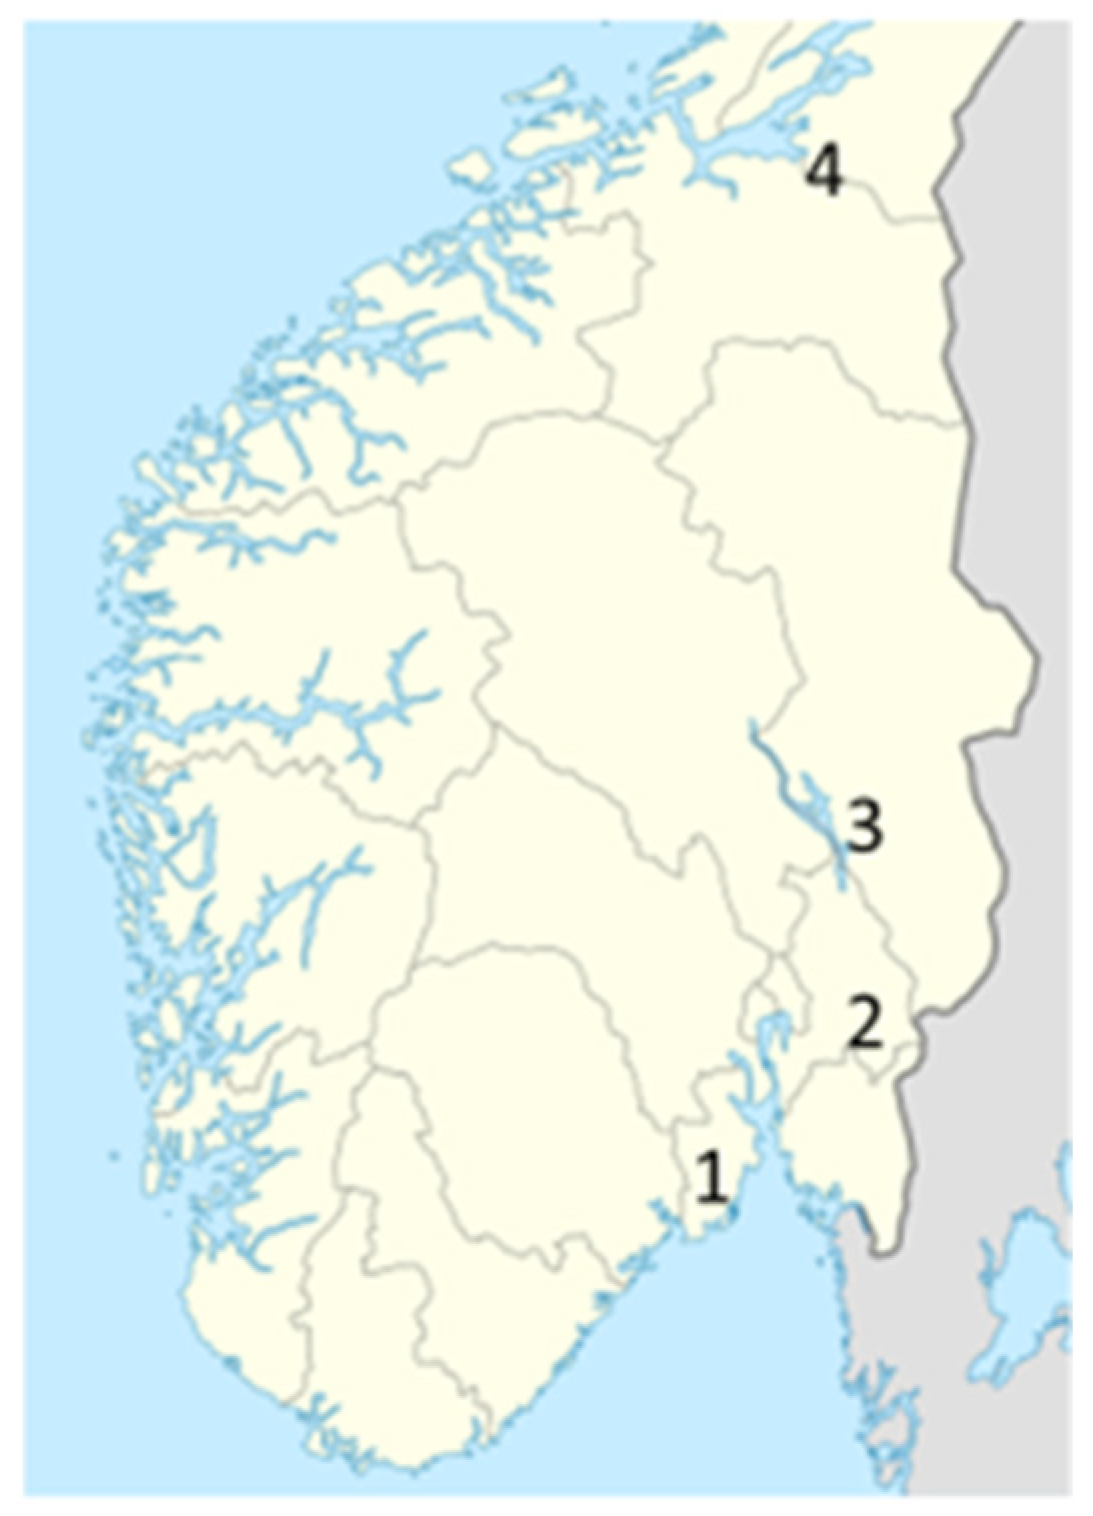
The map showing the locations in the southern part of Norway, where the field trials were conducted in 2020, 2021, and 2022: Tønsberg 1, Årnes 2, Hamar 3, and Stjørdal 4.
Figure 1.
The map showing the locations in the southern part of Norway, where the field trials were conducted in 2020, 2021, and 2022: Tønsberg 1, Årnes 2, Hamar 3, and Stjørdal 4.

Figure 2.
(A) Grain yield (15% water content) in kg ha−1 and (B) nitrogen yield in kg N ha−1 ± standard error of the means. Results from the initial trials in 2020 with one trial in barley (left) and one in spring wheat (right). The NEO102 kg N ha−1 treatment stands out from other treatments with its distinct yellow coloration.

Figure 3.
(A): Grain yield (15% water content), and (B) nitrogen yield, in kg N ha−1 ± standard error of the means. Results from Series 1 in 2021 and 2022, with three trials in barley (left) and three trials in spring wheat (right). The NEO 120 kg N ha−1 treatment stands out from other treatments with its distinct yellow coloration.

Figure 4.
(A): Grain yield (15% water content), and (B) nitrogen yield, in kg N ha−1 ± standard error of the means. Results from Series 2 in 2021 and 2022, with two trials in barley (left) and three trials in spring wheat (right). The NEO 120 kg N ha−1 treatment stands out from other treatments with its distinct yellow coloration.

Figure 5.
Nitrogen effect of 120 kg N ha−1 in NEO (NEO120) compared to the nitrogen effect of 65 kg N ha−1 in manure (Ma65) and 120 kg N ha−1 in manure with mineral fertilizer (MaMi120). Results are based on data from ten trials in Series 1 and 2 combined. Results are provided for grain yield data and N yield (bars with light pattern).


Table 1.
The trial numbers, location coordinates, and soil quality information at the trial sites. The barley and wheat were all spring-sown types.
Table 1.
The trial numbers, location coordinates, and soil quality information at the trial sites. The barley and wheat were all spring-sown types.
| Series | Trial | Location | Crops, Varieties, and Years | Detailed Location and Coordinates | Soil Type and Key Soil Parameters |
|---|---|---|---|---|---|
| 1 | 1 | 3 | Barley’ Salome’ 2020, Wheat ‘Betong’ 2021, Barley’ Bente’ 2022 | 3 km east of Hamar (60.81830° N. 011.17968° E) | Loam. 4.5% organic. pH 7.4 |
| 1 | 2 | 3 | Wheat ‘Mirakel’ 2020, Barley’ Anita’ 2021, Wheat ‘Betong’ 2022 | 3 km east of Hamar (60.81830° N. 011.17968° E) | Loam. 4.5% organic. pH 7.4 |
| 1 | 3 | 2 | Wheat ‘Helmi’ 2021 | 3 km west of Årnes (60.12604° N. 11.39471° E) | Silt loam. 4.0% organic. pH 6.0 |
| 1 | 4 | 2 | Barley ‘Brage’ 2021 | 3 km west of Årnes (60.12604° N. 11.39471° E) | Silt loam. 4.0% organic. pH 6.0 |
| 2 | 5 | 1 | Wheat ‘Betong’ 2021 | 5 km west of Tønsberg (59.294937° N. 10.318813° E) | Silt loam. 6.5% organic. pH 6.2 |
| 2 | 5 | 1 | Wheat ‘Betong’ 2022 | 15 km north of Tønsberg (59.384537° N. 10.232651° E) | Silt loam. 4.8% organic. pH 6.9 |
| 2 | 6 | 4 | Barley ‘Thermus’ 2021 | 4 km north of Stjørdal (70.41109° N. 59.3647° E) | Loam. 2.7% organic. pH 6.1 |
| 2 | 6 | 4 | Barley ‘Thermus’ 2022 | 4 km north of Stjørdal (70.37496° N. 59.7733° E) | Loam. 2.7% organic. pH 6.1 |
Table 2.
Amounts of mineral N, ammonia N, nitrate N, nitrite N, total N (kg N ton−1), and pH in the NEO and untreated cattle slurry used over the three years (average over several analyses per year).
Table 2.
Amounts of mineral N, ammonia N, nitrate N, nitrite N, total N (kg N ton−1), and pH in the NEO and untreated cattle slurry used over the three years (average over several analyses per year).
| Fertilizer and Year | N-Min (kg ton−1) | NH4+ (kg ton−1) | NO3− (kg ton−1) | NO2− (kg ton−1) | Total N (kg ton−1) | pH |
|---|---|---|---|---|---|---|
| NEO 2020 | 3.4 | 1.68 | 1.24 | 0.52 | 4.7 | 5.3 |
| Untreated 2020 | 1.7 | 1.7 | 0 | 0 | 2.8 | 7.1 |
| NEO 2021 | 3.2 | 1.5 | 0.92 | 0.8 | 4.38 | 5.59 |
| Untreated 2021 | 1.5 | 1.5 | 0 | 0 | 2.68 | 7.17 |
| NEO 2022 | 3.55 | 1.66 | 1.19 | 0.69 | Not analyzed | 5.15 |
| Untreated 2022 | 1.75 | 1.7 | 0 | 0 | Not analyzed | 7.35 |
Table 3.
The treatments and their labels (bold text) used in our trials.
| Treatments in Series 1 in 2020: | Treatments in Series 1 in 2021 and 2022: | Treatments in Series 2 in 2021 and 2022: |
|---|---|---|
| MaF51: 51 kg N ha−1 in Filtered untreated slurry. | NoF: No fertilizer | NoF: No fertilizer |
| Ma56: 56 kg N ha−1 in untreated slurry | Ma65: 65 kg N ha−1 in untreated slurry (manure). | NEO120: 120 kg N ha−1 in NEO |
| NEO102: 102 kg N ha−1 in NEO | NEO120: 120 kg N ha−1 in NEO | Ma65: 65 kg N ha−1 in untreated slurry. |
| MiNEO 104: 12 kg N ha−1 in mineral fertilizer 18-3-15 applied to the trial plots before sowing and 92 kg N/ha−1 in NEO at Zadoks GS13 three leaves stage. | MiNEO 120: 12 kg N ha−1 in mineral fertilizer 18-3-15 applied to the trial plots before sowing and 108 kg N/ha−1 in NEO at Zadoks GS13 three leaves stage. | MaMi120: 65 kg N ha−1 in untreated slurry and 55 kg N ha−1 in mineral fertilizer Opti-NS. |
| Mi51: 51 kg N ha−1 in mineral fertilizer 18-3-15 | Mi65: 65 kg N ha−1 in mineral fertilizer 18-3-15 | Mi30: 30 kg N ha−1 in mineral fertilizer 18-3-15 |
| Mi91: 91 kg N ha−1 in mineral fertilizer 18-3-15 | Mi91: 91 kg N ha−1 in mineral fertilizer 18-3-15 | Mi55: 55 kg N ha−1 in mineral fertilizer 18-3-15 |
| Mi123: 123 kg N ha−1 in mineral fertilizer 18-3-15 | Mi120: 120 kg N ha−1 in mineral fertilizer 18-3-15 | Mi80: 80 kg N ha−1 in mineral fertilizer 18-3-15 |
| MaMi123: 56 kg N ha−1 in untreated slurry combined with 6.7 kg N ha−1 in mineral fertilizer Opti-NS | MaMi120: 65 kg N ha−1 in untreated slurry combined with 55 kg N ha−1 in mineral fertilizer Opti-NS | Mi105: 105 kg N ha−1 in mineral fertilizer 18-3-15 |
| Mi120: 120 kg N ha−1 in mineral fertilizer 18-3-15 |
Table 4.
Average temperatures, normal temperatures, precipitation, and normal precipitation for the grain trial locations over the years 2020–2022.
Table 4.
Average temperatures, normal temperatures, precipitation, and normal precipitation for the grain trial locations over the years 2020–2022.
| Year | Location | Average Temperature (°C) | Normal Temperature (°C) | Average Precipitation (mm) | Normal Precipitation (mm) |
|---|---|---|---|---|---|
| 2020 | Hamar | 8.5 | 9.9 | 23 | 55 |
| 2021 | Tønsberg | 9.9 | 10.8 | 95.1 | 71 |
| 2021 | Årnes | 9.3 | 10.2 | 88.4 | 59 |
| 2021 | Hamar | 9.5 | 9.9 | 77.9 | 55 |
| 2021 | Stjørdal | 9.6 | 9.0 | 33.1 | 63 |
| 2022 | Tønsberg | 11.4 | 10.8 | 36.5 | 71 |
| 2022 | Hamar | 9.8 | 9.9 | 31.8 | 55 |
| 2022 | Stjørdal | 9.6 | 9.0 | 72.6 | 63 |
Table 5.
The average yields per ha of the Ma65, MaMi120, NEO120, and Mi120 treatments in all 5 trials in barley and 5 trials in wheat in 2021 and 2022 (Series 1 and 2 combined). Columns four and five give the same only from the trials in Series 1 from the same years, also containing the average yield effects from the MiNEO120 treatment.
| Fertilization Treatment | Average Yield (kg ha−1) All Trials 2021 and 2022 Barley (5 Trials) | Average Yield (kg ha−1) All Trials 2021 and 2022 Wheat (5 Trials) | Average Yield (kg ha−1) Series 1 2021 and 2022 Barley (3 Trials) | Average Yield (kg ha−1) Series 1 2021 and 2022 Wheat (3 Trials) |
|---|---|---|---|---|
| Ma65 | 4068 | 4013 | 3931 | 3882 |
| MaMi120 | 5083 | 5290 | 5102 | 5289 |
| NEO120 | 5068 | 5155 | 5285 | 5481 |
| MiNEO120 | - | - | 5309 | 6224 |
| Mi120 | 5443 | 6123 | 5895 | 6047 |
Disclaimer/Publisher’s Note: The statements, opinions and data contained in all publications are solely those of the individual author(s) and contributor(s) and not of MDPI and/or the editor(s). MDPI and/or the editor(s) disclaim responsibility for any injury to people or property resulting from any ideas, methods, instructions or products referred to in the content. |
© 2023 by the authors. Licensee MDPI, Basel, Switzerland. This article is an open access article distributed under the terms and conditions of the Creative Commons Attribution (CC BY) license (https://creativecommons.org/licenses/by/4.0/).
Share and Cite
MDPI and ACS Style
Cottis, T.; Mousavi, H.; Solberg, S.Ø. Plasma Treated Cattle Slurry Moderately Increases Cereal Yields. Agronomy 2023, 13, 1549. https://doi.org/10.3390/agronomy13061549
AMA Style
Cottis T, Mousavi H, Solberg SØ. Plasma Treated Cattle Slurry Moderately Increases Cereal Yields. Agronomy. 2023; 13(6):1549. https://doi.org/10.3390/agronomy13061549
Chicago/Turabian StyleCottis, Thomas, Hesam Mousavi, and Svein Øivind Solberg. 2023. "Plasma Treated Cattle Slurry Moderately Increases Cereal Yields" Agronomy 13, no. 6: 1549. https://doi.org/10.3390/agronomy13061549
Note that from the first issue of 2016, this journal uses article numbers instead of page numbers. See further details here.