
Transpiration Efficiency of Some Potato Genotypes under Drought


1
Department of Crop Sciences, University of Natural Resources and Life Sciences, Konrad Lorenz Str. 24, 3430 Vienna, Austria
2
Department of Agriculture Extension, Khamarbari, Farmgate, Dhaka 1215, Bangladesh
*
Author to whom correspondence should be addressed.
†
These authors contributed equally to this work.
Agronomy 2023, 13(4), 996; https://doi.org/10.3390/agronomy13040996
Submission received: 23 February 2023
/
Revised: 16 March 2023
/
Accepted: 23 March 2023
/
Published: 28 March 2023
(This article belongs to the Special Issue Cultivation Physiology, Molecular Biology and Molecular Breeding of Solanaceae)
Abstract
:Potato (Solanum tuberosum L.) is the third most consumed food crop after rice and wheat in the world. It is a short-duration crop, suitable for growing in a wide range of environments, but abiotic factors can limit potato production, and drought is the main one. Therefore, managing drought stress is of utmost importance under climate change conditions. Potato as a drought-sensitive crop needs choice of suitable genotypes for dry environments. In this study, transpiration efficiency (TE), soil water conservation and drought tolerance were analysed for potato genotypes from different origins. Three glasshouse experiments under different Vapor Pressure Deficit (VPD) conditions with water-stressed (WS) and well-watered (WW) plants resulted in significantly different total amounts of transpiration among the genotypes and water supply levels. Transpiration in WS plants was the same as with WW plants up to a specific threshold “Fraction of Transpirable Soil Water” (FTSW) and then sharply decreased in response to soil drying. Genotypes showed a substantial variation in FTSW thresholds (0.19 to 0.36 FTSW) under low VPD condition, which narrowed down (0.19 to 0.29) when air humidity was lower. Furthermore, we observed hardly any relationships between TE and FTSW threshold (r = 0.125) or TE and water saving (r = 0.031). Our results provide insights into genotypic interactions with VPD on FTSW threshold and TE under dry-down conditions in potato.
1. Introduction
Potato (Solanum tuberosum L.) is one of the most important crops worldwide due to its versatile use. The edible share of the biomass of a potato plant (~85%) is much higher than with cereals (~50%) [1]. As a short-duration and popular crop, potato has strong environmental adaptability [2,3,4]. Potato can be grown in different soils ranging in pH from 5–7.5 and can attain yields of 40–70 t ha−1 depending on environmental conditions and the variety [3,4,5] Nevertheless, several biotic and abiotic factors may limit potato productivity, including temperature, solar radiation, daylength, and drought [3,6,7,8]. Prolonged drought periods are among the most threatening natural conditions for potato production impairing economy and food supply [3,9].
Drought stress affects crop phenology, morphology, physiology, and yield formation [3,10,11,12]. Most potato cultivars have a shallow root system [3,13,14], which impairs water uptake from deeper soil layers. Root length of potato cultivars may however be different, and it shows a positive correlation with yield under drought [3,15,16,17]. Besides vegetative growth, drought may affect the tuber formation by shortening the growth period [3,18], resulting in reduced size [3,19] and number of tubers [3,20]. In several studies, reduction in net photosynthesis under drought stress has been identified as the main reason for reduction in tuber yield [3,21,22,23] which can be modified by the severity of stress and by cultivars.
Crop yield (Y) can be defined as a function of crop harvest index (HI, i.e., the ratio of harvestable dry mass to total plant dry mass), the amount of water transpired (T) and crop transpiration efficiency (TE; i.e., the plant mass produced per amount of water transpired) [24].
Y = HI × T × TE.
Under water-deficit conditions, genotypes with increased transpiration efficiency are likely to produce more biomass and yield. Transpiration efficiency (TE), however, depends on both physiological traits, such as leaf photosynthetic capacity, biochemical composition of plant biomass, stomatal conductance, and environmental conditions, particularly atmospheric vapour pressure deficit (VPD), which is the additional moisture that air can hold until it is saturated, expressed as a pressure [25]. Therefore, while TE itself is not a simple candidate trait for breeding drought-tolerant varieties, traits that contribute to conserving soil water as the crop enters a drought period are likely to also increase the TE. This was shown by the authors of [26], who reported that the marginal water-use efficiency of extra soil water that becomes available late in the season is nearly three times higher than that calculated over the whole growing season.
There are two water-conserving traits for increasing TE, the restricted maximum transpiration trait and the sensitiveness to soil drying [25]. The restricted maximum transpiration trait reduces transpiration under high VPD conditions, which can develop around noon, by decreasing stomatal conductance [27,28]. Plants generally initiate limitation on transpiration rate when the fraction of transpirable soil water (FTSW) decreases to roughly 30% [29]. Genotypic variability for this trait has been detected for soybean, sorghum, pearl millet, maize, and peanut ranging from 0.22 to 0.71 [25,28,30]. Genotypes with a high FTSW threshold exhibit early stomatal closure with soil drying resulting in conserving soil water and, hence, delayed wilting under drought conditions [30,31,32]. A recent study supports the suitability of FTSW threshold for the comparison of genotypes, although the measurement of soil water potential seems to be the best parameter to characterize the plant water status [33]. It must also be mentioned that FTSW threshold is not independent from environmental conditions, especially soil texture [34].
Atmospheric vapour pressure deficit (VPD) is another factor which affects transpiration rate depending on climate, photosynthesis system and plant type [35]. VPD has been identified as a major contributor to drought-induced plant mortality, independent of other drivers related to climate change [36]. However, previous studies focused mainly on soil water deficits or high VPD or physiological and growth reactions to soil drying [32], while the interaction between soil drying and high VPD was neglected. Therefore, the present study aimed to explore the genotypic responses of potato plants to soil drying and different VPD conditions. Since biomass production is closely related to transpiration, breeding for maximized soil water uptake under drought is the most important target for yield improvement [3]. Genotypes with better performance under water deficit conditions will likely achieve high transpiration efficiency (TE), as reported in studies on peanut [30,37]. In this study, we focused on genotypic variations in potato transpiration under different VPD conditions and progressive soil drying. The present paper is based on the PhD thesis by one of the first authors [38].
2. Materials and Methods
2.1. Glasshouse Experiments, Climatic Conditions, and Genotypes
The glasshouse experiments were conducted at the BOKU University and Research Centre Tulln (UFT) in Lower Austria at 48°18′ N and 16°4′ E. The temperature and humidity were controlled automatically and recorded in 12 min intervals. With 11 potato genotypes from different sources, three experiments were performed in three different seasons and similar environmental conditions were set in the glasshouse during the experiments (Table 1). Plastic pots of 7 l size were filled with field soil, sand, and compost at a ratio of 1.0:1.0:0.8 by volume. The soil for the mixture was obtained from an adjacent arable field, dried, ground and passed through a 2 mm sieve. Washed sand (0.6–0.9 mm size), compost (for garden use without turf grass material), and a 15-6-12% (N-P2O5-K2O) commercial fertilizer were bought from a garden shop. Fertilizer dressing required for adequate nutrient supply was added equivalent to 130 kg ha−1 N, 45 kg ha−1 P2O5 and 105 kg ha−1 K2O. Well-watered plants (WW) received enough water and soil moisture level was always kept about 4% below field capacity. Water deficit in water stress plants (WS) was imposed after a defined period by ending water supply; thus, afterwards, plants relied on available soil moisture in the pots. The experiments were set up in randomized complete blocks (RCBD) with 5 replications considering water supply and genotype as fixed factors (Table 1).
2.2. Initial Biomass Harvest and Preparation for Dry-Down Treatment
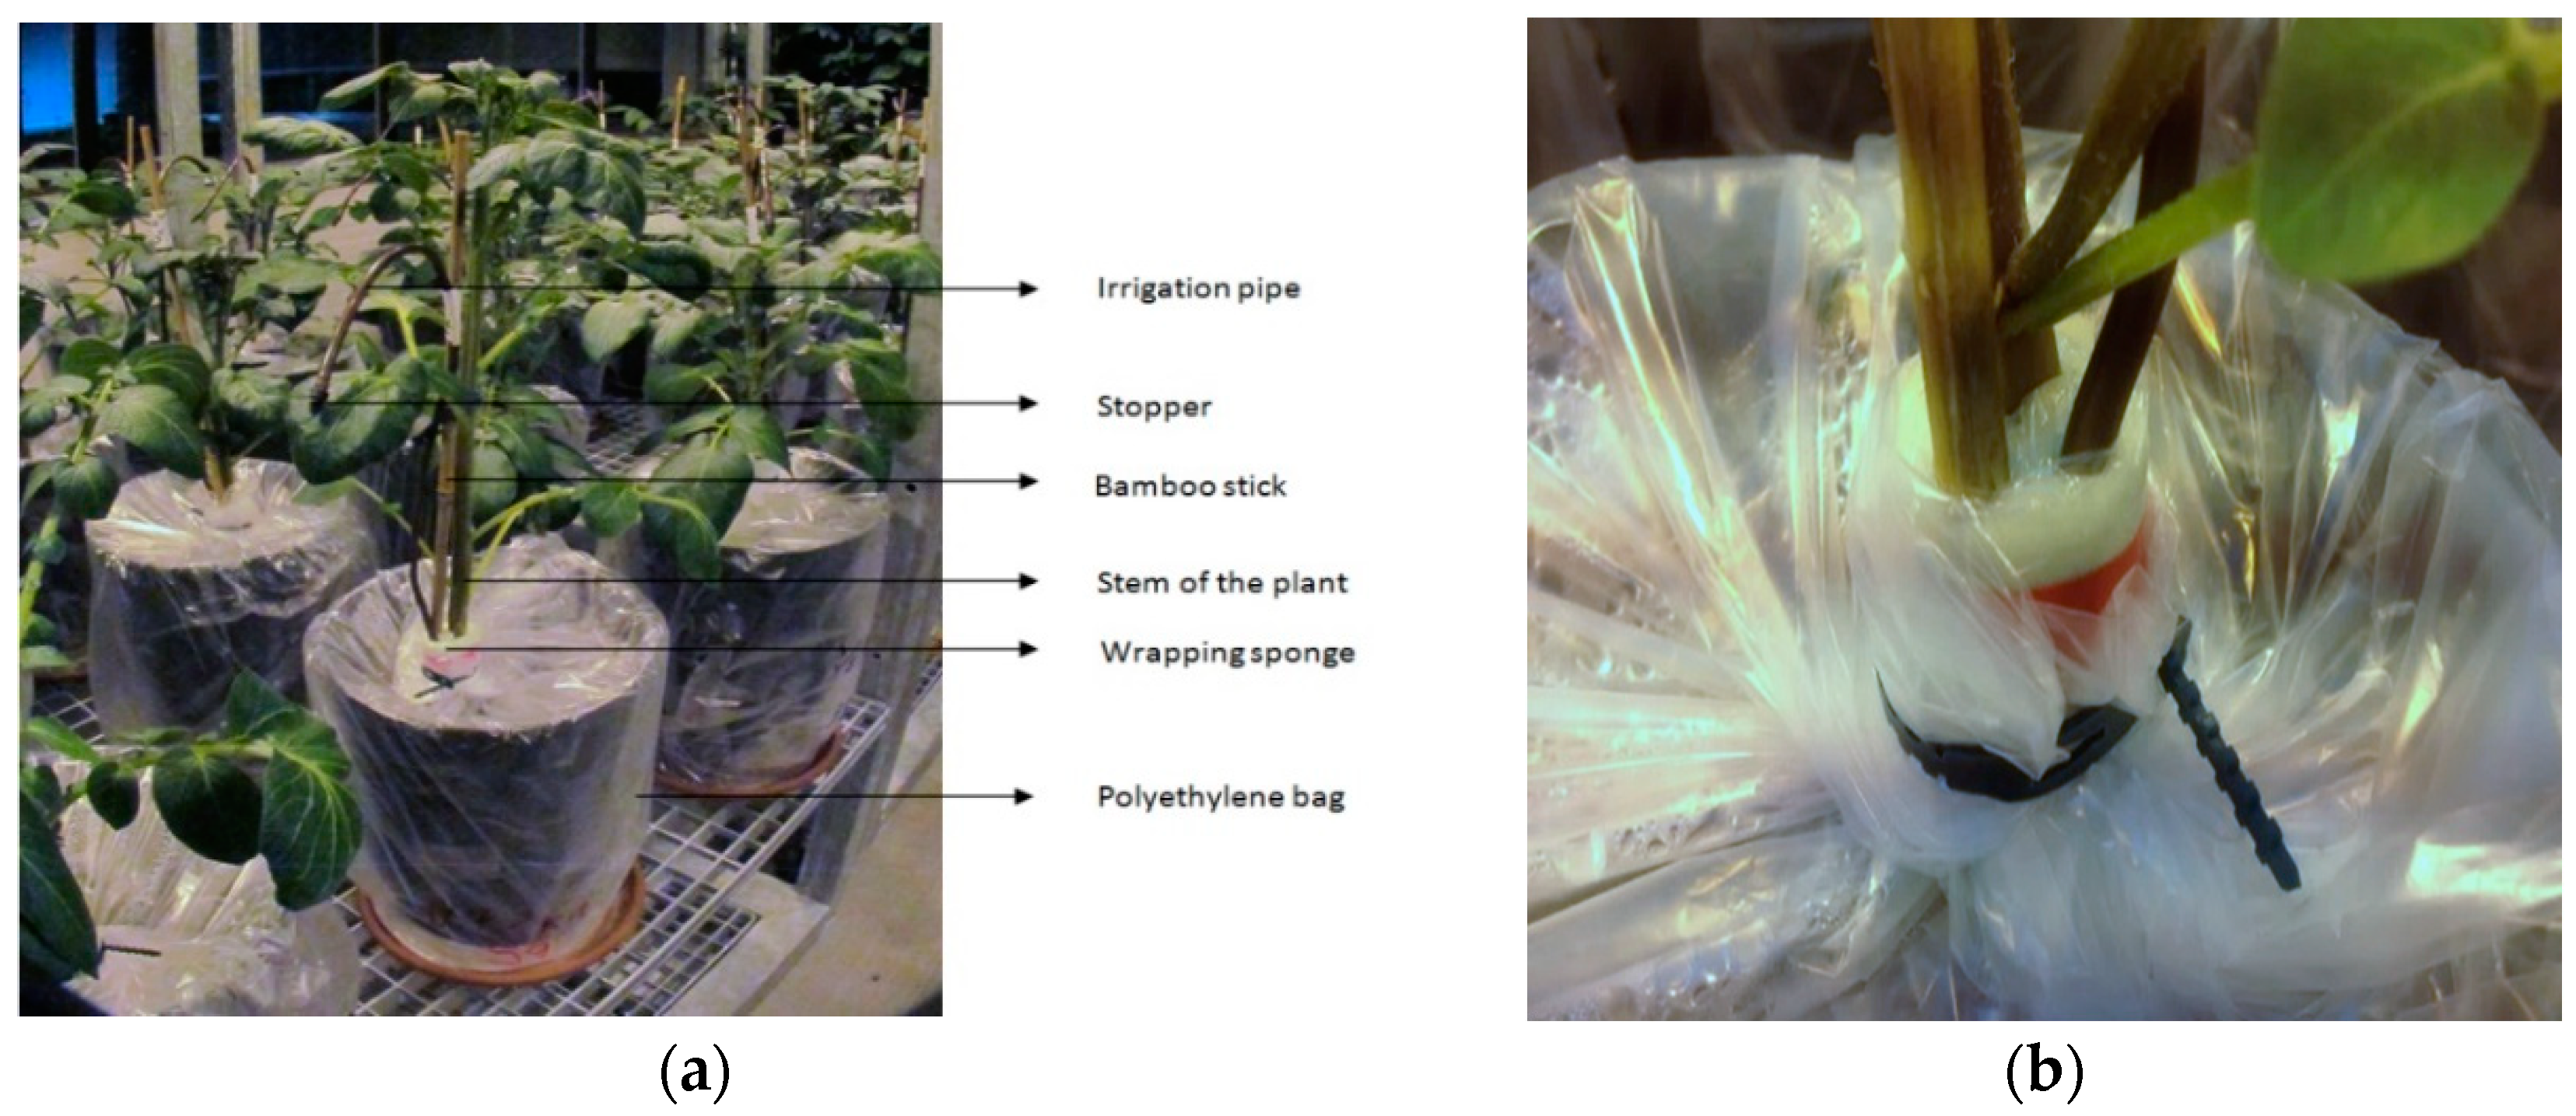
Before starting the dry-down cycle, 23–33 days after planting, all pots were in a well-watered condition for normal crop growth [30,39,40,41]. Similar plants with 9–12 leaves were selected [41], watered to saturation, attaining field capacity after one day. Then, all stems were cut off except one healthy and vigorous in each pot. The selected homogenous single-stem plants from each genotype were randomly divided into three groups: WW treatment, WS treatment, and initial biomass group. For the initial biomass, five plants of each genotype were harvested. Plants were cut at the base and put in a paper bag for drying at 65 °C (Memmert Universalschrank UFE 600, Linder Labortechnik, Overath, Germany) for 48 h (Table 1). All other pots were covered with 2 layers of polyethylene bag (60 cm × 40 cm) just above the base of the stem. Sealing of the bags was accomplished using a piece of soft sponge to not impair stem growth but avoid gas flow at the closure (Figure 1).
2.3. Transpiration Measurement and Plant Watering
Gravimetric daily transpiration (T) measurement started the day after pot sealing [42] by weighing pots every day with a laboratory platform balance (Sartorius CPA 16001S, Sartorius AG, Germany) at a precision of 0.1 g. For WW pots, potential growth was assured by adding measured water loss daily. In [43], peanut plants were watered at 80% of field capacity (which corresponded to 5% of the total pot weight). As we used 6 kg of substrate instead of 2 kg for peanuts by [30], we applied a threshold of 240 g (about 4% w/w) water less than the field capacity at pot sealing to avoid anaerobic soil condition. Water loss above 240 g from the first day was added to all WW pots daily. For WS pots, in principle, no water was supplied after the sealing, unless the daily transpiration exceeded one third (80 g) of our threshold. The excess amount of >80 g was replenished to avoid rapid wilting (Table 2).
2.4. Normalizing Transpiration
The observed daily transpiration rate of the drought-stressed plants was normalized on two levels to account for variations (i) in environmental conditions [44] as well as (ii) among plants [39]. In the first normalization step, the ratio of daily transpiration from the WS plants to that of the WW plants was calculated. This is called daily transpiration ratio (TR) as shown in Table 2. Therefore, the individual transpiration (T) value in a WS pot was divided by the average transpiration of the WW pots of the same genotype [30,41]. For the second step of normalization (NTR), the transpiration rate was recalculated from the second until the fifth day (4 days) for better consistency as suggested by [39]. The reasons for omitting the initial day up to threshold transpiration were to avoid pot saturation effects of the first day [45] and treatment differences in time for individual pots during setup of the experiment.
2.5. Transpiration Efficiency
According to [40], response of the plants to soil drying occurs at three stages. In stage I, TR remains constant and transpiration of WS plants does not differ from that of WW plants (TR ≈ 1.0). Stage II begins when the rate of soil water consumption by the plant becomes lower than potential transpiration and stomata close for keeping plant water balance (0.1 ≤ TR < 1.0). Stage III starts at very low TR (TR < 0.1), when stomata have a minimum conductance. We conducted our experiment until the WS plants reached a NTR < 0.1, i.e., 10% of the reference transpiration [40,41,45]. The biomass accumulated during this dry down period can be considered as a function of water transpired [24]. The amount of water transpired was measured daily while the final biomass was obtained at harvest and transpiration efficiency (TE) was calculated as shown in Table 2.
2.6. VPD, FTSW and FTSW Threshold
In our experiments, VPD appeared as a combined effect of temperature and humidity in the glasshouse cabin (Table 2). We recorded daily averages of the environmental data to calculate VPD [46]. FTSW was subsequently calculated as it shown in Table 2. Refs. [39,47] observed that transpiration began to decline at FTSW = 0.31 in maize and soybean, which is regarded as the FTSW threshold. In our experiments, we used a two-segment linear regression function and determined FTSW threshold with the help of software Sigmaplot 12.5 (Systat Software GmbH, Germany) as shown in Table 2.
2.7. Dry Biomass Recording
Our experiments continued until the water-stressed plants reached the minimum of transpirable water (FTSW = 0). At this stage, plants were no more able to transpire, NTR value was <0.1, and we regarded plants at this stage as physiologically dead. Then, we removed all the pots from the polyethylene bags and recorded fresh weight and then dry matter of leaves, stems, stolons, and tubers (roots and mother tubers were excluded).
3. Results
3.1. Transpiration under Different VPD Condition
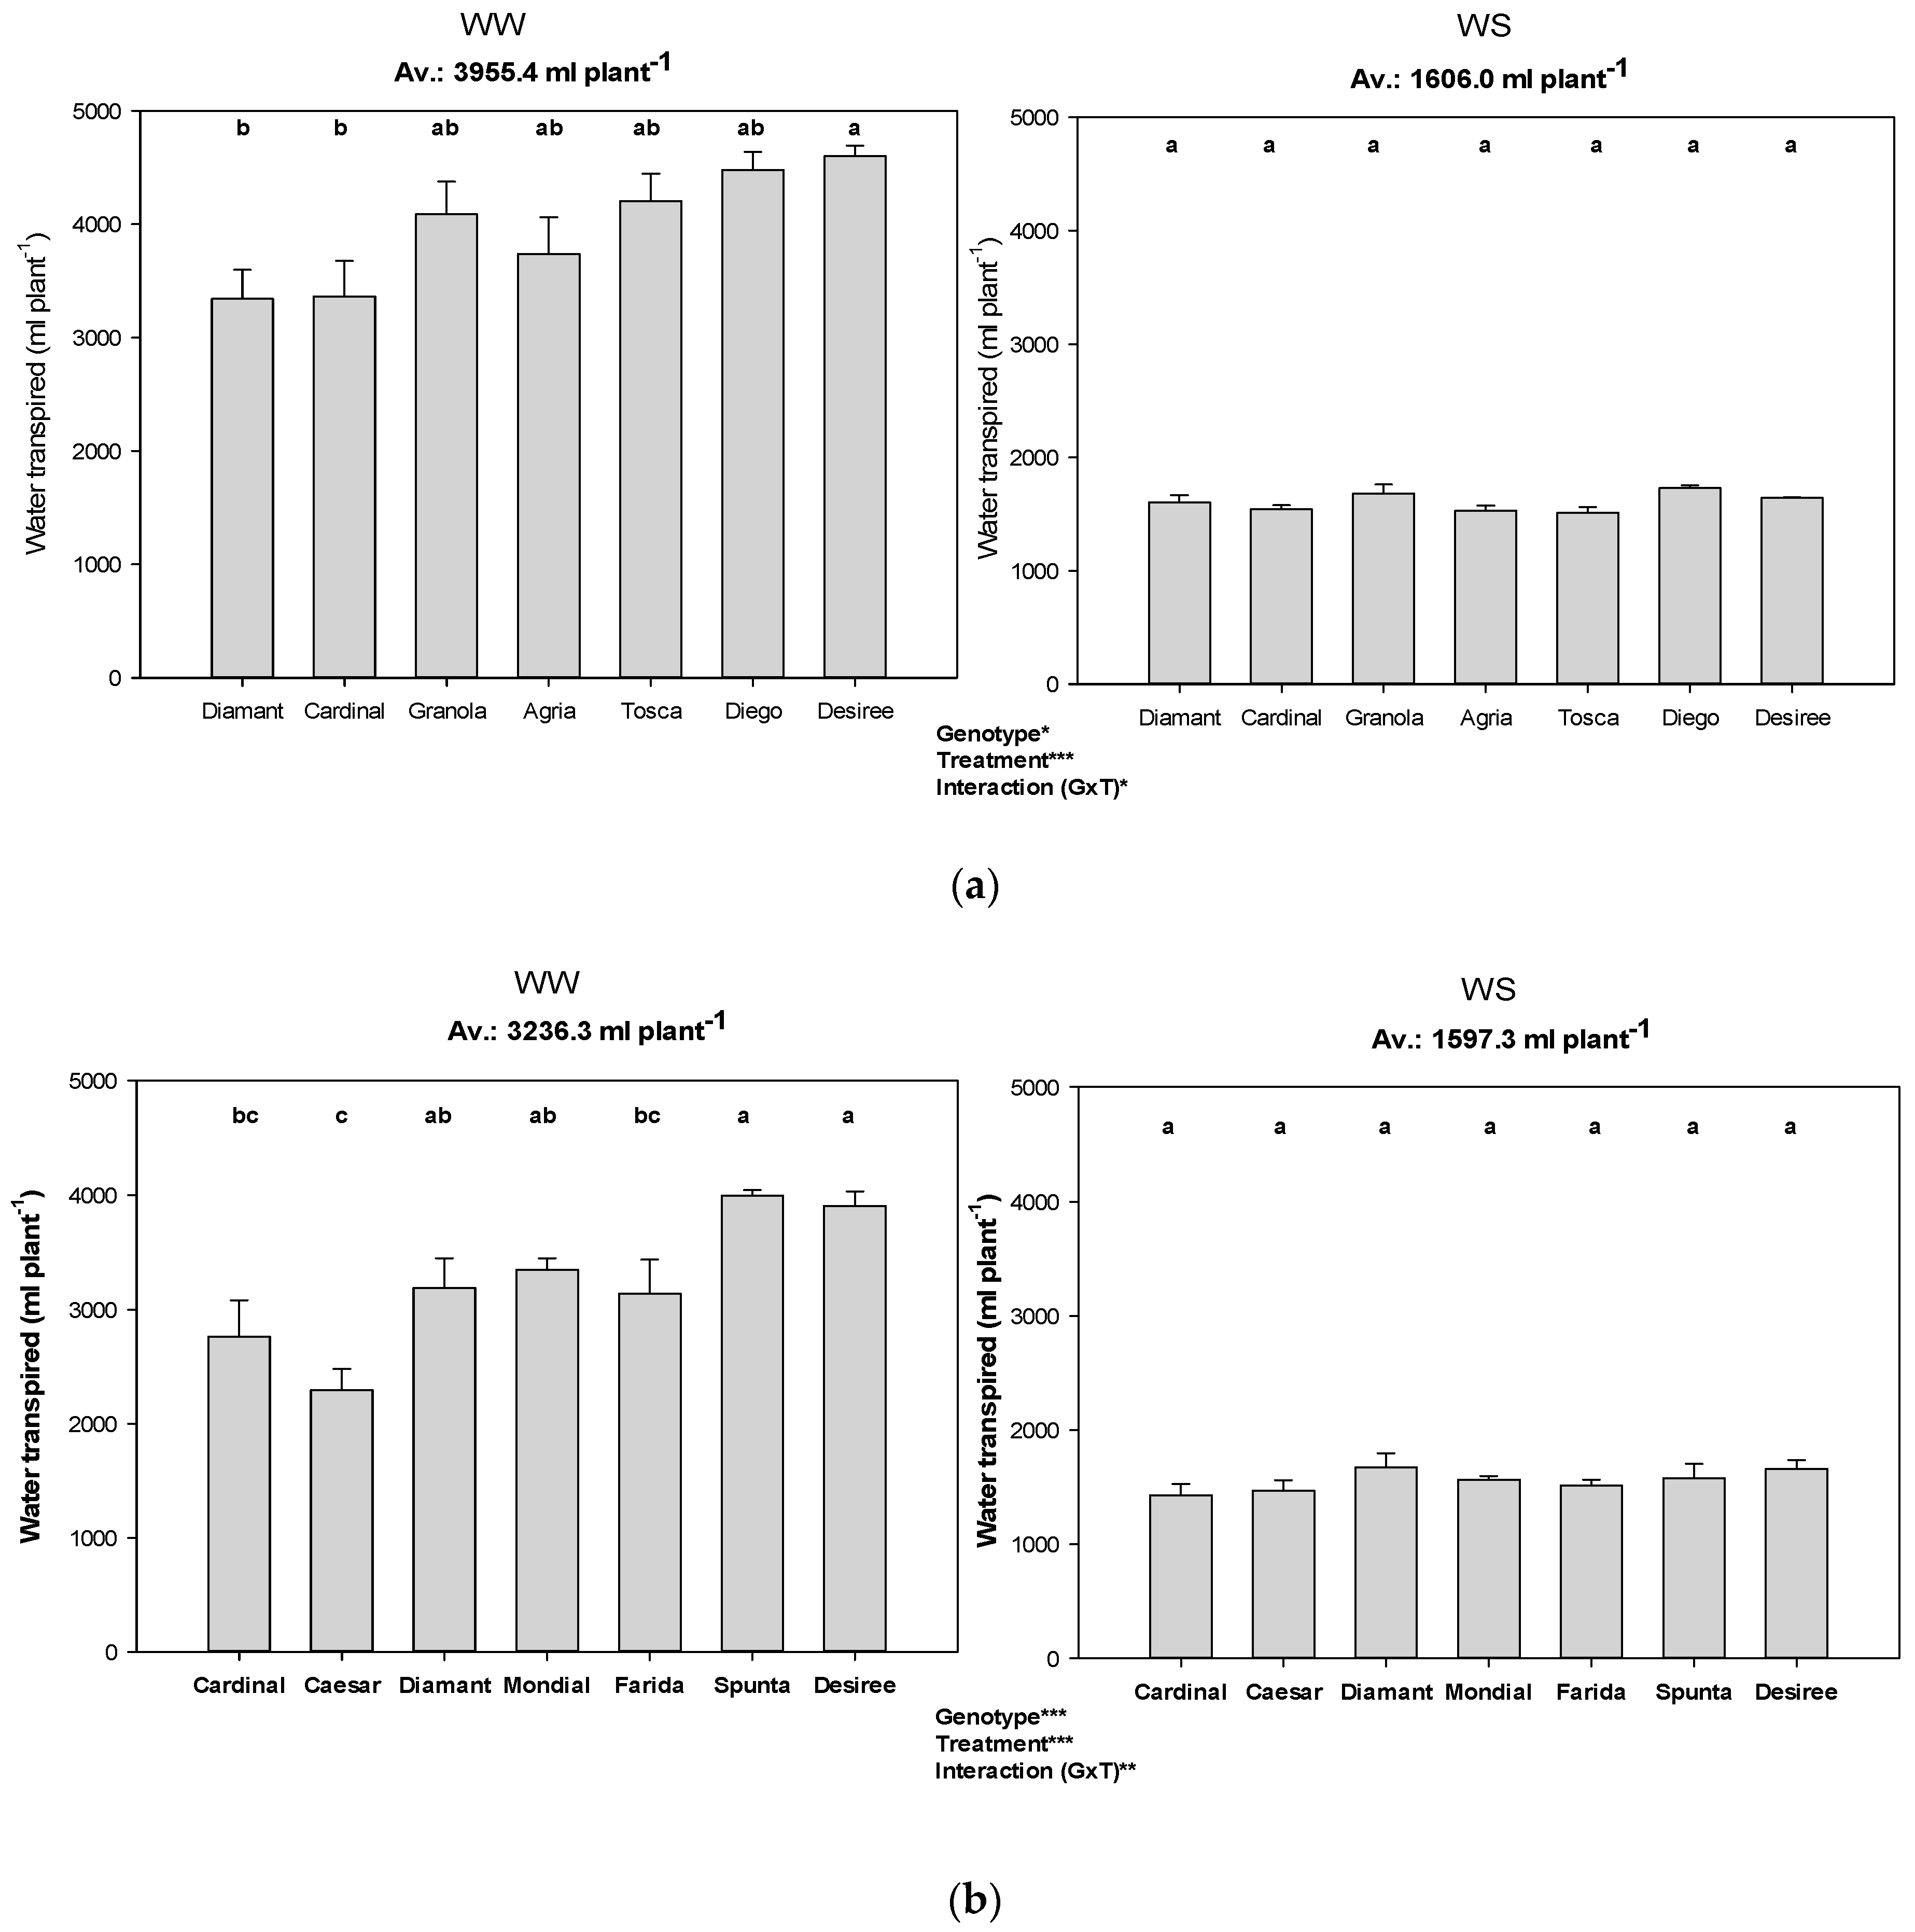
The total transpiration in the WS treatment showed no significant variation among genotypes in all experiments, but a significant interaction between water treatment and genotype was detected (Figure 2). Under WW conditions, Diamant, Cardinal, and Ceasar showed low transpiration figures, while Desiree was always among the genotypes with high transpiration.
3.2. Transpiration during Soil Drying Cycles
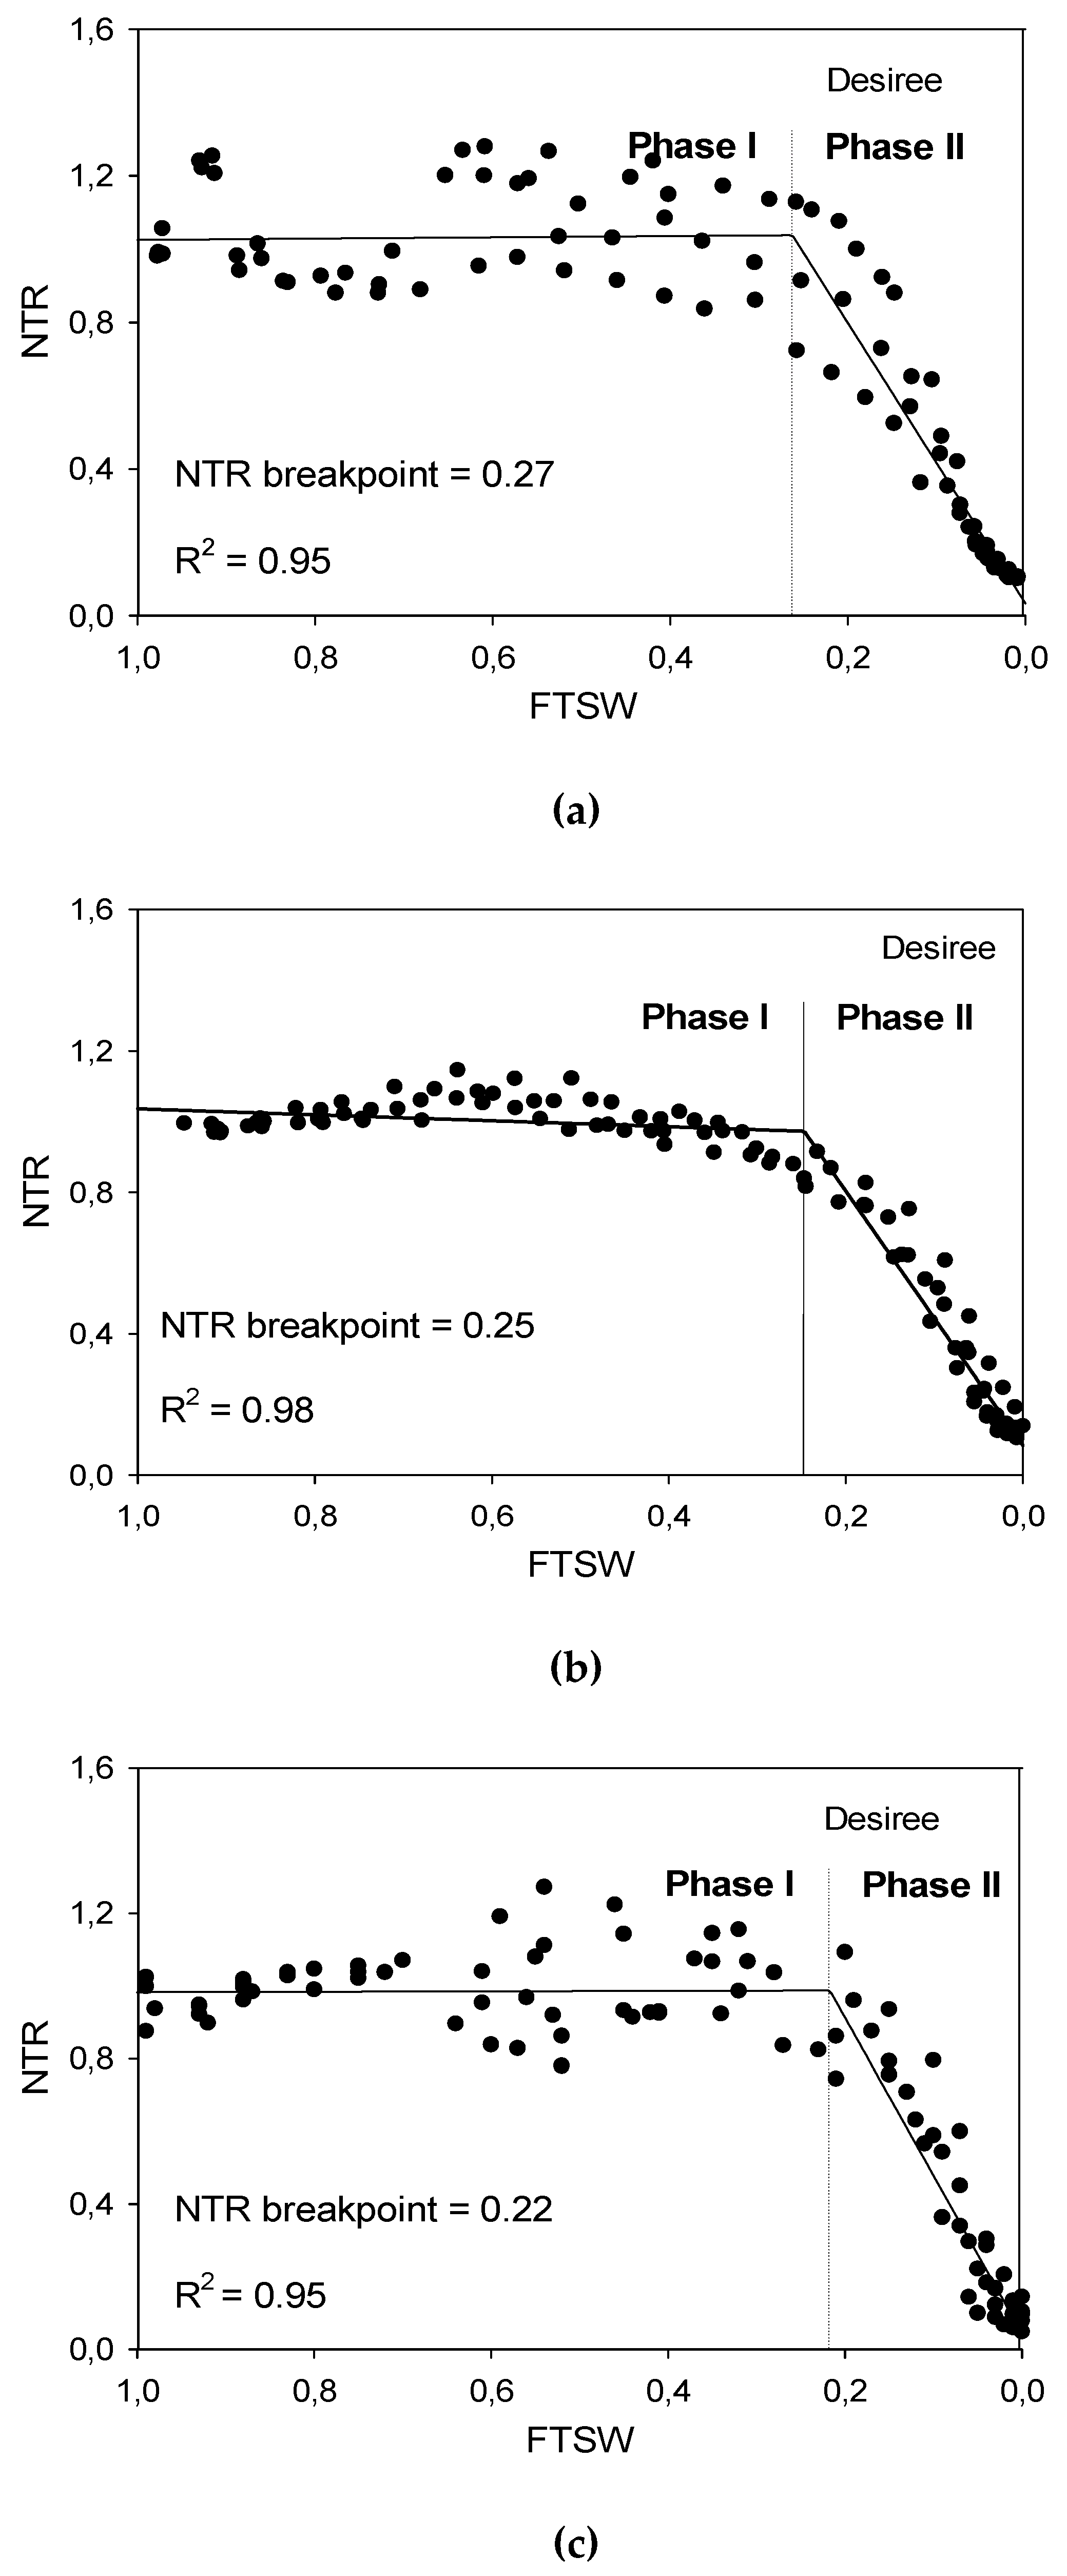
To delineate genotypic responses in transpiration with proceeding soil drying, two segment linear regression lines were used to specify the FTSW threshold at which the transpiration rate started to decline. Figure 3 shows the results of that analysis as an example for the cv. Desiree, which was included in all experiments. Early during soil drying, plants had sufficient soil moisture and transpired almost constantly until the FTSW threshold was reached. Afterwards, transpiration declined sharply, and available soil moisture reached 0% on the death day. The FTSW thresholds for all genotypes are presented in Table 3. In Exp 1, FTSW threshold ranged from 0.19 (cv. Granola) to 0.36 (cvs. Tosca and Diego). In this experiment with low VPD condition, Tosca and Diego had a significantly higher threshold than others. In Exp 2, the range of FTSW threshold among genotypes was comparatively small. In Exp 3, Farida had a significantly higher threshold (0.29) than Caesar (0.21) and Desiree (0.19), respectively. In general, high VPD conditions in Exp 3 significantly reduced the FTSW threshold level compared to lower VPD conditions in Exp 1 and 2, as demonstrated, e.g., by cv. Desiree (Figure 2). It is obvious that genotypes with a higher FTSW threshold saved more water in the soil compared to the genotypes with more water consumption due to a lower threshold (cf. Table 3).
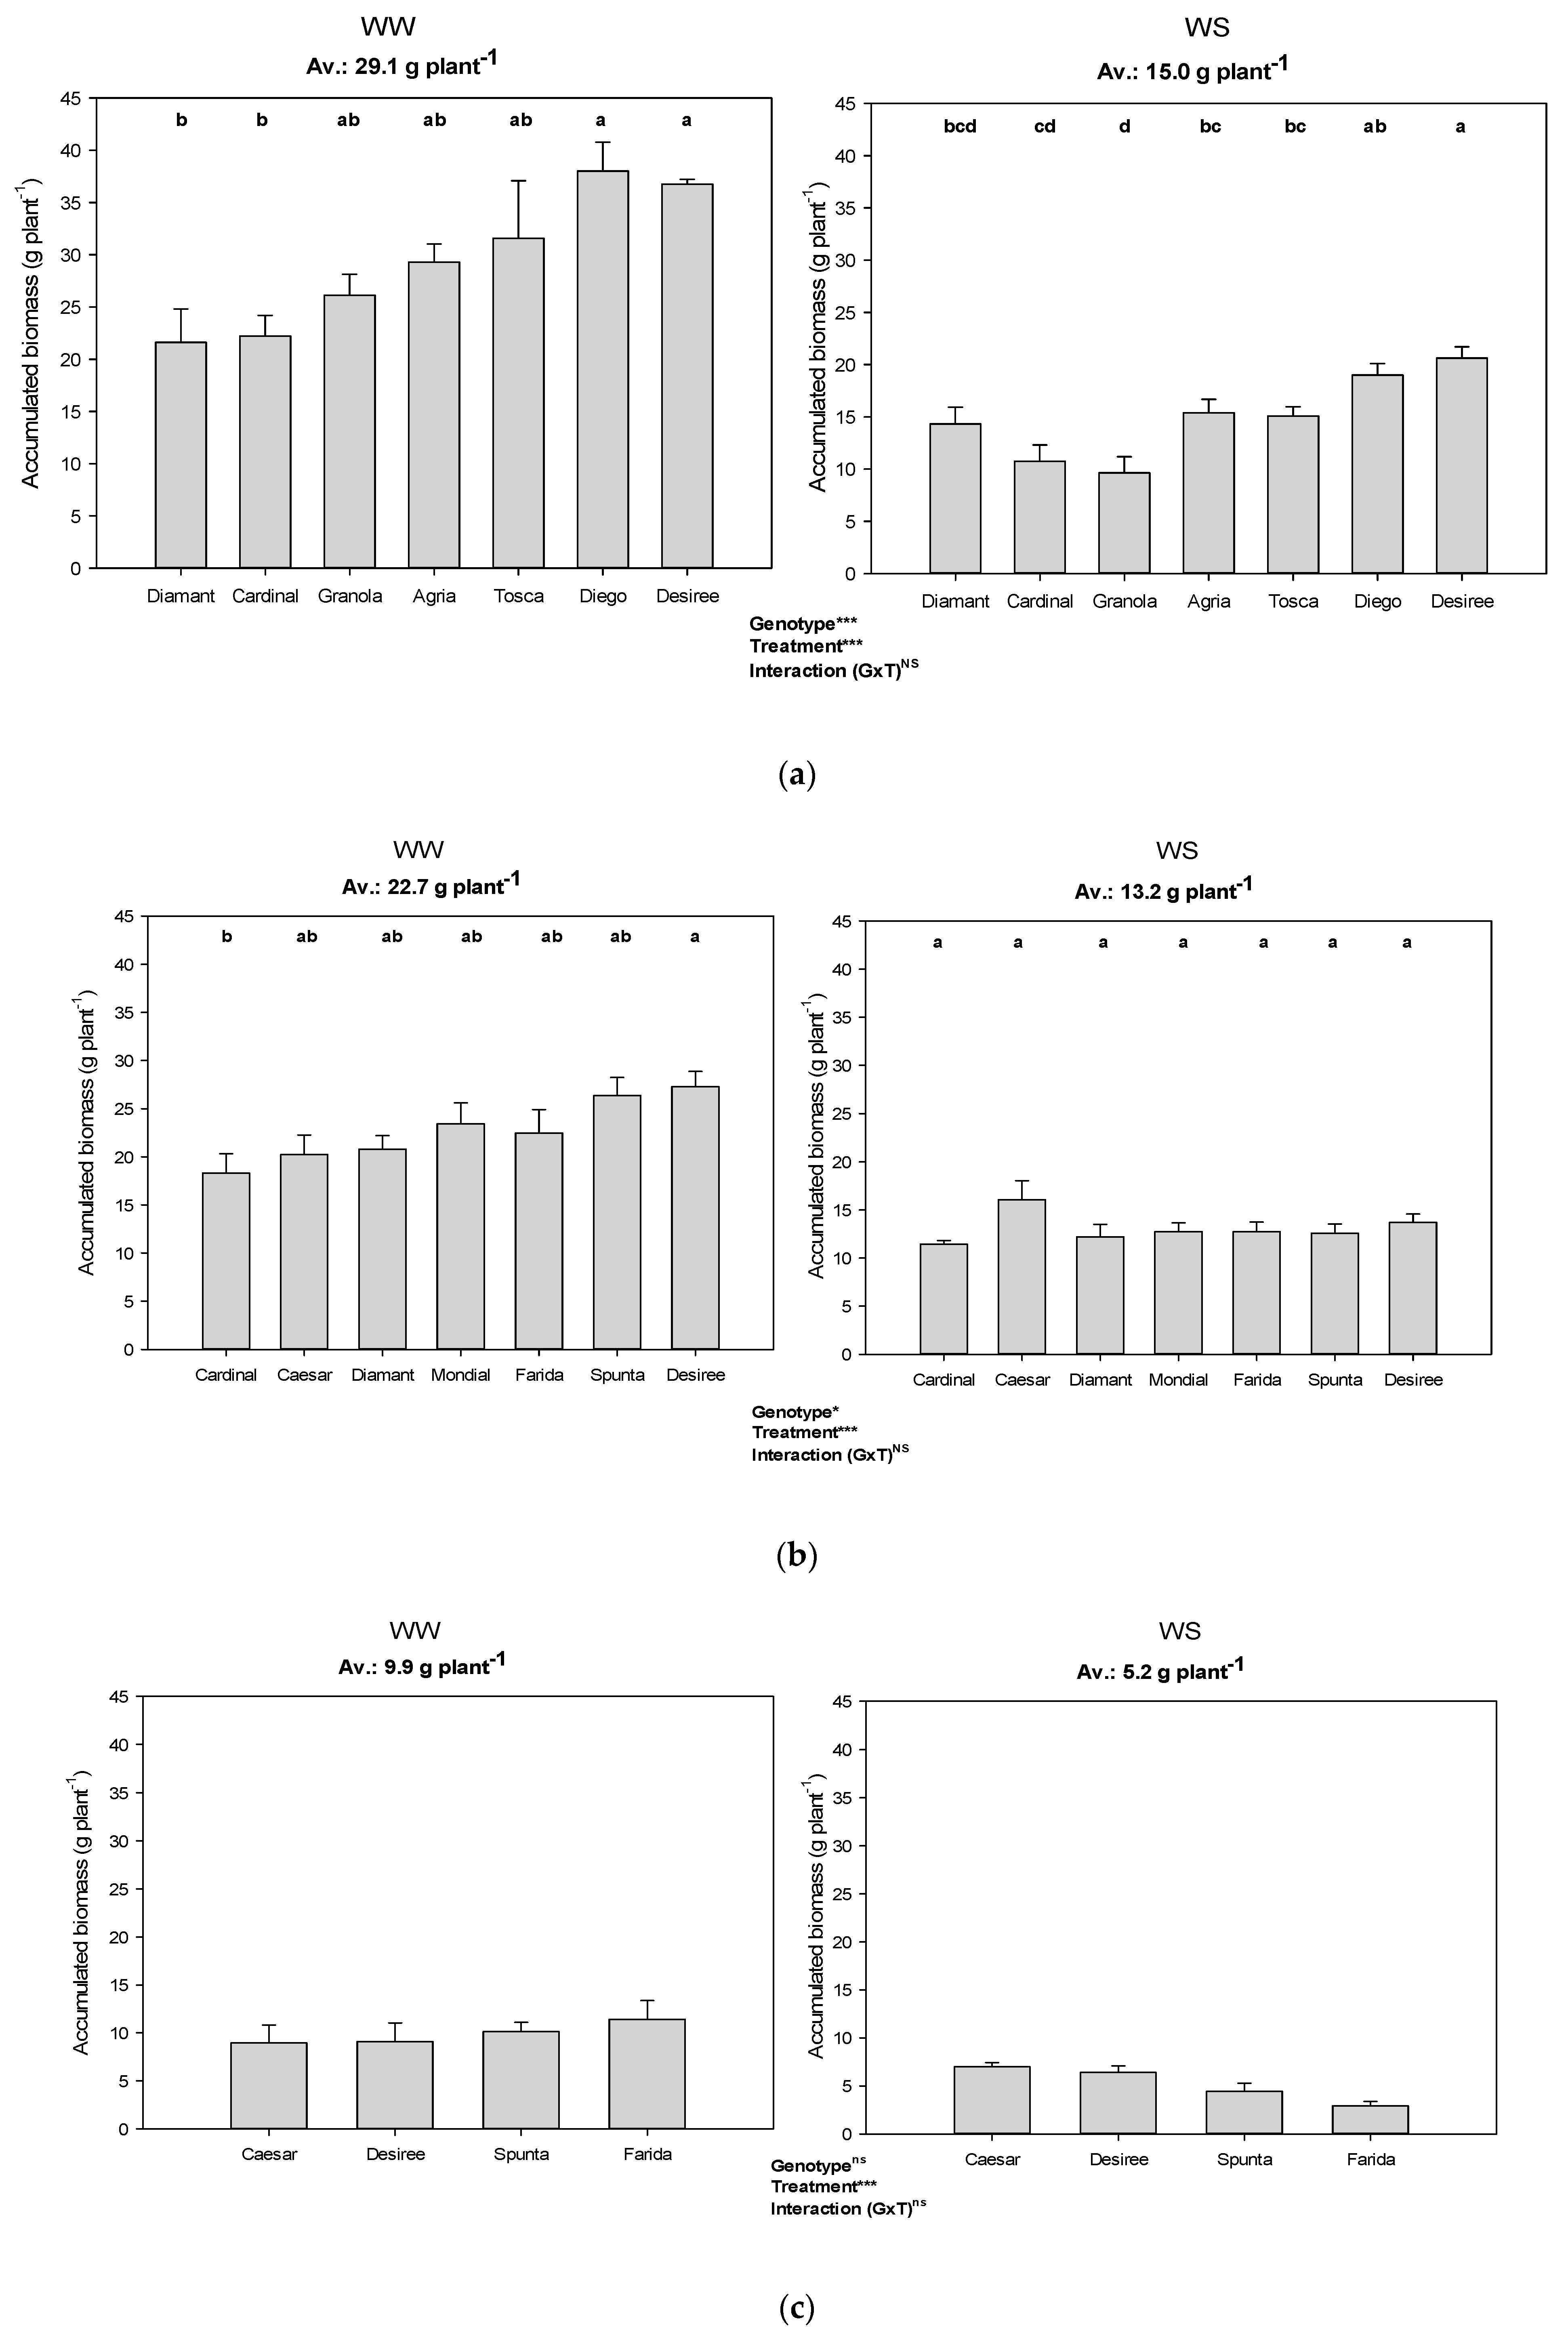
3.3. Biomass Production during the Dry-Down Cycle
In all experiments, plants grown under WS treatment produced roughly half of the dry mass (i.e., leaves, stems, stolons, and tubers; roots and mother tubers were excluded) of the WW plants (Figure 4). WS biomass production of Granola in Exp 1 under low VPD condition was worst affected (36.9% of WW). Desiree showed the strongest reduction (50.2% of WW) in Exp 2 and Farida (28.1% of WW) under high VPD conditions in Exp 3 (Table 3). Generally, Caesar was comparatively less impaired (79.5% and 91.0% of WW in Exp 2 and Exp 3, respectively), indicating its better adaptability to water stress independent of VPD.
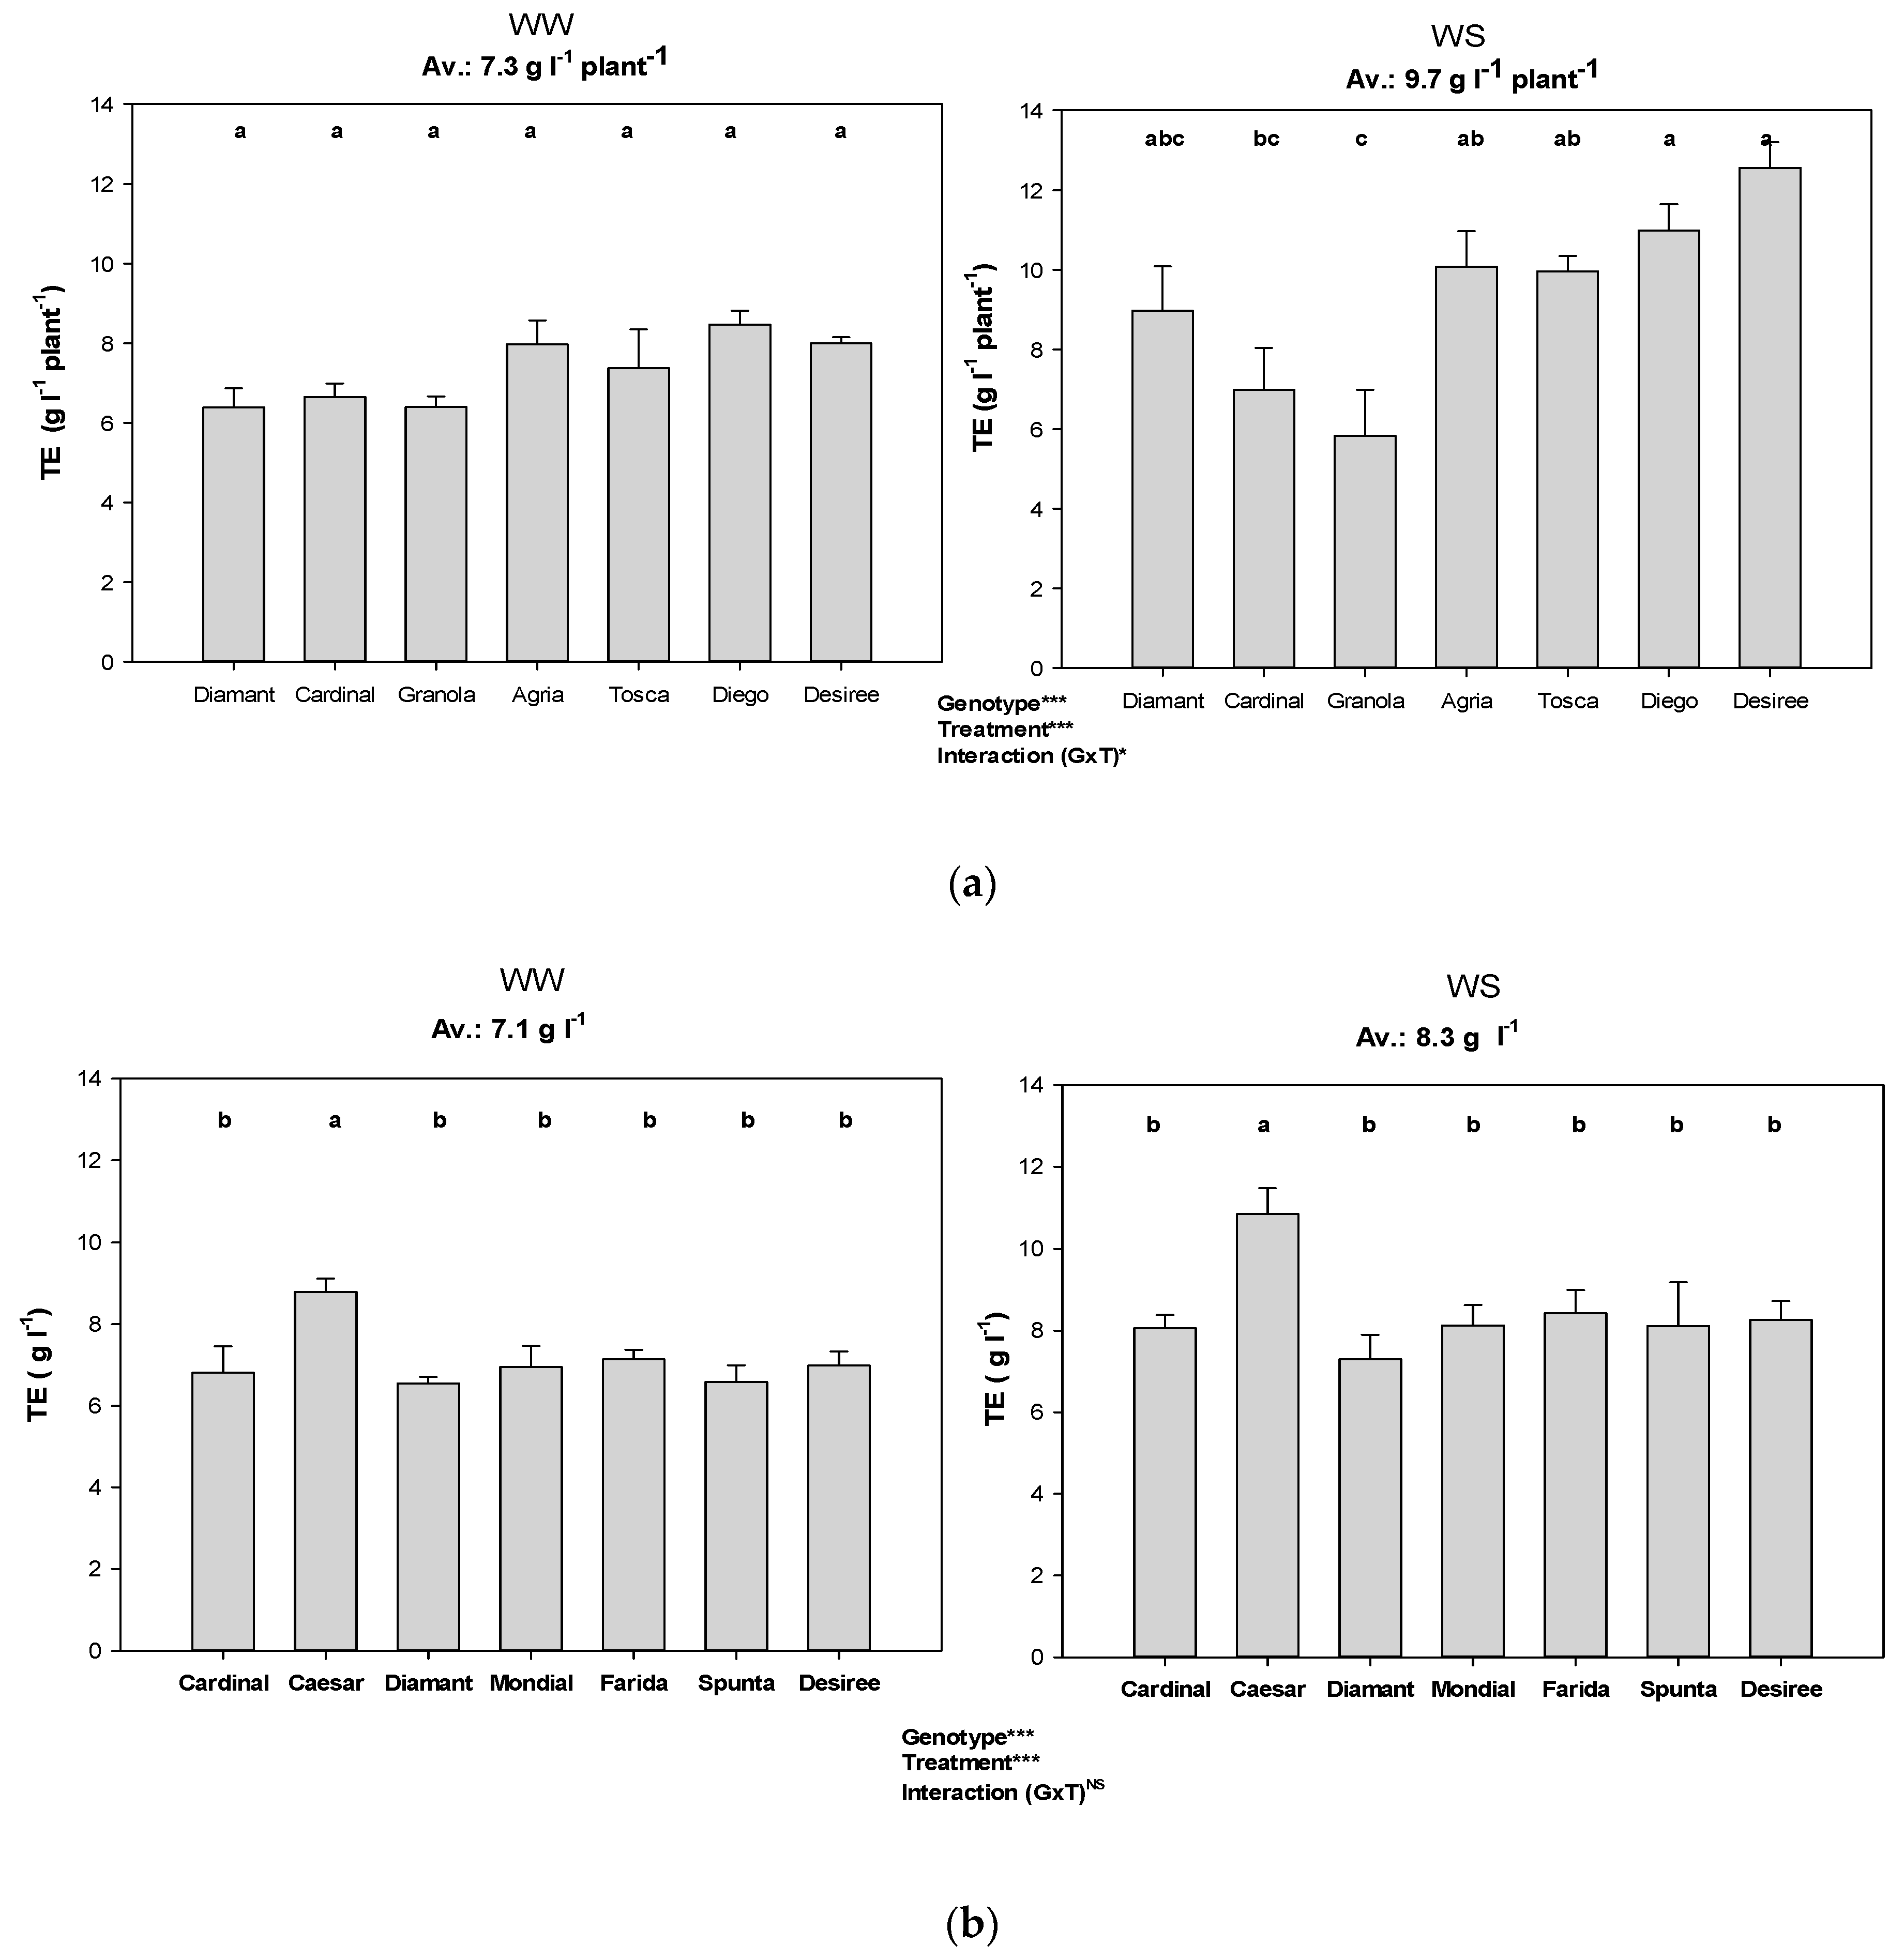
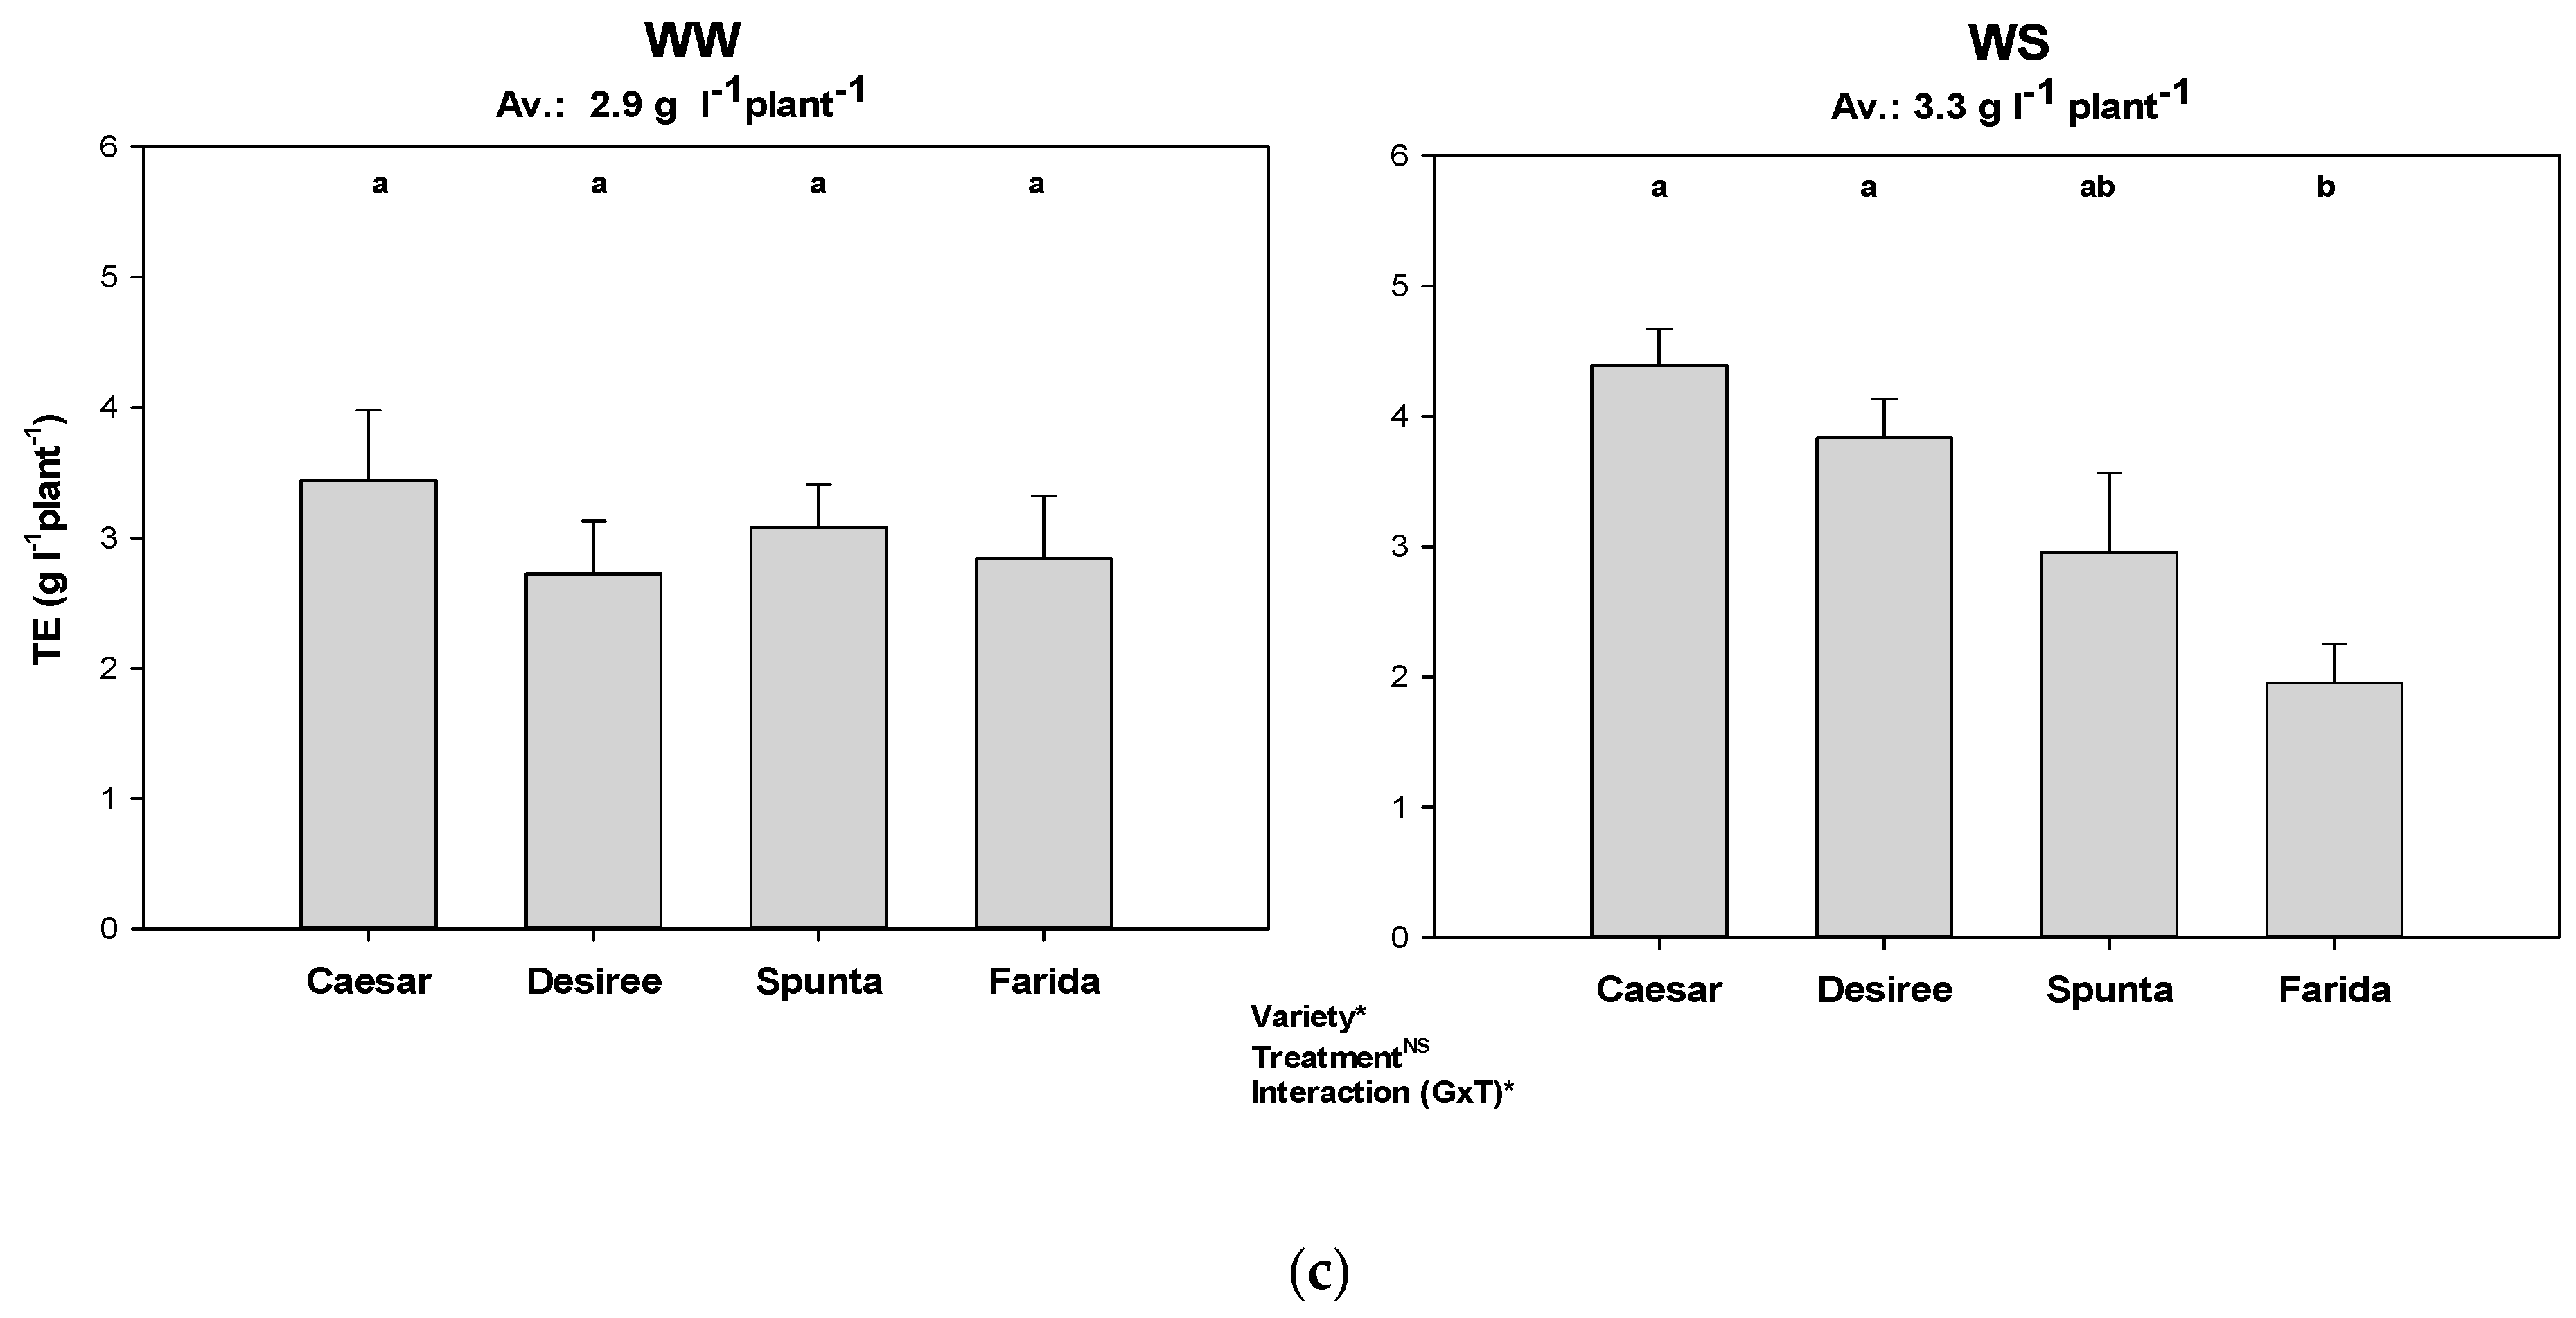
3.4. Transpiration Efficiency Based on Accumulated Biomass
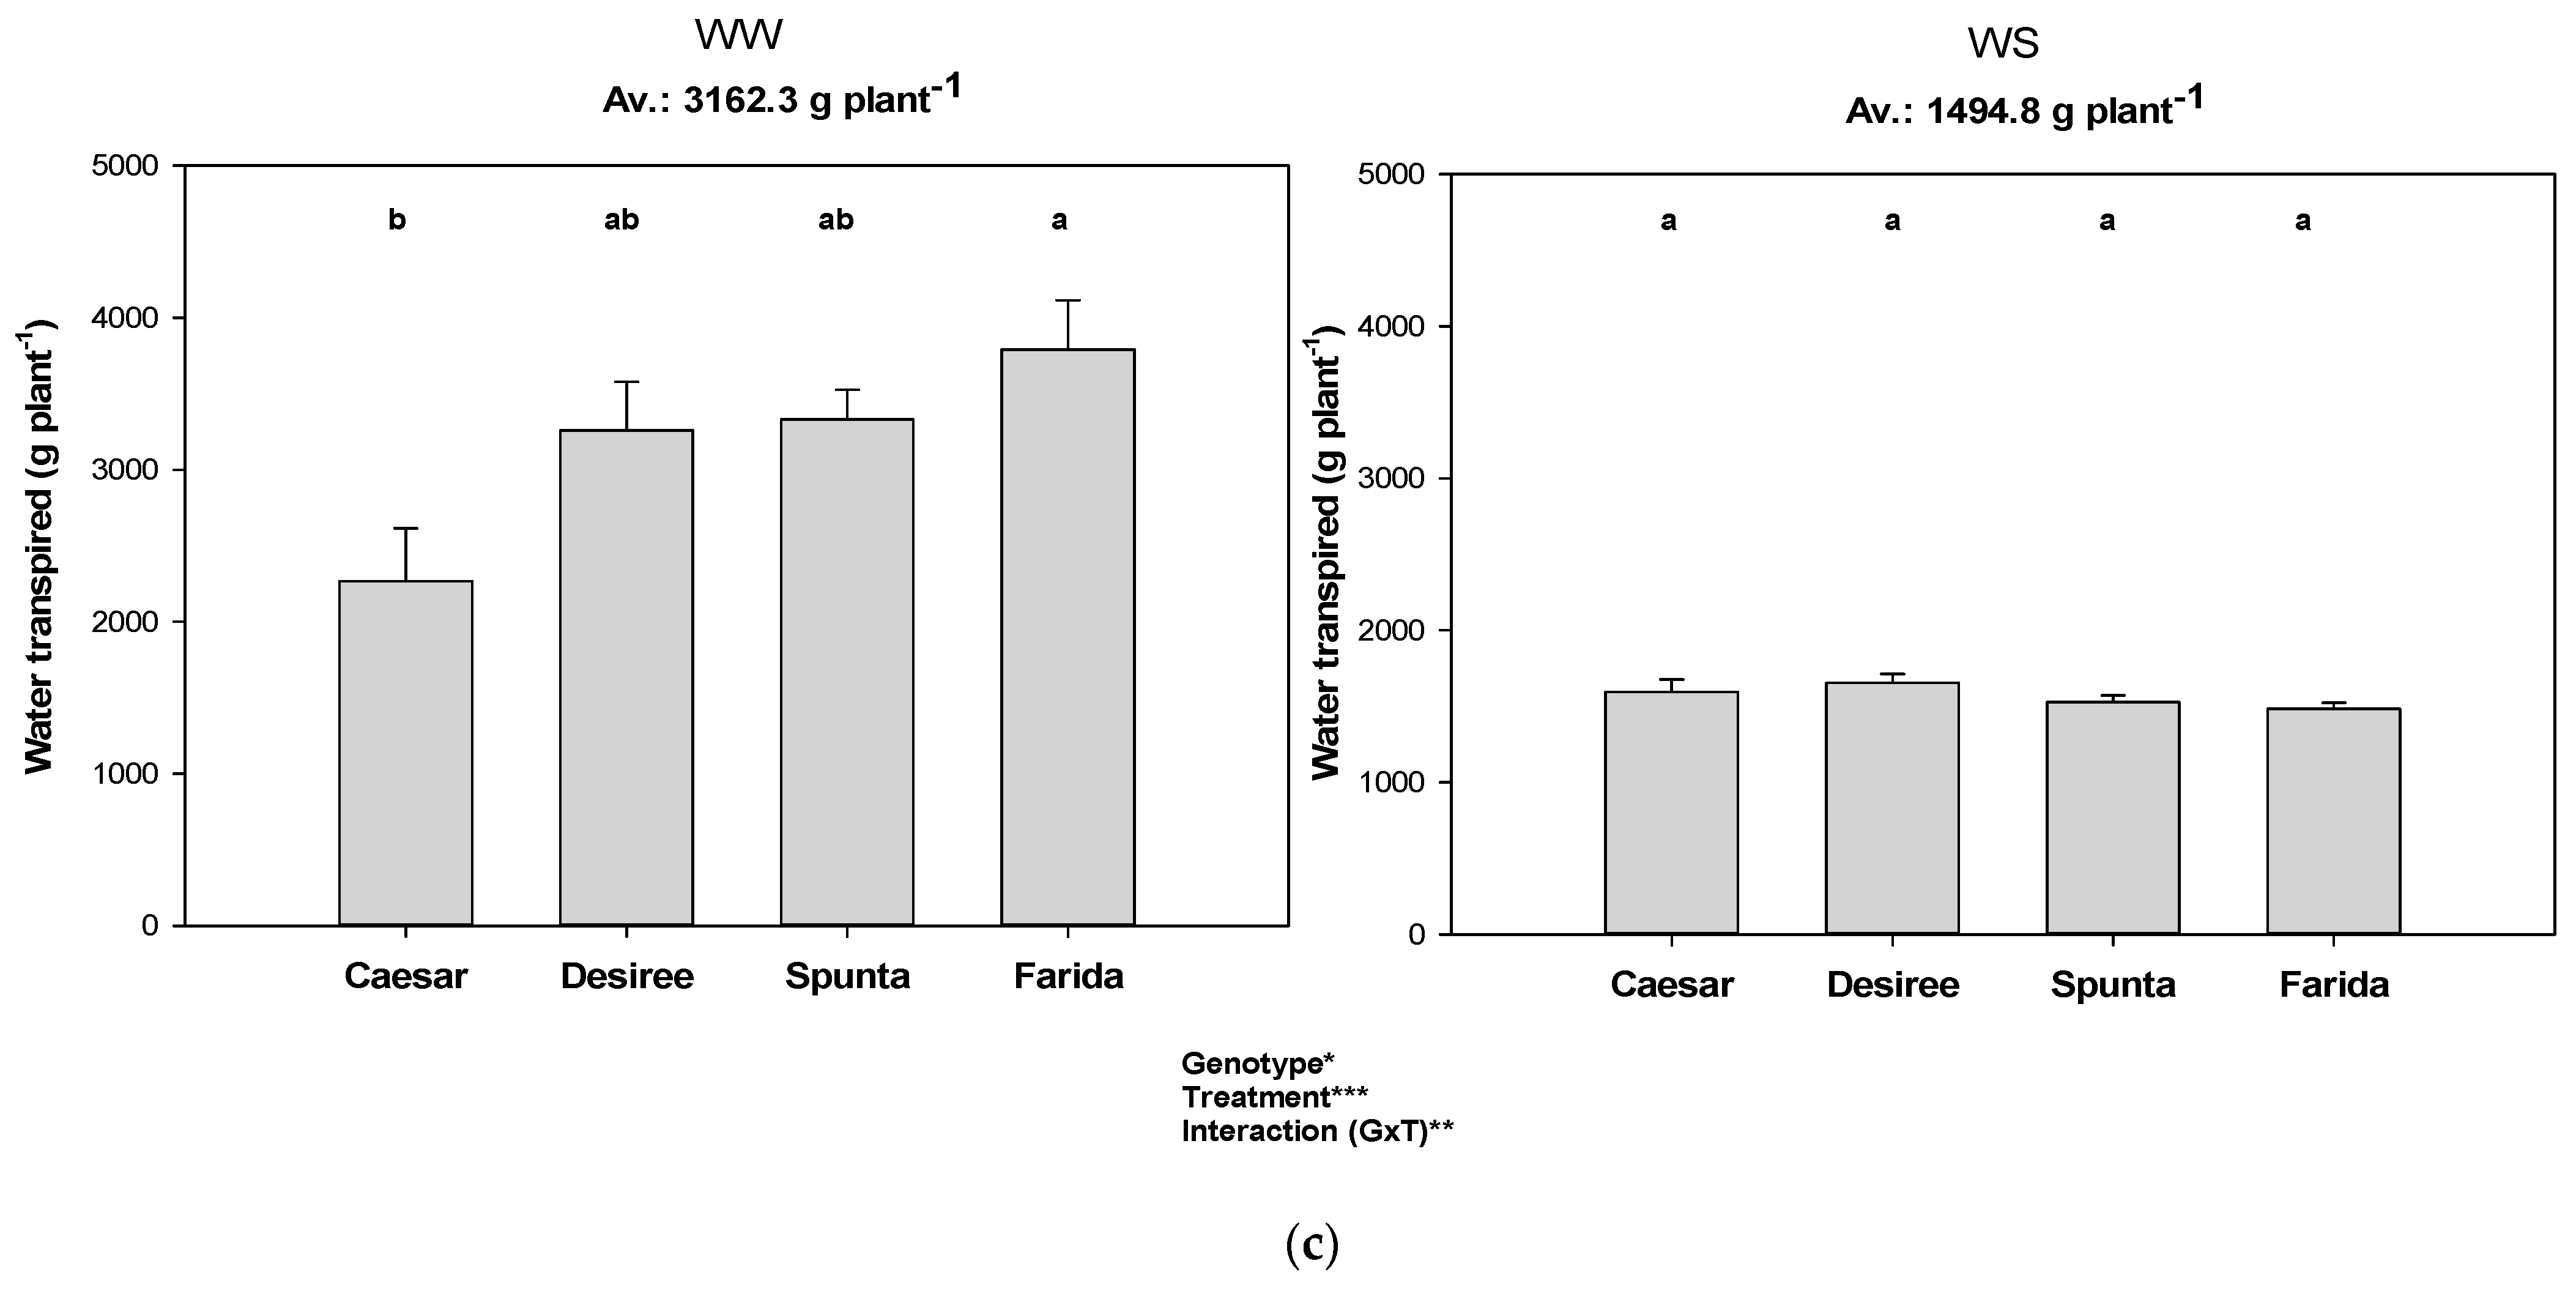
Accumulated biomass per litre of water transpiration (i.e., TE) was generally higher in WS plants compared to WW treatments (Figure 5). This advantage under water-stress condition was significant only in Exp 1 and Exp 2. The comparatively high VPD which prevailed in Exp 3 particularly substantially reduced the tuber fraction (data not shown) and consequently TE. Genotypes showed significant variation in TE under water-deficit conditions. TE was also significantly affected by VPD, with WS plants in Exp 3 showing the lowest TE. Specifically, low TE under WS conditions was observed with cv. Granola and Cardinal in Exp 1 and with cv. Farida in Exp 3 (Figure 5).
3.5. Relationships between Transpiration and Water Saving Properties of WS Plants
FTSW threshold showed significant relationships with water transpired during the dry-down cycle (r = 0.461) as well as with water saved (in % of genotype with highest FTSW threshold, r = 0.533). A very weak correlation between FTSW and TE (r = 0.125) shows their relative independence as water-saving traits. Almost no correlation of TE was observed with water saving (r = 0.087) or total transpiration (r = 0.031) in WS plants.
4. Discussion
Transpiration efficiency (TE) in our experiments was based on total amount of water transpired in the course of the dry-down cycle. This total transpiration varied significantly among the genotypes in all experiments under well-watered condition but was not significantly different under drought stress. In [48], the researchers detected no genotypic variation in transpiration response with well-watered cotton plants under different VPD conditions. In our experiments, plants did not change their transpiration behavior in response to changes in VPD unless it was challenged by drought (Figure 2). Additionally, the reduction in transpiration by >50% of total transpiration in WS plants during dry-down compared to WW plants (Figure 2) shows restricted transpiration in WS plants and strong influence of water supply on genotypic response, which has been reported by [41,49] as well.
Together with water supply and genotype, VPD effect on transpiration was obvious as well in our study (Figure 2). However, these influences might be different under various air temperature and relative humidity as reported by [32]. Therefore, part of the uncertainty about VPD impacts on plants relates to the difficulty of disentangling VPD effects from temperature, radiation, and other climate factors affecting plant physiology. However, the relative role of VPD vs. other stressors occurring during climate change may be much higher than previously estimated [36].
Furthermore, due to VPD and progressive soil drying interactions, our results showed, in most cases, higher FTSW values at lower VPD conditions (Table 3), which is clearly exemplified by Desiree as a common genotype in all experiments (Figure 3). Similar results were reported in [41]. Significant cultivar differences in FTSW threshold in our study confirm the genotype-based reaction on progressive soil drying, which has also been reported for soybean [50] and cotton cultivars [49]. In our experiments, these genotypic differences in FTSW threshold correlate with different amounts of soil water saved for later use (Figure 3, Table 3), as previously demonstrated by [49] in cotton. In [51], a limitation of transpiration rate in soybean was reported as a key trait in drought prone regions, where VPD is high and irrigation is not available, which allows a significant early season conservation of soil water, providing the crop with a soil water reserve to complete development and growth during seed fill. This restricts maximum transpiration trait which may boost TE as indicated by [52]. Consequently, the conserved soil water available to consume late in the season allows the production of greater yield. Accordingly, water treatment, genotype and VPD (which affects FTSW threshold, too) along with their interactions affect transpiration efficiency (TE) as shown in Figure 5. Significant genotypic variations for TE in many grain crops have been reported several times [28,30,37,53], but few studies have been conducted so far on TE of potato.
TE in our study, based on total biomass (which includes shoots and stolons with new tubers), was only half at high VPD compared to low VPD conditions (Figure 5). High TE at lower VPD and its decrease with increasing VPD confirms the dependency of TE in potato genotypes on environmental conditions. In contrast, the researchers in [53] reported high TE at high VPD in C4 cereal species just under different VPD conditions, but without water supply treatments. Averaged across all experiments, the significantly higher TE (7.4 g L−1) measured in WS treatment compared to WW plants (6.2 g L−1) clearly shows the impact of drought stress on TE in our study (Figure 5). Considering the water-saving ability of individual genotypes together with TE shows that, for instance, the best candidates for none or only very low water-saving coefficients, i.e., Tosca in Exp 1, Spunta and Farida in Exp 2 and Farida in Exp 3, did not appear as those with highest TE (Table 3, Figure 5). In contrast, Desiree in Exp 1 and Caesar in Exp 2 and Exp 3 had highest TE with none or only low water-saving coefficients, respectively. Even the best water-savers, Farida and Spunta, attained significantly lower TE than Caesar (Figure 5).
5. Conclusions
Our results provide insights into genotypic interactions with environmental factors, especially VPD effects, on FTSW threshold and TE under dry-down conditions in potato. Although higher temperatures increase stomatal resistance that limits transpiration, we determined that, based on our experiments under normal temperature and sufficiently available soil water, daily transpiration in Desiree—as the only common genotype in all three experiments—was substantially accelerated by increasing VPD. Future work may focus on disentangling temperature- vs. humidity-driven impacts of VPD by using controlled experiments (e.g., climate chambers, humidity manipulation in the field), possibly across a wide range of genotypes.
Furthermore, we assumed that genotypes with a higher FTSW threshold (which reduce transpiration earlier) would conserve soil water for higher transpiration efficiency. However, no correlation of FTSW with transpiration efficiency was observed. This might be due to genotypic variation of root characteristics or other traits, which opens new research opportunities in the future.
Author Contributions
Conceptualization, A.M.M. and H.-P.K.; methodology, A.M.M. and H.-P.K.; formal analysis, A.M.M., Z.S.-S. and M.S.I.; investigation, M.S.I.; resources, H.-P.K.; data curation, M.S.I. and Z.S.-S.; writing—original draft preparation, M.S.I. and Z.S.-S.; writing—review and editing, H.-P.K. and A.M.M.; visualization, M.S.I., Z.S.-S. and H.-P.K.; supervision, A.M.M. and H.-P.K.; project administration, H.-P.K.; funding acquisition, M.S.I. and H.-P.K. All authors have read and agreed to the published version of the manuscript.
Funding
Md. Saiful Islam was supported by the Bangabandhu Fellowship Project of the Government of Bangladesh under the Ministry of Science and Technology with a deputation and study leave granted by his employer the Ministry of Agriculture, Bangladesh.
Data Availability Statement
Data are available upon request from the first authors M.S.I. and Z.S.-S.
Conflicts of Interest
The authors declare no conflict of interest.
References
- Lutaladio, N.; Castaldi, L. Potato: The Hidden Treasure. J. Food Compos. Anal. 2009, 22, 491–493. [Google Scholar] [CrossRef]
- Fuqiang, L.; Haoliang, D.; Yucai, W.; Xuan, L.; Xietian, C.; Lintao, L.; Hengjia, Z. Potato Growth, Photosynthesis, Yield, and Quality Response to Regulated Deficit Drip Irrigation under Film Mulching in A Cold and Arid Environment. Res. Sq. 2021, 11, 1–16. [Google Scholar] [CrossRef]
- Muhammad, W.N.; Zoltan, T. Effect of Drought Stress on Potato Production: A Review. Agronomy 2022, 12, 635. [Google Scholar]
- Reddy, B.J.; Mandal, R.; Chakroborty, M.; Hijam, L.; Dutta, P. A Review on Potato (Solanum tuberosum L.) and Its Genet. Diversity. Int. J. Genet. 2018, 10, 360–364. [Google Scholar]
- FAOSTAT. Available online: https://www.fao.org/faostat/en/#data/QCL (accessed on 23 November 2021).
- Battisti, D.S.; Naylor, R.L. Historical Warnings of Future Food Insecurity with Unprecedented Seasonal Heat. Science 2009, 323, 240–244. [Google Scholar] [CrossRef] [Green Version]
- Camargo, D.C.; Montoya, F.; Córcoles, J.I.; Ortega, J.F. Modeling the Impacts of Irrigation Treatments on Potato Growth and Development. Agric. Water Manag. 2015, 150, 119–128. [Google Scholar] [CrossRef]
- Dettinger, M.; Cayan, D.R. Drought and the California Delta—A Matter of Extremes. San Franc. Estuary Watershed. Sci. 2014, 12, 2. [Google Scholar] [CrossRef] [Green Version]
- Wilhite, D.A. Drought-Management Policies and Preparedness Plans: Changing the Paradigm from Crisis to Risk Management in Land Restoration; Elsevier: Amsterdam, The Netherlands, 2016; pp. 443–462. [Google Scholar]
- Deblonde, P.M.K.; Haverkort, A.J.; Ledent, J.-F. Responses of Early and Late Potato Cultivars to Moderate Drought Conditions: Agronomic Parameters and Carbon Isotope Discrimination. Eur. J. Agron. 1999, 11, 91–105. [Google Scholar] [CrossRef]
- Fahad, S.; Bajwa, A.A.; Nazir, U.; Anjum, S.A.; Farooq, A.; Zohaib, A.; Sadia, S.; Nasim, W.; Adkins, S.; Saud, S. Crop Production under Drought, and Heat Stress: Plant Responses and Management Options. Front. Plant Sci. 2017, 8, 1147. [Google Scholar] [CrossRef] [Green Version]
- Hirut, B.; Shimelis, H.; Fentahun, M.; Bonierbale, M.; Gastelo, M.; Asfaw, A. Combining Ability of Highland Tropic Adapted Potato for Tuber Yield and Yield Components under Drought. PLoS ONE 2017, 12, e0181541. [Google Scholar] [CrossRef] [Green Version]
- Boguszewska-Mankowska, D.; Ruszczak, B.; Zarzynska, K. Classification of Potato Varieties Drought Stress Tolerance Using Supervised Learning. Appl. Sci. 2022, 12, 1939. [Google Scholar] [CrossRef]
- Van Loon, C.D. The Effect of Water Stress on Potato Growth, Development, and Yield. Am. Potato J. 1981, 58, 51–69. [Google Scholar] [CrossRef]
- Deblonde, P.M.K.; Ledent, J.F. Effects of Moderate Drought Conditions on Green Leaf Number, Stem Height, Leaf Length and Tuber Yield of Potato Cultivars. Eur. J. Agron. 2001, 14, 31–41. [Google Scholar] [CrossRef]
- Lahlou, O.; Ledent, J.-F. Root Mass and Depth, Stolons and Roots Formed on Stolons in Four Cultivars of Potato under Water Stress. Eur. J. Agron. 2005, 22, 159–173. [Google Scholar] [CrossRef]
- Lahlou, O.; Ouattar, S.; Ledent, J.-F. The Effect of Drought and Cultivar on Growth Parameters, Yieldand Yield Components of Potato. Agronomie 2005, 23, 257–268. [Google Scholar] [CrossRef]
- Kumar, S.; Asrey, R.A.M.; Mandal, G. Effect of Differential Irrigation Regimes on Potato (Solanum tuberosum) Yield and Postharvest Attributes. Indian J. Agric. Sci 2007, 77, 366–368. [Google Scholar]
- Schafleitner, R.; Gutierrez, R.; Legay, S.; Evers, D.; Bonierbale, M. Drought Stress Tolerance Traits of Potato. In Proceedings of the 15th International Symposium of the International Society for Tropical Root Crops (ISTRC), Lima, Peru, 2–7 November 2009; pp. 2–7. [Google Scholar]
- Eiasu, B.K.; Soundy, P.; Hammes, P.S. Response of Potato (Solanum tuberosum) Tuber Yield Components to Gel-Polymer Soil Amendments and Irrigation Regimes. N. Z. J. Crop Hortic. Sci 2007, 35, 25–31. [Google Scholar] [CrossRef] [Green Version]
- Ahmadi, S.H.; Andersen, M.N.; Plauborg, F.; Poulsen, R.T.; Jensen, C.R.; Sepaskhah, A.R.; Hansen, S. Effects of Irrigation Strategies and Soils on Field Grown Potatoes: Yield and Water Productivity. Agric. Water Manag. 2010, 97, 1923–1930. [Google Scholar] [CrossRef]
- Li, W.; Xiong, B.; Wang, S.; Deng, X.; Yin, L.; Li, H. Regulation Effects of Water and Nitrogen on the Source-Sink Relationship in Potato during the Tuber Bulking Stage. PLoS ONE 2016, 11, e0146877. [Google Scholar] [CrossRef] [Green Version]
- Sadeghipour, O.; Aghaei, P. Response of Common Bean (Phaseolus vulgaris L.) to Exogenous Application of Salicylic Acid (SA) under Water Stress Conditions. Adv. Environ. Biol. 2012, 6, 1160–1168. [Google Scholar]
- Passioura, J.B. Drought and drought tolerance. In Drought Tolerance in Higher Plants: Genetical, Physiological and Molecular Biological Analysis; Springer: Dordrecht, The Netherlands, 1996; pp. 1–5. [Google Scholar]
- Sinclair, T.R. Is transpiration efficiency a viable plant trait in breeding for crop improvement? Funct. Plant Biol. 2012, 39, 359–365. [Google Scholar] [CrossRef] [Green Version]
- Manschadi, A.M.; Christopher, J.T.; de Voil, P.; Hammer, G.L. The role of root architectural traits in adaptation of wheat to waterlimited environments. Funct. Plant Biol. 2006, 33, 823–837. [Google Scholar] [CrossRef] [Green Version]
- Choudhary, S.; Mutava, R.N.; Shekoofa, A.; Sinclair, T.R.; Vara Prasad, P.V. Is the stay-green trait in sorghum a result of transpiration sensitivity to either soil drying or vapor pressure deficit? Crop Sci. 2013, 53, 2129–2134. [Google Scholar] [CrossRef]
- Gholipoor, M.; Sinclair, T.R.; Prasad, P.V. Genotypic variation within sorghum for transpiration response to drying soil. Plant Soil 2012, 357, 35–40. [Google Scholar] [CrossRef]
- Sadras, V.O.; Milroy, S.P. Soil-water thresholds for the response of leaf expansion and gas exchange. A review. Field Crops Res. 1996, 47, 253–266. [Google Scholar] [CrossRef]
- Devi, M.J.; Sinclair, T.R.; Vadez, V.; Krishnamurthy, L. Peanut genotypic variation in transpiration efficiency and decreased transpiration during progressive soil drying. Field Crops Res. 2009, 114, 280–285. [Google Scholar] [CrossRef] [Green Version]
- Ray, J.D.; Sinclair, T.R. Stomatal closure of maize hybrids in response to drying soil. Crop Sci. 1997, 37, 803–807. [Google Scholar] [CrossRef]
- Zhang, P.; Yang, X.; Manevski, K.; Li, S.H.; Wei, Z.H.; Andersen, M.N.; Liu, F. Physiological and Growth Responses of Potato (Solanum tuberosum L.) to Air Temperature and Relative Humidity under Soil Water Deficits. Plants 2022, 11, 1126. [Google Scholar] [CrossRef]
- Juenger, T.E.; Verslues, P.E. Time for a drought experiment: Do you know your plants’ water status? Plant Cell 2023, 35, 10–23. [Google Scholar] [CrossRef]
- Fu, Z.; Ciais, P.; Feldman, A.F.; Gentine, P.; Makowski, D.; Prentice, I.C.; Stoy, P.C.; Bastos, A.; Wigneron, J.-P. Critical soil moisture thresholds of plant water stress in terrestrial ecosystems. Sci. Adv. 2022, 8, eabq7827. [Google Scholar] [CrossRef]
- Massmann, A.; Gentine1, P.; Lin, C. When Does Vapor Pressure Deficit Drive or Reduce Evapotranspiration? J. Adv. Model. Earth Syst. 2019, 11, 3305–3320. [Google Scholar] [CrossRef] [Green Version]
- Grossiord, C.; Buckley, T.N.; Cernusak, L.A.; Novick5, K.A.; Poulter, B.; Siegwolf, R.T.W.; Sperry, J.S.; McDowell8, N.J. Plant responses to rising vapor pressure deficit. New Phytol. 2020, 226, 1550–1566. [Google Scholar] [CrossRef] [Green Version]
- Krishnamurthy, L.; Vadez, V.; Devi, M.J.; Serraj, R.; Nigam, S.N.; Sheshshayee, M.S.; Chandra, S.; Aruna, R. Variation in transpiration efficiency and its related traits in a groundnut (Arachis hypogaea L.) mapping population. Field Crops Res. 2007, 103, 189–197. [Google Scholar] [CrossRef] [Green Version]
- Islam, M.S. Identification and Evaluation of Drought-Adaptive Traits in Potato. Ph.D. Thesis, University of Natural Resources and Life Sciences, Vienna, Austria, 2017. [Google Scholar]
- Ray, J.D.; Sinclair, T.R. The effect of pot size on growth and transpiration of maize and soybean during water deficit stress. J. Exp. Bot. 1998, 49, 1381–1386. [Google Scholar] [CrossRef]
- Sinclair, T.R.; Ludlow, M.M. Influence of soil water supply on the plant water balance of four tropical grain legumes. Funct. Plant Biol. 1986, 13, 329–341. [Google Scholar] [CrossRef]
- Trevisan de Souza, A.; Streck, N.A.; Heldwein, A.B.; Bisognin, D.A.; Minussi Winck, J.E.; Schmitz Marques da Rocha, T.; Zanon, A.J. Transpiration and leaf growth of potato clones in response to soil water deficit. Sci. Agric. 2014, 71, 96–104. [Google Scholar] [CrossRef] [Green Version]
- Cirelli, D.; Lieffers, V.J.; Tyree, M.T. Measuring whole-plant transpiration gravimetrically: A scalable automated system built from components. Trees 2012, 26, 1669–1676. [Google Scholar] [CrossRef]
- Devi, M.J.; Sinclair, T.R. Diversity in drought traits among commercial southeastern US peanut cultivars. Int. J. Agron. 2011, 2011, 754658. [Google Scholar] [CrossRef]
- Ray, J.D.; Gesch, R.W.; Sinclair, T.R.; Hartwell Allen, L. The effect of vapor pressure deficit on maize transpiration response to a drying soil. Plant Soil 2002, 239, 113–121. [Google Scholar] [CrossRef]
- Zaman-Allah, M.; Jenkinson, D.M.; Vadez, V. Chickpea genotypes contrasting for seed yield under terminal drought stress in the field differ for traits related to the control of water use. Funct. Plant Biol. 2011, 38, 270–281. [Google Scholar] [CrossRef] [Green Version]
- Howell, T.A.; Dusek, D.A. Comparison of vapor-pressure-deficit calculation methods—Southern high plains. J. Irrig. Drain. Eng. 1995, 121, 191–198. [Google Scholar] [CrossRef]
- Ritchie, J.T. Water dynamics in the soil-plant-atmosphere system. In Soil Water and Nitrogen in Mediterranean-Type Environments; Plant and Soil; Springer: Hague, The Netherlands, 1981; pp. 81–96. [Google Scholar]
- Devi, M.J.; Redy, V. Transpiration Response of Cotton to Vapor Pressure Deficit and Its Relationship with Stomatal Traits. Front. Plant Sci. 2018, 9, 1572. [Google Scholar] [CrossRef] [Green Version]
- Devi, M.J.; Redy, V. Cotton Genotypic Variability for Transpiration Decrease with Progressive Soil Drying. Agronomy 2020, 10, 1290. [Google Scholar] [CrossRef]
- Purdom, S.; Shekoofa, A.; McClure, A.; Pantalone, V.; Arelli, P. Genotype identification for a water saving trait: Exploring early stomatal closure under soil drying among mid-South soybean. Agron. J. 2021, 114, 545–554. [Google Scholar] [CrossRef]
- Fletcher, A.L.; Sinclair, T.R.; Allen, H.L. Transpiration responses to vapor pressure deficit in well-watered ‘slow-wilting’ and commercial soybean. Environ. Exp. Bot. 2007, 6, 145–151. [Google Scholar] [CrossRef]
- Sinclair, T.R.; Hammer, G.L.; van Osterom, E.J. Potential yield and water-use efficiency benefits in sorghum from limited maximum transpiration rate. Funct. Plant Biol. 2005, 32, 945–952. [Google Scholar] [CrossRef]
- Vadez, V.; Choudhary, S.; Kholová, J.; Hash, C.T.; Srivastava, R.; Kumar, A.A.; Prandavada, A.; Anjaiah, M. Transpiration efficiency: Insights from comparisons of C4 cereal species. J. Exp. Bot. 2021, 72, 5221–5234. [Google Scholar] [CrossRef]
- Sinclair, T.R.; Bennett, J.M. Principles of Ecology in Plant Production; CAB International: Wallingford, UK, 1998; pp. 103–120. [Google Scholar]
Figure 1.
Method of pot sealing (a) and a sealed pot (b).

Figure 2.
Total transpiration of genotypes among the water treatments and different VPD conditions (i.e., experiments). Error bars indicate SEM and different letters indicate differences in means (WW: well-watered, WS: water stress, (a) Exp 1 with low VPD, (b) Exp 2 with moderate VPD, (c) Exp 3 with high VPD). *, **, *** represent significant differences.


Figure 3.
Response of NTR (Normalized Transpiration Rate) of genotype Desiree to decreasing FTSW (Fraction of Transpirable Soil Water) during soil drying ((a) Exp 1 with low VPD, (b) Exp 2 with moderate VPD, (c) Exp 3 with high VPD).
Figure 3.
Response of NTR (Normalized Transpiration Rate) of genotype Desiree to decreasing FTSW (Fraction of Transpirable Soil Water) during soil drying ((a) Exp 1 with low VPD, (b) Exp 2 with moderate VPD, (c) Exp 3 with high VPD).

Figure 4.
Accumulated dry biomass production of genotypes among the water treatments and different VPD conditions (i.e., experiments). Error bars indicate SEM and different letters indicate differences in means (WW: well-watered, WS: water stress, (a) Exp 1 with low VPD, (b) Exp 2 with moderate VPD, (c) Exp 3 with high VPD). *, *** represent significant differences; ns represents no significant.

Figure 5.
Transpiration efficiency of genotypes among the water treatments and different VPD conditions (i.e., experiments). Error bars indicate SEM and different letters indicate differences in means (WW: well-watered, WS: water stress, (a) Exp 1 with low VPD, (b) Exp 2 with moderate VPD, (c) Exp 3 with high VPD). *, *** represent significant differences; ns represents no significant.


Table 1.
Conditions, genotypes, and details on execution of three experiments.
| Genotypes | Exp 1 7 Genotypes | Exp 2 7 Genotypes | Exp 3 4 Genotypes |
|---|---|---|---|
| Granola | Planting date: 15 December 2014 Harvest date: 12 February 2015 Plant age (d) at onset of drought stress: 25 Plant age (d) at the end: 59 Dry down days: 34 Avg. Temp (°C) at onset of drought stress: 16.9 Avg. Temp (°C) at the end: 16.8 Avg. RH (%) at onset of drought stress: 42.0 Avg. RH (%) at the end: 42.2 Avg. VPD (KPa) at onset of drought stress: 1.19 Avg. VPD (KPa) at the end: 1.16 Thermal time (GDD) at onset of drought stress: 253.4 Thermal time (GDD) at the end: 597.6 | ||
| Agria | |||
| Tosca | |||
| Diego | |||
| Cardinal | Planting date: 14 February 2015 Harvest date: 10 April 2015 Plant age (d) at onset of drought stress: 23 Plant age (d) at the end: 55 Dry down days: 32 Avg. Temp (°C) at onset of drought stress: 18.4 Avg. Temp (°C) at the end: 17.5 Avg. RH (%) at onset of drought stress: 49.9 Avg. RH (%) at the end: 43.8 Avg. VPD (KPa) at onset of drought stress: 1.35 Avg. VPD (KPa) at the end: 1.30 Thermal time (GDD) at onset of drought stress: 251.7 Thermal time (GDD) at the end: 585.6 | ||
| Diamant | |||
| Desiree | Planting date: 14 April 2016 Harvest date: 14 June 2016 Plant age (d) at onset of drought stress: 33 Plant age (d) at the end: 61 Dry down days: 28 Avg. Temp (°C) at onset of drought stress: 18.1 Avg. Temp (°C) at the end: 20.4 Avg. RH (%) at onset of drought stress: 37.4 Avg. RH (%) at the end: 51.3 Avg. VPD (KPa) at onset of drought stress: 1.52 Avg. VPD (KPa) at the end: 1.59 Thermal time (GDD) at onset of drought stress: 406.4 Thermal time (GDD) at the end: 878.1 | ||
| Caesar | |||
| Spunta | |||
| Farida | |||
| Mondial |
Table 2.
Calculated parameters and formula used in our study.
| Parameters | Formula | Explanation |
|---|---|---|
| Daily transpiration | Ti = Wi − Wi−1 | i = measurement day (i = 1, 2, 3, …, n), Ti = daily transpiration Wi = daily pot weight |
| Water requirements for WW plants | Wati = [(W0 − 240) − Wi] | W0 = initial day pot weight Wati = daily water requirement if Wi ≤ W0 − 240; otherwise, Wati = 0 |
| Water requirements for WS plants | Wati = Ti − 80 | if Ti ≥ 80; otherwise, Wati = 0 |
| Transpiration normalization (first step) | TRi = [Ti/Tw of (Rep1 + Rep2, …, + Rep5)/5] | TRi = daily transpiration ratio Ti = daily transpiration of WS plants Tw = daily transpiration of WW plants Rep1, …, Rep5 = replications |
| Transpiration normalization (second step) | NTRn = [TRn/(TR2 + TR3 + TR4 + TR5)/4] | NTRn = normalized transpiration rates of WS plants on day n TRn = transpiration rate of WS plants on day n |
| Transpiration efficiency | M = accumulated biomass (g), T = accumulated water transpired (l) | |
| VPD | VPD = e*(T) × (1 − ) e*(T) = 0.611 × exp | e*(T) = saturated vapour pressure in kPa at a given temperature T = temperature (°C) RH = relative humidity (%) |
| FTSW | FTSW = (Wi − Wend)/W0 − Wend) | Wi = daily pot weight Wend = final day pot weight W0 = initial day pot weight |
| FTSW threshold | Region 1 (t) = , t1 ≤ t ≤ T1 Region 2 (t) = , T1 ≤ t ≤ t2 | Region 1 = regression line starting from the maximum FTSW to the breakpoint Region 2 = regression line starting from the break point to minimum FTSW y = transpiration of Phase I to Phase II x = FTSW T1 = transition or the breakpoint t1 = min(t), the minimum FTSW = 0 t2 = max(t), the maximum FTSW = 1.0 |
Table 3.
Soil water consumption through transpiration, water saved at FTSW threshold, and relative biomass production (%) of genotypes under water stress (WS).
Table 3.
Soil water consumption through transpiration, water saved at FTSW threshold, and relative biomass production (%) of genotypes under water stress (WS).
| Experimental Condition | Genotype | Soil Water Consumed until FTSW Threshold (mL) | Water Saved Compared to Highest Consuming Genotype (%) | Water Saved Compared to Highest Consuming Genotype (mL) | FTSW Threshold of WS Plants | Relative Biomass Production (%) of Genotypes under Water Stress (WS) |
|---|---|---|---|---|---|---|
| Low VPD (Exp 1) | Granola | 1378.4 a | 0.0 | 0.0 | 0.19 | 36.9 b |
| Diamant | 1262.5 ab | 9.2 | 115.9 | 0.22 | 66.2 a | |
| Cardinal | 1241.8 ab | 11.0 | 136.6 | 0.20 | 48.3 ab | |
| Desiree | 1217.6 ab | 13.2 | 160.8 | 0.27 | 56.1 ab | |
| Agria | 1129.9 ab | 22.0 | 248.5 | 0.28 | 52.5 ab | |
| Diego | 1097.0 ab | 25.7 | 281.4 | 0.36 | 58.1 ab | |
| Tosca | 993.1 b | 38.8 | 385.3 | 0.36 | 47.7 ab | |
| Average | 1188.6 | 17.1 | 189.8 | 0.27 | 52.3 | |
| Moderate VPD (Exp 2) | Diamant | 928.4 a | 0.0 | 0.0 | 0.24 | 58.6 ab |
| Desiree | 766.8 b | 21.1 | 161.6 | 0.24 | 50.2 b | |
| Cardinal | 755.1 b | 22.9 | 173.2 | 0.28 | 62.4 ab | |
| Caesar | 749.7 b | 23.8 | 178.7 | 0.31 | 79.5 a | |
| Mondial | 702.9 b | 32.1 | 225.5 | 0.24 | 54.4 b | |
| Farida | 650.0 b | 42.8 | 278.4 | 0.29 | 52.7 b | |
| Spunta | 645.9 b | 43.7 | 282.4 | 0.31 | 52.3 b | |
| Average | 742.7 | 26.6 | 185.7 | 0.27 | 58.6 | |
| High VPD (Exp 3) | Desiree | 1298.0 a | 0.0 | 0.0 | 0.19 | 70.3 b |
| Caesar | 1290.5 a | 0.6 | 7.6 | 0.21 | 91.0 a | |
| Spunta | 1234.9 a | 5.1 | 63.2 | 0.25 | 43.9 c | |
| Farida | 1001.6 b | 29.6 | 296.4 | 0.29 | 28.1 c | |
| Average | 1206.3 | 8.8 | 91.8 | 0.24 | 58.3 | |
Different letters indicate significant differences in means.
Disclaimer/Publisher’s Note: The statements, opinions and data contained in all publications are solely those of the individual author(s) and contributor(s) and not of MDPI and/or the editor(s). MDPI and/or the editor(s) disclaim responsibility for any injury to people or property resulting from any ideas, methods, instructions or products referred to in the content. |
© 2023 by the authors. Licensee MDPI, Basel, Switzerland. This article is an open access article distributed under the terms and conditions of the Creative Commons Attribution (CC BY) license (https://creativecommons.org/licenses/by/4.0/).
Share and Cite
MDPI and ACS Style
Salehi-Soghadi, Z.; Islam, M.S.; Manschadi, A.M.; Kaul, H.-P. Transpiration Efficiency of Some Potato Genotypes under Drought. Agronomy 2023, 13, 996. https://doi.org/10.3390/agronomy13040996
AMA Style
Salehi-Soghadi Z, Islam MS, Manschadi AM, Kaul H-P. Transpiration Efficiency of Some Potato Genotypes under Drought. Agronomy. 2023; 13(4):996. https://doi.org/10.3390/agronomy13040996
Chicago/Turabian StyleSalehi-Soghadi, Zohreh, Md. Saiful Islam, Ahmad M. Manschadi, and Hans-Peter Kaul. 2023. "Transpiration Efficiency of Some Potato Genotypes under Drought" Agronomy 13, no. 4: 996. https://doi.org/10.3390/agronomy13040996
Note that from the first issue of 2016, this journal uses article numbers instead of page numbers. See further details here.