Article

Effects of Sowing Date Variation on Winter Wheat Yield: Conclusions for Suitable Sowing Dates for High and Stable Yield

1
College of Resources and Environmental Sciences, China Agricultural University, Beijing 100193, China
2
Collaborative Innovation Center on Forecast and Evaluation of Meteorological Disasters (CIC-FEMD), Nanjing University of Information Science & Technology, Nanjing 210044, China
3
State Key Laboratory of Severe Weather, Chinese Academy of Meteorological Sciences, Beijing 100081, China
4
CMA-CAU Jointly Laboratory of Agriculture Addressing Climate Change, Beijing 100081, China
5
Hebei Gucheng Agricultural Meteorology National Observation and Research Station, Baoding 072656, China
6
Qianxinan Meteorological Bureau, Qianxinan Buyi and Miao Autonomous Prefecture 562499, China
*
Author to whom correspondence should be addressed.
Agronomy 2023, 13(4), 991; https://doi.org/10.3390/agronomy13040991
Submission received: 13 February 2023 / Revised: 16 March 2023 / Accepted: 23 March 2023 / Published: 28 March 2023
(This article belongs to the Section Farming Sustainability)

Abstract

:
Timely sowing and harvesting play important roles in agricultural production. The appropriate management decisions are necessary to cope with climate change and ensure high and stable crop yields. This study analyzed the effects of sowing date on the growth process of winter wheat and quantified the effects of climate resources and photothermal potential yield on theoretical yield at different stages of winter wheat. The analysis was based on the data from winter wheat interval sowing experiments conducted at the Hebei Gucheng Agricultural Meteorology National Observation and Research Station (Gucheng station) in north China (115°40′ E, 39°08′ N) during 2017–2019. The results showed that: (1) with the delay in sowing date, the growth process of winter wheat significantly advanced, the proportion of vegetative growth period significantly reduced (0.19% for per day delay), the proportion of reproductive growth period (RGP) significantly increased (0.12% for per day delay), and the prewintering light and temperature resources significantly reduced (12.2 °C·d accumulated temperature and 19.0 MJ·m−2 solar radiation for per day delay); (2) the theoretical yield of winter wheat showed a significant exponential relationship with the photothermal potential yield of the whole growth period: the minimum photothermal potential for yield formation was 26.6 t·ha−1, and the maximum theoretical yield was 12.6 t·ha−1; and (3) the wheat yield and yield stability were highest when the RGP photothermal potential yield was 16.0 t·ha−1 and the prewintering active accumulated temperature was 400 °C·d. This study also proposed a method to estimate the suitable sowing and harvesting dates to achieve high and stable yield of winter wheat, showing that the suitable sowing dates of winter wheat at Gucheng station from 1997 to 2021 ranged from 1 to 15 October, with no significant interannual variation; the suitable harvesting period ranged from 5 June to 10 July and showed a trend of gradual advance with the delay of the year. The results of the study provide a reference for sowing date adjustment of crops to adapt to climate change.

1. Introduction

Winter wheat is an important cereal worldwide, the leading crop in terms of planted area, total production, and total trade, providing about 20% of human caloric demand and thus playing a crucial role in ensuring food security [1,2]. China is the world’s largest wheat producer and consumer, with the North China Plain (NCP) producing more than 50% of the country’s wheat [3,4,5]. In the context of global climate change, the increasing intensity and frequency of extreme weather events, such as high- and low-temperature stresses, excess cloud cover and rain, drought, and floods [6,7,8,9], have had a significant impact on the agroecological environment as well as on crop growth, development, and yield [10]. In particular, the NCP, which is located in a monsoon climate zone, is highly influenced by interdecadal changes in the monsoon, experiencing high variability in climate elements such as light, temperature, and water [11]. The development progress, production potential, and use of climatic resources of winter wheat have been accordingly altered [12,13,14]. Moreover, numerous studies have shown that climate change has an overall negative effect on wheat yield [15,16,17,18,19]. In light of this situation, the scientific adjustment of sowing and harvesting dates is an effective way for those in wheat production to make rational use of light and thermal resources; cultivate strong prewintering seedlings; prevent winter and spring frost damage, late lodging, and premature senescence; and ensure stable and high yield [20,21].
The late sowing of wheat has become a widely used measure to cope with climate change and improve crop yield [4,22] in the NCP, where thermal resources are abundant [23]. The actual sowing date of wheat in north NCP has been delayed to about 10 October. It was found that under water-limited irrigation, late sowing and increased density could improve the water use efficiency of wheat; late sowing could also improve the winter wheat resistance to lodging while maintaining grain yield and nitrogen use efficiency [24]. Meanwhile, the late sowing of winter wheat can also suppress excessive prewintering tillering, reduce the density of wheat, and rationalize the crop population to avoid vigorous growth in winter, which can effectively prevent the wheat yield reduction caused by frost damage [25]. However, it has also been suggested that delayed sowing increases the exposure of the wheat to high temperatures during the filling period, i.e., “terminal heat”, which is detrimental to leaf photosynthesis, filling, and ultimate yield formation [26]. In addition, excessive late sowing exposed winter wheat to adverse weather factors during the sowing-wintering period, such as lower average daily temperatures, reduced solar radiation, and active accumulated temperature, resulting in a 1% decrease in winter wheat yield per day delay in sowing dates [27]. Therefore, it remains to be explored whether the current general sowing date in the field is appropriate and how the suitable sowing dates for winter wheat in the region should be determined.
Based on the literature, we used the data from winter wheat interval sowing experiments during 2017–2019 at the Hebei Gucheng Agricultural Meteorology National Observation and Research Station to determine the key sowing date for high and stable yield of winter wheat and to systematically address climate change. The objectives of this study were: (i) to clarify the effects of sowing date on the growth and development process of winter wheat; (ii) to reveal the effects of sowing date on wheat yield and identify the reasons using climatic resources and yield potential; and (iii) to determine the optimal sowing and harvesting dates for high and stable yield of winter wheat.

2. Materials and Methods
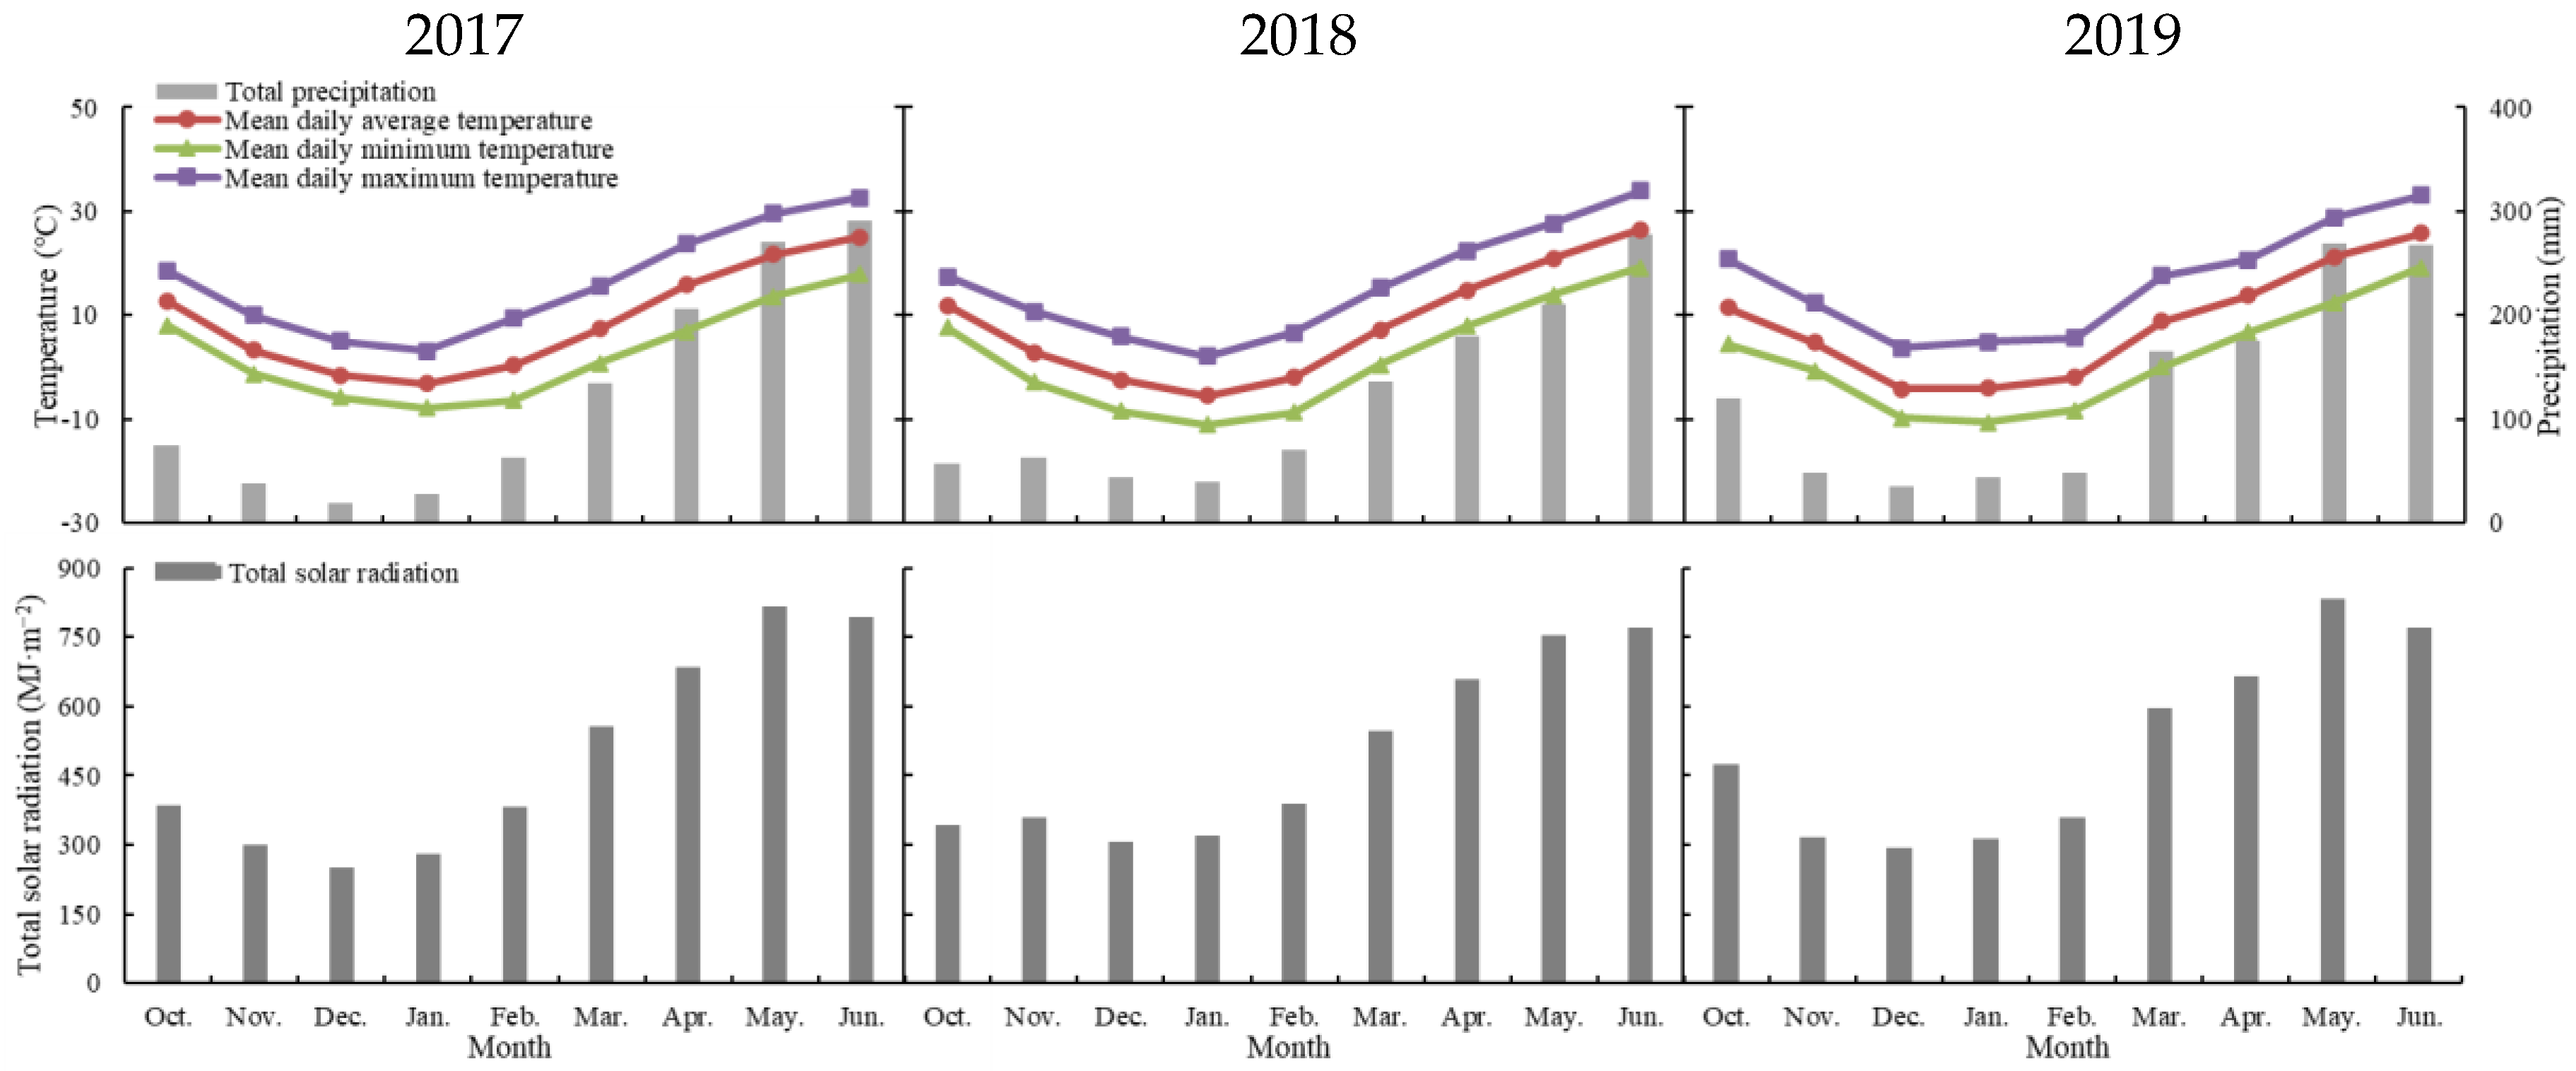
2.1. Study Region

The winter wheat interval sowing date experiments were conducted in 2017–2019 at the Hebei Gucheng Agricultural Meteorology National Observation and Research Station (Gucheng station) (39°08′ N, 115°40′ E, 15.2 m a.s.l.). The experimental station is operated and maintained by the China Meteorological Administration located in Baoding city, Hebei province, north China. The climate is dominated by warm temperate continental monsoons with hot, rainy summers and dry, cold winters. The average annual temperature and total sunshine hours are 12.2 °C and 2403.6 h, respectively. The annual total precipitation is 501.9 mm, of which the summer precipitation accounts for 70%, with the most precipitation falling in July (about 150 mm). The terrain is flat, and the experimental field has sandy loam soil with a bulk density of 1.37 g·cm−3, a field capacity of 22.7%, and a wilting coefficient of 5% at a depth of 50 cm. The pH value of the 0–50 cm soil layer is 8.19. The contents of soil organic carbon, total nitrogen, available phosphorus, and available potassium are 3.67 g·kg−1, 0.87 g·kg−1, 25.76 mg·kg−1, and 118.55 mg·kg−1, respectively [28,29]. Winter wheat–summer maize rotation is the dominant double-cropping system in the NCP.
The meteorological data used in this study were obtained from the automatic meteorological observation station in Gucheng station and included daily minimum temperature (°C), maximum temperature (°C), average temperature (°C), precipitation (mm), and sunshine hours (h) during 1997–2021. The monthly changes in temperature, total precipitation, and total solar radiation at Gucheng station during the experimental period are detailed in Figure 1.

2.2. Experimental Design

The winter wheat variety selected for the experiment was Tanmai-98, a semiwinter variety with good cold resistance, fast jointing growth after greening, strong tillering ability, sturdy stalks, and strong lodging resistance, which is widely planted in Hebei and Shandong provinces. The whole growth period of Tanmai-98 is about 238 days, and the suitable sowing period is early to mid-October, with an average yield of about 11.0 t·ha−1 [30]. Based on the actual sowing date of 10 October in the local field, four sowing dates of 10-day advance (D1), normal sowing date (D2), 10-day delay (D3), and 20-day delay (D4) were set for the interval sowing trial. There were 4 replications per treatment and 16 plots in total. The distribution of plots was designed using a standard Latin square, with a plot area of 30 m2 and a 0.5 m protection interval between plots. The total area of the experimental field was about 600 m2. The trial plots were level and were without significant shade, and wheat was also planted on the periphery of the plots to avoid the influence of the farmland microclimate. The sowing rate of winter wheat was 150 kg·ha−1 on each sowing date. Field management, including irrigation and fertilization, was consistent with local agricultural practices. Fertilizers were the same for all treatments. Chemical fertilizers were applied before cultivation of winter wheat at a base rate of 120 kg·ha−1 for N and 90 kg·ha−1 for P. An additional 120 kg·ha−1 N as urea was applied at the beginning of jointing. Depending on seasonal rainfall, three to five irrigation applications were applied to winter wheat in addition to the presowing irrigation. Insects and diseases were controlled by pesticides to avoid biomass and yield losses.

2.3. Measurements and Calculations

2.3.1. Wheat Measurements

The observation method for development progress was the parallel observation method, in which the prevalent dates of each developmental stage of winter wheat were recorded: seedling, wintering, green returning, jointing, heading, flowering, and harvesting. Plant samples of 1.0 m2 in each plot were randomly selected during the harvesting period for measuring the yield factors: spike number, spikelet number, infertile spikelet number, kernels per spike, and thousand kernel weight.

2.3.2. Total Solar Radiation

The total solar radiation during the growth period of winter wheat was obtained by accumulating the daily solar radiation Q (MJ·m−2) [31]:
Q = Q 0 ( a + b n N ) ,
Q 0 = T I 0 ρ 2 ω sin μ sin δ + cos φ cos δ sin ω ,
where n is the actual sunshine duration (h); N is the maximum possible sunshine duration (h); a and b are empirical coefficients related to the geographical location and atmospheric quality, respectively, representing the proportion of extraterrestrial radiation reaching the earth on overcast days. Previous studies reported a and b values of 0.143 and 0.585 in eastern China and 0.185 and 0.595 in western China, respectively [31]. Because the Gucheng station is in the eastern part of China, the values of a and b in this study were selected as 0.143 and 0.585, respectively. Q0 is the astronomical radiation (MJ·m−2); T is the number of times in a daily cycle, taking 24 × 60 min; I0 is the solar constant (0.082 MJ·m−2·min−1); ρ−2 is the revised coefficient of the Earth’s orbital eccentricity; μ is the latitude (rad); δ is the solar declination (rad); and ω is the sunset hour angle (rad) [31,32,33].

2.3.3. Active Accumulated Temperature

Active accumulated temperature (ATT, unit °C) is an effective parameter for describing the thermal condition for crop growth, which has been widely applied in studying crop physiological ecology. In this study, the ATT during the different growth stages was calculated as follows [34]:
ATT = T i ,   for   T i 0 ,
where T i is the daily average air temperature on day i of a growth stage.

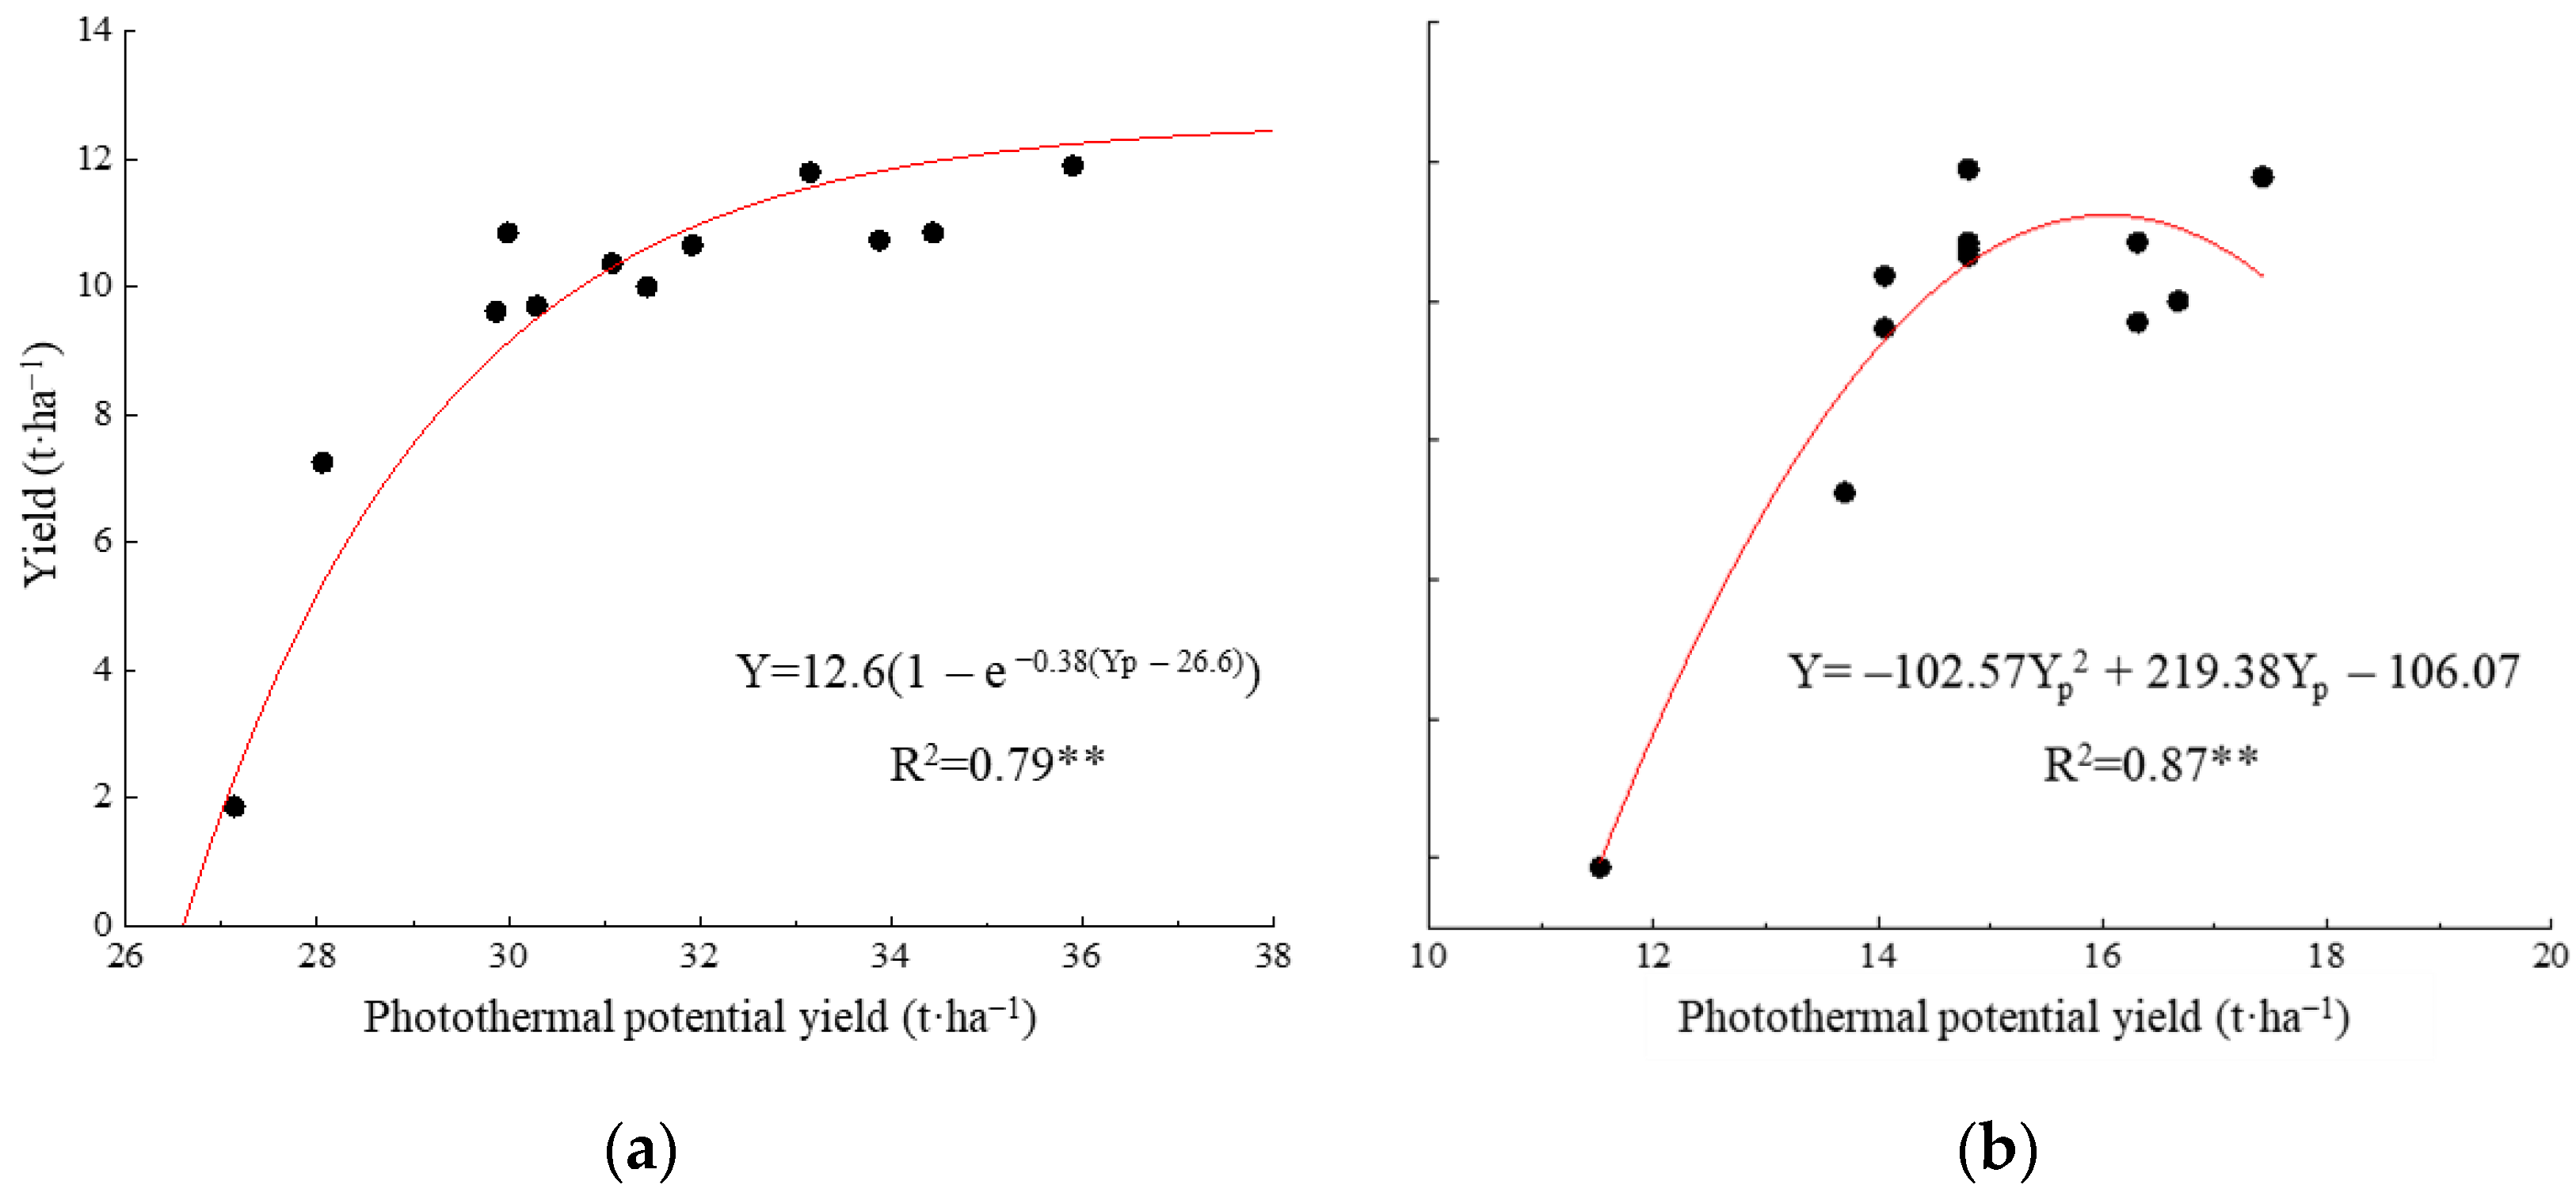
2.3.4. Photothermal Potential Yield

The photothermal potential yield is defined as the upper yield limit determined by the combination of total solar radiation and temperature when the conditions of moisture, soil conditions, and agricultural facilities are optimal. The photothermal potential yield (YT, t·ha−1) was calculated by the stepwise correction method, which is recommended by the Food and Agriculture Organization of the United Nations (FAO) and has been widely used. From the perspective of energy conversion, the temperature, solar radiation, and other meteorological factors were taken into account, and the photothermal potential yield as corrected by temperature to calculate crop potential yield [35,36,37]:
YT = YQ   ×   f   ( t ) ,
YQ = Q · E · α · β · φ · ( 1 ε ) ( 1 ζ ) ( 1 μ ) ( 1 η ) ( 1 γ ) · ( 1 k ) 1 ( 1 λ ) 1 H 1 ,
f t = 0 t < t min , t > t max t t min t s t min t min t < t s t max t t max t s t s t t max ,
where YQ is the photosynthetic potential yield (t·ha−1); E is the harvest index; α is the absorption rate of photosynthetically effective radiation by the crop; β is the ratio of photosynthetically effective radiation; φ is the quantum conversion efficiency of photosynthesis; ε and ζ are the reflectance and leakage rate of the crop population, respectively; μ is the ineffective absorption rate of solar radiation by the nonphotosynthetic organs of the crop; η is the proportion of light above the light saturation point; γ is the ratio of respiration loss of photosynthetic products; k is the water content of the mature crop; λ is the ash content of the crop; and H is the energy conversion coefficient (MJ·kg−1). The specific parameter values are shown in Table 1 [35,36,37]. f(t) is the temperature stress coefficient, with values in 0–1 and is calculated by Equation (6) [38], where t is the average temperature (°C) in a certain growth period of winter wheat; tmin, ts, and tmax are the minimum, optimum, and maximum temperature (°C) for each growth period, respectively, and are listed in Table 2 [35].

2.3.5. Stable Yield Index

Yield stability refers to the magnitude of deviation of crop yield from year to year from the standard value. In this study, the coefficient of variation (CV) of yield was used as an indicator of yield stability, where the larger the CV, the greater the degree of yield fluctuation [39]:
C V = S Y ,
where CV is the coefficient of variation of winter wheat yield; S is the standard deviation of yield; Y is the mean of yield.

2.3.6. Annual Wintering Date

The daily mean temperature stable below 0 °C was taken as a sign that the above-ground part of winter wheat plants basically stopped growing and entered the wintering stage. The five-day sliding average method was used to calculate the period when the daily mean temperature was stable below 0 °C. Generally, there are two long such periods in the area where Gucheng station is located each year: the first is at the beginning of the year, and the second is at the end of the year. The beginning date of the second period is the beginning of the wintering stage, and the end date of the first period is the end of the wintering stage [40].

2.4. Data Analysis

Linear regression was used to analyze the relationship between the variation in sowing date and the proportion of growth period of wheat and the variation trend in the suitable harvesting date of wheat; exponential regression was used to analyze the relationship between wheat yield and the photothermal potential yield of the whole growth period; and quadratic regression was used to analyze the relationship between wheat yield and sowing date, active accumulated temperature, and stage photothermal potential yield. Statistical analysis was performed using Microsoft Excel 365, and IBM SPSS Statistics 26. MATLAB R2020a of the MathWorks was used to calculate the winter wheat wintering period and the suitable sowing and harvesting dates in 1997–2021.

3. Results

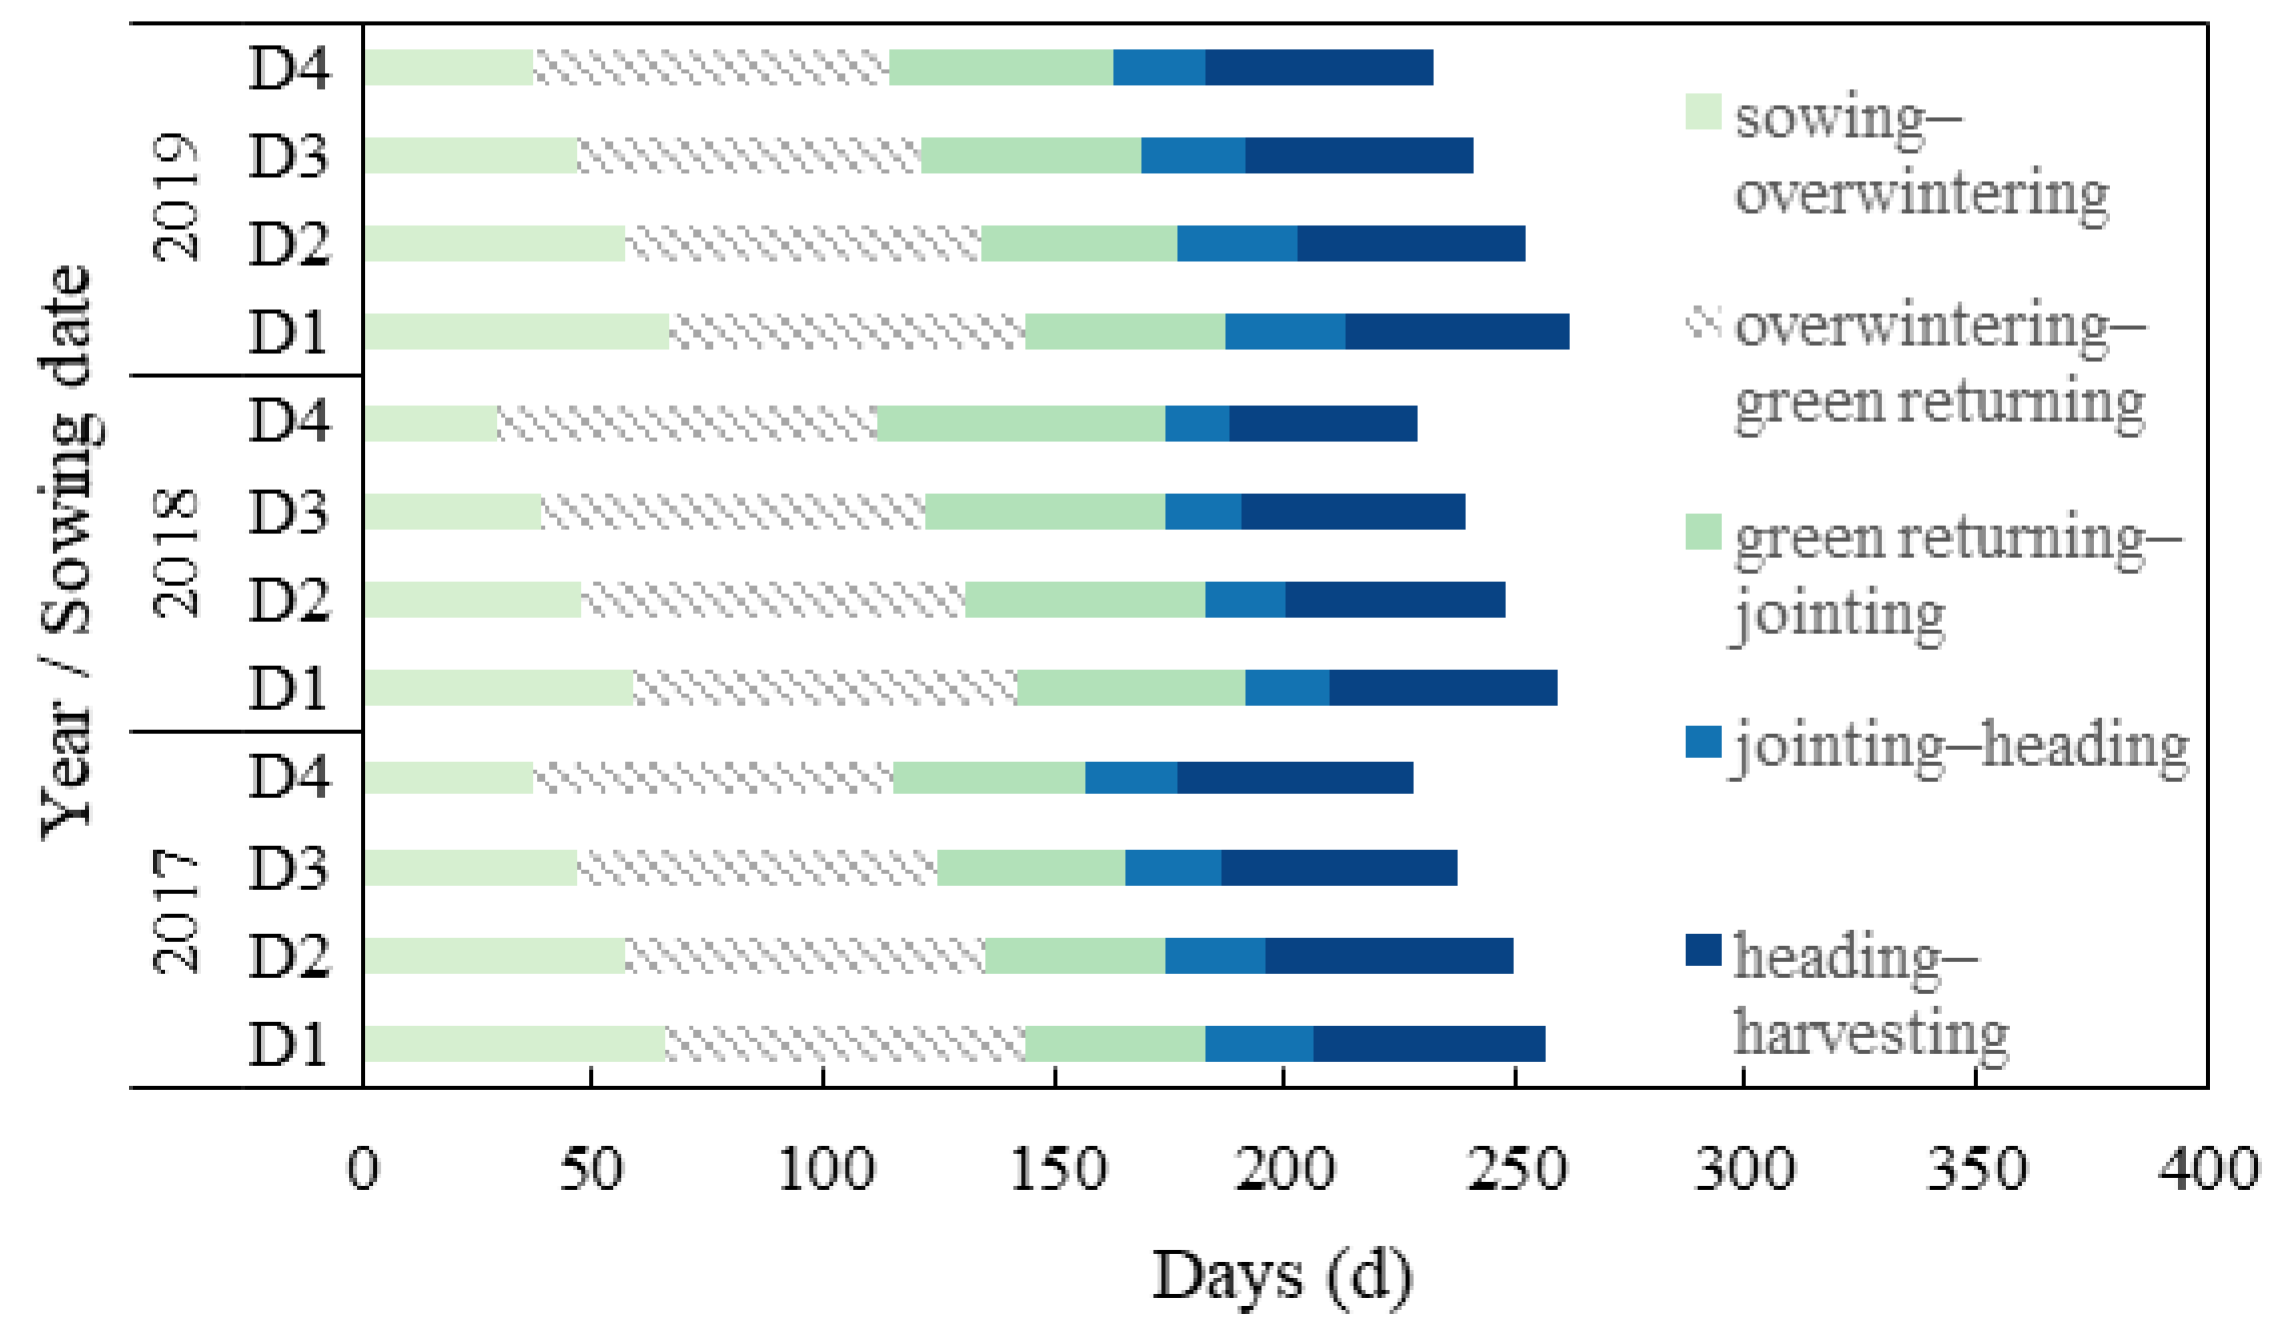
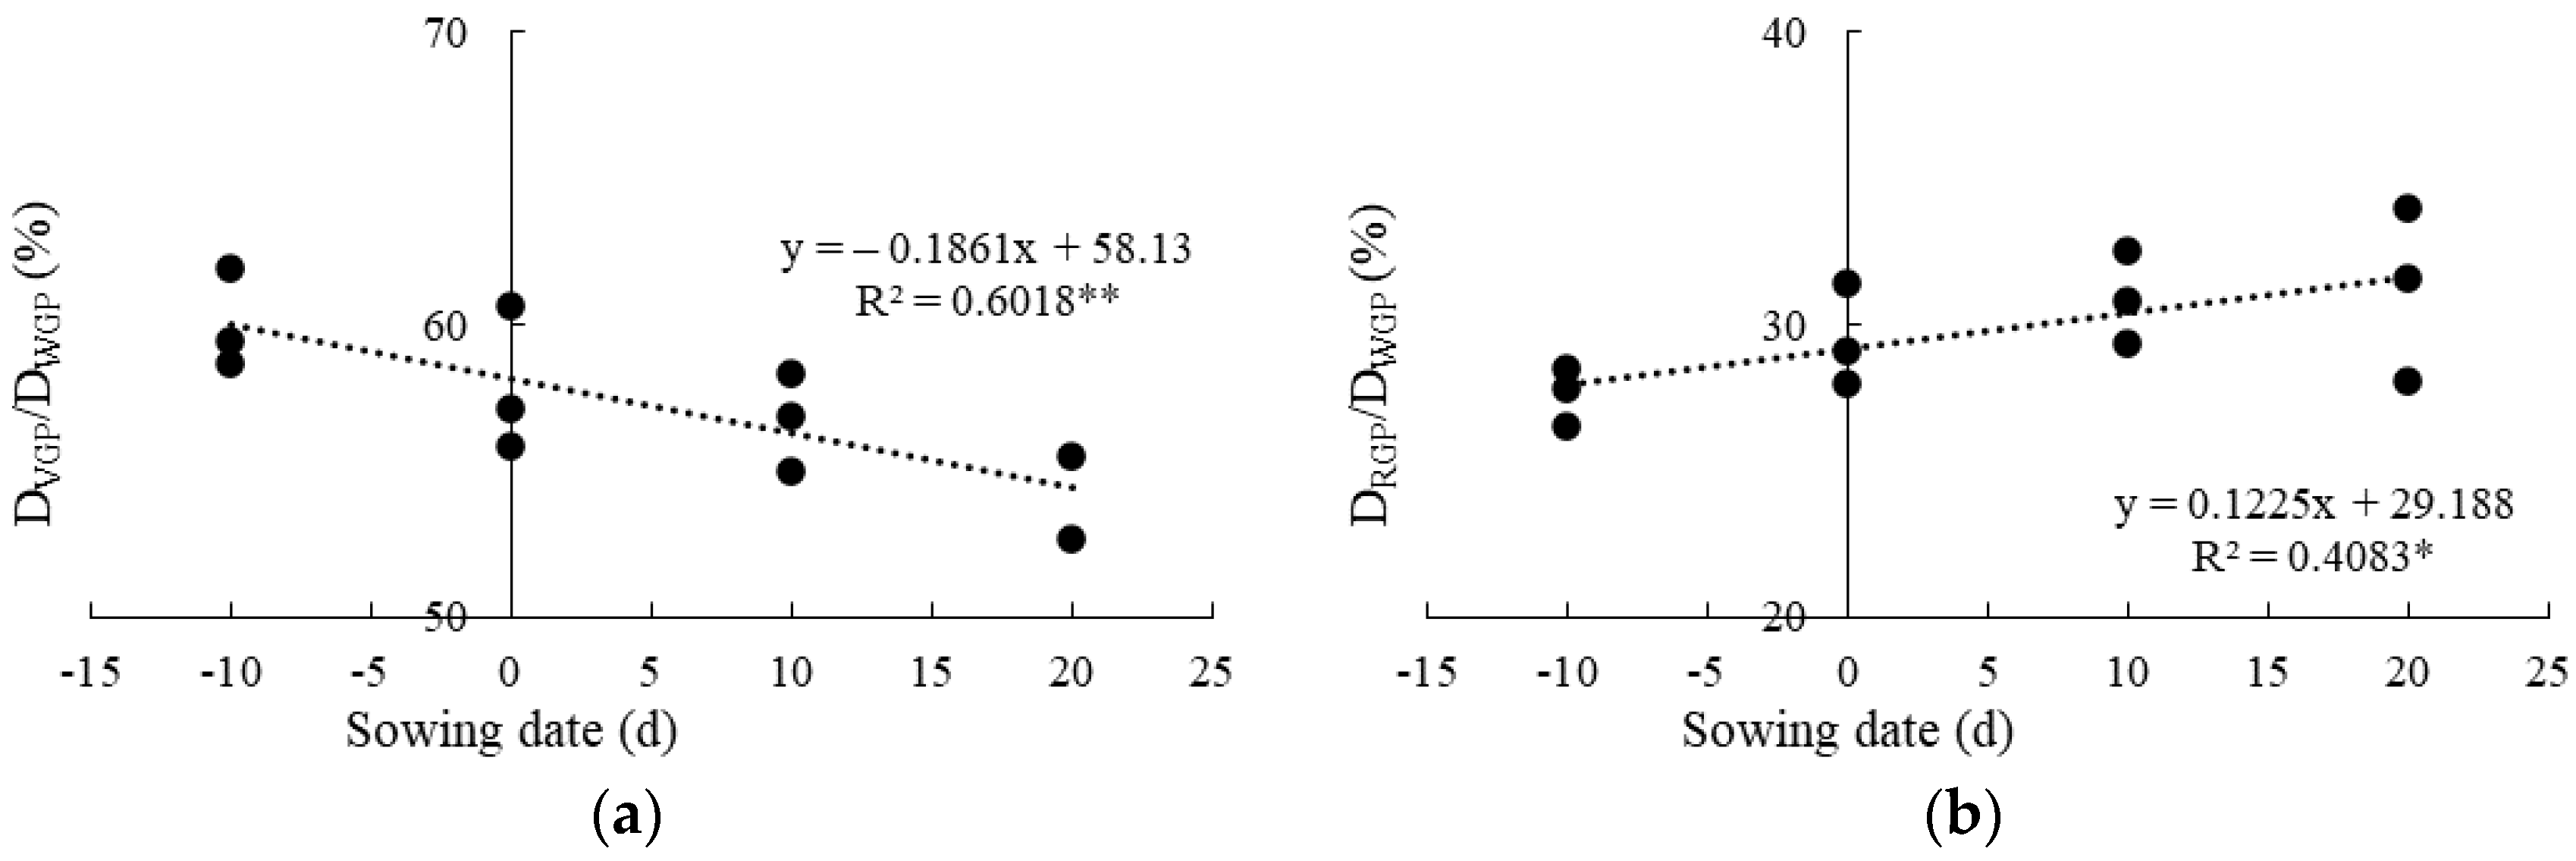
3.1. Response of Winter Wheat Development to Variation in Sowing Date

Delayed sowing dates caused a significant shortening trend (p < 0.05) in the length of the whole growth period (WGP) of winter wheat at Gucheng station during 2017–2019. For per-day delay in sowing date, the length of the WGP shortened by 0.86 d (Figure 2). In contrast, there was no substantial difference in the length of winter wheat WGP between the years with the same sowing date. In the 10-day delay and 20-day delay sowing date treatments, the length of the sowing–wintering period was significantly shortened, and the average daily temperature accordingly decreased. This meant that the tiller stage and the trifoliate stage could not be entered before wintering. To compensate for the unfinished growth period before wintering, the number of days of the green returning–jointing period in the delayed sowing dates group increased, being 2–6 d more than that of the 10-day advance and the normal sowing dates groups. In addition, winter wheat was impacted by frost damage in the 20-day delay sowing date treatment in 2018, so is not considered here. The wintering and green returning dates were basically the same for the different sowing dates in the same year. Moreover, owing to the higher temperature in the after-wintering period, the growth and development rates of winter wheat were accelerated, and the dates that each developmental stage was reached gradually converged among the different sowing dates.
The proportion of the wheat sowing–jointing period, i.e., the vegetative growth period (VGP) to the WGP, significantly decreased with sowing date delay, with an average decrease of 0.19% per day (p < 0.05). By contrast, the proportion of heading–harvesting, i.e., the reproductive growth period (RGP) to the WGP, significantly increased with sowing delay, with an average increase of 0.12% per day (p < 0.05). The wintering–green returning periods were not considered when calculating the proportions. This indicated that sowing date significantly altered the distribution of vegetative and reproductive growth periods in winter wheat by reducing or increasing the length of different developmental stages (Figure 3).

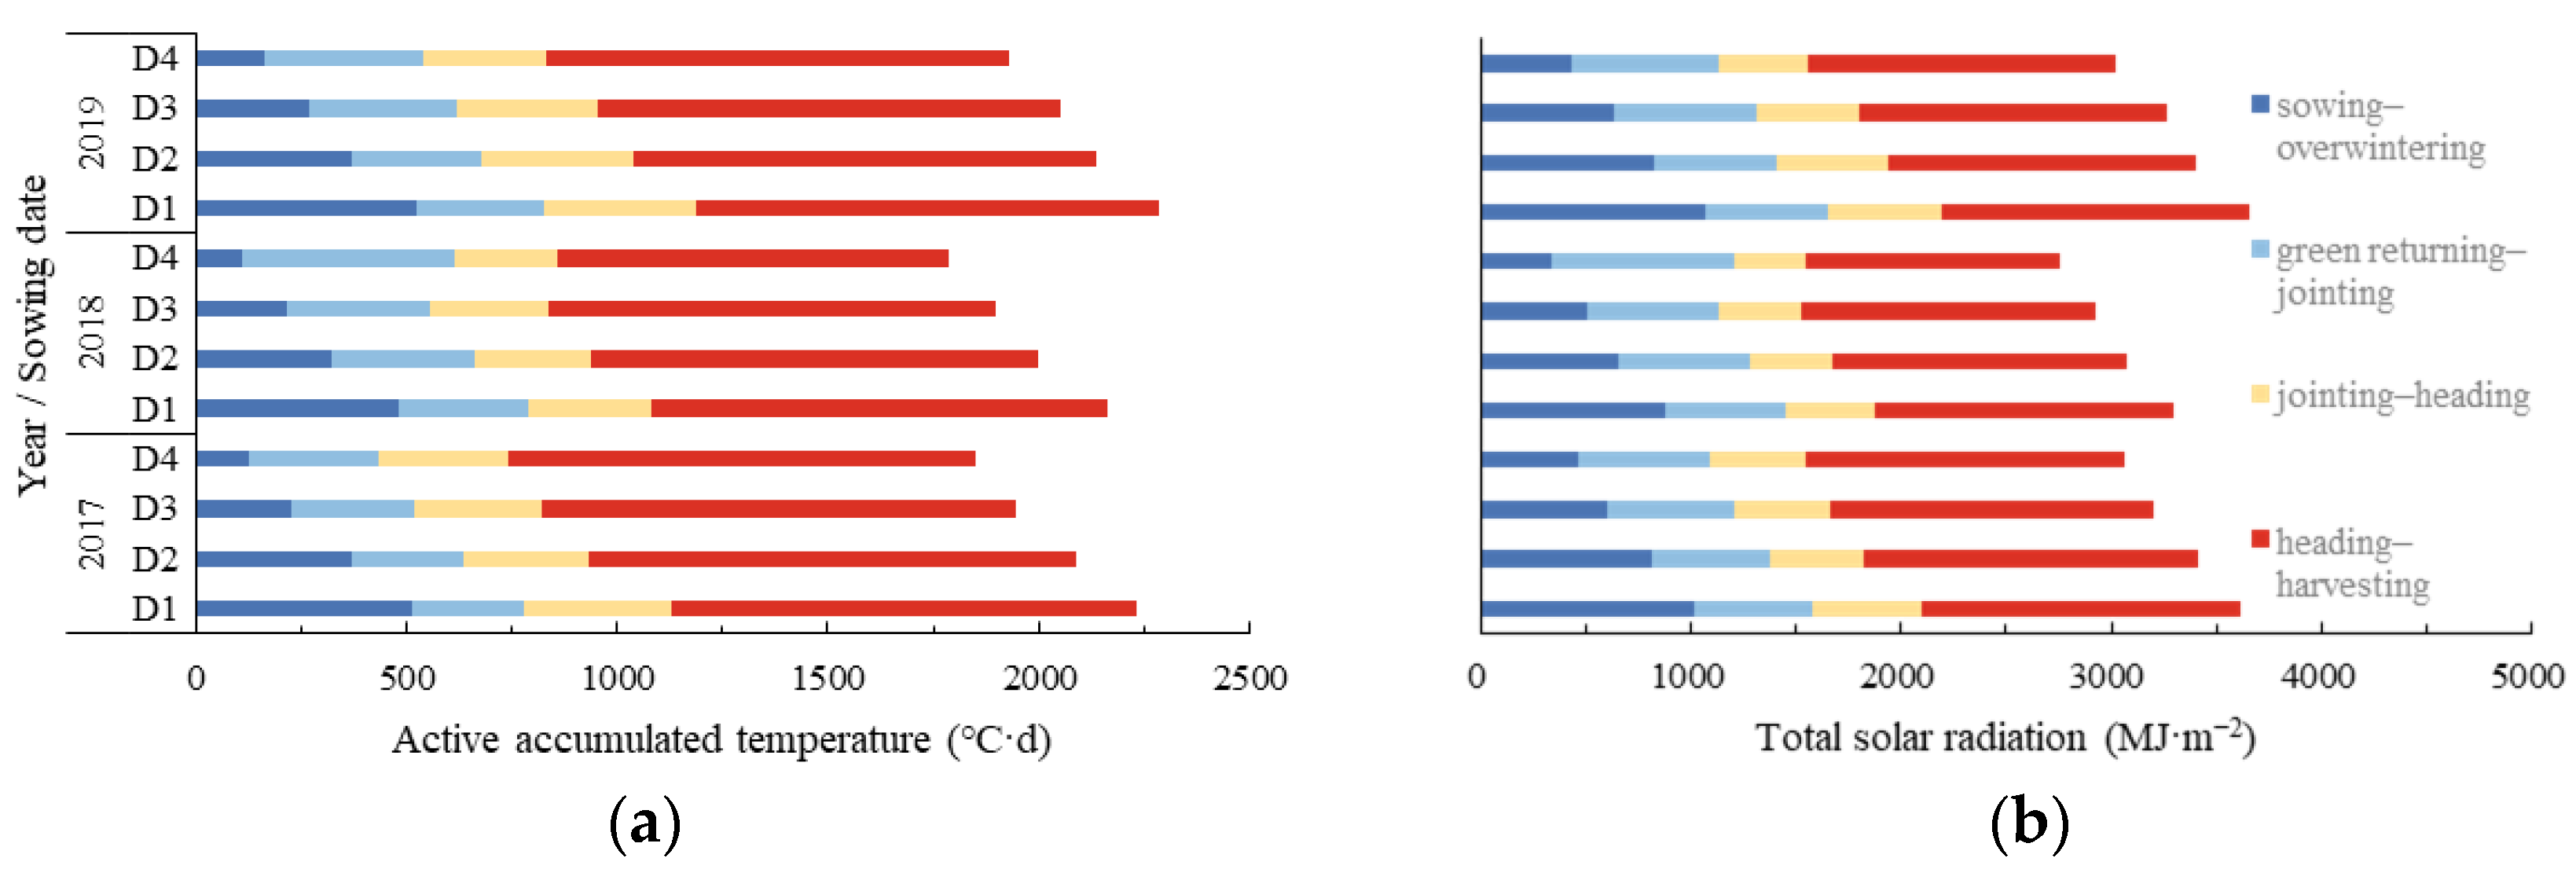
3.2. Response of Climatic Resources during the Developmental Stages of Winter Wheat to Variation in Sowing Date

Temperature and light are essential for plant growth and development. Based on this consideration, we combined meteorological data from the Gucheng station and the data concerning the development progress of winter wheat to clarify the characteristics of the change in the active accumulated temperature and solar radiation resources for different developmental stages (Figure 4). In this experiment, irrigation was used to ensure that the growth of winter wheat was not affected by moisture; thus, the variation in precipitation was not analyzed. As clearly demonstrated in the figure, the active accumulated temperature during the winter wheat WGP at different sowing dates ranged from 1788.6 to 2287.5 °C·d, and the total solar radiation ranged from 2922.8 to 3657.5 MJ·m−2. The active accumulated temperature and total solar radiation of winter wheat significantly decreased with the delay of sowing, with average reductions of 12.2 °C·d and 19.0 MJ·m−2 for each day of delay, respectively. Among the reductions, the largest reduction occurred in the sowing–wintering stages, where the active accumulated temperature (solar radiation) decreased from 506.8 °C·d (988.9 MJ·m−2) for a 10-day advance in sowing date to 135.0 °C·d (413.5 MJ·m−2) for a 20-day delay in sowing date. Therefore, the sowing dates changes had a marked impact on the climatic resources in the sowing–wintering stages of winter wheat.

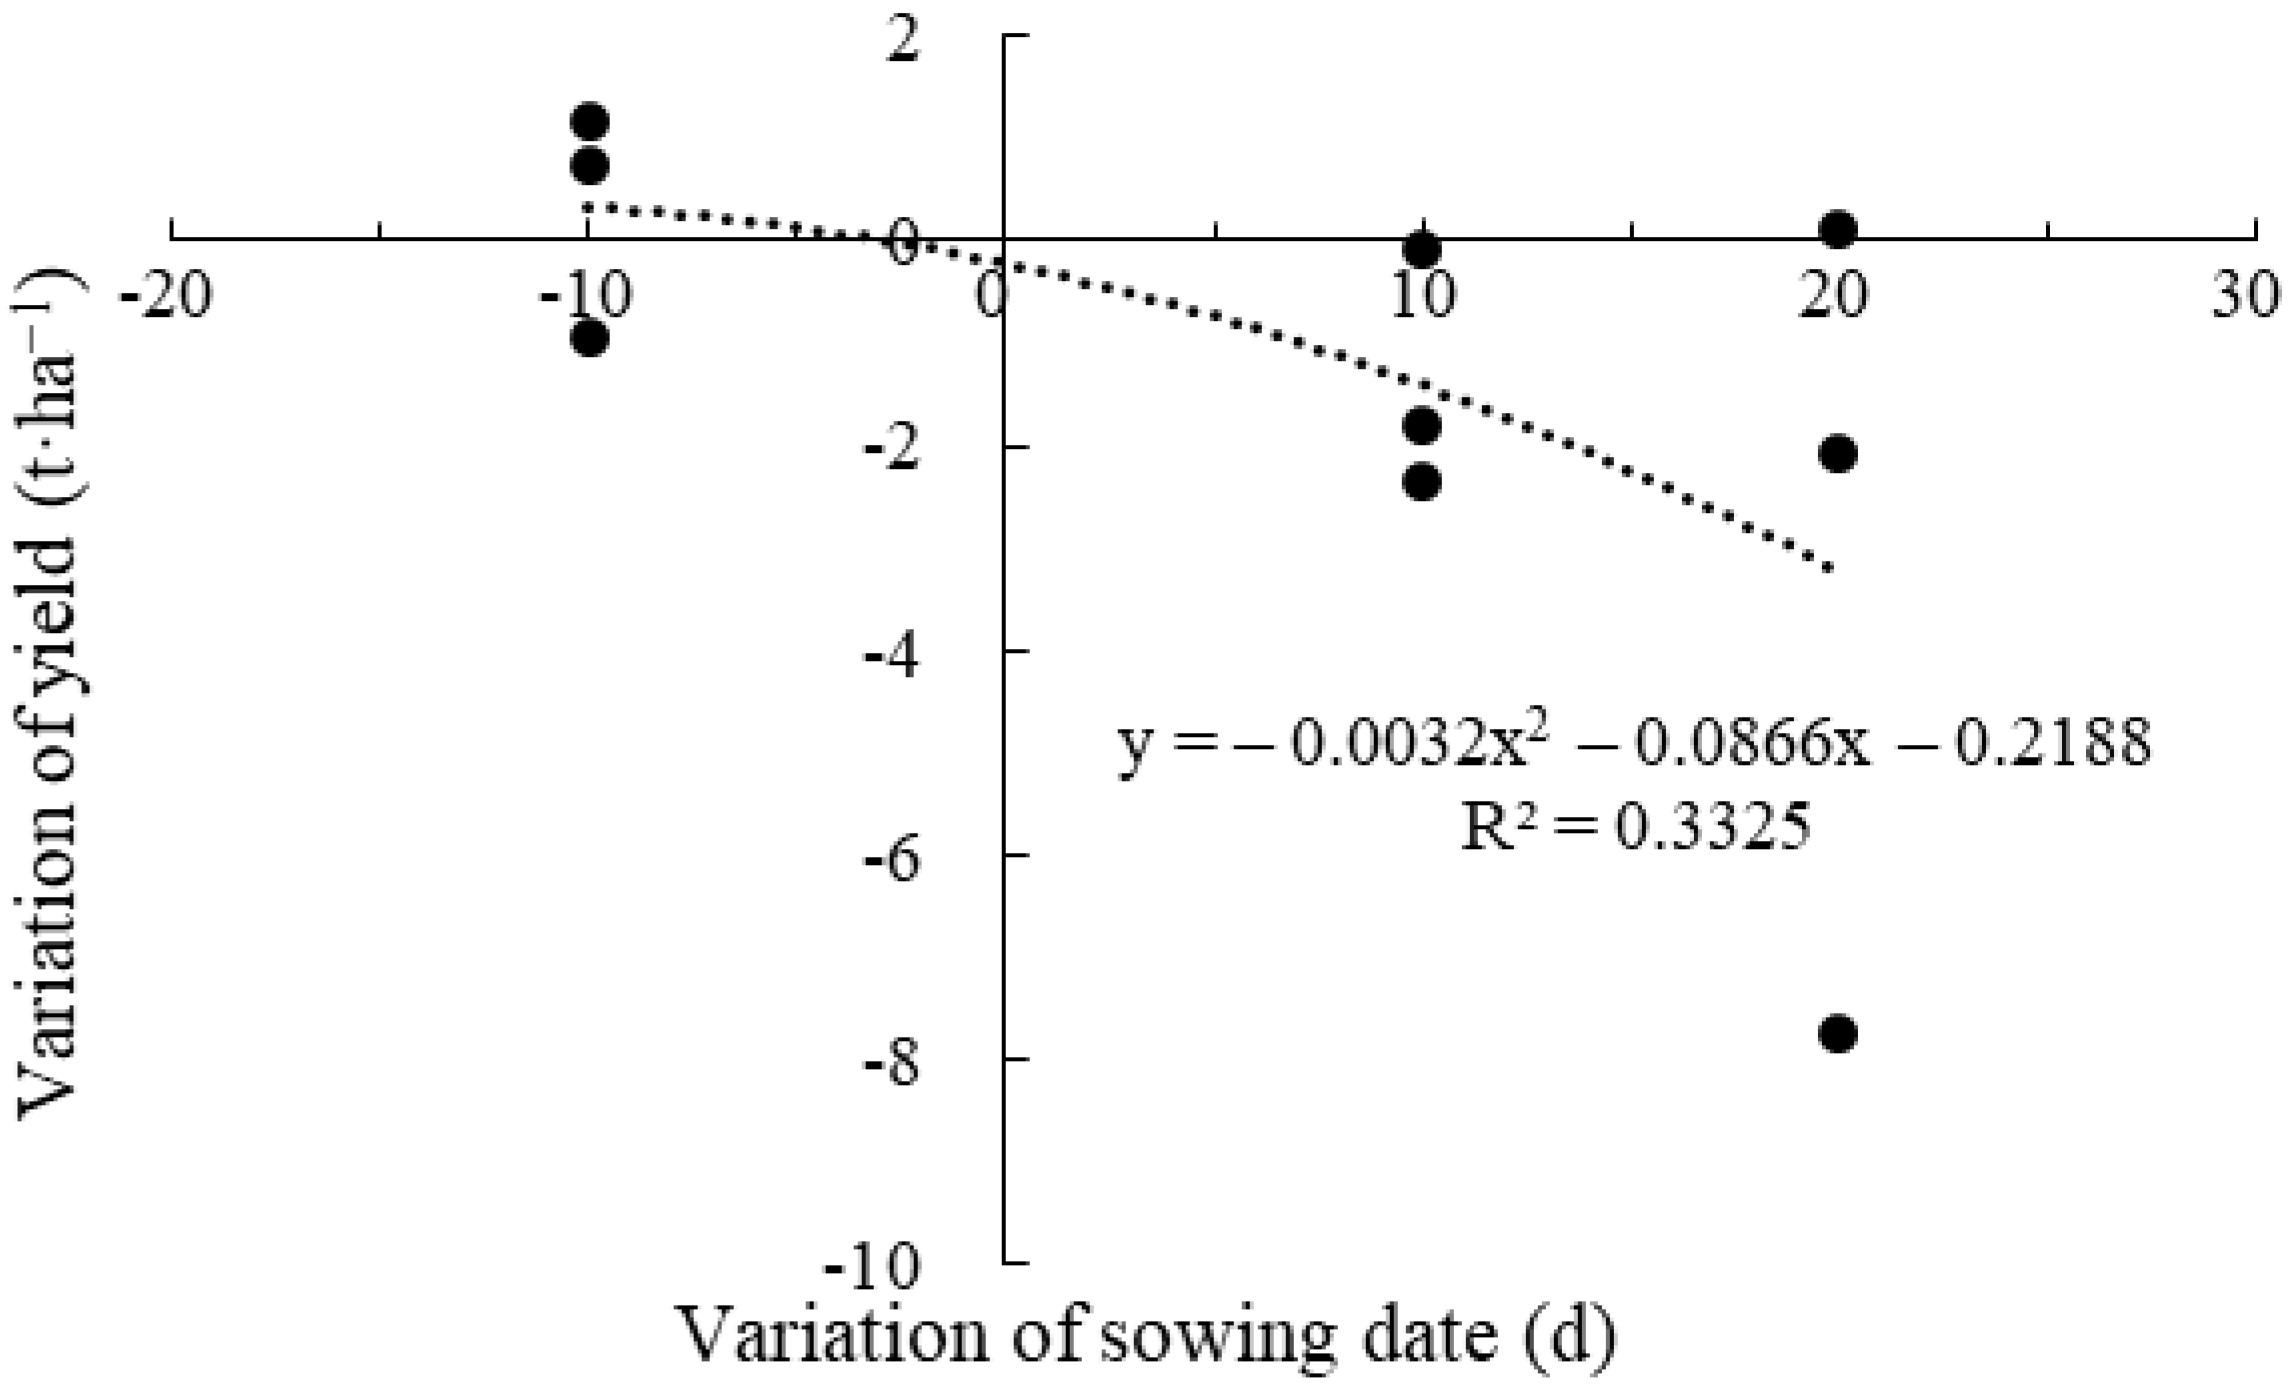
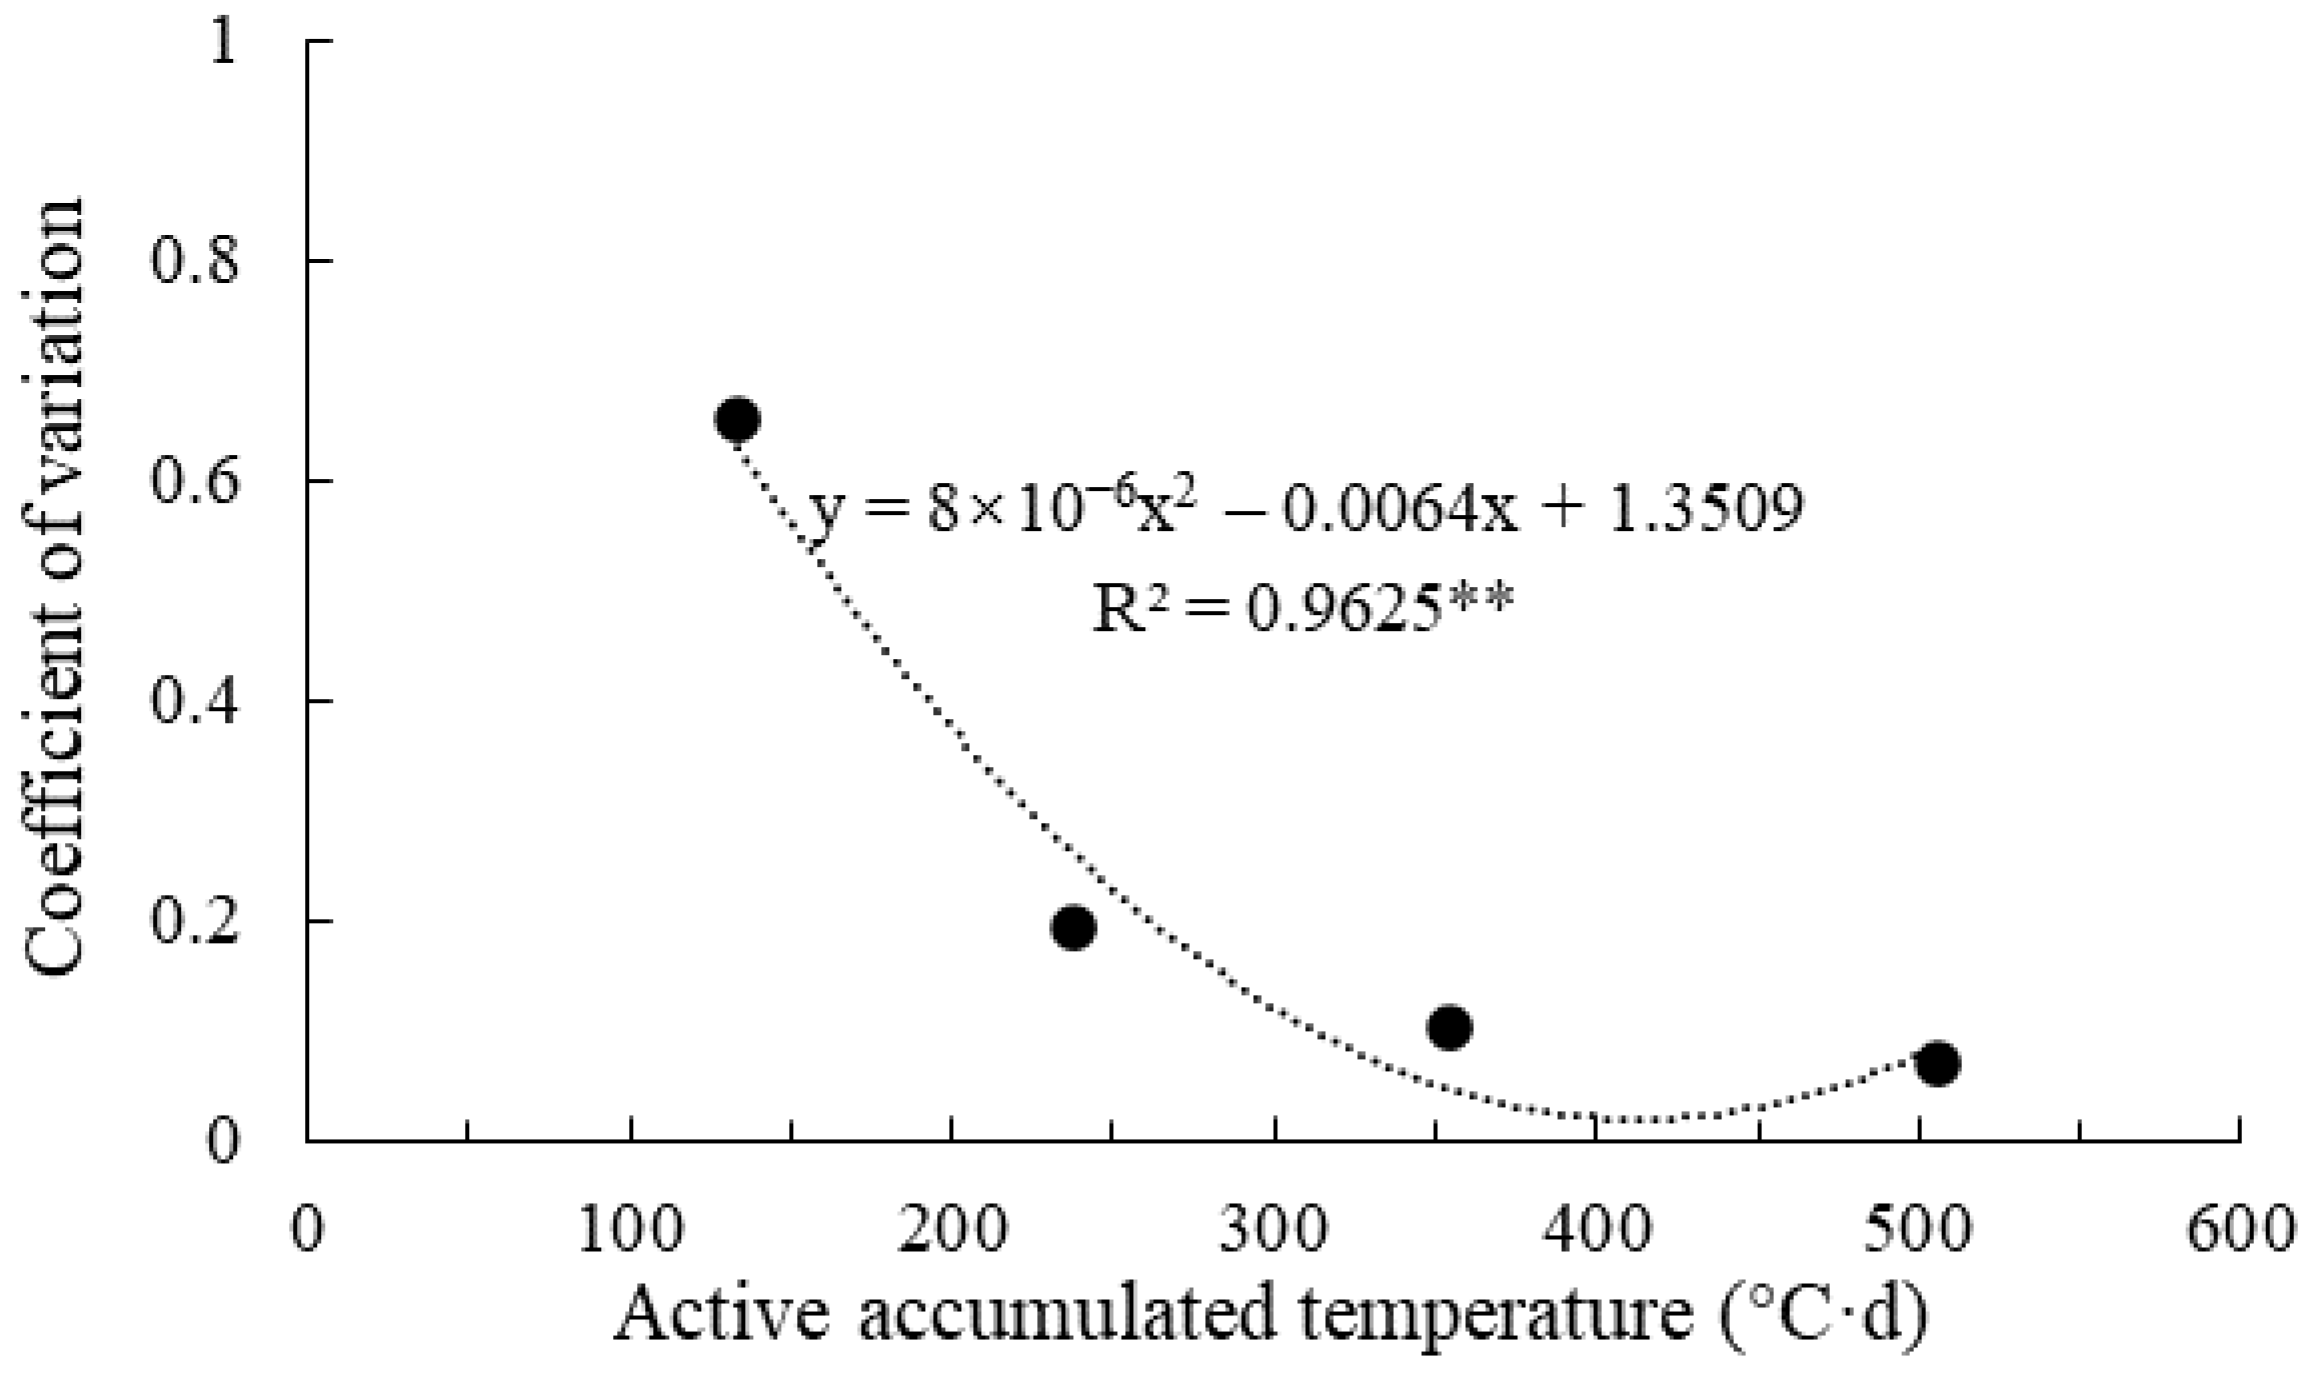
3.3. Response of Winter Wheat Yield to Variation in Sowing Date

The average yields of winter wheat under 10-day advance, normal, 10-day delay, and 20-day delay sowing dates in 2017–2019 were 11.0, 10.7, 9.3, and 7.5 t·ha−1, respectively (Figure 5). On the whole, sowing date had a significant effect on yield, with early sowing having a positive effect on yield and delayed sowing having a negative effect on yield. The variability in winter wheat yield increased with sowing date delay, i.e., the yield instability increased. The CV values of yield for winter wheat under 10-day advance, normal, 10-day delay, and 20-day delay sowing dates were 0.07, 0.10, 0.19, and 0.65, respectively. To identify the reasons behind such variation, we further analyzed the relationship between yield CV and climatic resources during the growth periods. The yield CV of winter wheat was significantly correlated with the prewintering active accumulated temperature, showing a significant quadratic term. When the prewintering active accumulated temperature was less than 400 °C·d, the higher the active accumulated temperature, the smaller the yield CV; when the active accumulated temperature reached 400 °C·d, the yield CV was the smallest (Figure 6). Consequently, the sowing date influenced the stability of yield by changing the heat resources in the prewintering period of winter wheat.
Photothermal potential yield can better reflect the upper limit of crop yield under current climatic resources and cultivation management practices [41]. Our analysis of the relationship between winter wheat yield and photothermal potential yield at different developmental stages showed that there was a significant exponential relationship between winter wheat yield and the photothermal potential yield of the WGP. The analysis indicated that the predicted peak winter wheat yield was 12.6 t·ha−1 under current cultivation management practices, and the photothermal potential yield of 26.6 t·ha−1 was the minimum requirement to meet yield formation (Figure 7a). Meanwhile, the photothermal potential yield during the RGP of winter wheat showed a significant quadratic relationship with yield, reaching a maximum at 16.0 t·ha−1 of the photothermal potential yield (Figure 7b).

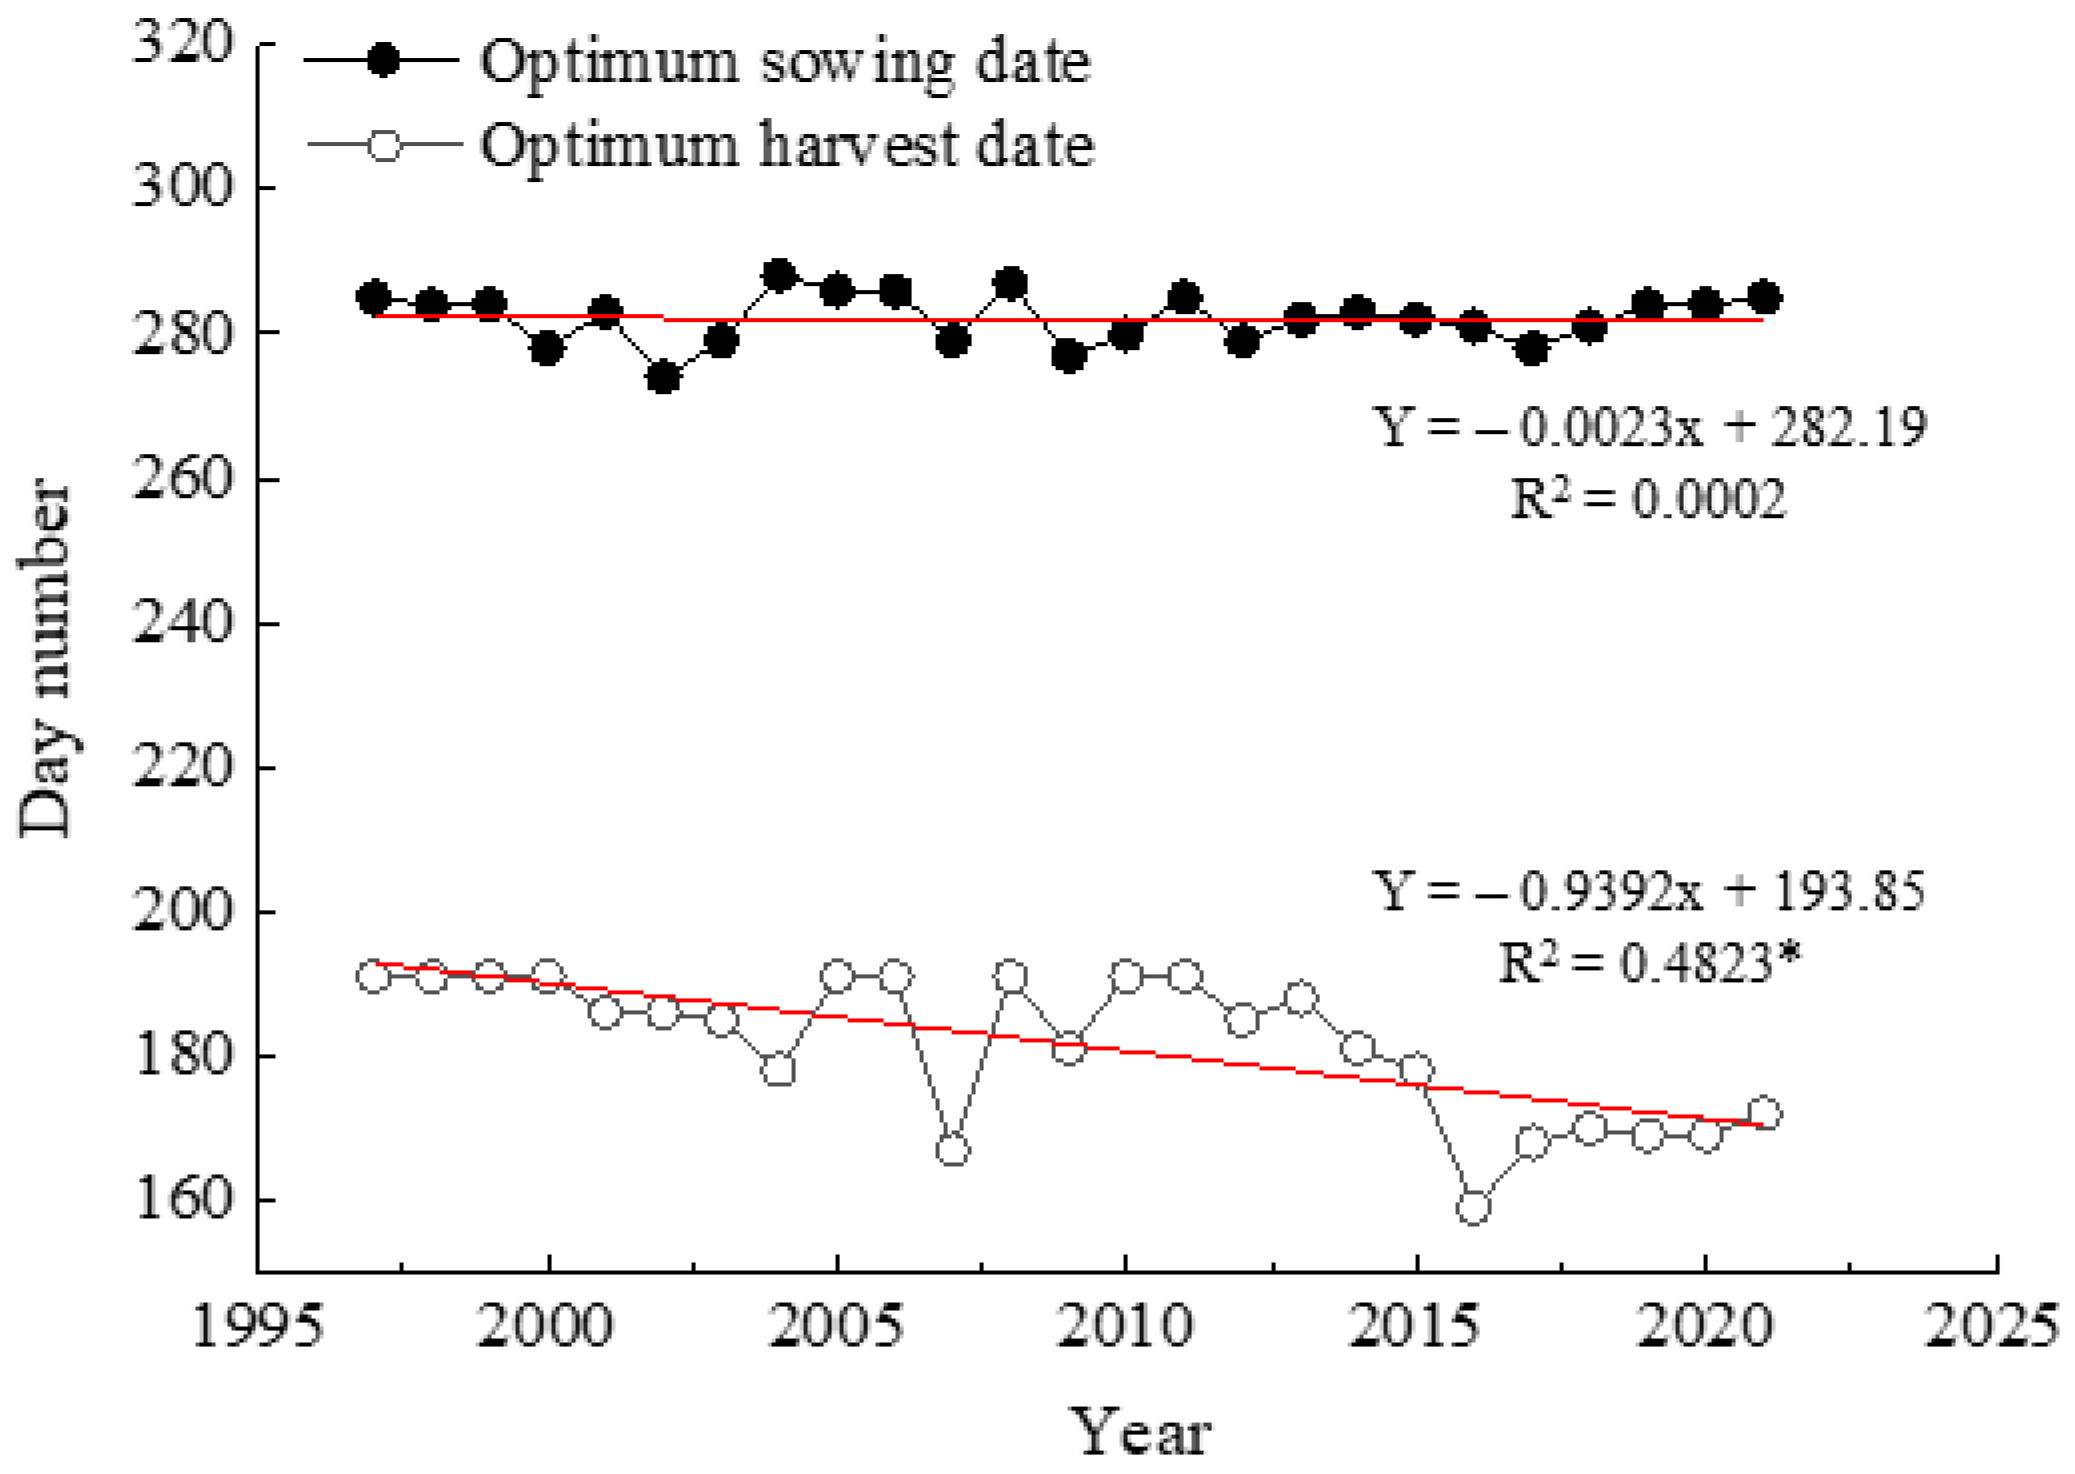
3.4. Analysis of the Optimum Sowing and Harvesting Dates of Winter Wheat

From the above results, the sowing date affected the winter wheat yield and its stability by changing the prewintering accumulated temperature and the photothermal potential yield during the RGP. To this end, the historical meteorological data of Gucheng station in 1997–2021 were used to estimate the appropriate sowing and harvesting dates to ensure the high and stable yield of winter wheat. First, the wintering and green returning dates of winter wheat each year were determined; we then extrapolated forward from the beginning of the wintering date, the date when the prewintering active accumulated temperature is closest to 400 °C·d, as the most suitable sowing date for the stable yield of winter wheat that year. Because the number of days of the green returning–heading period of winter wheat did not significantly change with the delay of sowing date, ranging from 61 to 69 days and the photothermal potential yield of this stage did not have a significant effect on the yield, the multiyear average of 65 days was taken as the number of days of the green returning–heading period, i.e., the heading date was 65 days after green returning. Finally, the date when the photothermal potential yield was closest to 16.0 t·ha−1 was projected backward from the heading date as the suitable harvesting date to ensure a high yield of winter wheat. In order to not affect the sowing of following crop (summer maize), the latest harvesting date was set to 10 July, taking into account the local cultivation management experience. The results showed that the suitable sowing dates for winter wheat ranged from 274 (1 October) to 288 (15 October), with no clear interannual variation; the suitable harvesting date ranged from 156 (5 June) to 191 (10 July), showing a gradual trend of advancement with the postponement of the year (Figure 8).

4. Discussion

Wheat is sensitive to climate change, as light and temperature are the main environmental factors affecting the development process of wheat. With the delay of the sowing date, the daily mean temperature rose, the growth and development rate of wheat accelerated; the growth process advanced, the VGP shortened, and the RGP was prolonged. In this study, for each day of delay in sowing, the ratio of the VGP to the WGP decreased by 0.19% and the proportion of RGP increased by 0.12%. With the change in the growth process, the active accumulated temperature and total solar radiation during WGP of winter wheat significantly decreased with the delay of sowing date, consistent with the results of existing studies [42,43]. Specifically, this study found that the light and thermal resources in the WGP were mainly reduced in the sowing–wintering stages.
The delay of sowing date makes the light and thermal resources in wheat WGP decrease, and the photothermal potential yield and yield accordingly decrease. Thus, it could be seen that the actual sowing date of the field in Gucheng station (10 October) was not the highest-yield sowing date for winter wheat. The effective active accumulated temperature of the prewintering period is 500–600 °C·d, and the wheat struggles to form strong seedlings and sufficient effective tillers when the AAT is less than 400 °C·d [44,45]. The statistical analysis showed that there was a significant quadratic relationship between the prewintering active accumulated temperature and yield stability in winter wheat. The yield stability of winter wheat was highest when the prewintering active accumulated temperature was 400 °C·d; this was different from the results of previous studies, probably because the continuous updating and selection of varieties in actual production has led to the better adaptation of wheat varieties to the current climate [34]. Xiao and Tao [22] found that variety turnover and optimization of cultivation management practices were the main reasons for the increase in winter wheat yield over the past 30 years.
This study indicates that the suitable sowing period for high and stable winter wheat yield at Gucheng station in 1997–2021 was between 1 October and 15 October, similar to the findings of Dai et al. [24]. The suitable harvesting dates for Gucheng station given in this study are between 5 June and 10 July, later than the actual harvesting date. Such an inconsistency may be ascribed to the farmers in the wheat–maize rotation system in NCP preferring the maize crop, which has higher yield and economic efficiency, to increase their annual production [46]. Therefore, under the double–late cropping pattern, Gucheng station can try to choose a harvesting date suitable for high wheat yield by combining the research results and the actual situation.
The influence of meteorological conditions on crop growth and yield is mainly reflected in the accumulation of climatic resources and extreme weather and climate events. In this study, the effects of meteorological conditions on wheat growth and yield were analyzed from the perspective of the total amount of climate resources. In order to make the research results more valuable for application, meteorological stress will be taken into account in the next study in combination with local common agro-meteorological disasters.

5. Conclusions

In this study, based on the winter wheat interval sowing experiments conducted during 2017–2019 and historical meteorological data acquired during 1997–2021 at the Hebei Gucheng Agricultural Meteorology National Observation and Research Station in Baoding, Hebei, we investigated the influence of sowing date adjustment on winter wheat yield. We showed that a delayed sowing date advanced the growth process, shortened the VGP, and prolonged the RGP. This significantly changed the light and thermal resources allocation during the WGP, with a significant influence on the yield and its stability. We also found that the theoretical yield of winter wheat showed a significant exponential relationship with the photothermal potential yield of the WGP; the minimum photothermal potential for yield formation was 26.6 t·ha−1, and the maximum theoretical yield was 12.6 t·ha−1. We also found that wheat yield and yield stability were highest when the RGP photothermal potential yield was 16.0 t·ha−1 and the prewintering active accumulated temperature of winter wheat was 400 °C·d. The reduction in the prewintering active accumulated temperature and RGP photothermal potential yield contributed to the yield decrease and instability in delayed sowing dates. Finally, this study proposed a method for estimating the suitable sowing and harvesting dates to ensure high and stable yield of winter wheat, showing that the suitable sowing date at Gucheng station ranged from 1 to 10 October, with no significant interannual variation, and the suitable harvesting date ranged from 5 June to 10 July, with a gradual advance during the study period years.

Author Contributions

Conceptualization, Q.H. and J.L.; software, Y.G. and W.S.; formal analysis, X.X.; resources, Y.S. (Yanling Song); data curation, Y.S. (Yuxin Shi) and K.Z.; writing—original draft preparation, J.L. and Y.W.; writing—review and editing, S.Z., S.M. and R.W.; funding acquisition, G.Z. All authors have read and agreed to the published version of the manuscript.

Funding

This research was funded by National Natural Science Foundation of China, grant number 42130514.

Data Availability Statement

Not applicable.

Conflicts of Interest

The authors declare no conflict of interest.

References

  1. Dong, J.; Lu, H.B.; Wang, Y.W.; Ye, T.; Yuan, W.P. Estimating winter wheat yield based on a light use efficiency model and wheat variety data. Isprs. J. Photogramm. 2020, 160, 18–32. [Google Scholar] [CrossRef]
  2. FAO Statistics Database. Available online: https://www.fao.org/faostat/zh/#data/QCL (accessed on 20 June 2020).
  3. Geng, X.; Wang, F.; Ren, W.; Hao, Z.X. Climate change impacts on winter wheat yield in Northern China. Adv. Meteorol. 2019, 2019, 2767018. [Google Scholar] [CrossRef] [Green Version]
  4. Wang, J.; Wang, E.L.; Yang, X.G.; Zhang, F.S.; Yin, H. Increased yield potential of wheat-maize cropping system in the North China Plain by climate change adaptation. Clim. Chang. 2012, 113, 825–840. [Google Scholar] [CrossRef]
  5. Zhong, H.L.; Sun, L.X.; Fischer, G.; Tian, Z.; van Velthuizen, H.; Liang, Z.R. Mission impossible? Maintaining regional grain production level and recovering local groundwater table by cropping system adaptation across the North China Plain. Agric. Water Manag. 2017, 193, 1–12. [Google Scholar] [CrossRef]
  6. Cui, L.L.; Shi, J.; Du, H.Q.; Wen, K.M. Characteristics and trends of climatic extremes in China during 1959–2014. J. Trop. Meteorol. 2017, 23, 368–379. [Google Scholar] [CrossRef]
  7. Field, C.; Barros, V.; Stocker, T.; Dahe, Q. Managing the Risks of Extreme Events and Disasters to Advance Climate Change Adaptation: Special Report of the Intergovernmental Panel on Climate Change; Cambridge University Press: Cambridge, UK, 2012. [Google Scholar] [CrossRef]
  8. Jin, Z.N.; Zhuang, Q.L.; Tan, Z.L.; Dukes, J.S.; Zheng, B.Y.; Melillo, J.M. Do maize models capture the impacts of heat and drought stresses on yield? Using algorithm ensembles to identify successful approaches. Glob. Chang. Biol. 2016, 22, 3112–3126. [Google Scholar] [CrossRef]
  9. Katz, R.W.; Brown, B.G. Extreme events in a changing climate—Variability is more important than averages. Clim. Chang. 1992, 21, 289–302. [Google Scholar] [CrossRef]
  10. Bassu, S.; Brisson, N.; Durand, J.L.; Boote, K.; Lizaso, J.; Jones, J.W.; Rosenzweig, C.; Ruane, A.C.; Adam, M.; Baron, C.; et al. How do various maize crop models vary in their responses to climate change factors? Glob. Chang. Biol. 2014, 20, 2301–2320. [Google Scholar] [CrossRef] [Green Version]
  11. Piao, S.L.; Ciais, P.; Huang, Y.; Shen, Z.H.; Peng, S.S.; Li, J.S.; Zhou, L.P.; Liu, H.Y.; Ma, Y.C.; Ding, Y.H.; et al. The impacts of climate change on water resources and agriculture in China. Nature 2010, 467, 43–51. [Google Scholar] [CrossRef]
  12. Li, R.L.; Shu, G. Impacts of climate change on agriculture and adaptive strategies in China. J. Integr. Agric. 2013, 12, 1402–1408. [Google Scholar] [CrossRef]
  13. Li, K.N.; Yang, X.G.; Liu, Z.J.; Zhang, T.Y.; Lu, S.; Liu, Y. Low yield gap of winter wheat in the North China Plain. Eur. J. Agron. 2014, 59, 1–12. [Google Scholar] [CrossRef]
  14. Xiao, D.P.; Tao, F.L.; Liu, Y.J.; Shi, W.J.; Wang, M.; Liu, F.S.; Zhang, S.; Zhu, Z. Observed changes in winter wheat phenology in the North China Plain for 1981–2009. Int. J. Biometeorol. 2013, 57, 275–285. [Google Scholar] [CrossRef]
  15. Asseng, S.; Ewert, F.; Martre, P.; Rotter, R.P.; Lobell, D.B.; Cammarano, D.; Kimball, B.A.; Ottman, M.J.; Wall, G.W.; White, J.W.; et al. Rising temperatures reduce global wheat production. Nat. Clim. Chang. 2015, 5, 143–147. [Google Scholar] [CrossRef]
  16. Lobell, D.B.; Field, C.B. Global scale climate—Crop yield relationships and the impacts of recent warming. Environ. Res. Lett. 2007, 2, 014002. [Google Scholar] [CrossRef]
  17. Lobell, D.B.; Schlenker, W.; Costa-Roberts, J. Climate trends and global crop production since 1980. Science 2011, 333, 616–620. [Google Scholar] [CrossRef] [PubMed] [Green Version]
  18. Tao, F.L.; Zhang, S.A.; Zhang, Z. Spatiotemporal changes of wheat phenology in China under the effects of temperature, day length and cultivar thermal characteristics. Eur. J. Agron. 2012, 43, 201–212. [Google Scholar] [CrossRef]
  19. You, L.Z.; Rosegrant, M.W.; Wood, S.; Sun, D.S. Impact of growing season temperature on wheat productivity in China. Agric. For. Meteorol. 2009, 149, 1009–1014. [Google Scholar] [CrossRef]
  20. Ma, S.C.; Wang, T.C.; Guan, X.K.; Zhang, X. Effect of sowing time and seeding rate on yield components and water use efficiency of winter wheat by regulating the growth redundancy and physiological traits of root and shoot. Field Crop. Res. 2018, 221, 166–174. [Google Scholar] [CrossRef]
  21. Ren, A.X.; Sun, M.; Wang, P.R.; Xue, L.Z.; Lei, M.M.; Xue, J.F.; Gao, Z.Q.; Yang, Z.P. Optimization of sowing date and seeding rate for high winter wheat yield based on pre-winter plant development and soil water usage in the Loess Plateau, China. J. Integr. Agric. 2019, 18, 33–42. [Google Scholar] [CrossRef]
  22. Xiao, D.P.; Tao, F.L. Contributions of cultivars, management and climate change to winter wheat yield in the North China Plain in the past three decades. Eur. J. Agron. 2014, 52, 112–122. [Google Scholar] [CrossRef]
  23. Chen, C.; Baethgen, W.E.; Robertson, A. Contributions of individual variation in temperature, solar radiation and precipitation to crop yield in the North China Plain, 1961-2003. Clim. Chang. 2013, 116, 767–788. [Google Scholar] [CrossRef] [Green Version]
  24. Dai, X.L.; Wang, Y.C.; Dong, X.C.; Qian, T.F.; Yin, L.J.; Dong, S.X.; Chu, J.P.; He, M.R. Delayed sowing can increase lodging resistance while maintaining grain yield and nitrogen use efficiency in winter wheat. Crop. J. 2017, 5, 541–552. [Google Scholar] [CrossRef]
  25. An, J.S.; Zhou, J.H.; Chen, Y.H.; Wang, J.; Wu, J.H. Role of due delayed sowing in growth and reproduction of winter wheat and prevention of meteorological disasters. J. Agric. Catastrophol. 2012, 2, 8–10, (In Chinese with English abstract). [Google Scholar] [CrossRef]
  26. Garg, D.; Sareen, S.; Dalal, S.; Tiwari, R.; Singh, R. Grain filling duration and temperature pattern influence on the performance of wheat genotypes under late planting. Cereal Res. Commun. 2013, 41, 500–507. [Google Scholar] [CrossRef]
  27. Shah, F.; Coulter, J.A.; Ye, C.; Wu, W. Yield penalty due to delayed sowing of winter wheat and the mitigatory role of increased seeding rate. Eur. J. Agron. 2020, 119, 126120. [Google Scholar] [CrossRef]
  28. Fang, S.B.; Su, H.; Liu, W.; Tan, K.Y.; Ren, S.X. Infrared warming reduced winter wheat yields and some physiological parameters, which were mitigated by irrigation and worsened by delayed sowing. PLoS ONE 2013, 8, e67518. [Google Scholar] [CrossRef]
  29. Zhou, H.L.; Zhou, G.S.; He, Q.J.; Zhou, L.; Ji, Y.H.; Zhou, M.Z. Environmental explanation of maize specific leaf area under varying water stress regimes. Environ. Exp. Bot. 2020, 171, 103932. [Google Scholar] [CrossRef]
  30. Wang, C.C. A new wheat variety Tanmai 98 with high yield and high protein. Chin. Seed Ind. 2010, 7, 184, (In Chinese with English abstract). [Google Scholar]
  31. He, Q.; Xie, Y. Research on climatology calculation methods of total solar radiation in China. J. Nat. Resour. 2010, 25, 308–319, (In Chinese with English abstract). [Google Scholar] [CrossRef]
  32. Allen, R.G.; Pereira, L.; Raes, D.; Smith, M. Crop evapotranspiration-guidelines for computing crop water requirements. In FAO Irrigation and Drainage Paper 56; Food and Agriculture Organization: Rome, Italy, 1998. [Google Scholar]
  33. Yadav, S.; Deb, P.; Kumar, S.; Pandey, V.; Pandey, P.K. Trends in major and minor meteorological variables and their influence on reference evapotranspiration for mid-Himalayan region at east Sikkim, India. J. Mt. Sci. 2016, 13, 302–315. [Google Scholar] [CrossRef]
  34. Liu, Y.A.; Wang, E.L.; Yang, X.G.; Wang, J. Contributions of climatic and crop varietal changes to crop production in the North China Plain, since 1980s. Glob. Chang. Biol. 2010, 16, 2287–2299. [Google Scholar] [CrossRef]
  35. Luo, H.P.; Zou, N.; Hu, X.Y.; Wang, S.Y. Climatic potential productivity and resources utilization efficiency of major grain crops in the main grain production areas of China, 1980–2019. Resour. Sci. 2021, 43, 1234–1247, (In Chinese with English abstract). [Google Scholar] [CrossRef]
  36. Yuan, B.; Guo, J.; Ye, M.; Zhao, J. Variety distribution pattern and climatic potential productivity of spring maize in Northeast China under climate change. Chin. Sci. Bull. 2012, 57, 3497–3508. [Google Scholar] [CrossRef] [Green Version]
  37. Wang, X.Y.; Yang, X.G.; Sun, S.; Xie, W.J. Comparison of potential yield and resource utilization efficiency of main food crops in three provinces of Northeast China under climate change. Chin. J. Appl. Ecol. 2015, 26, 3091–3102, (In Chinese with English abstract). [Google Scholar]
  38. He, D.; Wang, J.; Dai, T.; Feng, L.; Zhang, J.; Pan, X.; Pan, Z. Impact of climate change on maize potential productivity and the potential productivity gap in Southwest China. J. Meteorol. Res. 2014, 28, 1155–1167. [Google Scholar] [CrossRef]
  39. Sun, S.; Yang, X.G.; Lin, X.M.; Sassenrath, G.F.; Li, K.N. Climate-smart management can further improve winter wheat yield in China. Agric. Syst. 2018, 162, 10–18, (In Chinese with English abstract). [Google Scholar] [CrossRef]
  40. Wang, P.J.; Liang, H.; Xie, D.H.; Zhang, J.H. Influence of climate warming on heat conditions before green-up stages for winter wheat in the North China Plain. J. Tritic. Crop. 2014, 34, 54–63. [Google Scholar] [CrossRef]
  41. Zhang, B.B.; Li, X.; Chen, H.B.; Niu, W.H.; Kong, X.B.; Yu, Q.; Zhao, M.J.; Xia, X.L. Identifying opportunities to close yield gaps in China by use of certificated cultivars to estimate potential productivity. Land Use Policy 2022, 117, 106080. [Google Scholar] [CrossRef]
  42. Xu, Y.B. Envirotyping for deciphering environmental impacts on crop plants. Theor. Appl. Genet. 2016, 129, 653–673. [Google Scholar] [CrossRef] [Green Version]
  43. Zhao, Y.Q.; Xiao, D.P.; Tang, J.Z.; Bai, H.Z. Effects of climate change on the yield of major grain crops and its adaptation measures in China. Res. Soil Water Conserv. 2019, 26, 317–326. [Google Scholar] [CrossRef]
  44. Yan, C.P.; Zhang, Y.Q.; Zhang, D.Y.; Dang, J.Y. Effects of sowing date and planting density on the grain’s protein component and quality of strong and medium gluten winter wheat cultivars. J. Appl. Ecol. 2008, 8, 1733–1740, (In Chinese with English abstract). [Google Scholar]
  45. Li, Q.Y.; Nian, L.; Liu, W.D.; Li, L.; Zhou, S.M.; Jun, Y. Effects of accumulated temperature before winter on growth and development of wheat in Henan province. Chin. J. Agrometeorol. 2010, 31, 563–569, (In Chinese with English abstract). [Google Scholar]
  46. Zhou, B.Y.; Wang, A.M.; Yue, Y.; Ma, W.; Zhao, M. Comparison of yield and light-temperature resource use efficiency between wheat–maize and maize–maize cropping systems. Act. Agronom. Sin. 2015, 41, 1393–1405, (In Chinese with English abstract). [Google Scholar] [CrossRef]
Figure 1. Monthly changes in temperature, total precipitation, and total solar radiation during wheat growing season at Gucheng station in 2017–2019.
Agronomy 13 00991 g001
Figure 2. Variation in the length of different developmental stages of winter wheat for different sowing dates.
Agronomy 13 00991 g002
Figure 3. Effects of sowing date changes on the ratio of the vegetative growth period (a) and the reproductive growth period (b) of winter wheat. Note: DVGP denotes the length of the vegetative growth period, DWGP denotes the length of the whole growth period, DRGP denotes the length of the reproductive growth period. The black dotted lines represent the fitted regression trend line. The asterisks (* or **) indicate the trend’s significance at p < 0.01 (**) and p < 0.05 (*).
Agronomy 13 00991 g003
Figure 4. Active accumulated temperature (a) and solar radiation (b) for different sowing dates of winter wheat at different developmental stages.
Agronomy 13 00991 g004
Figure 5. Effect of sowing date on winter wheat yield. Note: The horizontal coordinates represent the variation days in different sowing dates relative to the normal sowing date, and the vertical coordinates represent the variation in yield amount in different sowing dates relative to the normal sowing date. The black dotted lines represent the fitted regression trend line.
Agronomy 13 00991 g005
Figure 6. Relationship between the coefficient of variation of winter wheat yield and prewintering active accumulated temperature. Note: The black dotted lines represent the fitted regression trend line. The asterisks (**) indicate the trend’s significance at p < 0.01.
Agronomy 13 00991 g006
Figure 7. Relationship between winter wheat yield and photothermal potential yield during the WGP (a) and the heading–harvesting period (b). Note: The red lines represent the fitted regression trend line. The asterisks (**) indicate the trend’s significance at p < 0.01.
Agronomy 13 00991 g007
Figure 8. Day number for suitable sowing and harvesting dates of winter wheat at Gucheng station during 1997–2021. Note: The black solid dot (black hollow circle) is the day number of the optimum sowing date (optimum harvest date) in different years. The red lines represent the fitted regression trend line. The asterisks (*) indicate the trend’s significance at p < 0.05.
Agronomy 13 00991 g008
Table 1. Parameter values of photosynthetic potential yield calculation equation.
ParameterEαβφεζμηγkλH
value0.430.850.490.220.100.070.100.050.330.140.0817.58
Table 2. Minimum (tmin), optimum (ts), and maximum (tmax) temperatures for each winter wheat developmental stage.
TemperatureGrowth Period
Sowing–JointingJointing–HeadingHeading–Harvesting
tmin (°C)1910
t0 (°C)111623
tmax (°C)2532.532
Disclaimer/Publisher’s Note: The statements, opinions and data contained in all publications are solely those of the individual author(s) and contributor(s) and not of MDPI and/or the editor(s). MDPI and/or the editor(s) disclaim responsibility for any injury to people or property resulting from any ideas, methods, instructions or products referred to in the content.

