Article

Morphological, Anatomical and Chemical Characterization of Ricinus communis L. (Euphorbiaceae)

1
Botany and Microbiology Department, Faculty of Science, Alexandria University, Alexandria 21511, Egypt
2
Environmental Sciences Department, Faculty of Natural Resources and Environmental Sciences, Omar Al-Mukhtar University, El-Beida P.O. Box 919, Libya
3
Botany Department, Faculty of Science, Fayoum University, Fayoum 63514, Egypt
4
Botany Department, Faculty of Science, University of Derna, Qubbah Branch, El-Qubbah 11595, Libya
5
Botany and Microbiology Department, Faculty of Science, Suez Canal University, Ismailia 41522, Egypt
*
Author to whom correspondence should be addressed.
Agronomy 2023, 13(4), 985; https://doi.org/10.3390/agronomy13040985
Submission received: 9 February 2023 / Revised: 8 March 2023 / Accepted: 17 March 2023 / Published: 27 March 2023
(This article belongs to the Special Issue Recent Progress in Plant Taxonomy and Floristic Studies)

Abstract

:
Ricinus communis L. (Euphorbiaceae, Acalyphoideae) is a highly variable species known as the castor oil plant. This study aimed to describe R. communis using several methodologies, such as vegetative morphometry, leaf surface ultrastructure, soil analysis, and gas chromatography-mass spectrometry (GC-MS) analysis, to understand the diversity of this species. The morphological analysis revealed that some samples had purple stems while others were grayish-green. The purple-stemmed R. communis phenotype reflects the intra-specific diversity of the species. The multivariate analysis of 25 R. communis samples based on 34 vegetative morphometric characteristics revealed that they belonged to three main groups (morphotypes). Each group attained some specific characteristics discriminating it from the other groups. Selected samples from each group were investigated using SEM, soil analysis, and GC-MS. The performed GC-MS technique revealed that six major compounds were detected in the chromatograms of the studied samples. The highest percentages of n-Hexadecanoic acid and 9,12,15-Octadecatrienoic acid were recorded. Ricinus communis demonstrated adaptive growth capability, where plants inhabiting coastal sites are salt-sensitive, while inland plants are relatively drought-tolerant species. The intra-specific variation between R. communis morphotypes indicated the possibility of the direct and indirect use of these varieties in genetic improvement programs of the species.

1. Introduction

Ricinus communis L. is known as the castor oil plant [1]. It is a perennial oilseed shrub that belongs to the Euphorbiaceae family and subfamily Acalyphoideae [2,3,4]. The species originated in Africa and is currently cultivated in many tropical and subtropical regions around the world [5]. The plant is a high protein source for animal feedstock and can be cultivated as a garden ornament [6]. The castor bean plant has earned increasing attention due to its commercial castor oil production, pharmacological activities, and agricultural applications [7]. The species was reported to possess therapeutic properties, such as antiasthmatic, antidiabetic, anticancer, antioxidant, antimicrobial, anti-inflammatory, antiulcer, wound healing, and laxative effects [8,9,10,11,12,13,14]. According to Abbes et al. [15], castor seeds contain a toxic glycoprotein called ricin, which is regarded as a potent poison. The leaf and seed extracts of R. communis have larvicidal activity against mosquitoes [16]. It contains ricinine in all parts of the plant which is considered a strong insecticide [17]. Leaf extracts of R. communis were effective against the replication of the hepatitis A virus [18]. Mboyazi et al. [19] reported that extracts of R. communis leaf have proved to be a safe source of therapeutic agents. Since R. communis oil has a high ricinoleic fatty acid content, it is now used in biofuel production [20].
This species can be self- and cross-pollinated, containing a large amount of pollen biomass per flower, which contributes generously to the plant’s distribution [21]. However, Allan et al. [22] reported that castor bean germplasm had limited genetic diversity. In contrast, Anjani [23] mentioned that many wild and semi-wild types with wide genotypic and phenotypic diversity resulted from natural selection in various agro-climatic regions. Nevertheless, the plant’s morphological characteristics vary greatly depending on the environment. This highly variable species can be classified into wide varieties and forms based on different vegetative and floral morphological characteristics [24,25,26,27,28,29,30]. Despite that, limited leaf characteristics of R. communis were reported in those previous works. Although there are several forms with distinctive characteristics, they are closely related through intermediate forms and hybridization [29,31]. Investigating the leaf’s micromorphological characteristics—epidermal cells and stomata—explains the plant responses to abiotic and biotic stresses [32]. Stomata mediate interactions and act as channels between plants and the environment [33].
Analyzing soil in different sites identifies the soil’s chemical, physical, and biological characteristics and determines the concentration of soil nutrients [34]. Soil pollutants released by anthropogenic activities endanger the stability of biological systems [35]. Nazzal et al. [36] considered copper, iron, manganese, and zinc as major soil contaminants. Plants growing in such contaminated soils have developed defense mechanisms for toxic metal ions [37]. Heavy metal precipitation and mobilization in soil may be due to the uncontrolled discharge of wastes during industrialization or agricultural activities that affects the metabolism of plants [38,39,40,41]. Tyagi et al. [42] studied the impact of industrial pollution on R. communis compared to a plant grown in unpolluted natural areas. Ricinus communis can thrive in heavy-metal-contaminated soils [43] and function as a biosensor of environmental quality because of its massive growth and large leaf area, which aids in pollution detection [44]. Thus, it is a possible candidate for environmental restoration and bioremediation [45].
The essential oil isolated from R. communis leaves could be used in the formulation of natural remedies [46]. Mboyazi et al. [19] mentioned that harvesting R. communis at different geographic locations could yield various phytochemicals with potential therapeutic significance. Major compounds have been detected in castor leaf extract with the help of GC-MS analysis, such as octadecanoic acid, n-hexadecanoic acid, 1-hexadecanol, triethyl citrate, 2-Methyl, diethyl phthalate, 3-octadecene, α-thujone, and 1,8-cineole [17,46]. Meanwhile, long-chain fatty acids and their derivatives were detected in the castor seed oil of some cultivars, such as oleic acid, palmitic acid, and linoleic acids [17,47].
Leaf traits are frequently measured to predict how anthropogenic pressures will affect ecosystems [48]. The leaf oil composition of R. communis has been insufficiently studied compared to its seeds, which was extensively studied [6,49,50,51,52,53]. Accordingly, this study aimed to describe its leaves using different approaches to understand the diversity of this species and how environmental conditions may affect its morphological traits and chemical composition. Thus, several methodologies were used to characterize this plant in different locations in Egypt, such as vegetative morphometry, leaf surface ultrastructure, soil analysis, and gas chromatography-mass spectrometry (GC-MS) analysis.

2. Materials and Methods

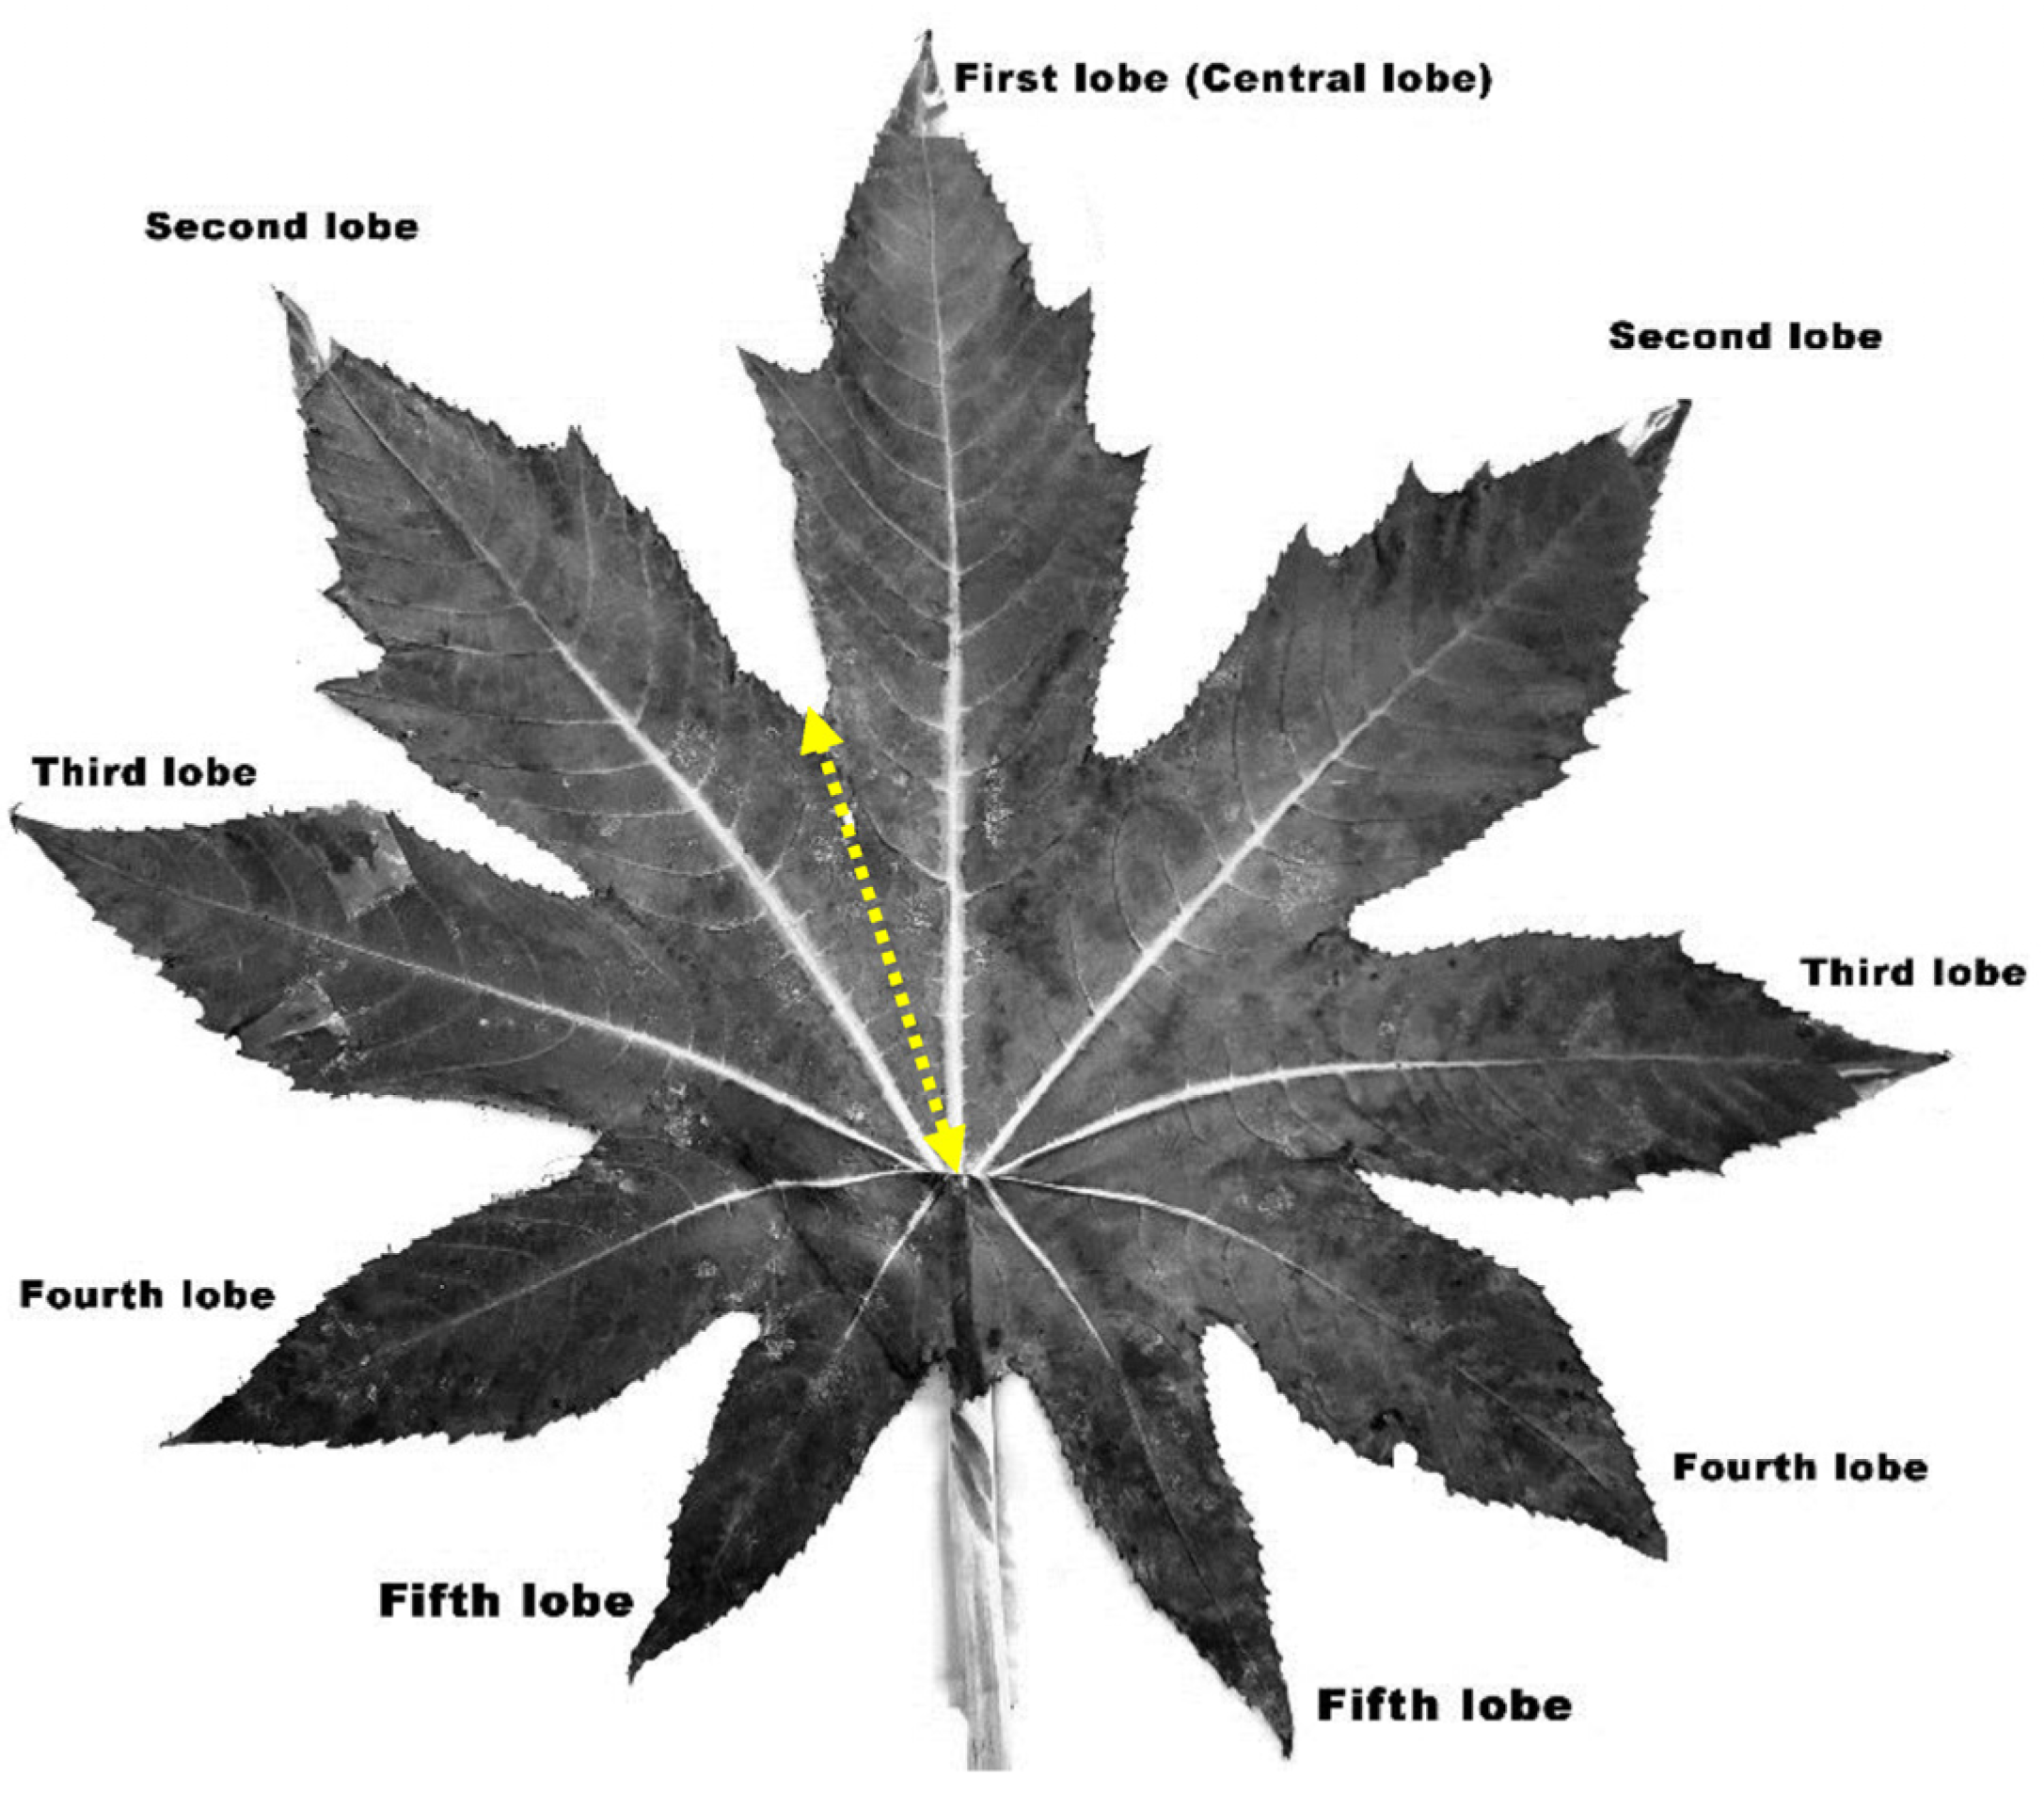
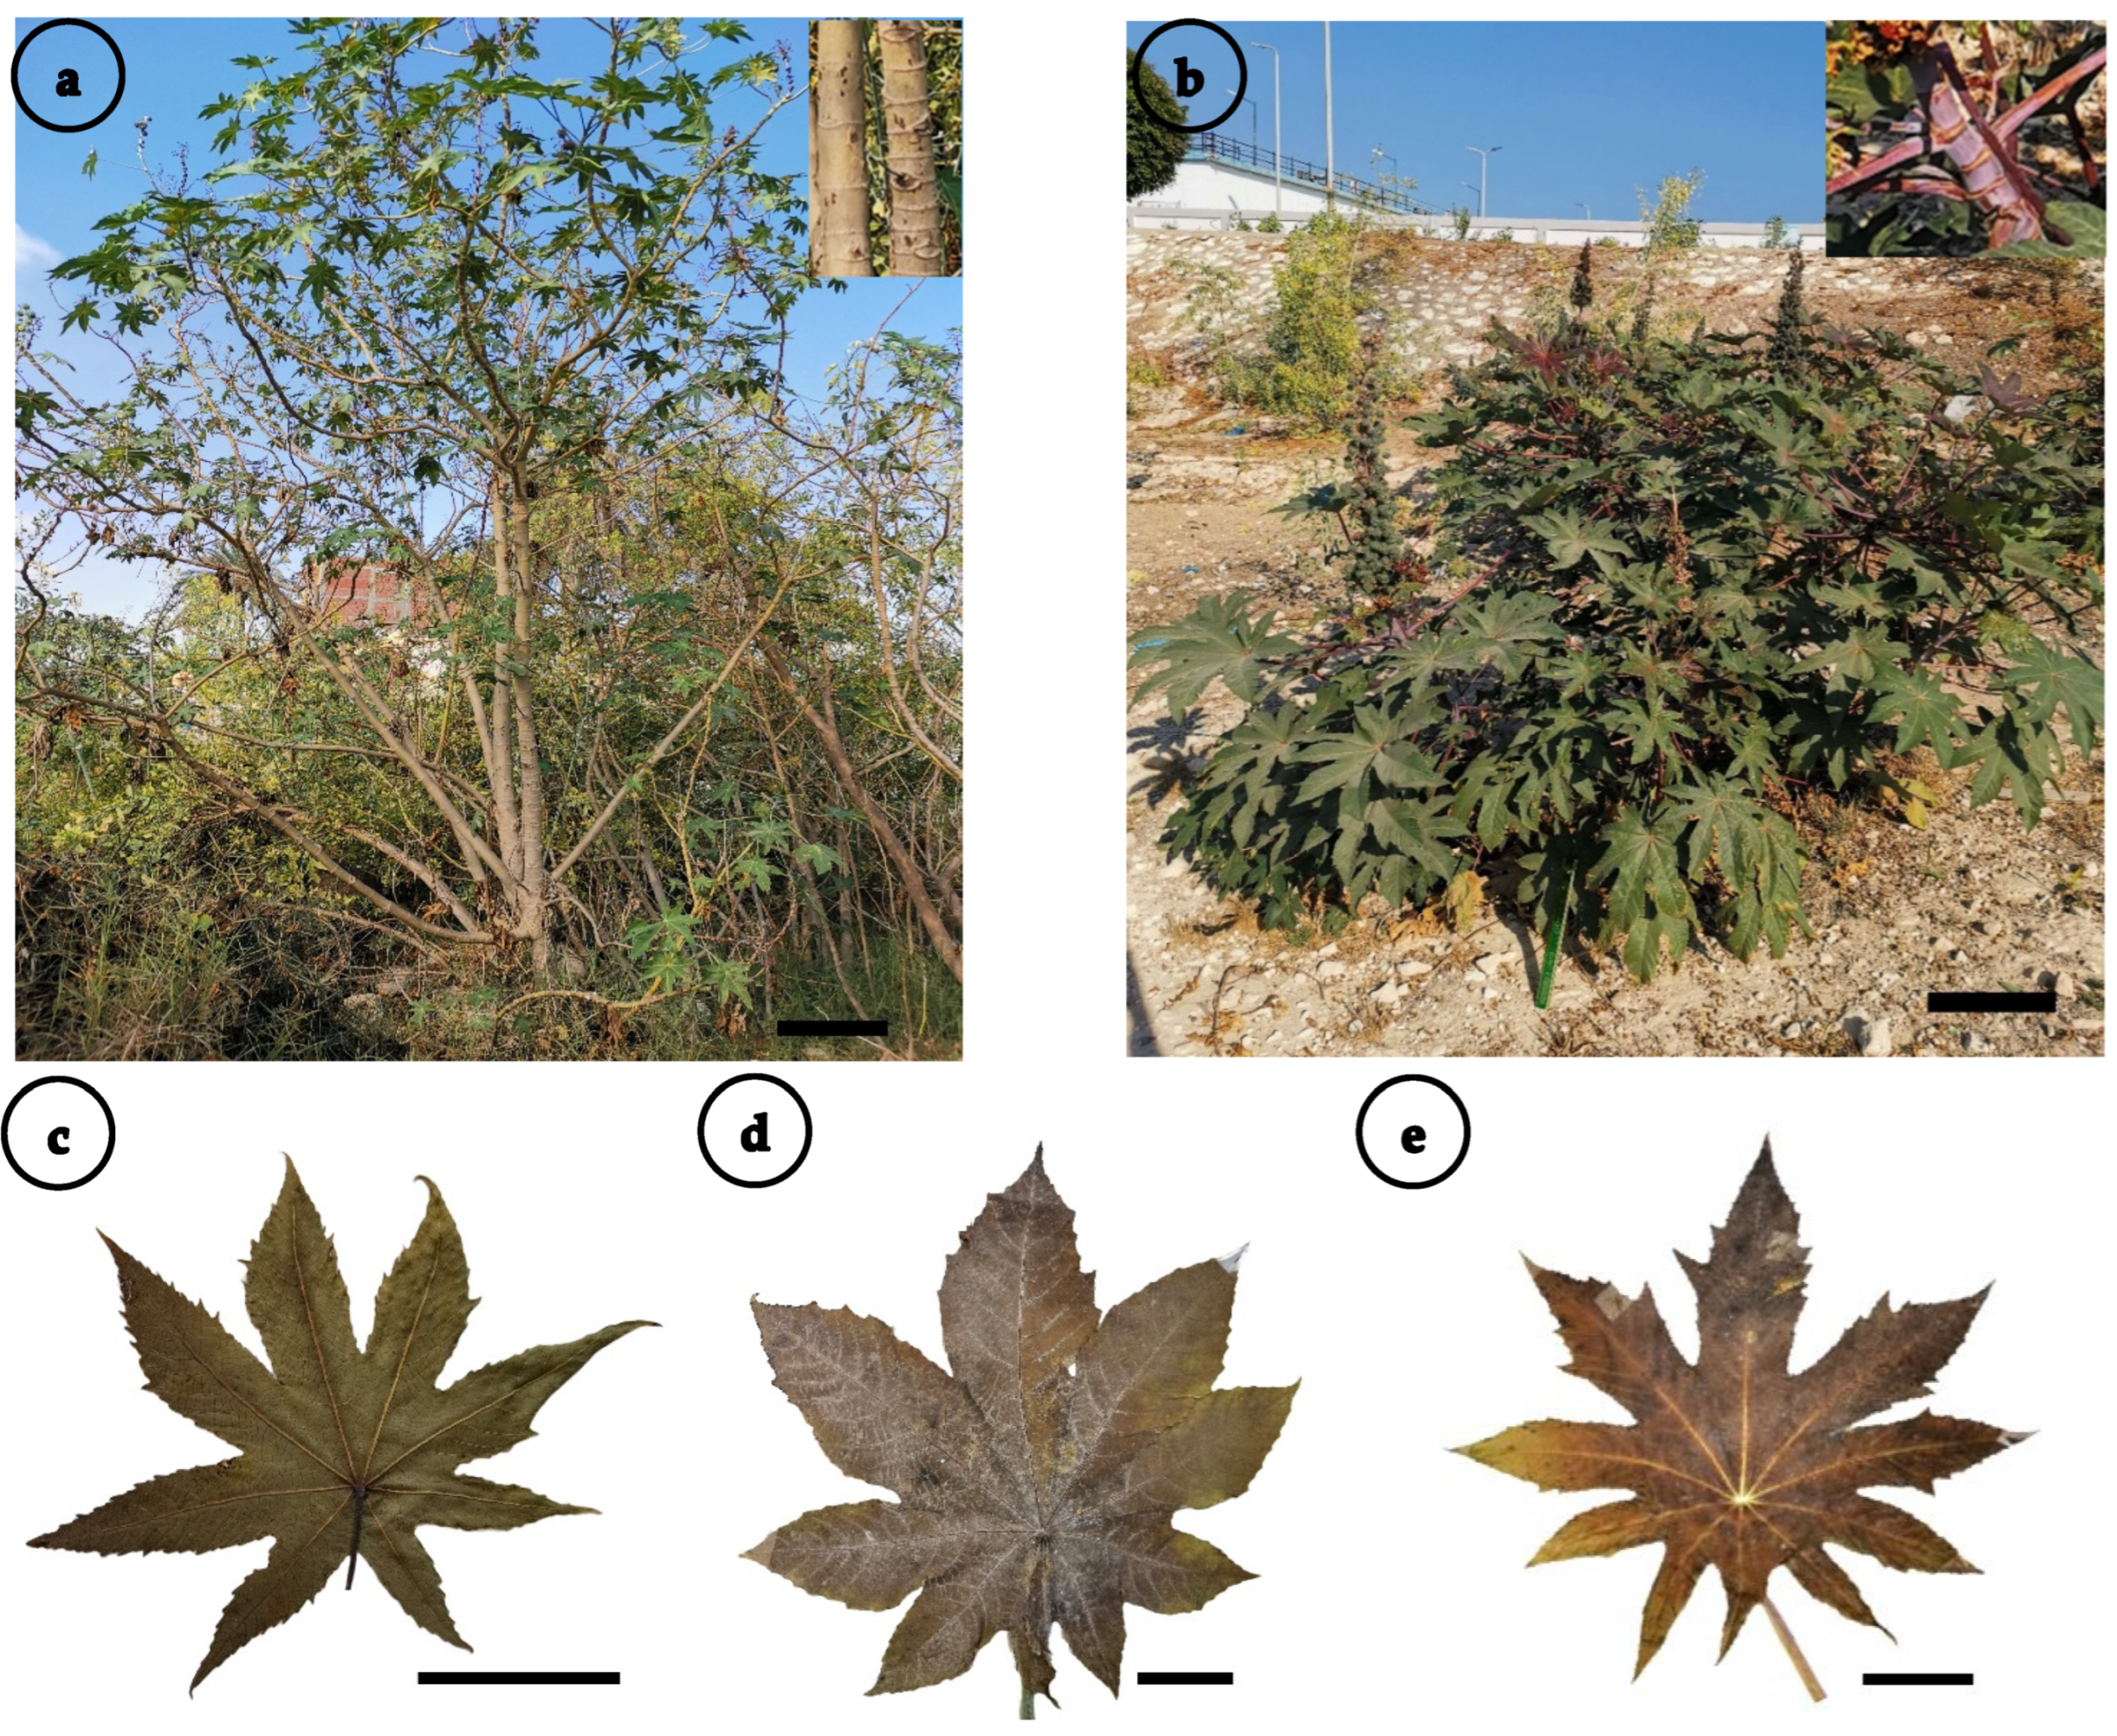
2.1. Plant Materials and Vegetative Morphometry

Twenty-five R. communis samples were gathered from eleven sites in the western Mediterranean coastal desert of Egypt (Table 1, Supplementary Figure S1). From each shrub, ten leaves were collected from different branches. Measurements of the third and fourth healthy undamaged leaves from the top of the stem were carried out to minimize variation due to different stages of leaf growth. Voucher specimens were deposited in ALEX University Herbarium, Alexandria, Egypt. ImageJ program (version 1.51j8) was used to measure the quantitative characters [54]. Leaves with a number of lobes above ten were disregarded in this study. The central lobe (first lobe) was measured, while the lateral lobes were represented as an average of the two similar lobes, as well as the lobe sinus (depth between every two lobes) (Figure 1). The terminology of Singh [55] and Beth et al. [56] was used, the categories of leaf area were described according to Ash [57], and the plant stature was ranked based on the study of Silva et al. [27].

2.2. Leaf Surface Ultrastructure (SEM)

The leaf surface micromorphology was investigated for six R. communis samples (4, 8, 11, 12, 17, and 22). These samples were selected from the three major subclusters that resulted from the multivariate analysis of the macromorphological data. Both the abaxial (AB) and adaxial (AD) leaf surfaces were mounted on the copper sample holder with double-sided adhesive tape. The samples’ coating was completed with gold in a Polaron JFC-1100E coating unit for 5 min. Firstly, the leaves were examined using a stereomicroscope and directly observed under a JEOL JSM-IT200 Scanning Electron Microscope (Tokyo, Japan) at the Electron Microscopy Unit of the Faculty of Science, Alexandria University, Alexandria, Egypt. Twenty-seven quantitative and qualitative characteristics were studied for both leaf surfaces. The quantitative traits included stomatal count at 2560 × 1920 µm2 as well as stomatal and epidermal size parameters. Measurements were made by using ImageJ (1.51j8) [54]. The terminology of Barthlott et al. [58] was used.

2.3. Soil Sampling and Elemental Analysis

A total of thirty-three soil samples were collected for the eleven studied sites (three subsamples per site). According to Piper’s method [59], every three subsamples were mixed as a composite sample. Six samples corresponding to six sites (1, 3–5, 8, and 10) were selected based on the multivariate analysis of the vegetative traits. Then, the samples were crushed into small pieces using a mechanical crusher and dried overnight at 35 °C to a constant weight. The dried samples were ground to fine powder, and then the powdered samples were sieved using a standard set of sieves to diameters <125 and >63 µm. Every powdered sample was shaken using an electric shaker to be sure that the sample was homogenized. The saturation percentage (SP) was identified as the amount of water in milliliters needed to saturate 100 g of soil. Soil pH was measured in a soil-water ratio of 1:2.5 by using a pH meter (PB-21, Sartorius, Göttingen, Germany). Soil organic matter (SOM) was examined using the potassium dichromatic oxidation titration technique, according to Walkely and Black [60].
The available nitrogen (N) was determined using the Kjeldahl method with a Kjeldahl analyzer (Kjeltec TM8200, FOSS, Shanghai, China) [61]. The available phosphorus (P) was digested using perchloric and sulfuric acids, then was analyzed using the molybdenum antimony blue colorimetric method [62]. According to Hanway and Heidel [63], the available potassium (K) was digested using ammonium acetate and analyzed via atomic adsorption spectrometry. In order to determine the metal soil contents, the solutions were subjected to inductively coupled plasma-optical emission spectroscopy (ICP-OES; Agilent 5100 VDV, Santa Clara, CA, USA). The contents of Zn++, Ca++, Cu++, K+, Mg++ and Na+, were computed as parts per million (ppm). Flow rates of plasma, auxiliary, and nebulizer of ICP-OES were kept at 12, 1, and 0.7 mL min−1, respectively. The sample uptake and stabilization time was 10 s for each sample.

2.4. Gas Chromatography-Mass Spectrometry (GC-MS) Analysis

2.4.1. Preparation of Plant Extracts

The fresh R. communis leaves were shade-dried until the samples became well-dried for grinding. After drying, the plant materials were ground well into a fine powder using a mechanical blender, and then were dried under shade and ground again. The dried plant material was soaked in hexane and then concentrated to dryness using a rotary evaporator at 40 °C [64].

2.4.2. GC-MS Analysis Conditions

The GC-MS analysis was carried out for the six selected samples (1, 3–5, 8, and 10) by using gas chromatography-mass spectrometry with the following specifications: a TRACE GC Ultra Gas Chromatographs (THERMO Scientific Corp., Waltham, MA, USA) coupled with a Thermo mass spectrometer detector (ISQ Single Quadrupole Mass Spectrometer). The GC-MS system was equipped with a TR-5 MS column (30 m × 0.32 mm i.d., 0.25 μm film thickness). The column oven temperature was initially maintained at 150 °C for 2 min, and then increased at 1 °C/min to 210 °C, and next was sustained at 220 °C for 40 min. The injector and detector temperatures were 275 °C and 220 °C, respectively. The carrier gas was helium, with a flow rate of 1.5 mL/min [65]. The quantities of the phytochemicals detected in the extracts were expressed as percentages from the total extract (area %). The identification of the compounds was de-convoluted using AMDIS software and identified by its retention indices (relative to n-alkanes C8–C22), and mass spectrum matching to the Wiley spectral library collection and NSIT mainlib and replib databases.

2.5. Data Analysis

Different software was used to analyze the data, including Excel 365, Minitab version 20, and R software (Vienna, Austria); the latter had the necessary packages loaded [66]. The mean and standard deviation were computed as descriptive statistics for each component. Based on several measurable qualities, interpretive multivariate statistics were employed to divide the 25 samples into many homogenous groups.
The similarity and dissimilarity between and among samples were visualized using the “pheatmap” and “ggplot2” packages [67,68]. The color scale varied depending on how much the studied readings differed. According to Viscosi and Cardini [69], a red color implies a high degree of similarity between accessions, whereas a blue color denotes a low degree of similarity. Following the normalization and scaling of various variables using R-software, agglomerative cluster analysis was performed using Ward’s linkage approach and Euclidean distance measurement. Installing the “factoextra” and “ggplot2” packages in R allowed for the creation of a scatter diagram using principal component analysis (PCA) to display the distance matrices [70].
The correlation coefficients for the association between the two variables were obtained and displayed using the “Corrplot” package [71]. White with a 0 shows no link between the two variables, whereas blue with a 1 suggests a high positive correlation. Red with a −1 indicates a significant negative correlation.
Utilizing Minitab 20, the optimal approach was used to apply the Box–Cox transformation for dependent variables that are not normal. Under the general linear model, several comparisons were made using one-way and two-way analysis of variance (ANOVA). Results demonstrated a satisfactory fit for several models, and after data transformation, normal residual probability plots displayed a linear attitude for all studies. p-values were measured as significant at (p ≤ 0.05). Tukey’s test for pairwise comparisons was used to conduct a post hoc analysis of all group interactions. The post hoc analysis results are shown as letters, with the same letter indicating no significant difference between groups and different letters indicating significant differences between groups.

3. Results

3.1. Vegetative Morphometry

The descriptive and qualitative data of the vegetative morphometry are illustrated in Table 2 and Supplementary Table S1. Ricinus communis is a shrubby plant, and its height varied from 1.02 m in sample 5 to 3.72 m in sample 24. The plant’s stature was categorized as very tall, “>2.50 m” (Figure 2a); tall, “2.0–2.5 m”; medium, “1.51–2.0 m”; and short, “1.0–1.5 m” (Figure 2b). The stems were smooth, glabrous, and with divergent branches sometimes covered by wax (Figure 2a,b). Stems were mostly greyish-green (Figure 2a), except for samples 1–4, 12–13, and 20–21, which had purple ones (Figure 2b). Each shrub had both condensed and elongated internodes. The petiole was green or purple and inserted sub-basally to the leaf at 9.85% to 26.14%. The leaf petiole length ranged from 5.58 cm to 39.8 cm (in samples 10 and 19, respectively), and the petiole length ratio varied approximately from half to about one and a half times the leaf length.
Leaves were alternate, green, glabrous, more or less flat, and elliptic, and their size was 7.10–32.57 × 7.89–34.39 cm (Table 2). The leaf area ranged from 225.14 to 5000.19 mm2, where the leaf blade classes fell into the mesophyll (225–1820 mm2) and macrophyll (<1820 mm2) categories (Table 2). Ricinus communis leaves are symmetric or asymmetric, with a variable number of lobes in the same shrub; 7 to 13 lobes. Leaves are simple and lobed with a palmatipartite incision. The incision percentage of the leaf represents 52.28 to 80.64% (in samples 1 and 21, respectively), with a curved sinus.
The first lobe (central lobe) size was 4.86–24.41 × 1.49–7.83 cm, the second pair size was 4.60–21.49 × 1.26–7.29 cm, and the third pair size was 3.86–17.84 × 1.01–6.15 cm. The latter lobes had oblong or lanceolate shapes. Generally, the fourth and fifth pairs attained lanceolate lobes; their sizes were 2.97–14.61 × 0.58–4.62 cm and 2.35–12.61 × 0.51–3.47 cm, respectively (except sample 17 which had linear-lanceolate fifth lobe). Each lobe had a prominent vein, acuminate apex, and serrate margin. The leaf teeth were straight or curved with 4 to 7 orders.

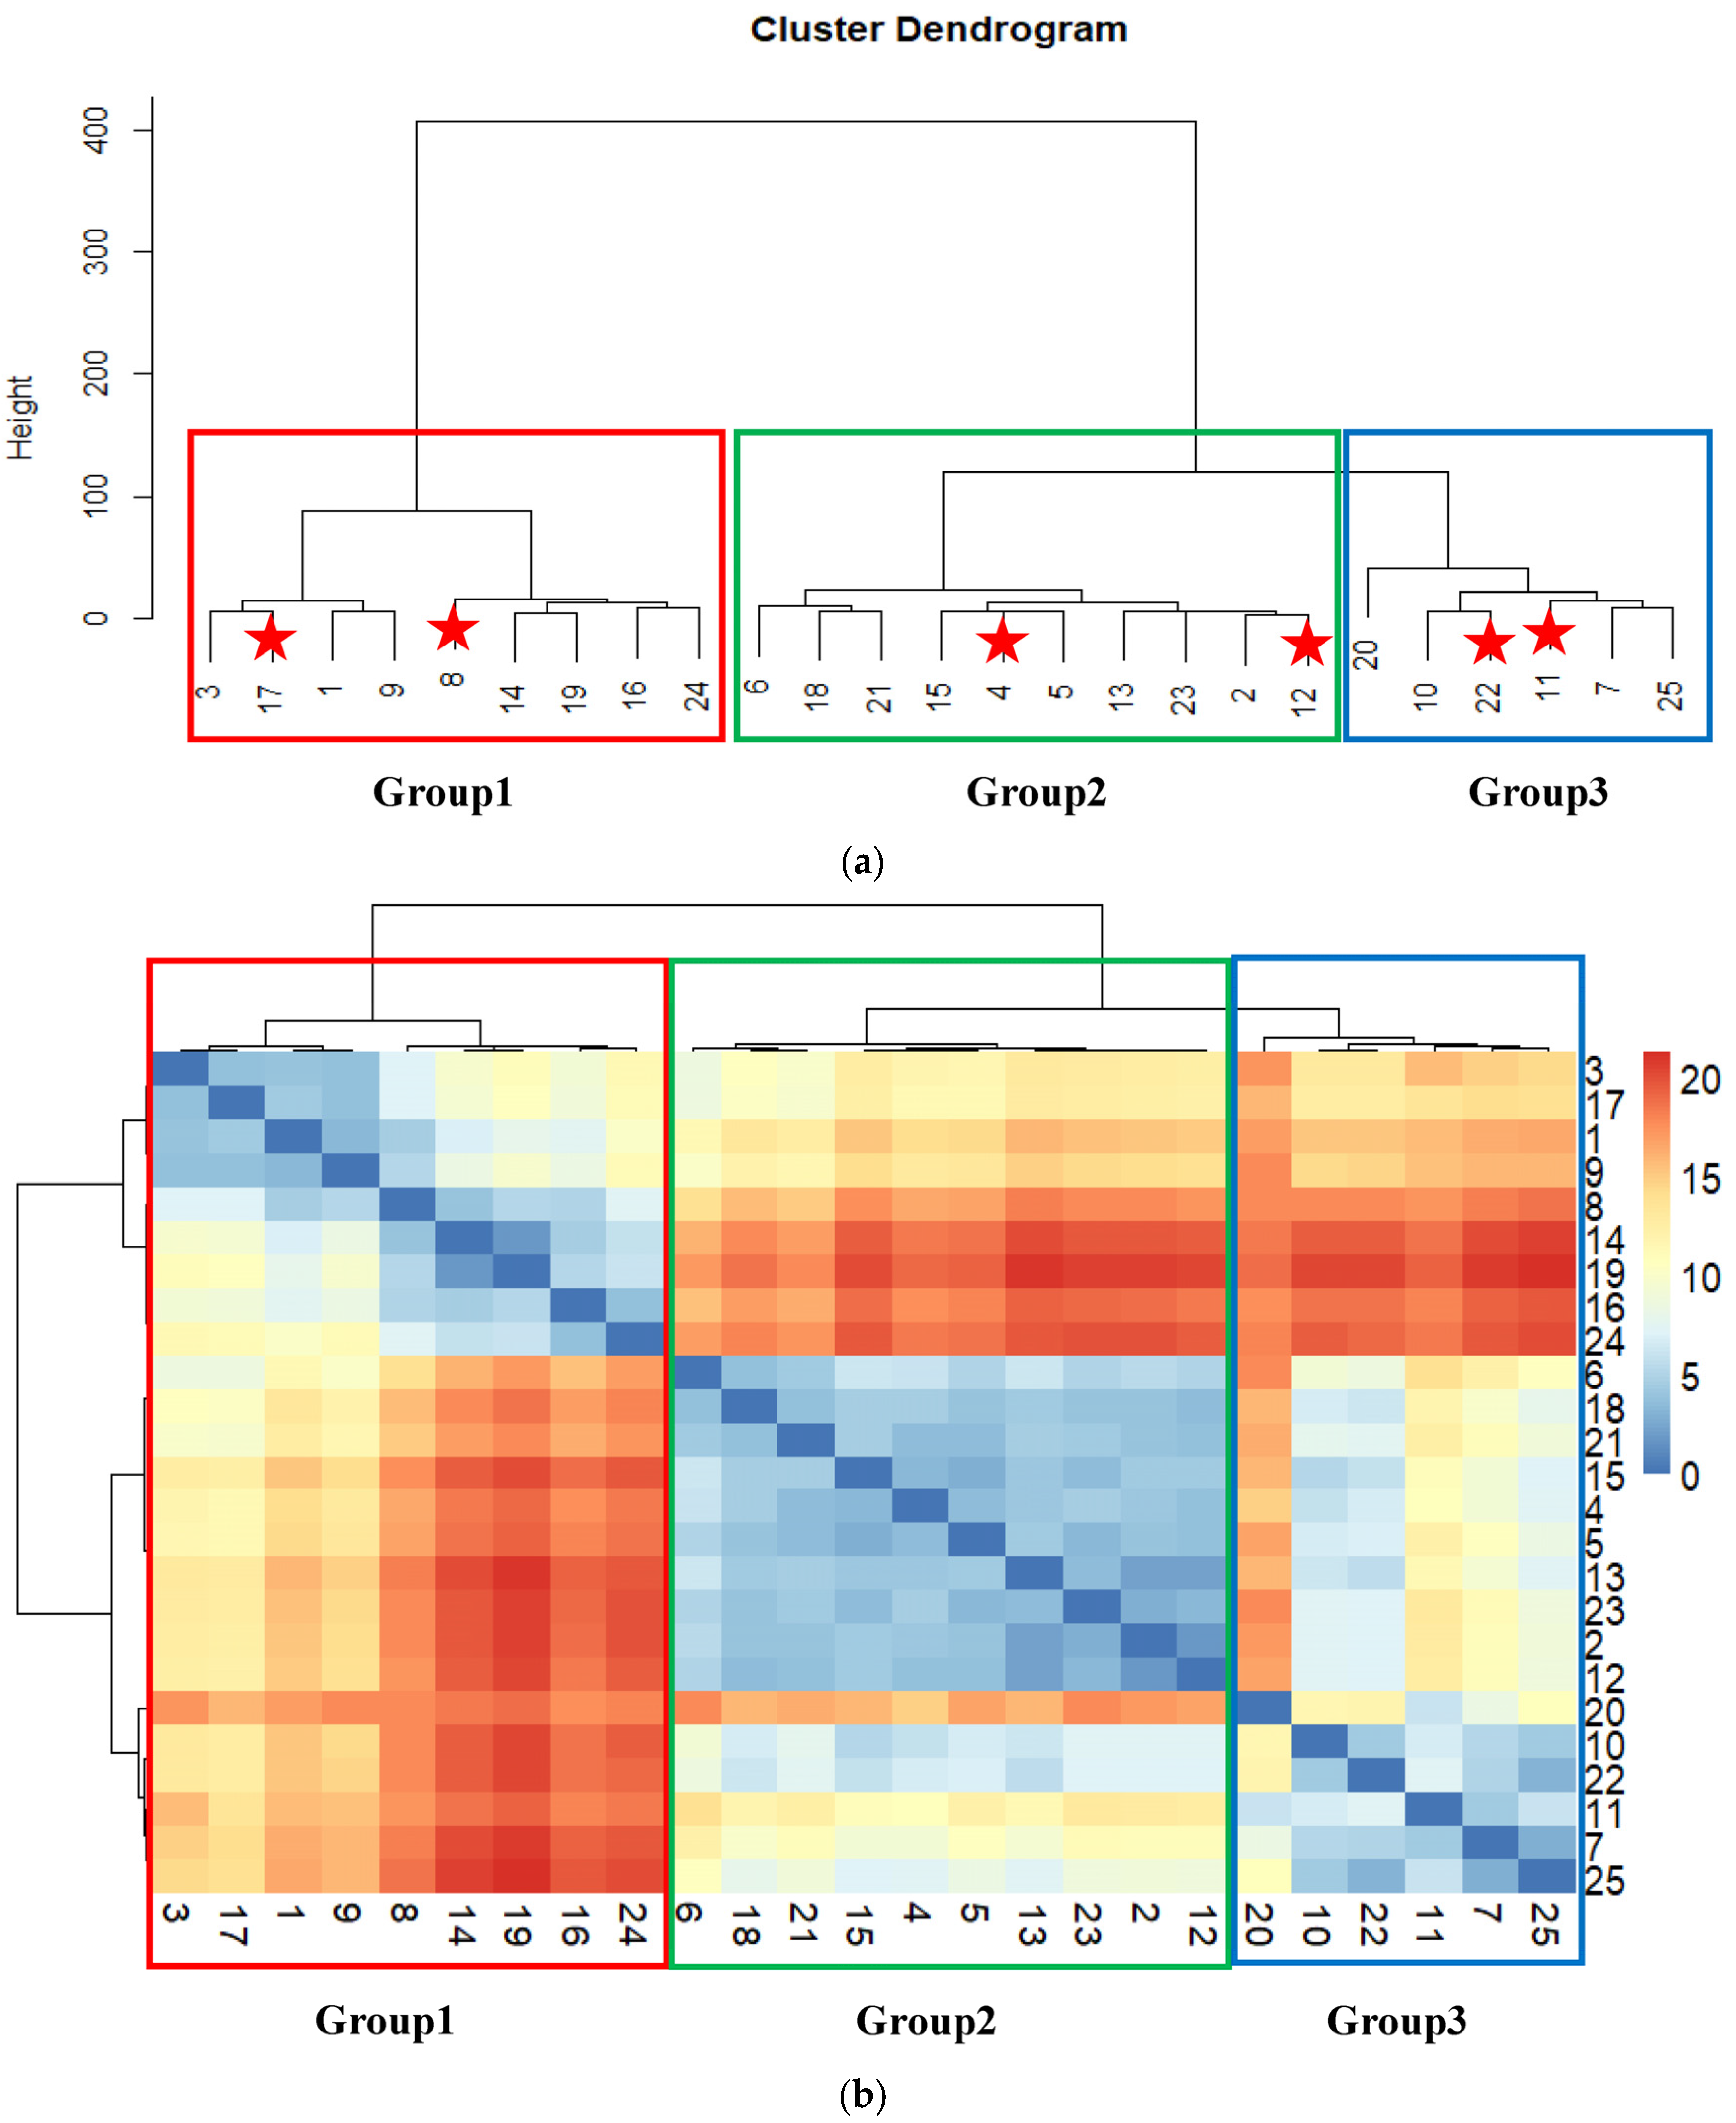
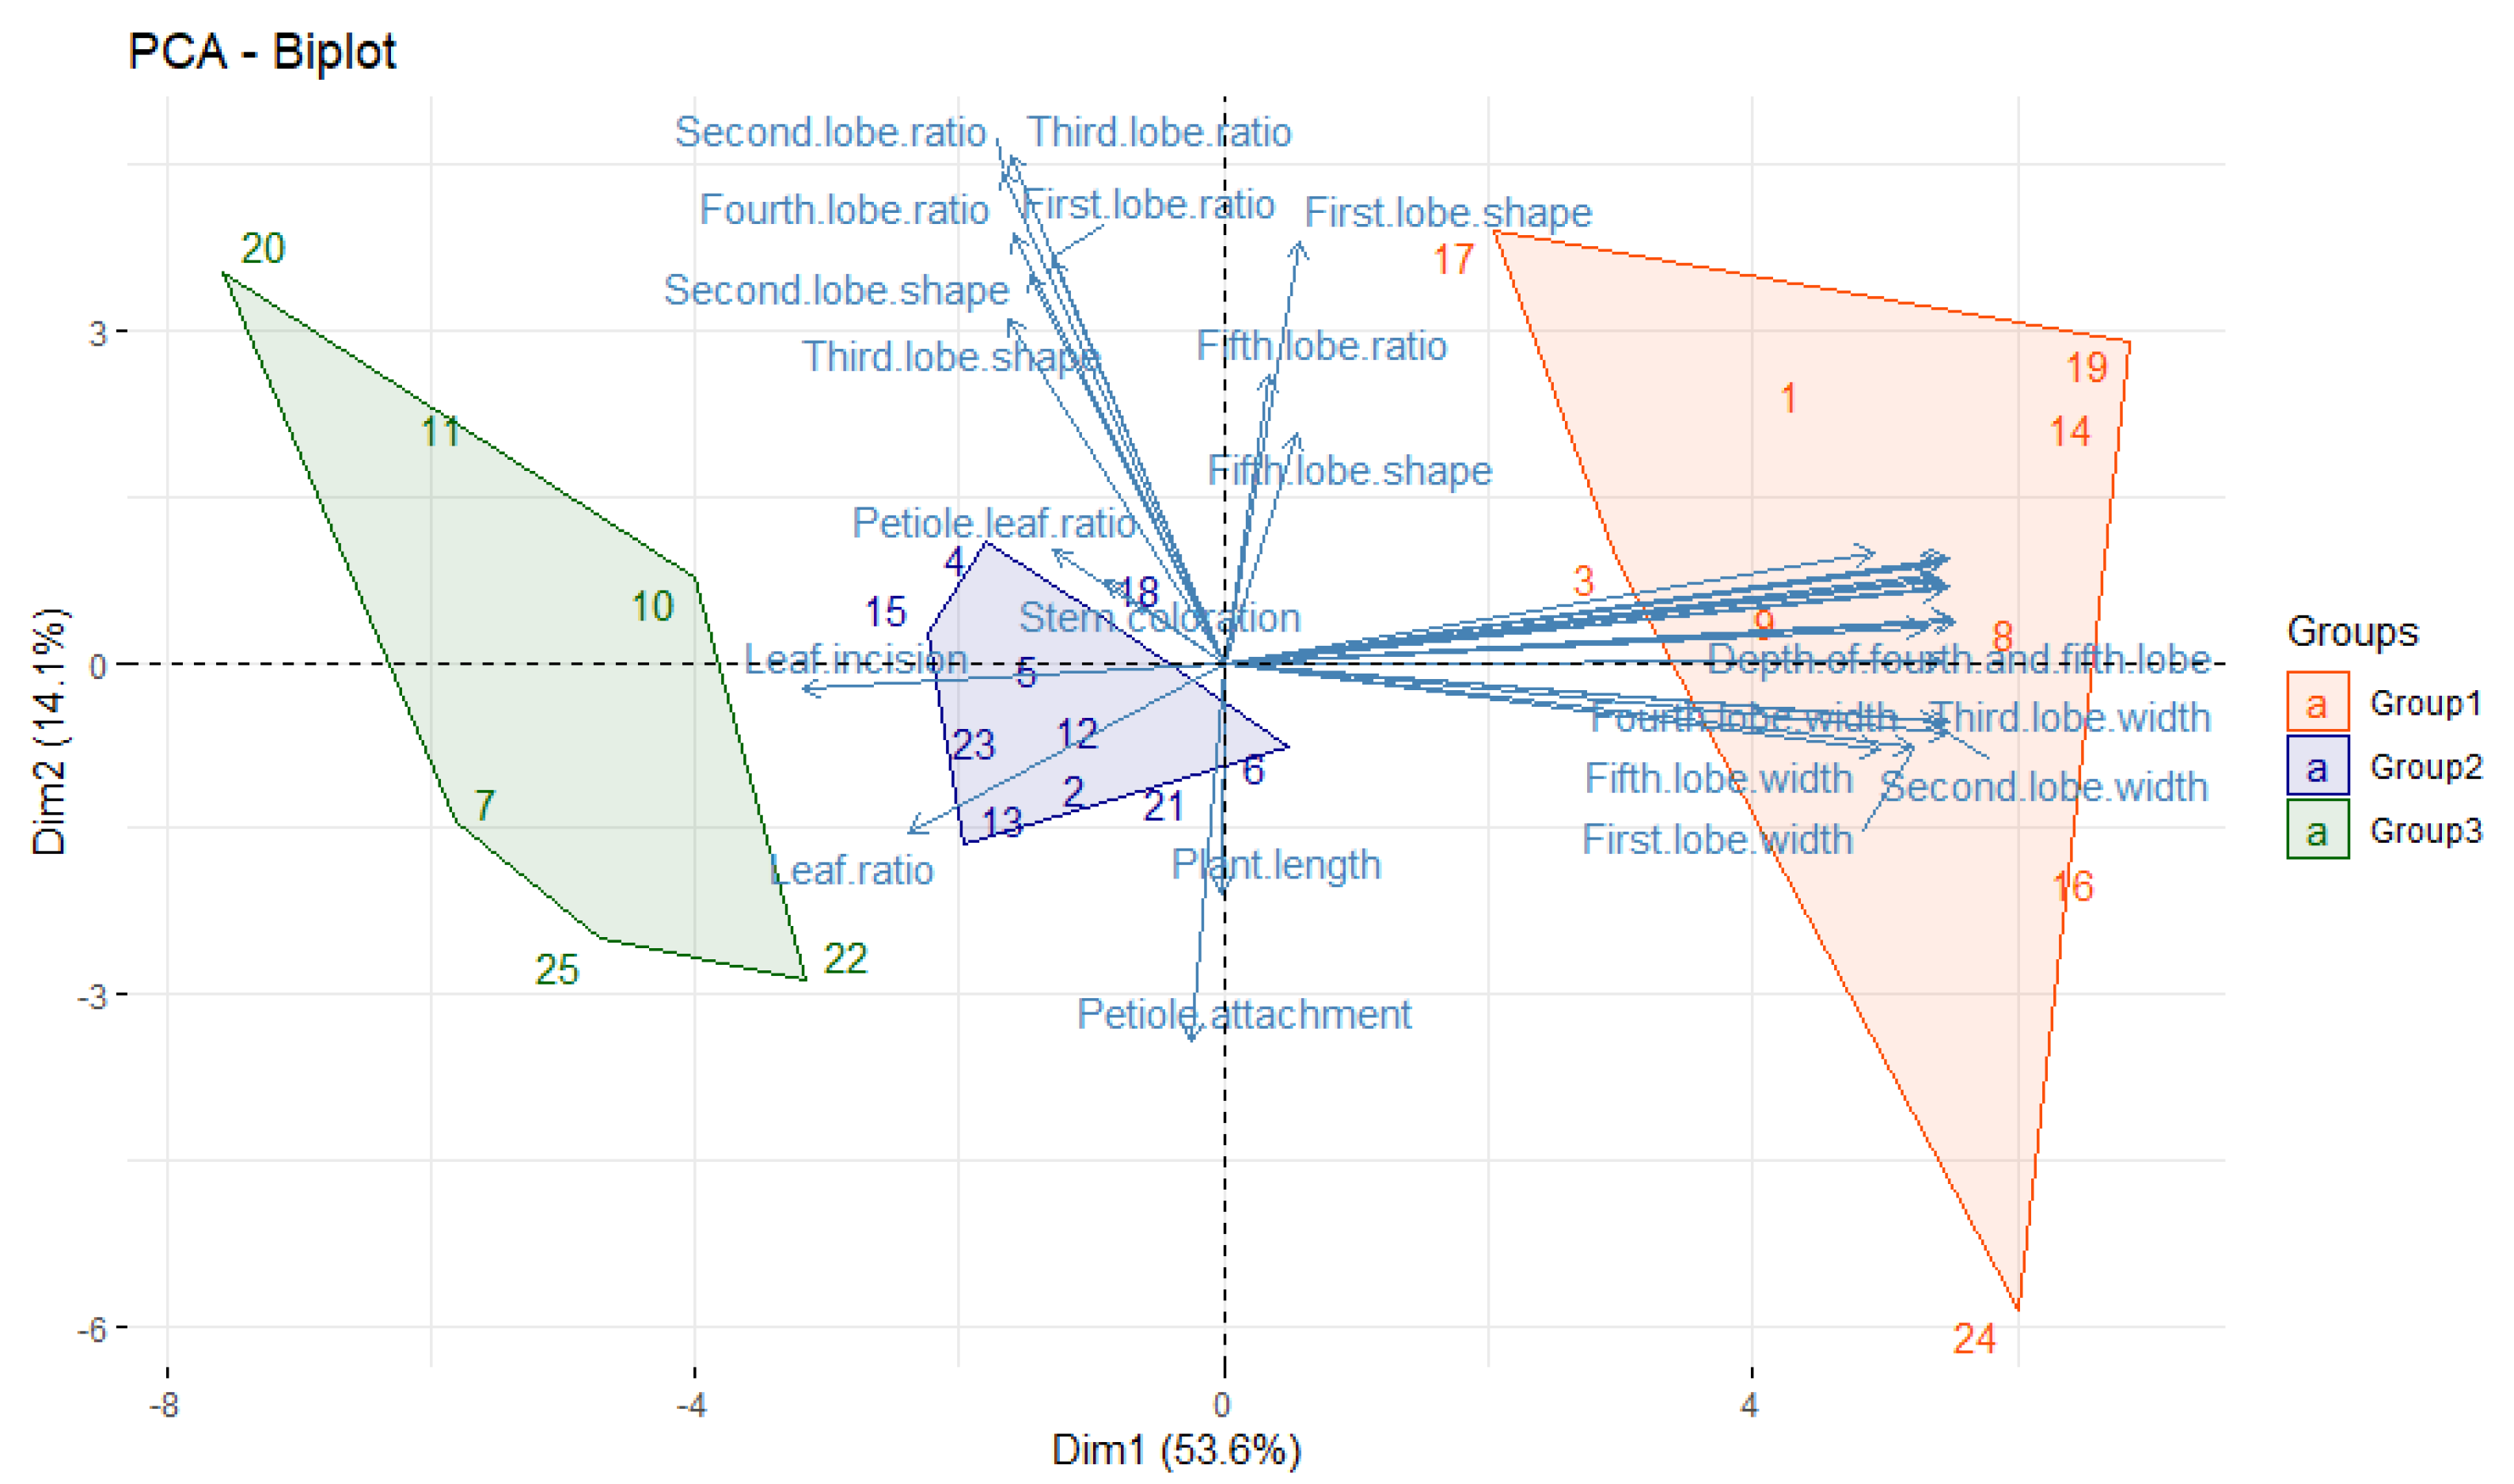
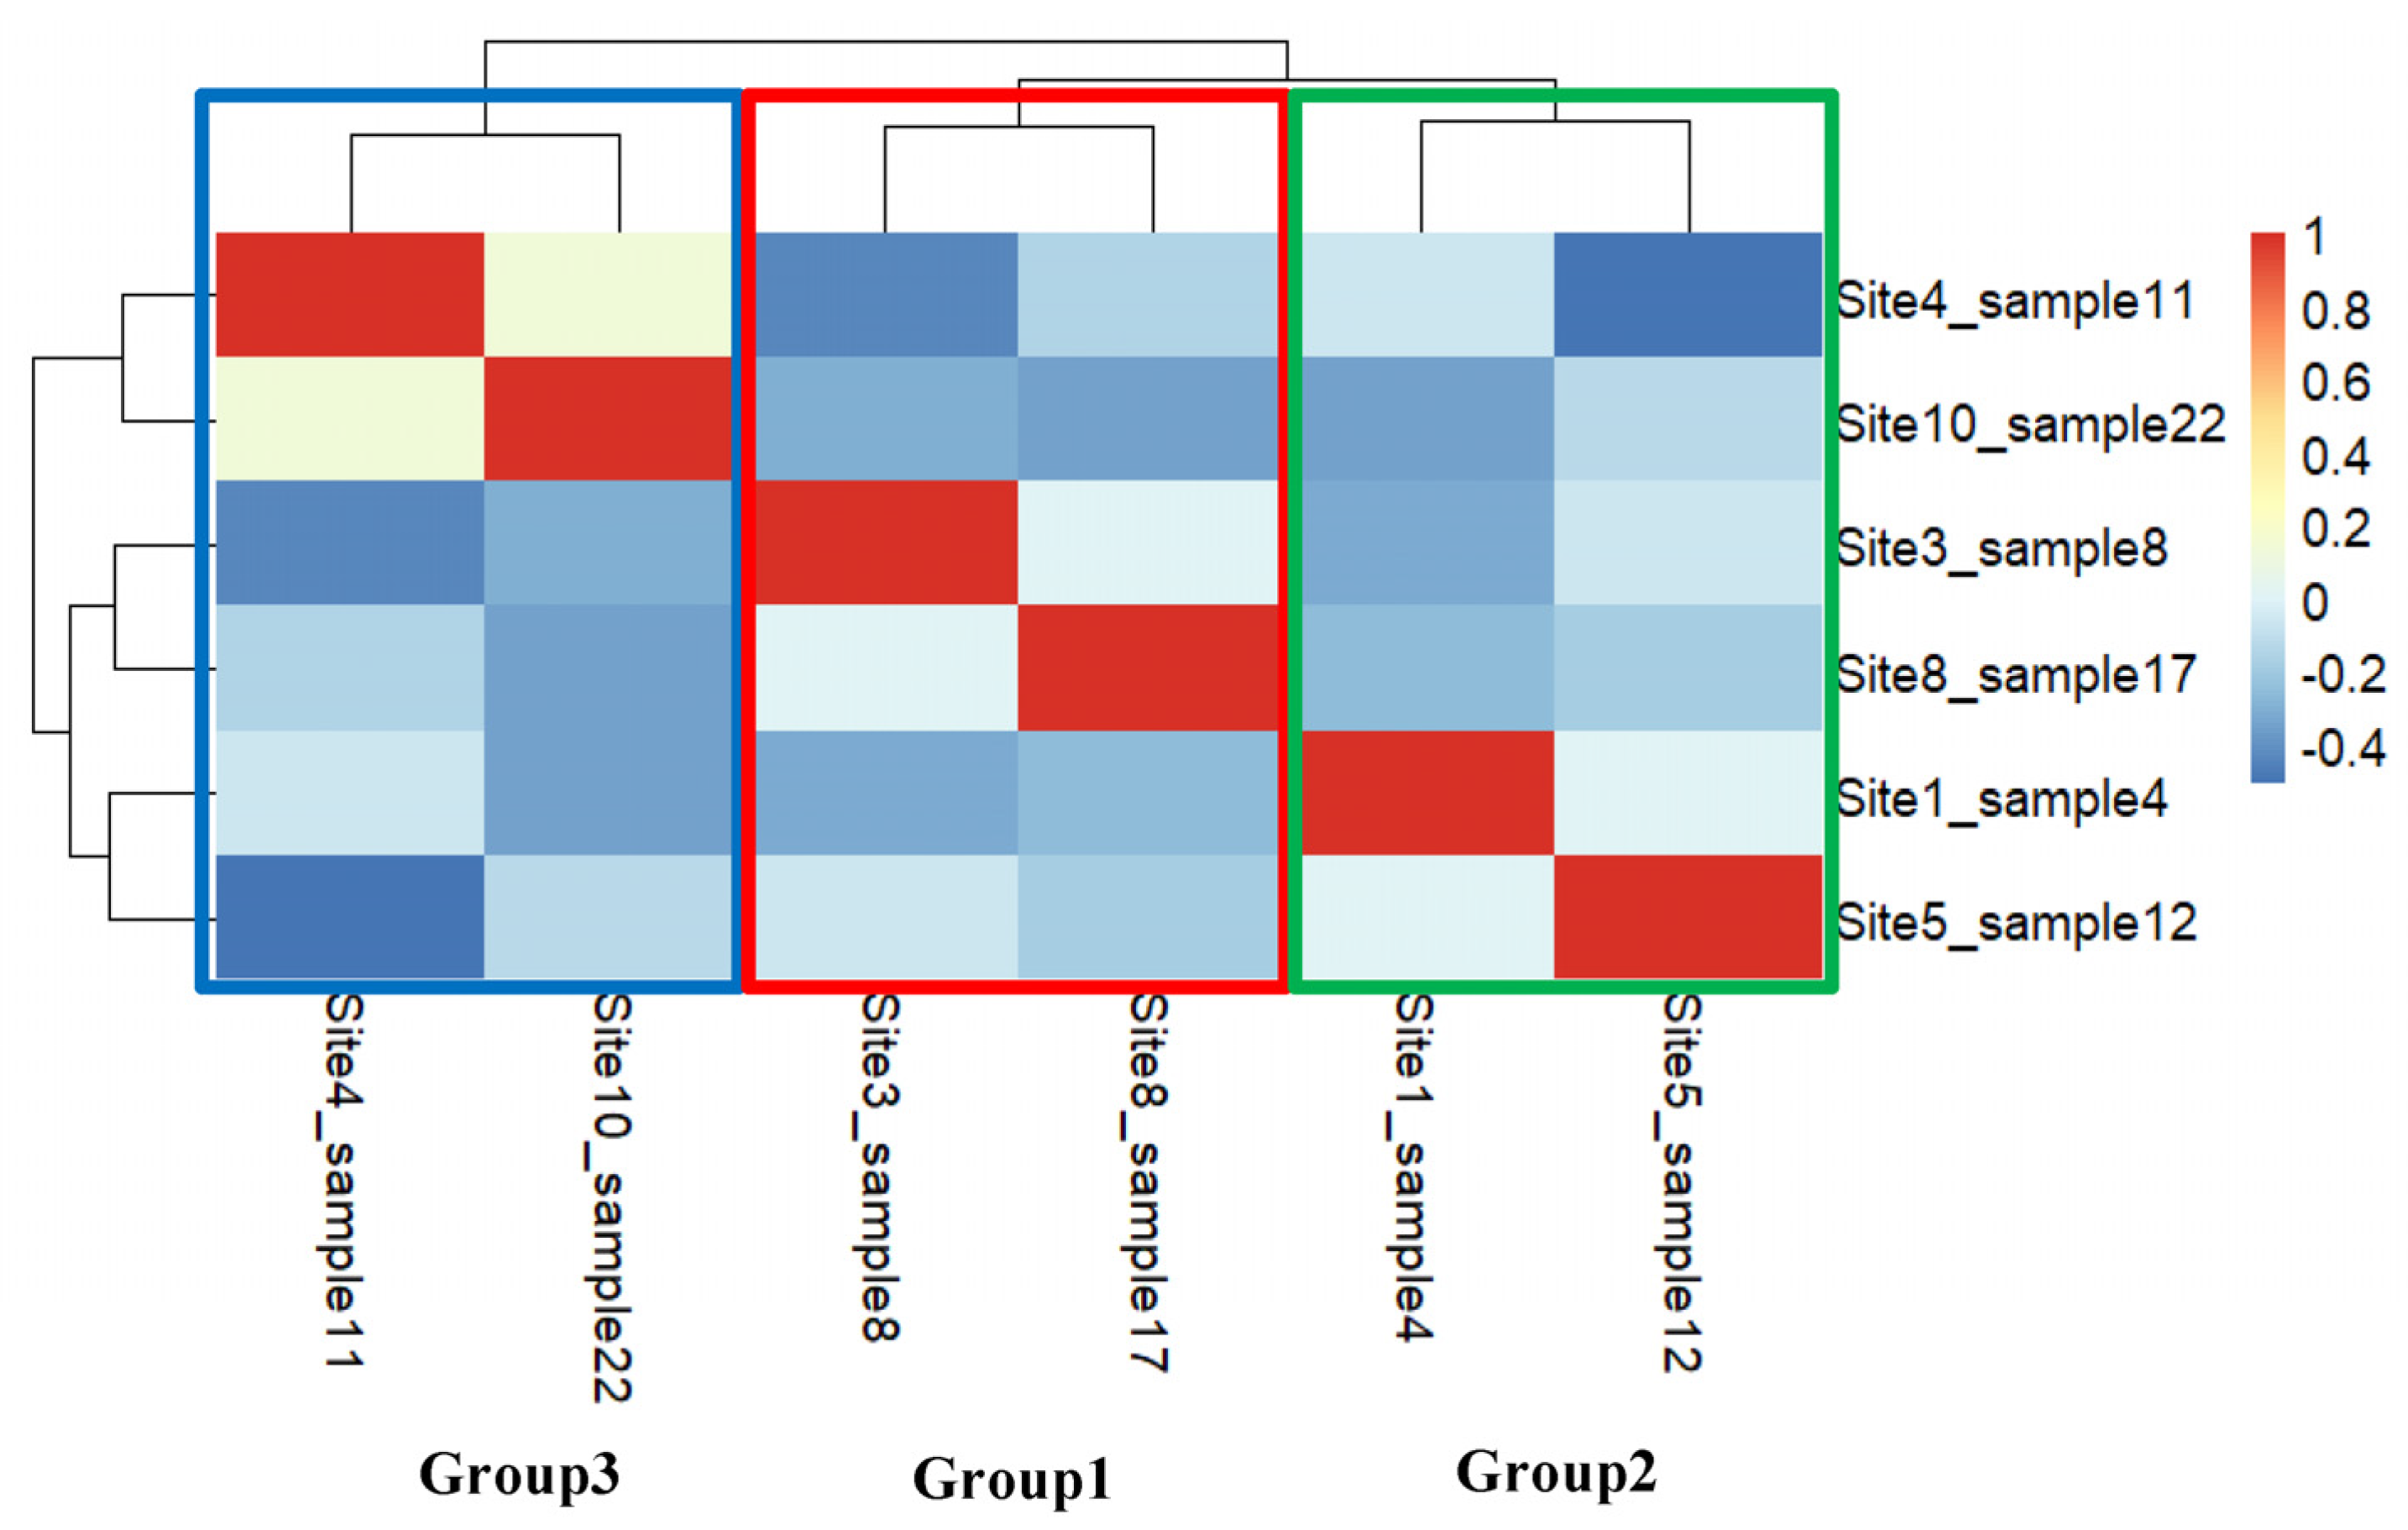
3.2. Multivariate Analysis

Twenty-five samples of R. communis were subjected to cluster analysis based on 34 quantitative and qualitative vegetative morphological characteristics. The agglomerative cluster analysis revealed two major clusters (Figure 3a). The first cluster represented group 1, which contained nine samples collected from sites 1, 3, 6, 7, 8 and 11. The second major cluster was divided into two subclusters; groups 2 and 3. Group 2 also comprised nine samples from sites 1, 2, 5, 8, 9 and 10, while group 3 contained the remaining samples from sites 2, 4, 6, 9, 10 and 11. The heatmap (Figure 3b) exemplified the overall variations between the investigated samples.
The principal component analysis (PCA) performed for the twenty-five samples (Figure 4), based on 27 quantitative characters, revealed that the first axis (Dimension 1) scored 56.5%, followed by the second axis (Dimension 2) that accounted for 12.8% of the total variation. The first axis separated group 1 and sample 6 (belonging to group 2) from groups 2 and 3. The second axis split samples of group 1 (except 16 and 24), samples 4, 5, and 18 of group 2, and samples 10, 11, and 20 from group 3. The significant characteristics attributed to the ordination of dimensions 1 and 2 and their correlation values are summarized in Table 3. For dimension 1, the highest contribution was for the leaf area (0.987), and the lowest was for the leaf length/width ratio (0.425). In contrast, dimension 2 recorded a higher correlation for the third lobe length/width ratio (0.818), and the lowest was the fifth lobe length/width ratio (0.463).
According to the cluster analysis, a one-way ANOVA was performed for the three resulting groups to indicate the statistically significant morphological characters (Table 4). There was a significant difference between the three studied groups for the following traits: leaf length, width and area, first lobe width, second lobe length and width, third lobe length and width, fourth lobe length and width, fifth lobe length and width, depth between first and second lobe, depth between second and third lobe, depth between the third and fourth lobe and depth between fourth and fifth.

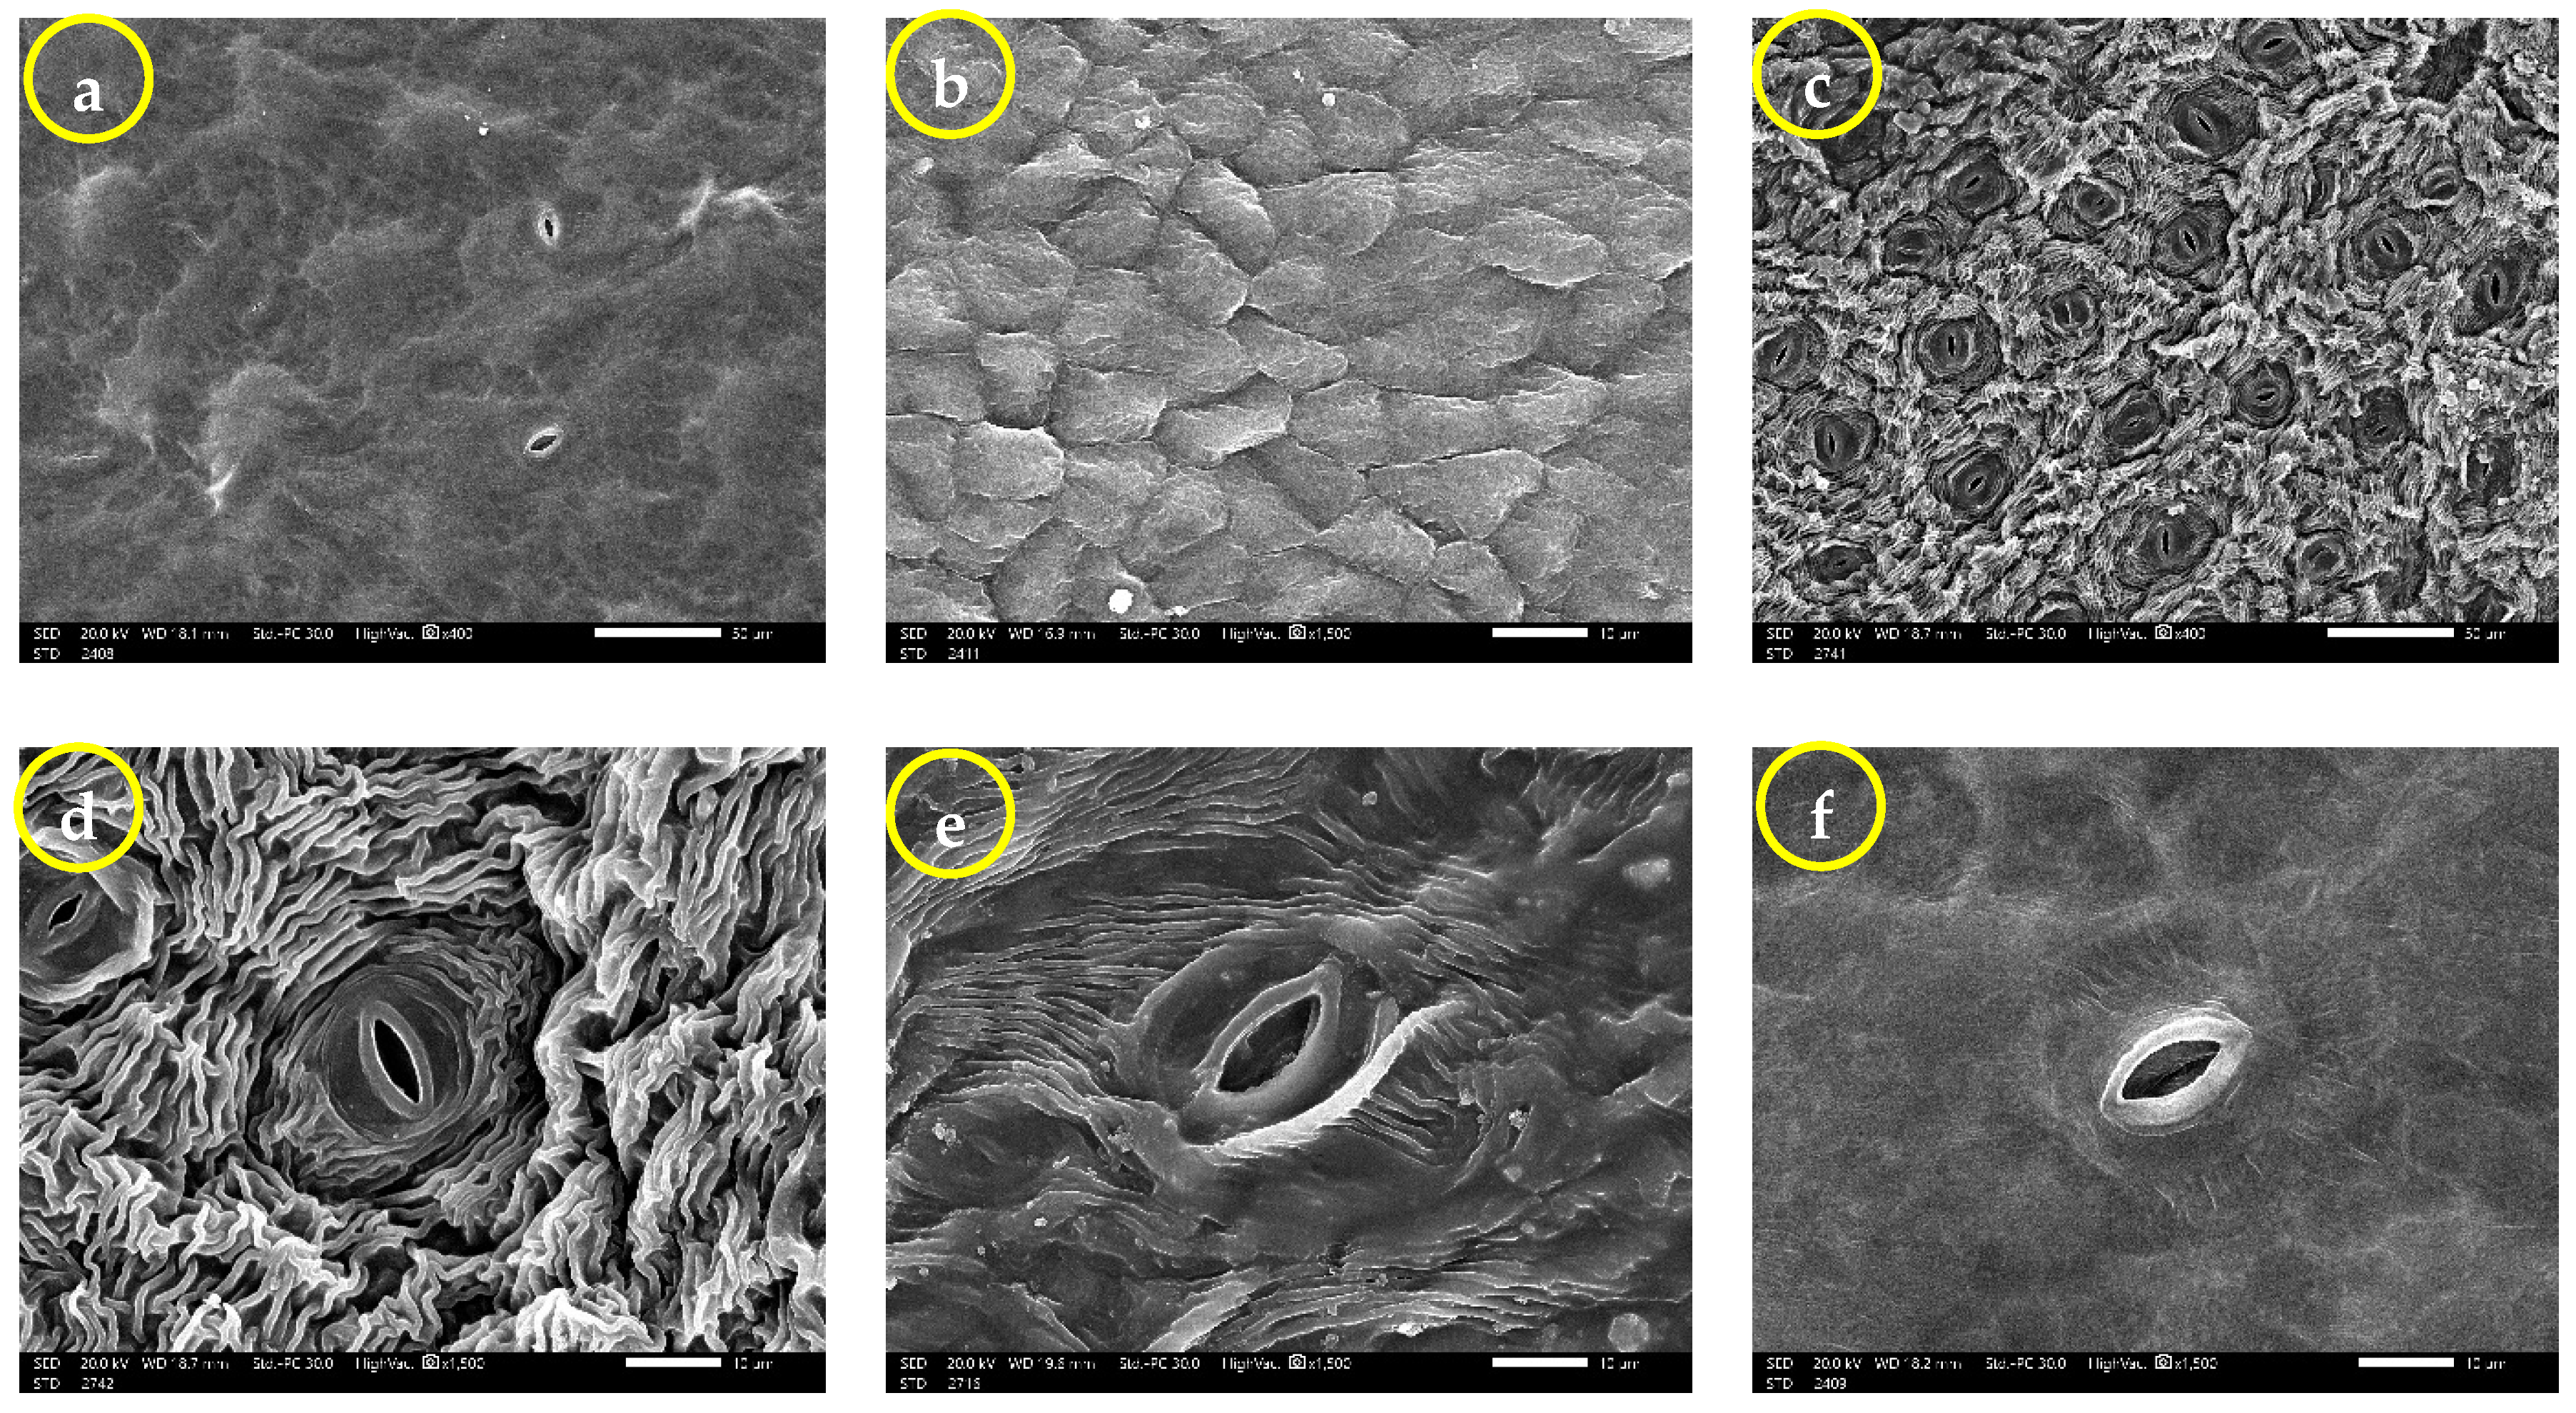
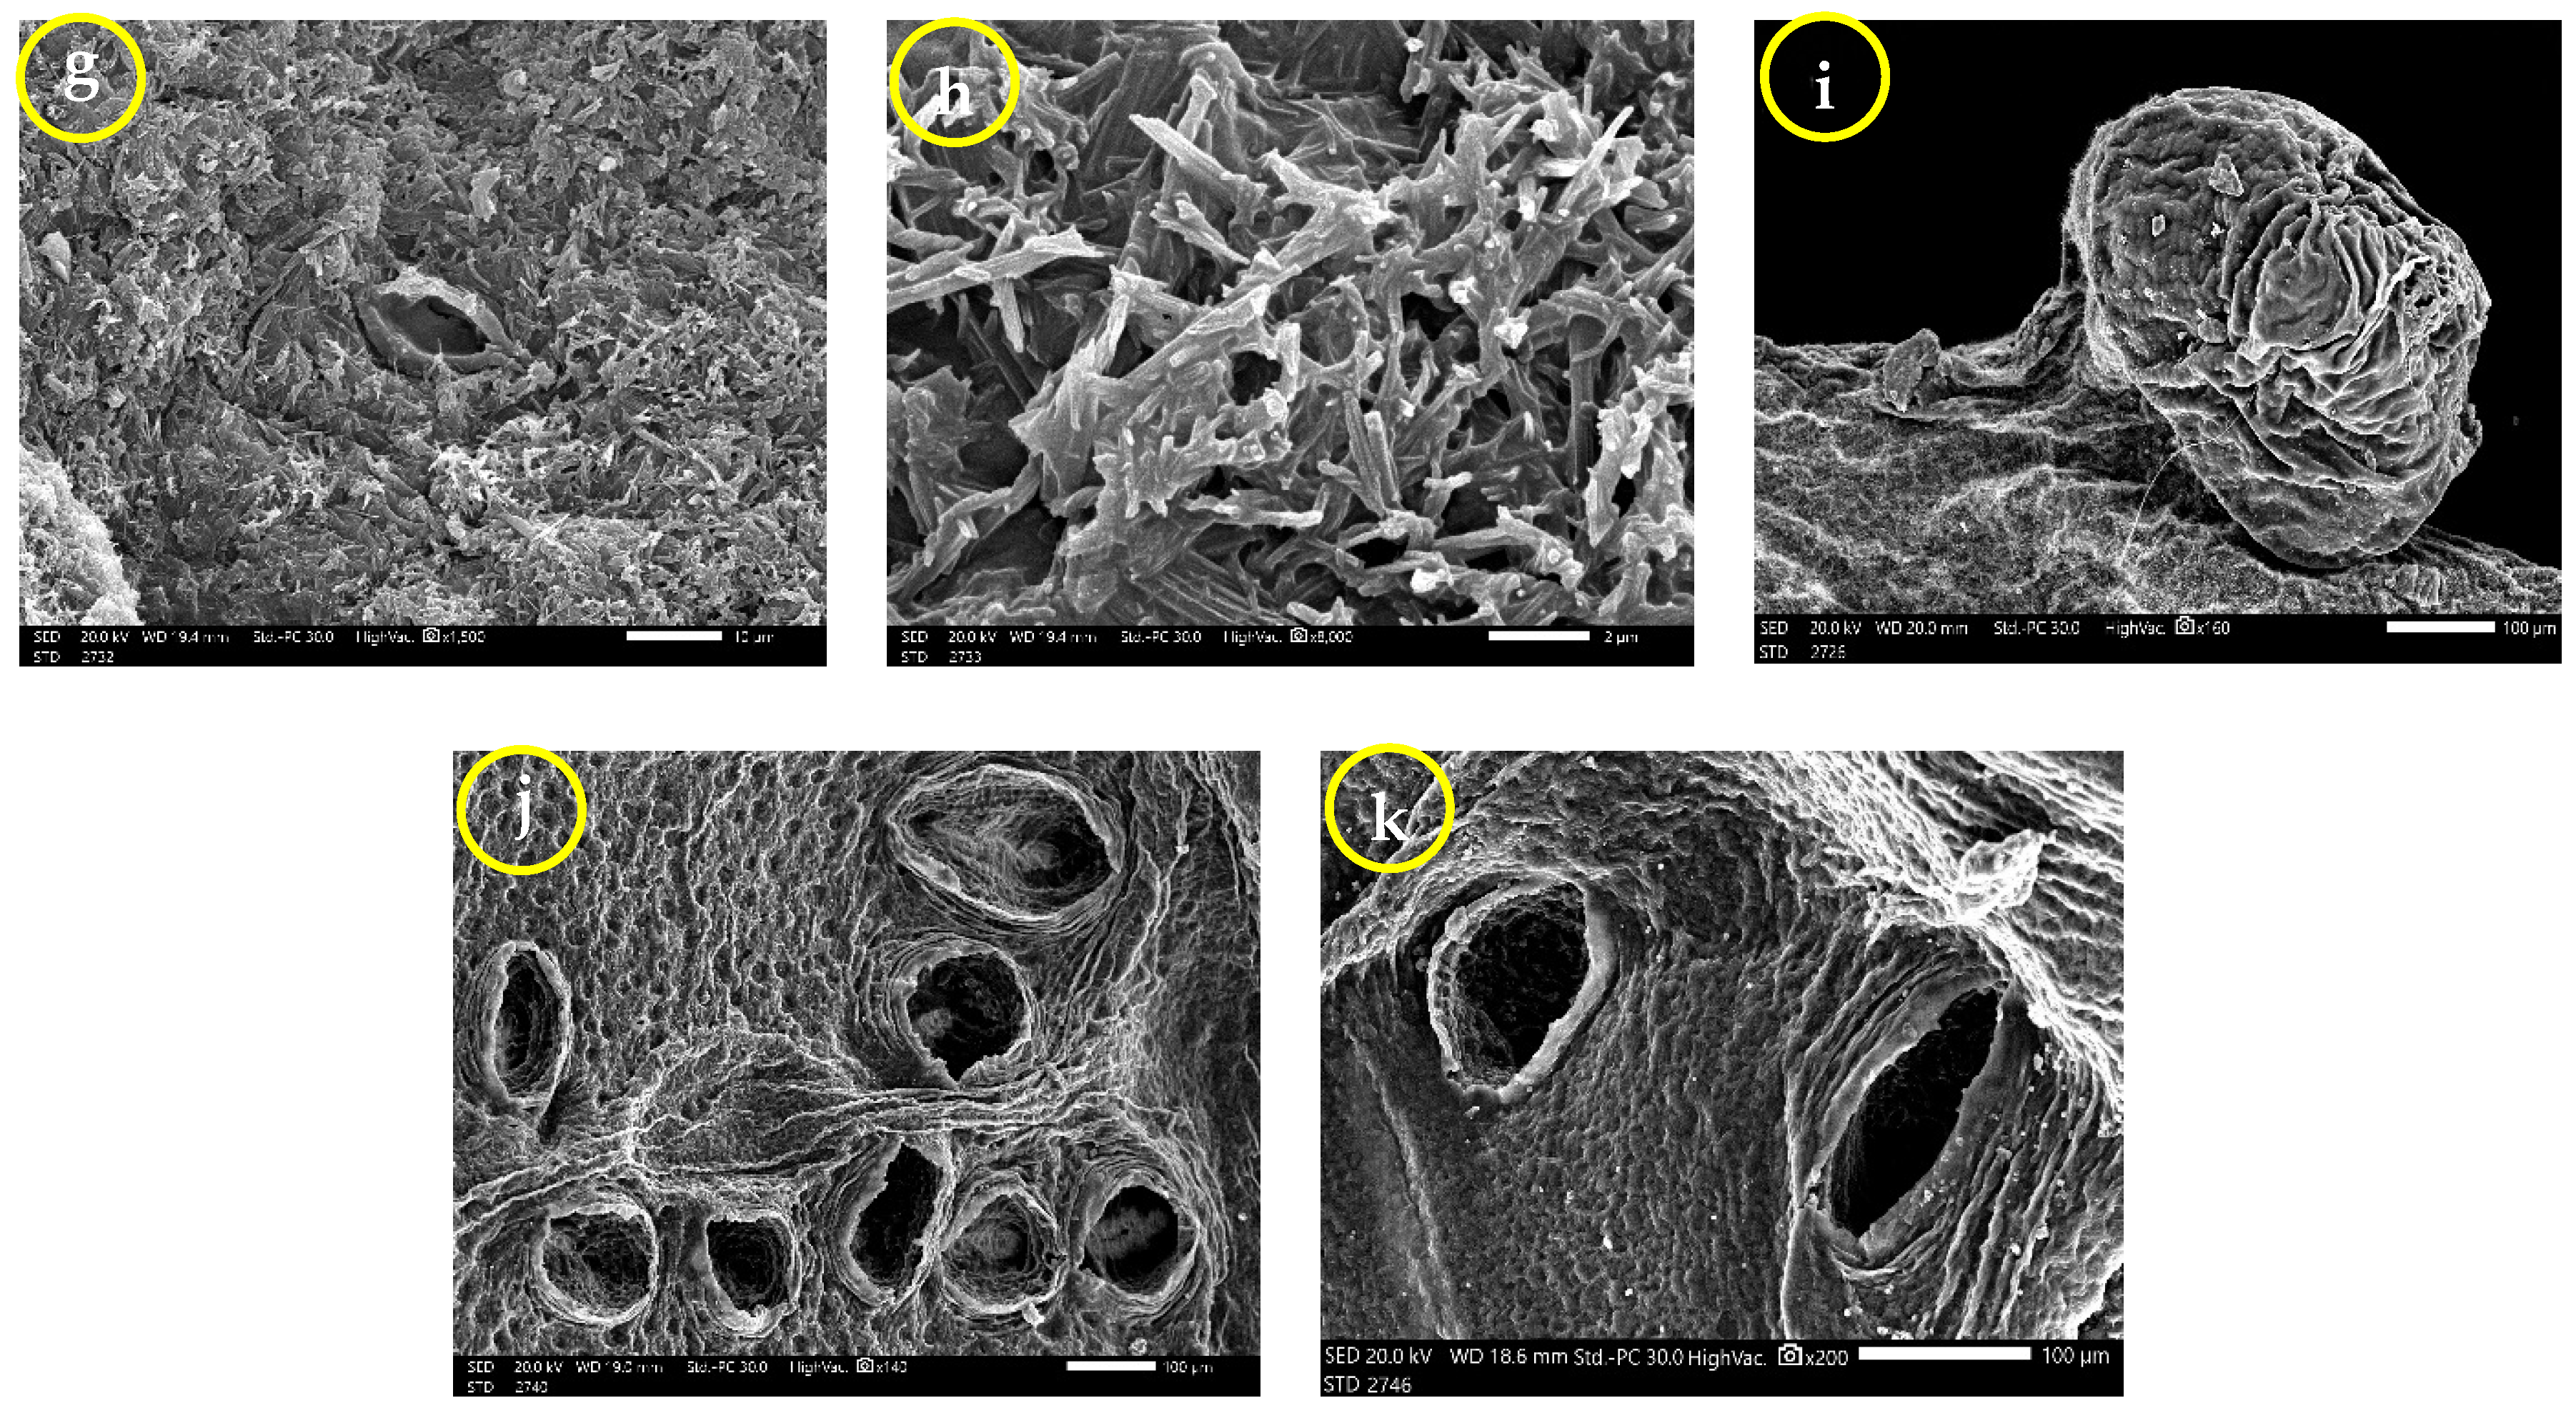
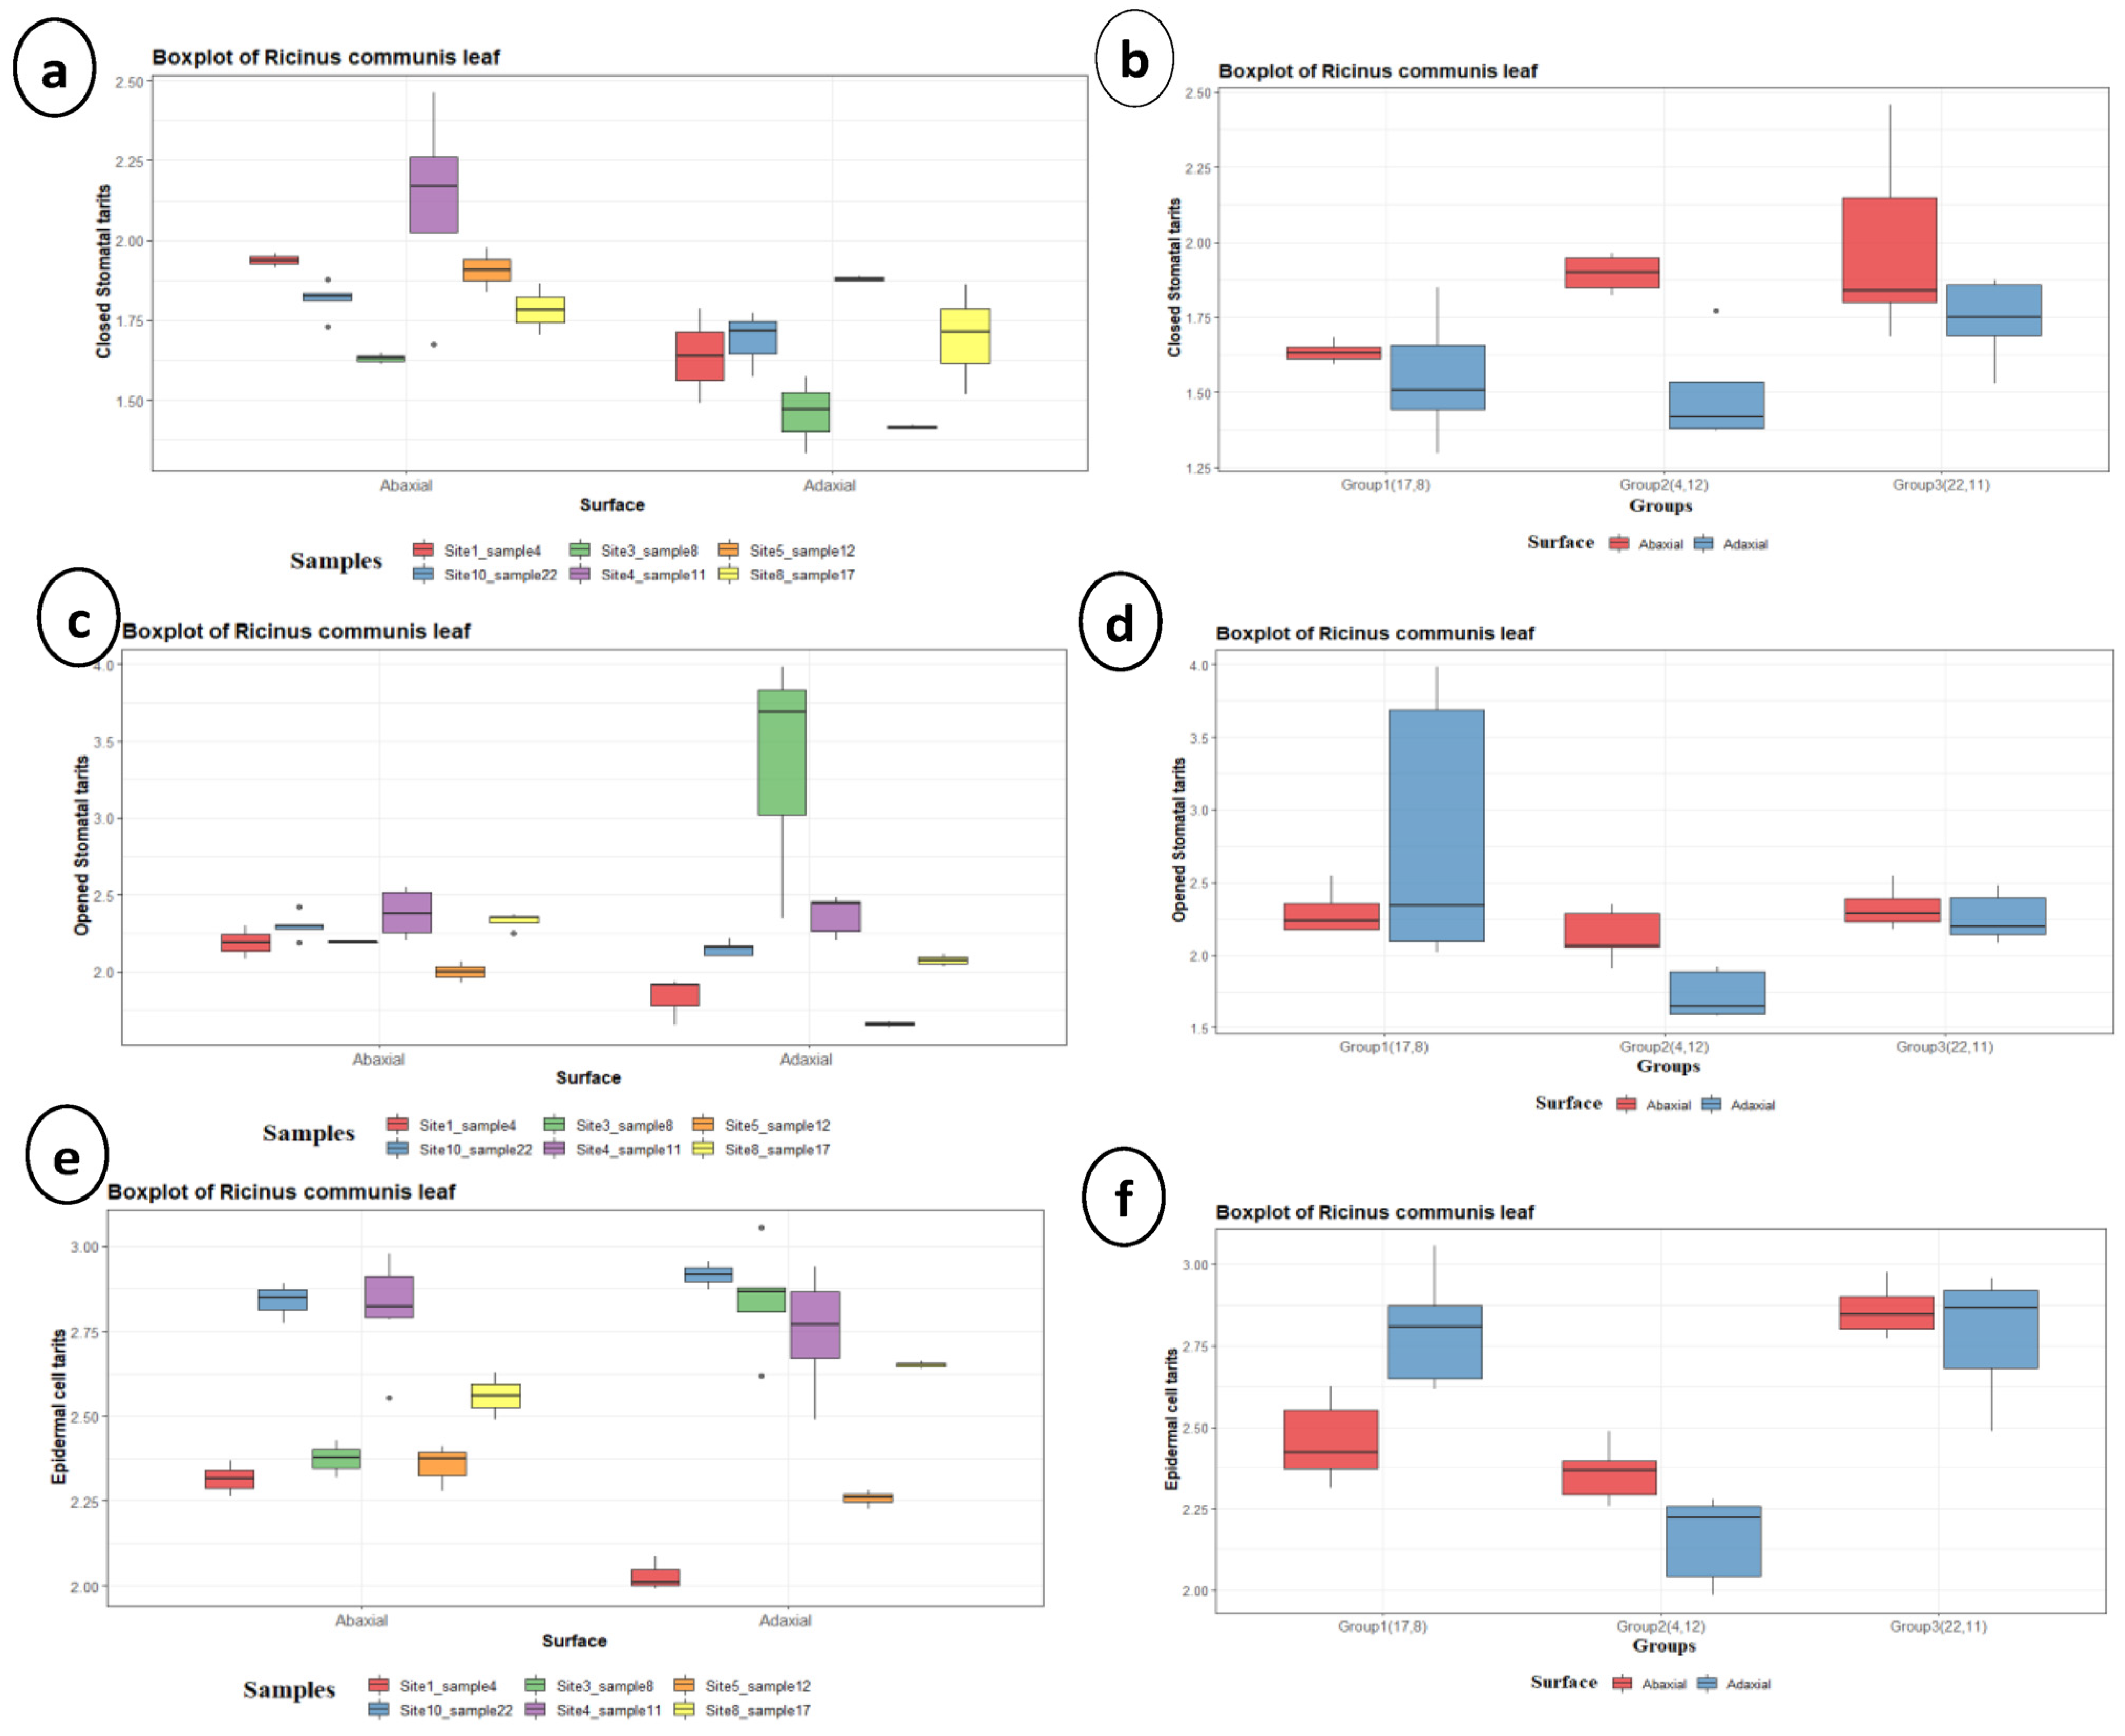
3.3. Leaf Surface Ultrastructure (SEM)
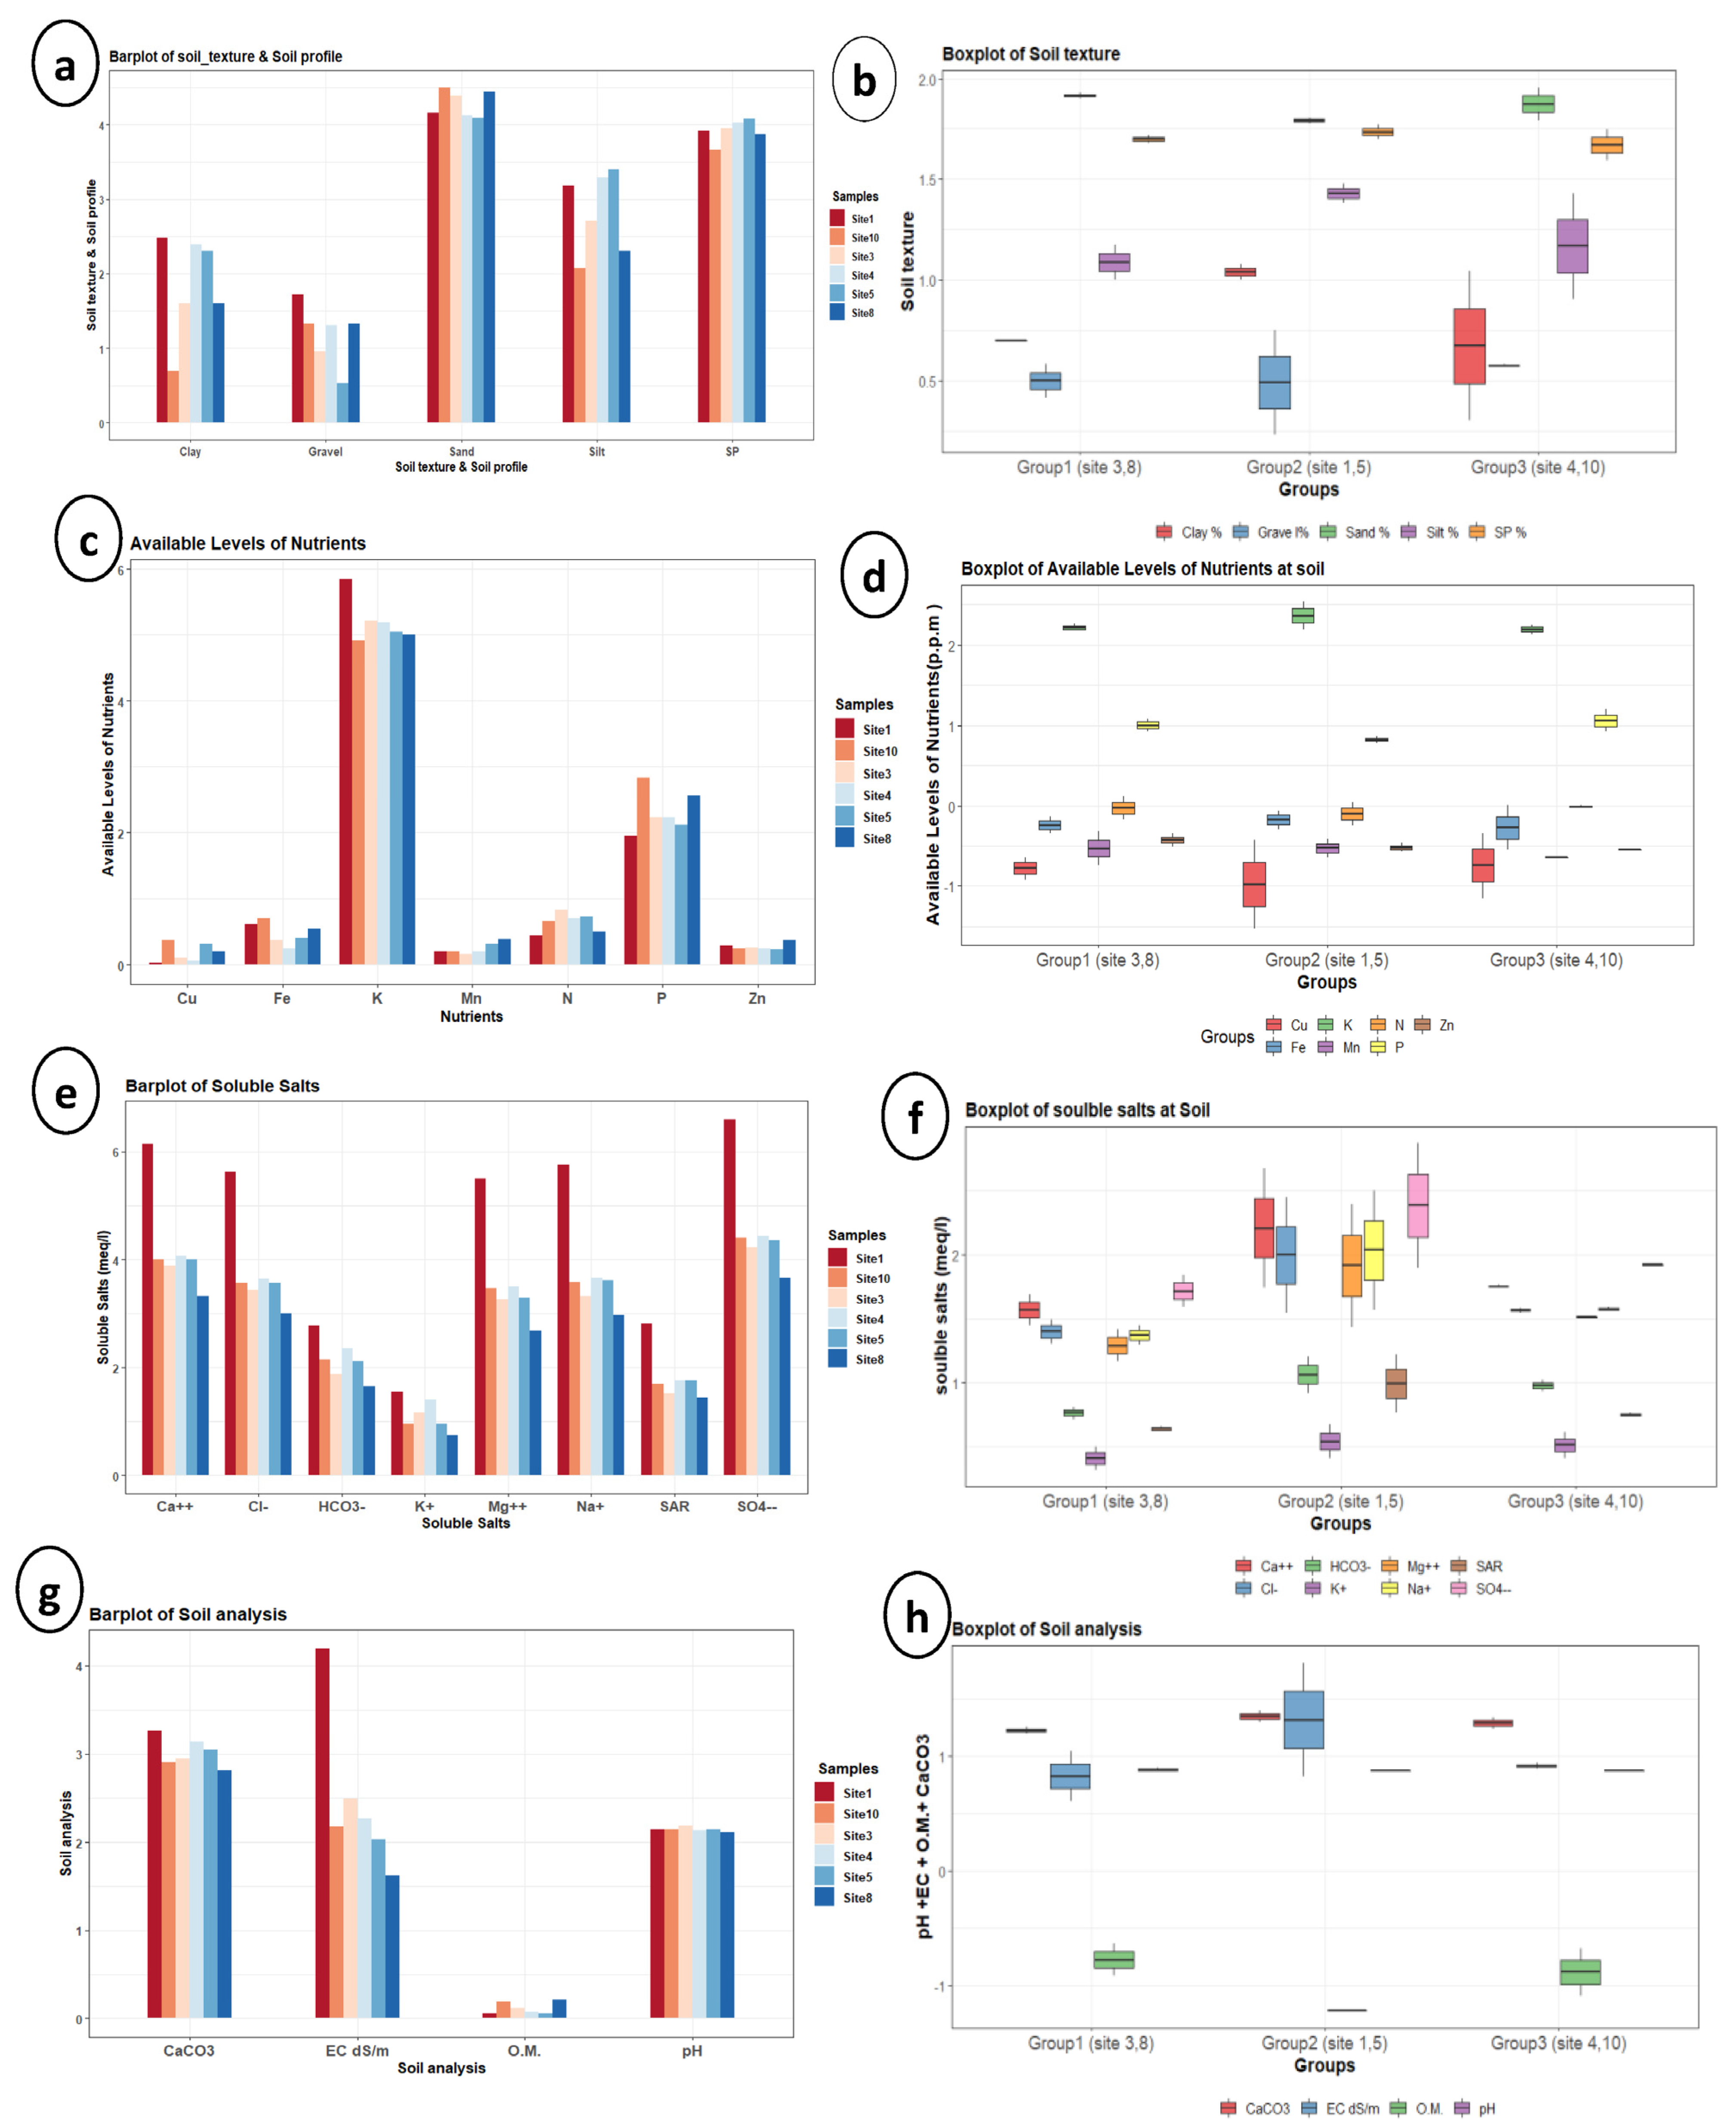
Six R. communis samples were selected from the three subclusters (groups) that resulted from the cluster analysis based on vegetative morphology, illustrated with red asterisks in Figure 3a. The quantitative leaf ultrastructure characters of the six selected R. communis samples are represented in Supplementary Table S2. Ricinus communis has an amphistomatous leaf; however, the stomatal count on the abaxial surface is higher than that of the adaxial one at a unit area (2560 × 1920 µm2). The one-way ANOVA demonstrated that the stomatal length, width, and area at the closed state and the epidermal cell length/width ratio significantly differed between the abaxial and the adaxial surfaces (Supplementary Table S3).
The epidermal cell outline was undistinguishable (Figure 5a), isodiametric, pentagonal, hexagonal (Figure 5b), or oblong, and more or less arranged (Figure 5c). The anticlinal wall was straight, and the relief of the cell boundary was channeled. A convex periclinal wall was observed in the examined samples (Figure 5b,c). Generally, the fine relief of the periclinal wall was striate with different densities. A densely striate periclinal wall was detected in sample 22 on both surfaces and sample 12 on the AD surface (Figure 5d). Moderate striations were found on the AB surface of sample 11 (Figure 5e). Conversely, the remaining samples exhibited sparsely striated elements (Figure 5f). Furthermore, the AB surface of sample 4 showed rodlets of epicuticular crystalloid wax (Figure 5g), where the average length of the rodlets was 2.18 ± 1.5 µm, and their average width was 0.42 ± 0.2 µm (Figure 5h). Rarely, a sessile gland was found on the AB surface near the tips of the margin’s teeth but not associated with every tooth (Figure 5i). The average gland size was 311.038 ± 9.69 × 354.8495 ± 111.99 µm. The paracytic stomata had smooth guard cell surfaces and elliptic pore shapes (Figure 5a–g).
Anomalous stomata were noticed in their opened state on both leaf surfaces of samples 8 and 12 (Figure 5j,k, respectively). At the AB surface, the stomatal size was 166.47–286.33 × 94.33–175.33 µm, and their area was 15,004.28–39,840.30 µm2. The stomatal pore size was 143.68–250.68 × 70.55–133.05 µm, and its area ranged from 8122.01 to 21,468.05 µm2, while at the AD surface, the measured stomatal size was 139.60–333.94 × 88.83–150.85 µm and its area was 10,707.04–35,927.39 µm2. Its pore size was 120.99–235.04 × 54.20–122.28 µm, and the pore area was 6063.53 to 20,388.87 µm2.
For the AB surface, the stomatal size with the closed pore was 7.66–27.74 × 2.94–12.05 µm, and its area varied from 27.01 to 246.55 µm2 (Figure 6a), showing the most variation between all samples, while the stomatal size with an opened pore was 11.24–24.54 × 4.81–13.20 µm with a pore size is 6.99–19.98 × 2.23–8.55 µm. The stomatal and pore areas were in the range of 42.04–207.88 µm2 and 12.58–90.10 µm2, respectively (Figure 6c), showing the low variation between all samples. The epidermal cell parameters (in terms of mean ± SD) were as follows: the length was 28.85 ± 7.04 µm, the width was 14.12 ± 4.75 µm, and the area was 427.52 ± 246.17 µm2 (Figure 6e), showing the significant variation between all samples.
For the AD surface, showing a significant difference between all samples, the stomatal size with the closed pore was 5.82–13.17 × 2.66–6.30 µm, and its area varied from 10.24 to 56.13 µm2 (Figure 6a), while the stomatal size with an opened pore was 6.76–132.49 × 3.38–65.73 µm with a pore size is 4.13–116.03 × 1.13–33.07 µm. The stomatal and pore areas were in the range of 16.95–6780.36 µm2 and 3.30–2403.10 µm2, respectively (Figure 6c). The epidermal cell length was 26.36 ± 9.19 µm, the width was 16.04 ± 6.00 µm, and the area was 451.23 ± 287.98 µm2 (Figure 6e).
The two-way ANOVA (Table 5) showed a significant difference in the epidermal cell width and area of group 1 (samples 8 and 17), between their abaxial and adaxial surfaces (Figure 6f). Group 2 (samples 4 and 12) exhibited significant variation for the following characteristics: closed stomata length and area; opened stomata length, width and area; stomatal pore length and area; epidermal cell length and length/width ratio (Figure 6b,d). In contrast, group 3 (samples 11 and 22) showed no significant difference between the two surfaces. The number of stomata, closed stomata width, and the opened stomata length/width ratio represented non-significant variation for each group (Figure 6b,d,f).

3.4. Soil Analysis

The soil physicochemical properties of the studied sites (1, 3–5, 8, and 10) are illustrated in Table 6. The mechanical analysis revealed that the studied sites have calcareous loamy sand with a saturation percentage between 39 (site 10) and 59 (site 5). The highest pH was recorded for site 3 (7.91), and the lowest was 7.3 for site 8. The electrical conductivity ranged from 4.05 dS/m (site 8) to 65 dS/m (site 1). Site 1 showed the highest EC (65.55 dS/m) and the highest concentration of Ca++, Mg++, Na+, K+, HCO3, Cl, SO4−− (464, 246, 315, 4.7, 16, 278, and 735.7 meq/L, respectively), SAR (16.7), available K (348 ppm), and CaCO3 (25%), while site 8 showed the lowest EC (4.05 dS/m) and the lowest concentration of Ca++, Mg++, Na+, K+, HCO3, Cl, SO4−− (28.0, 14.6, 19.6, 2.1, 5.2, 20.2, and 38.9 meq/L, respectively), SAR (4.2), and CaCO3 (15.7%). The lowest values of organic matter (0.06%), available nitrogen (0.56 ppm), and available phosphorus (6 ppm) were recorded at site 1. The highest concentration of available phosphorus (16 ppm), and the lowest available potassium (137 ppm) was detected at site 10. Minor concentrations of iron, zinc, manganese, and organic matter were recognized in the studied samples. Bar plots and boxplots of soil traits per site and group are illustrated in Figure 7. The one-way ANOVA of the soil traits showed non-significant variation for the three studied groups (Supplementary Table S4).

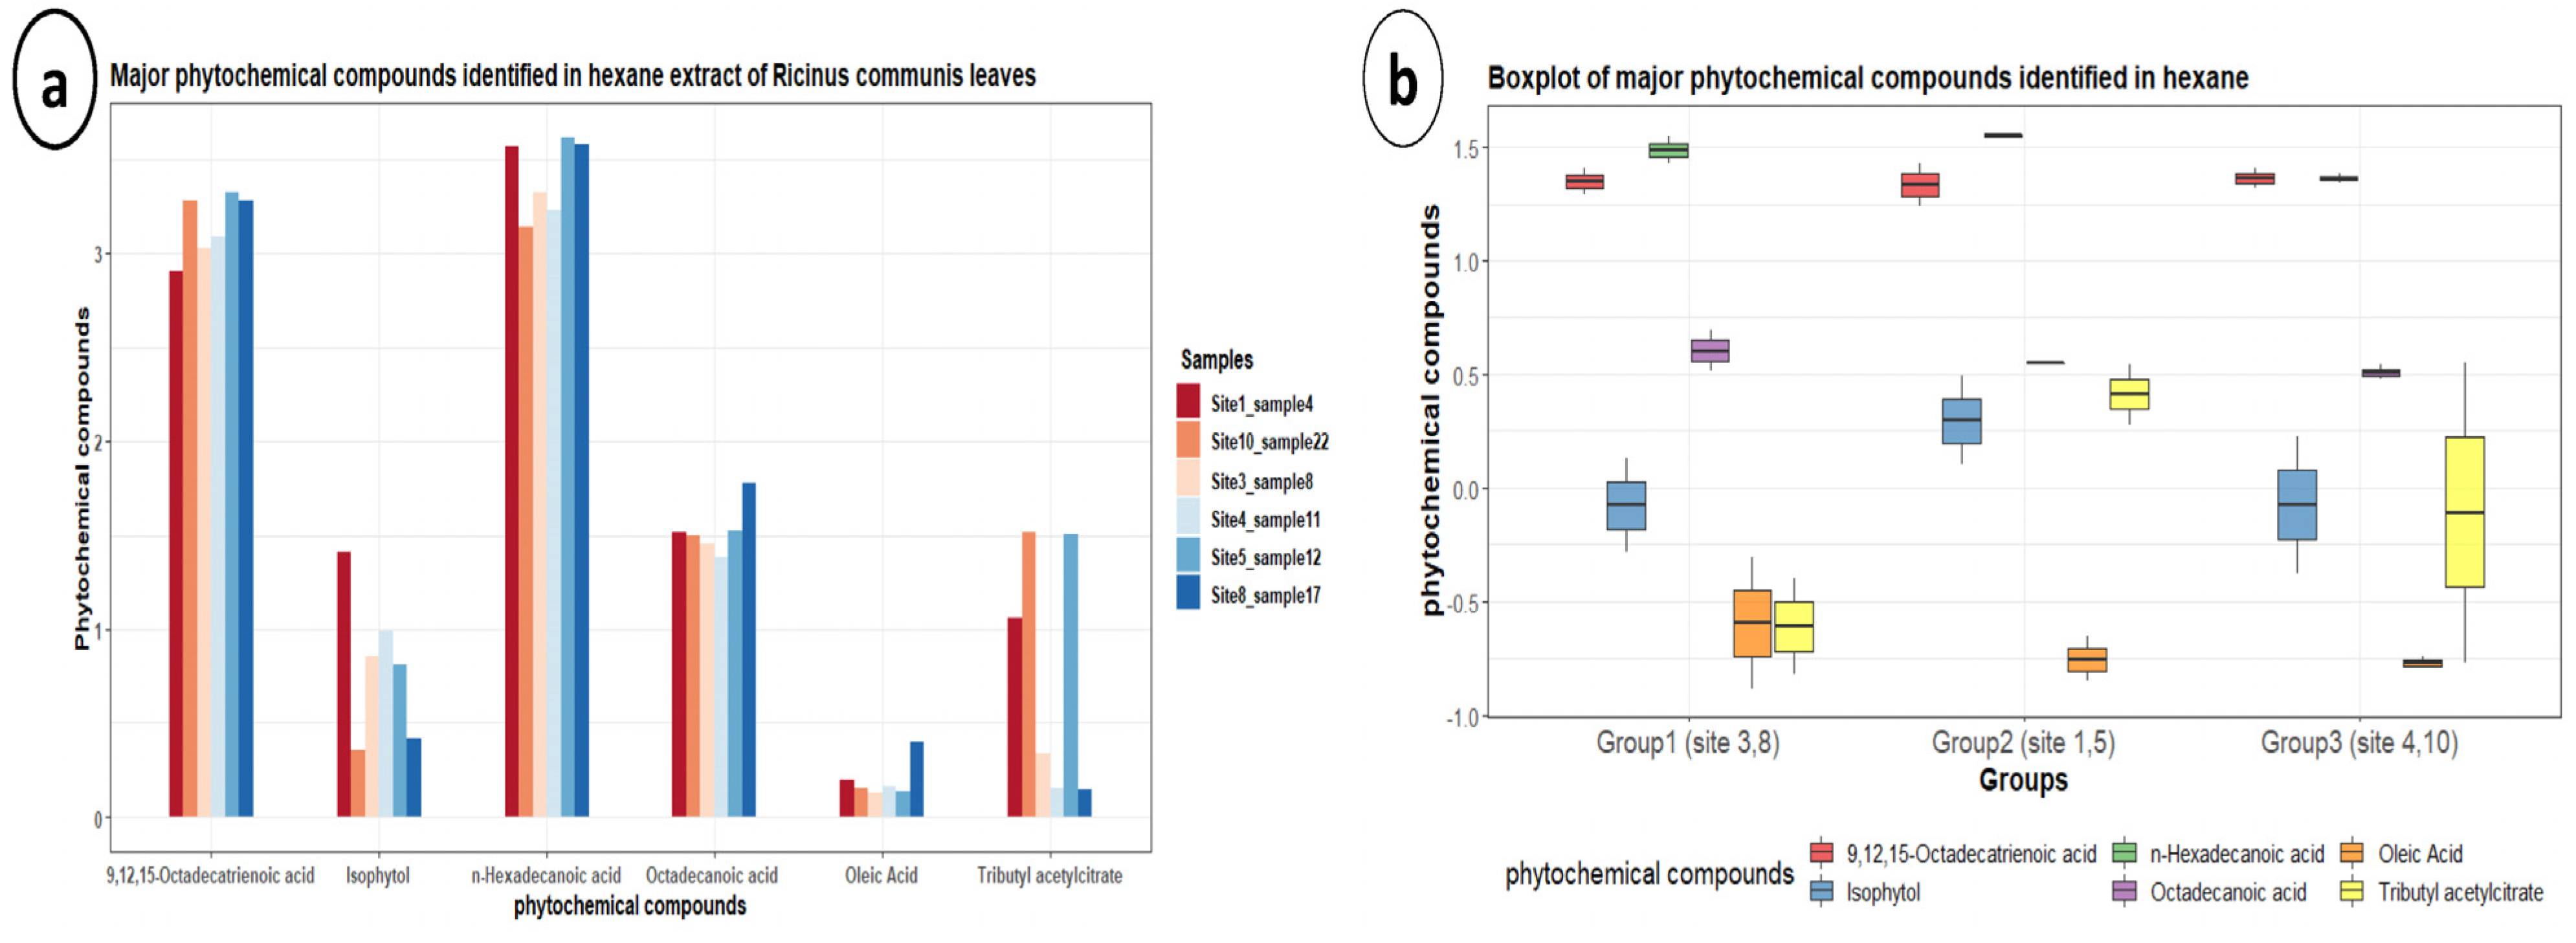
3.5. Gas Chromatography-Mass Spectrometry (GC-MS)

The hexane extracts of R. communis samples using GC-MS are presented in Table 7. The total ion chromatograms are shown in Figure 8. The peaks were distributed at a retention time of 6.36–34.31. Comparing the analytical data revealed differences in the quantitative composition of phytochemicals between different samples.
Six major common compounds were detected in the chromatograms of the studied samples. Oleic acid represented the lowest values for the studied samples. The highest percentages for n-Hexadecanoic acid (36.25%) and 9,12,15-Octadecatrienoic acid (26.86%) were recorded in the hexane extract of site 5, whereas their lowest values were recorded for sites 10 and 1, respectively. The highest concentration of Isophytol was detected for site 1 (3.08%), and the lowest was site 10 (0.42%). Octadecanoic acid had its highest value (4.94%) for site 8 and the lowest (3.0%) for site 4. The highest concentration of Tributyl Acetylcitrate was found in site 10 (3.55%), and the lowest was 0.15 in site 8. Bar plots and boxplots of the identified phytochemical compounds concentrations per site and group are illustrated in Figure 9. The one-way ANOVA of the phytochemical concentrations exhibited non-significant variation for the three studied groups (Supplementary Table S5).

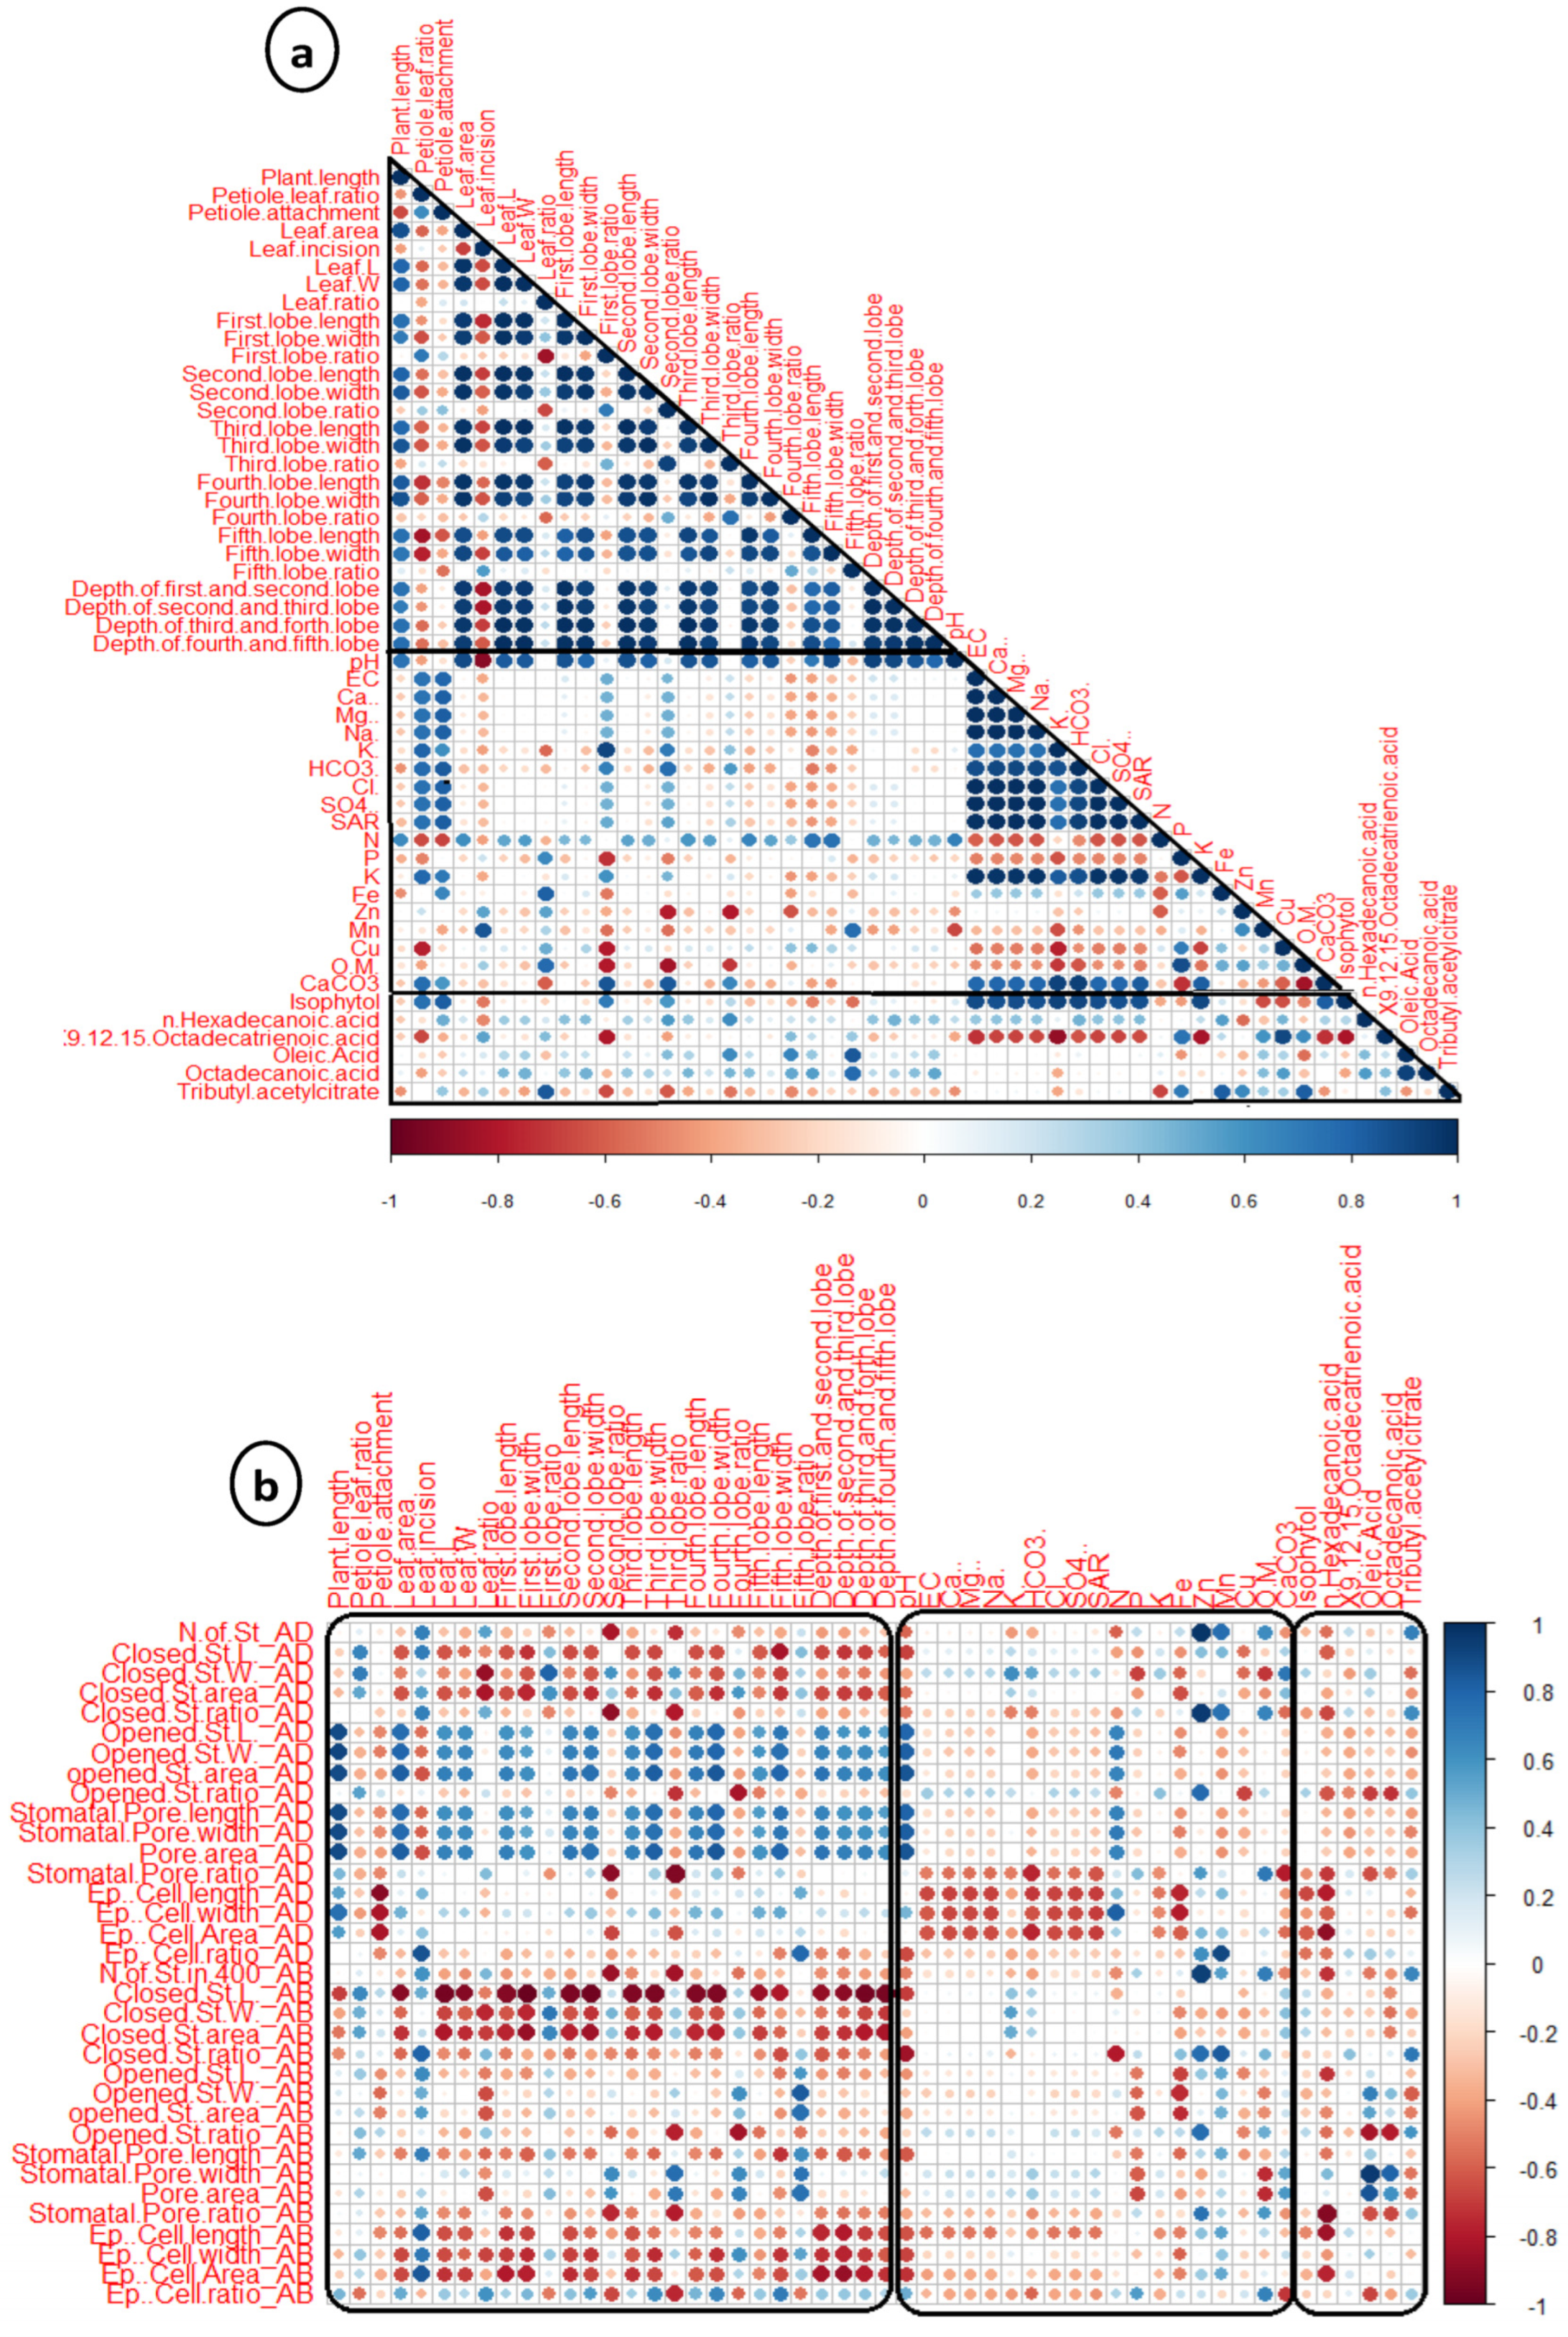
3.6. Correlation Analysis

Pearson’s correlation analysis was performed to explore the relationship and correlation between examined parameters (the macro- and micromorphological characters, soil analysis, and chemical composition) (Figure 10a,b). The results showed a significant positive correlation (p ≤ 0.05) between vegetative morphological traits, which confirms the discrimination of the resulting groups (morphotypes).
Plant length showed a positive correlation with leaf size parameters (length, width, and area), the length and width of each lobe, depth between first and second lobe, depth between second and third lobe, depth between third and fourth lobe, depth between fourth and fifth lobe, pH, and N. The leaf size parameters and lobes dimensions (first and second lobe dimensions, and the third, fourth and fifth lobe lengths) positively correlate with the soil pH and nitrogen content. A positive correlation exists between petiole length/leaf length ratio and petiole attachment against EC, soluble salts (Ca++, Mg++, Na+, K+, HCO3, Cl, and SO4−−), CaCO3, SAR, and isophytol. Phosphorus negative correlated with EC, soluble salts (Ca++, Mg++, Na+, K+, HCO3, Cl, and SO4−−), CaCO3, SAR, N, Fe, Zn++, and Mn++. A negative correlation was found between EC, soluble salts (Ca++, Mg++, Na+, K+, HCO3, Cl, and SO4−−) and SAR against Cu++, Mn++, N, and P (Figure 10a).
The analysis revealed that the leaf length, width, and area positively correlated with the opened stomata and the pore lengths, widths, and areas at the AD surface. pH and nitrogen are positively correlated with the opened stomata and the pore length, width, and area in the AD leaf surface, while leaf size parameters negatively correlate with the closed stomata and the epidermal cell lengths, widths, and areas at both leaf surfaces. The soil-soluble HCO3 positively correlated with length, width, and area of the closed stomata at both leaf surfaces. Oleic and octadecanoic acids are positively correlated with the stomatal pore size parameters at the AB surface of the leaf (Figure 10b).

4. Discussion

Plant growth is affected by stressful environmental conditions such as soil salinity and drought [72]. One of the highly adaptable plant traits to environmental change is leaf size [32,73]. Soil nitrogen is essential for plant development and growth [74]. Some researchers have reported that plant growth parameters, such as leaf size and area, are affected by many abiotic factors, including soil pH and nitrogen supply [75,76]. The latter outcomes are congruent with the present study, where the leaf and lobe size parameters positively correlate with the soil nitrogen concentration (Figure 10a). The plant length demonstrated a positive correlation with leaf parameters, and a similar finding was reported by Liu et al. [77]. Phosphorus negatively correlated with EC, soluble salts (Ca++, Mg++, Na+, K+, HCO3, Cl, and SO4−−), CaCO3, SAR, N, Fe, Zn++, and Mn++. The phosphorus uptake decreased due to the precipitation of phosphate ions with Ca++ in salt-stressed soil [78]. A positive correlation exists between petiole length/leaf length ratio and petiole attachment against EC, soluble salts (Ca++, Mg++, Na+, HCO3, Cl, SO4−−), CaCO3, SAR, and isophytol. Hammad et al. [72] stated that environmental factors influenced castor oil composition.
The physiology and anatomical properties of a plant’s stomata are highly plastic and are affected by various environmental factors, such as the availability of nutrients [79]. The correlation analysis examined whether the macromorphological characteristics were associated with leaf ultrastructure. The analysis revealed that the leaf length, width, and area at the adaxial surface positively correlated with the opened stomata and the pore lengths, widths, and areas. In turn, the latter-mentioned traits and the epidermal cell length and area positively correlate with soil pH and nitrogen concentration (Figure 10b). Generally, the ionic form in which the element is located in the soil is affected by pH [80]. However, these leaf size parameters negatively correlate with the closed stomata and the epidermal cell lengths, widths, and areas at both leaf surfaces (Figure 10b). This is incompatible with Murphy et al. [73], who tested a field-grown woody species and proposed that differences in leaf stomatal traits are induced by sun and shade but not regulated by leaf size. Oleic and Octadecanoic acids correlated positively with the stomatal pore. Mohamed et al. [81] reported that the stomatal aperture and fatty acid composition are highly correlated.
Ricinus communis growing along roadsides and wastelands of Egypt is affected by several abiotic stresses [82]. Anomalous large stomata were observed on the leaf surfaces of samples 8 (collected from site 3, 39 km from Alexandria–Matrouh International Coastal Road, Sidi Kirayr) and 12 (collected from site 5, 1 km from East Omayed Biosphere Reserve, Alexandria Desert Road). Plants absorb minerals such as magnesium, calcium, and copper from the soil. Such anomalies in the stomata may be ascribed to the accumulation and transportation of Mg++ ions, which may interfere with the functions and mobilization of other mineral ions and cause leaf distortion [83]. Otherwise, copper deficiency in the studied sites may lead to morphological alterations in the leaf architecture, where it is a vital element with different functions in plant development and metabolism [84,85]. Moreover, the distortion of stomata may be attributed to the existence of some environmental pollutants or phytotoxic gases at sites 3 and 5. Angeles et al. [86] reported that the diffusion of these pollutants through the stomatal opening according to different concentration gradients caused lesions and a distorted stomatal complex on leaves of Mangifera indica L. Plants located in the study area, the northwestern coastal desert of Egypt, are under pressure resulting from anthropogenic disturbance, agricultural practices, pollution, and urbanization [87]. Even the Omayed Biosphere Reserve has recently encountered new human-induced disturbances [88,89].
Important morphological markers of R. communis were previously used in the identification, and to verify the genuineness, of different castor varieties. These markers included plant stature, stem color, the presence/absence of anthocyanin pigmentation, stem wax, type of internode, bloom, branching habits, leaf shape, and adaxial and abaxial leaf surface traits [26,27,28,29]. The multivariate (clustering and PCA) analysis of 25 R. communis samples based on 34 vegetative morphometric characters revealed three subclusters (groups). A heatmap of all the combined traits, vegetative morphometry, leaf micromorphology, and soil and GC-MS analysis (Figure 11) confirmed the discrimination of the three groups or morphotypes resulting from multivariate vegetative morphological characteristics analysis. Each group attained some specific characteristics discriminating it from the other groups (Table 4 and Table 5). Samples 1–4, 12–13, and 20–21 collected from sites 1, 5, and 9, respectively, had purple stems. These samples had no more specific characteristics; thus, they were scattered across the three groups. Wahibah et al. [28] reported that the purple-stemmed R. communis variety with an anthocyanin coloration reflected the intra-specific diversity of the species. According to Shankar et al. [90] and Santha et al. [91], this phenotype is resistant to the severe wilt syndrome caused by Fusarium oxysporum f. sp. ricini, which leads to up to 77% yield loss based on the degree of infection. Its ability to resist fungal growth indicates the existence of a specific resistance mechanism in this genotype. This variety provides valuable genetic resources to produce wilt-resistant genotypes.
Morphological traits are useful indicators of environmental stress [92]. For the vegetative morphometry, group one represented the highest range of leaf length (22.73–27.49 cm) and width (23.88–30.52 cm), first lobe length and width (15.13–20.06 cm and 5.05–7.00 cm, respectively), second lobe length (14.10–18.84 cm) and width (4.13–5.51 cm), third lobe length (12.50–16.62 cm), fourth lobe length (10.76–13.69 cm), fifth lobe length (8.62–10.21 cm), depth between first and second lobe (5.43–8.04 cm), depth between second and third lobe (5.13–7.39 cm), depth between third and fourth lobe (4.53–6.14 cm), depth between fourth and fifth lobe (3.71–5.10 cm), and macrophyll leaf blade with leaf area (207.04–352.89 cm2). For SEM leaf characteristics, this group was characterized by the lowest number of closed stomata at the AB surface. For the soil chemical characteristics, this group (sites 3 and 8) exhibited the lowest values for soluble salts (Ca++, Mg++, Na+, HCO3, Cl, SO4−−) and SAR. Members of this group are located at coastal sites, where plants grown along coastal areas are exposed to salt spray [92]. The macrophyll leaf blade characterizing this group reveals the ability of its individuals to retain a sizeable transpiring surface area, which is considered a sort of acclimation to salt stress [93,94].
Group two exemplified the medium range of leaf length and width (16.19–20.35 cm and 17.58–21.63 cm, respectively), first lobe length and width (10.79–14.08 cm and 3.53–5.44 cm, respectively), second lobe length (10.53–12.70 cm) and width (3.17–4.14 cm), third lobe length (9.19–11.26 cm), fourth lobe length (7.13–9.28 cm), depth between first and second lobe (3.60–5.24 cm), depth between second and third lobe (3.83–4.85 cm), depth between third and fourth lobe (3.10–3.83 cm), depth between fourth and fifth lobe (2.54–2.91 cm), and mesophyll leaf blade with leaf area (117.31–181.24 cm2). For SEM leaf characteristics, group 2 (samples 4 and 12) showed smaller values than the other two groups. For the adaxial leaf surface, the opened stomata width and area was 3.38–5.83 µm and 16.95–40.28 µm2, respectively, pore area was 3.30–14.98 µm2, and epidermal cell length and area was 11.77–16.44 µm and 74.51–163.22 µm2, respectively. Sample 4 specifically (collected from site 1 at Mehwar Al-Ta’ameir, about 700 m from kilo 26 wastewater treatment plant, and 26 km from West Alexandria) had a small epidermal cell size at both leaf surfaces. This is in accordance with Cookson et al. [95], who mentioned that area of the leaf is affected by environmental factors because of the cell number and/or cell size differences. Additionally, rodlets of epicuticular crystalloid wax were observed on its AB surface. The presence of epicuticular waxes reveals how plants interact with their environment [96]. According to the soil chemical characters, this group (sites 1 and 5) displayed an example of wasteland areas. It recorded the lowest values for the available potassium, copper, and organic matter, whereas the highest was for CaCO3. Furthermore, this group demonstrated a minor nutrient concentration of nitrogen and phosphorus. The depletion of nutrients, especially nitrogen, and phosphorus, characterizes wasteland areas [97]. Plants growing in such areas demonstrated a reduction in their growth and productivity due to some physiological and biochemical changes [98]. Nevertheless, site 1 represented the highest EC and concentrations of Ca++, Mg++, Na+, K+, HCO3, Cl, SO4−−, and SAR, copper, and organic matter. Jeschke and Wolf [99] mentioned that higher concentrations of NaCl enhanced the reduction in R. communis growth and leaf size, and suppressed shrub branching.
The third group had the lowest range of leaf length (11.60–15.42 cm) and width (12.30–16.06 cm), first lobe length and width (8.22–10.76 cm and 2.17–3.63 cm, respectively), second lobe length (7.55–9.65 cm) and width (1.97–3.35 cm), third lobe length (6.64–8.34 cm), fourth lobe length (4.93–7.15 cm), depth between first and second lobe (2.25–3.67 cm), depth between second and third lobe (2.11–3.38 cm), depth between third and fourth lobe (1.85–2.89 cm), depth between fourth and fifth lobe (1.44–2.22 cm), and mesophyll leaf blade with leaf area (52.94–106.81 cm2). For SEM leaf characteristics, the highest number of closed stomata, and the highest scores for the epidermal cell area were noticed at the abaxial leaf surface (547.82–889.71 µm2) of group 3 (samples 11 and 22). This group includes individuals growing in inland sites. Our findings are in accordance with Papazoglou [100], who reported that R. communis showed a tolerance capability under water stress conditions, although the leaf area decreased due to water scarcity. As an adaptive response to drought stress, plants reduce their leaf area and keep their stomata closed to minimize water losses through transpiration [101,102]. The lowest percent of n-Hexadecanoic acid is noticed for group 3 (22.04–24.2%), in comparison with the other two groups (26.86–36.25%). The Palmitic acid concentration is affected by drought [103,104]. n-Hexadecanoic acid is also called Palmitic acid and functions as an anti-inflammatory agent to treat rheumatic symptoms [105].
The results confirmed that R. communis could adapt to stresses in coastal lands or inland habitats, causing phenotypic and chemical variations to cope with the different environmental stresses in the study area. However, the soil heterogeneity may be ascribed to the soil’s different nature and geomorphologic characteristics. A similar adaptive response was detected for some xerophytic taxa on the Al-Alamein–Alexandria International Desert Road of Egypt [87].

5. Conclusions

Ricinus communis samples were subjected to different analyses, such as analyses of vegetative morphometry, leaf surface ultrastructure, soil analysis, and GC-MS analysis, to assess the varietal diversity of the species. Multivariate analysis based on 34 quantitative and qualitative morphological traits distinguished 25 castor samples into three main groups (morphotypes). The results of UPGMA cluster analysis and PCA were consistent with each other. There was a discrimination of the three groups: the first one enclosed individuals inhabiting coastal habitats and was characterized by macrophyll leaf blades with larger leaf length, width, and area. The third group’s individuals that occupied inland sites had the smallest leaf size parameters. In contrast, the second group was in the middle of the other two groups. The present study revealed that the following traits are important for studying the varietal identification of R. communis; leaf size parameters, leaf area, blade class, lobes size and shapes, stomatal and pore size, and epidermal cell size parameters. Some R. communis samples had purple stems, while the others were grayish-green. The purple-stemmed phenotype has no more specific characteristics; however, it may reflect the intra-specific diversity of the species. Ricinus communis revealed an adaptive growth capability, where plants inhabiting coastal sites are salt-sensitive, while inland plants are a relatively drought-tolerant species. The intra-specific variation between R. communis morphotypes indicated the possibility of the direct and indirect use of these varieties in genetic improvement programs of the species. Further molecular studies should be implemented to evaluate the genetic diversity among these morphotypes.

Supplementary Materials

The following are available online at https://www.mdpi.com/article/10.3390/agronomy13040985/s1, Figure S1: Map of Egypt indicating the sampling sites of Ricinus communis; Table S1: Qualitative characters of Ricinus communis vegetative morphometry. The plant’s stature ranks: very tall “>2.50 m”, tall “2.0–2.5 m”, medium “1.51–2.0 m”, and short “1.0–1.5 m”; Table S2: Quantitative characteristics of abaxial leaf (AB) and adaxial leaf (AD) surface ultrastructure of Ricinus communis; Table S3: One-way ANOVA of abaxial leaf and adaxial leaf surface ultrastructure characters of Ricinus communis; Table S4: The one-way ANOVA of the soil traits showed non-significant variation for the three studied groups of Ricinus communis; Table S5: The one-way ANOVA of the phytochemical concentration exhibited non-significant variation for the three studied groups of Ricinus communis.

Author Contributions

Conceptualization, I.H.N.; methodology, I.H.N., K.A., F.Y.E., R.B., T.I.S., A.E.-B. and S.M.A.R.; software, I.H.N. and F.Y.E.; validation, I.H.N., K.A., F.Y.E., R.B., T.I.S., A.E.-B. and S.M.A.R.; formal analysis, I.H.N., F.Y.E. and S.M.A.R.; investigation, I.H.N., R.B. and S.M.A.R.; resources, I.H.N., R.B. and S.M.A.R.; data curation, I.H.N., F.Y.E. and S.M.A.R.; writing—original draft preparation, I.H.N., K.A., F.Y.E., R.B., T.I.S., A.E.-B. and S.M.A.R.; writing—review and editing, I.H.N., F.Y.E. and A.E.-B.; visualization, I.H.N., K.A., F.Y.E., R.B., T.I.S., A.E.-B. and S.M.A.R.; Funding acquisition: I.H.N., K.A., F.Y.E., R.B., T.I.S., A.E.-B. and S.M.A.R. All authors have read and agreed to the published version of the manuscript.

Funding

This research received no external funding.

Data Availability Statement

The data presented in this study are available in this article.

Acknowledgments

Not applicable.

Conflicts of Interest

The authors declare no conflict of interest.

References

  1. Kim, H.; Lei, P.; Wang, A.; Liu, S.; Zhao, Y.; Huang, F.; Yu, Z.; Zhu, G.; He, Z.; Tan, D.; et al. Genetic Diversity of Castor Bean (Ricinus communis L.) Revealed by ISSR and RAPD Markers. Agronomy 2021, 11, 457. [Google Scholar] [CrossRef]
  2. Sahney, M.; Rahi, S.; Kumar, A.; Jaiswal, R. Melissopalynological Studies on Winter Honeys from Allahabad, Uttar Pradesh, India. Palynology 2018, 42, 540–552. [Google Scholar] [CrossRef]
  3. Yang, S.; Mao, L.; Zheng, Z.; Chen, B.; Li, J. Pollen Atlas for Selected Subfamilies of Euphorbiaceae from Southern China: A Complementary Contribution to Quaternary Pollen Analysis. Palynology 2020, 44, 659–673. [Google Scholar] [CrossRef]
  4. Kiran, B.R.; Prasad, M.N.V. Ricinus communis L. (Castor Bean), a Potential Multi-Purpose Environmental Crop for Improved and Integrated Phytoremediation. EuroBiotech J. 2017, 1, 101–116. [Google Scholar] [CrossRef]
  5. Chan, A.P.; Crabtree, J.; Zhao, Q.; Lorenzi, H.; Orvis, J.; Puiu, D.; Melake-Berhan, A.; Jones, K.M.; Redman, J.; Chen, G.; et al. Draft Genome Sequence of the Oilseed Species Ricinus communis. Nat. Biotechnol. 2010, 28, 951–956. [Google Scholar] [CrossRef]
  6. Perea-Flores, M.J.; Chanona-Pérez, J.J.; Garibay-Febles, V.; Calderón-Dominguez, G.; Terrés-Rojas, E.; Mendoza-Pérez, J.A.; Herrera-Bucio, R. Microscopy Techniques and Image Analysis for Evaluation of Some Chemical and Physical Properties and Morphological Features for Seeds of the Castor Oil Plant (Ricinus communis). Ind. Crops Prod. 2011, 34, 1057–1065. [Google Scholar] [CrossRef]
  7. Enan, M.; Al-Deeb, M.; Fawzy, N.; Amiri, K. DNA Barcoding of Ricinus communis from Different Geographical Origin by Using Chloroplast Matk and Internal Transcribed Spacers. Am. J. Plant Sci. 2012, 3, 1304–1310. [Google Scholar] [CrossRef]
  8. Taur, D.J.; Waghmare, M.G.; Bandal, R.S.; Patil, R.Y. Antinociceptive Activity of Ricinus communis L. Leaves. Asian Pac. J. Trop. Biomed. 2011, 1, 139–141. [Google Scholar] [CrossRef]
  9. Ohishi, K.; Toume, K.; Arai, M.A.; Sadhu, S.K.; Ahmed, F.; Mizoguchi, T.; Itoh, M.; Ishibashi, M. Ricinine: A Pyridone Alkaloid from Ricinus communis That Activates the Wnt Signaling Pathway through Casein Kinase 1α. Bioorg. Med. Chem. 2014, 22, 4597–4601. [Google Scholar] [CrossRef]
  10. Rakesh, M.R.; Kabra, M.P.; Rajkumar, V.S. Evaluation of Antiulcer Activity of Castor Oil in Rats. Int. J. Res. Ayurveda Pharm. 2011, 2, 1349–1353. [Google Scholar]
  11. Tunaru, S.; Althoff, T.F.; Nüsing, R.M.; Diener, M.; Offermanns, S. Castor Oil Induces Laxation and Uterus Contraction via Ricinoleic Acid Activating Prostaglandin EP3 Receptors. Proc. Natl. Acad. Sci. USA 2012, 109, 9179–9184. [Google Scholar] [CrossRef] [PubMed]
  12. Iqbal, J.; Zaib, S.; Farooq, U.; Khan, A.; Bibi, I.; Suleman, S. Antioxidant, Antimicrobial, and Free Radical Scavenging Potential of Aerial Parts of Periploca aphylla and Ricinus communis. Int. Sch. Res. Not. 2012, 2012, 563267. [Google Scholar] [CrossRef]
  13. Shokeen, P.; Anand, P.; Murali, Y.K.; Tandon, V. Antidiabetic Activity of 50% Ethanolic Extract of Ricinus communis and Its Purified Fractions. Food Chem. Toxicol. 2008, 46, 3458–3466. [Google Scholar] [CrossRef] [PubMed]
  14. Worbs, S.; Köhler, K.; Pauly, D.; Avondet, M.A.; Schaer, M.; Dorner, M.B.; Dorner, B.G. Ricinus communis Intoxications in Human and Veterinary Medicine-a Summary of Real Cases. Toxins 2011, 3, 1332–1372. [Google Scholar] [CrossRef] [PubMed]
  15. Abbes, M.; Montana, M.; Curti, C.; Vanelle, P. Ricin Poisoning: A Review on Contamination Source, Diagnosis, Treatment, Prevention and Reporting of Ricin Poisoning. Toxicon 2021, 195, 86–92. [Google Scholar] [CrossRef]
  16. Sogan, N.; Kapoor, N.; Singh, H.; Kala, S.; Nayak, A.; Nagpal, B. Larvicidal Activity of Ricinus communis Extract against Mosquitoes. J. Vector Borne Dis. 2018, 55, 282–290. [Google Scholar] [CrossRef] [PubMed]
  17. Hussein, A.O.; Hameed, I.H.; Jasim, H.; Kareem, M.A. Determination of Alkaloid Compounds of Ricinus communis by Using Gas Chromatography-Mass Spectroscopy (GC-MS). J. Med. Plants Res. 2015, 9, 349–359. [Google Scholar] [CrossRef]
  18. Elkousy, R.H.; Said, Z.N.A.; Abd El-Baseer, M.A.; Abu El wafa, S.A. Antiviral Activity of Castor Oil Plant (Ricinus communis) Leaf Extracts. J. Ethnopharmacol. 2021, 271, 113878. [Google Scholar] [CrossRef]
  19. Mboyazi, S.N.; Nqotheni, M.I.; Maliehe, T.S.; Shandu, J.S. In Vitro Antibacterial and in Silico Toxicity Properties of Phytocompounds from Ricinus communis Leaf Extract. Pharmacogn. J. 2020, 12, 977–983. [Google Scholar] [CrossRef]
  20. Osorio-González, C.S.; Gómez-Falcon, N.; Sandoval-Salas, F.; Saini, R.; Brar, S.K.; Ramírez, A.A. Production of Biodiesel from Castor Oil: A Review. Energies 2020, 13, 2467. [Google Scholar] [CrossRef]
  21. Layek, U.; Manna, S.S.; Karmakar, P. Pollen Foraging Behaviour of Honey Bee (Apis mellifera L.) in Southern West Bengal, India. Palynology 2020, 44, 114–126. [Google Scholar] [CrossRef]
  22. Allan, G.; Williams, A.; Rabinowicz, P.D.; Chan, A.P.; Ravel, J.; Keim, P. Worldwide Genotyping of Castor Bean Germplasm (Ricinus communis L.) Using AFLPs and SSRs. Genet. Resour. Crop Evol. 2008, 55, 365–378. [Google Scholar] [CrossRef]
  23. Anjani, K. Purple-Coloured Castor (Ricinus communis L.)-A Rare Multiple Resistant Morphotype. Curr. Sci. 2005, 88, 215–216. [Google Scholar]
  24. Kallamadi, P.R.; Nadigatla, V.P.R.G.R.; Mulpuri, S. Molecular Diversity in Castor (Ricinus communis L.). Ind. Crops Prod. 2015, 66, 271–281. [Google Scholar] [CrossRef]
  25. Purseglove, J.W. Castor, Sesame & Safflower By E. A. Weiss London: Leonard Hill Books (1971), pp. 901. Exp. Agric. 1972, 8, 282. [Google Scholar] [CrossRef]
  26. Chaudhari, B.A.; Patel, M.P.; Patel, J.A.; Makwana, R.R.; Patel, A.M.; Patel, M.K. The Characterization of Castor (Ricinus communis L.) Genotypes for Morphological Traits. Int. J. Curr. Microbiol. Appl. Sci. 2019, 8, 2482–2492. [Google Scholar] [CrossRef]
  27. Da Silva, A.R.; Silva, S.A.; Dos Santos, L.A.; De Souza, D.R.; De Melo Araujo, G.; Dantas, J.L.L.; Da Silva Leite, E.; Dantas, A.C.V.L. Characterization and Performance of Castor Bean Lineages and Parents at the UFRB Germplasm Bank. PLoS ONE 2019, 14, e0209335. [Google Scholar] [CrossRef]
  28. Wahibah, N.N.; Fitmawati; Yahya, V.J.; Perdana, M.A.; Budiono, R. Morphological Variation of Castor Bean (Ricinus communis L.) on Peatland Area in Kepulauan Meranti Riau Indonesia. J. Phys. Conf. Ser. 2020, 1655, 012028. [Google Scholar] [CrossRef]
  29. Shaheen, A.M. Morphological Variation within Ricinus communis L. Egypt: Fruit, Leaf, Seed and Pollen. Pak. J. Biol. Sci. 2002, 5, 1202–1206. [Google Scholar] [CrossRef]
  30. Pandey, A.; Agrawal, S.; Patel, A.D.; Pendarkar, D.; Bambhaniya, J.D. Evergreen Conventional and Modern Microscopic Methods for Solving Various Cases of Forensic Botany by Morphological and Histological Study. Pharmacogn. J. 2019, 11, 171–176. [Google Scholar] [CrossRef]
  31. CSIR. The Wealth of India: A Dictionary of Indian Raw Materials and Industrial Products (Industrial Products—Part I); Council of Scientific & Industrial Research: New Delhi, India, 1972.
  32. Fakhr, M.A.; Mazrou, Y.S.A.; Ellmouni, F.Y.; Elsaied, A.; Elhady, M.; Elkelish, A.; Nour, I.H. Investigating the Phenotypic Plasticity of the Invasive Weed Trianthema portulacastrum L. Plants 2022, 11, 77. [Google Scholar] [CrossRef] [PubMed]
  33. Lin, P.; Chen, Y.; Ponce, G.; Acevedo, F.E.; Anderson, C.T.; Ali, J.G.; Felton, G.W.; Lynch, J.P. Stomata-Mediated Interactions between Plants, Herbivores, and the Environment. Trends Plant Sci. 2022, 27, 287–300. [Google Scholar] [CrossRef] [PubMed]
  34. Fernandes, M.F.; Cardoso, D.; de Queiroz, L.P. An Updated Plant Checklist of the Brazilian Caatinga Seasonally Dry Forests and Woodlands Reveals High Species Richness and Endemism. J. Arid Environ. 2020, 174, 104079. [Google Scholar] [CrossRef]
  35. Duruibe, J.O.; Ogwuegbu, M.O.C.; Egwurugwu, J.N. Heavy Metal Pollution and Human Biotoxic Effects. Int. J. Phys. Sci. 2007, 2, 112–118. [Google Scholar] [CrossRef]
  36. Nazzal, Y.; Rosen, M.A.; Al-Rawabdeh, A.M. Assessment of Metal Pollution in Urban Road Dusts from Selected Highways of the Greater Toronto Area in Canada. Environ. Monit. Assess. 2013, 185, 1847–1858. [Google Scholar] [CrossRef] [PubMed]
  37. Sameena, P.; Puthur, J.T. Heavy Metal Phytoremediation by Bioenergy Plants and Associated Tolerance Mechanisms. Soil Sediment Contam. 2021, 30, 253–274. [Google Scholar] [CrossRef]
  38. Huang, J.; Guo, S.; Zeng, G.; Li, F.; Gu, Y.; Shi, Y.; Shi, L.; Liu, W.; Peng, S. A New Exploration of Health Risk Assessment Quantification from Sources of Soil Heavy Metals under Different Land Use. Environ. Pollut. 2018, 243, 49–58. [Google Scholar] [CrossRef]
  39. Li, C.; Zhou, K.; Qin, W.; Tian, C.; Qi, M.; Yan, X.; Han, W. A Review on Heavy Metals Contamination in Soil: Effects, Sources, and Remediation Techniques. Soil Sediment Contam. 2019, 28, 380–394. [Google Scholar] [CrossRef]
  40. Farooq, M.A.; Ali, S.; Hameed, A.; Bharwana, S.A.; Rizwan, M.; Ishaque, W.; Farid, M.; Mahmood, K.; Iqbal, Z. Cadmium Stress in Cotton Seedlings: Physiological, Photosynthesis and Oxidative Damages Alleviated by Glycinebetaine. South Afr. J. Bot. 2016, 104, 61–68. [Google Scholar] [CrossRef]
  41. Siregar, A.S.; Sulistyo, I.; Prayogo, N.A. Heavy Metal Contamination in Water, Sediments and Planiliza Subviridis Tissue in the Donan River, Indonesia. J. Water L. Dev. 2020, 45, 157–164. [Google Scholar] [CrossRef]
  42. Tyagi, K.; Sharma, S.; Kumar, S.; Ayub, S. Cytological, Morphological and Anatomical Studies of Ricinus communis Linn. Grown under the Influence of Industrial Effluent—A Comparative Study. J. Pharm. Res. 2013, 7, 454–458. [Google Scholar] [CrossRef]
  43. Bauddh, K.; Singh, K.; Singh, B.; Singh, R.P. Ricinus communis: A Robust Plant for Bio-Energy and Phytoremediation of Toxic Metals from Contaminated Soil. Ecol. Eng. 2015, 84, 640–652. [Google Scholar] [CrossRef]
  44. Kammerbauer, J.; Dick, T. Monitoring of Urban Traffic Emissions Using Some Physiological Indicators in Ricinus communis L. Plants. Arch. Environ. Contam. Toxicol. 2000, 39, 161–166. [Google Scholar] [CrossRef]
  45. Boda, R.K.; Majeti, N.V.P.; Suthari, S. Ricinus communis L. (Castor Bean) as a Potential Candidate for Revegetating Industrial Waste Contaminated Sites in Peri-Urban Greater Hyderabad: Remarks on Seed Oil. Environ. Sci. Pollut. Res. 2017, 24, 19955–19964. [Google Scholar] [CrossRef] [PubMed]
  46. Zarai, Z.; Chobba, I.B.; Mansour, R.B.; Békir, A.; Gharsallah, N.; Kadri, A. Essential Oil of the Leaves of Ricinus communis L.: In Vitro Cytotoxicity and Antimicrobial Properties. Lipids Health Dis. 2012, 11, 102. [Google Scholar] [CrossRef] [PubMed]
  47. Warra, A.A. Physico-Chemical and GC/MS Analysis of Castor Bean (Ricinus communis L.) Seed Oil. Chem. Mater. Res. 2015, 7, 56–60. [Google Scholar]
  48. Hammad, H.H.; El-Kateb, H.; Bahnasy, M.I. Growth, Yield and Fatty Acids Composition of Castor Bean (Ricinus communis L.) Cultivars. Middle East J. Agric. Res. 2019, 8, 638–653. [Google Scholar]
  49. Firn, J.; McGree, J.M.; Harvey, E.; Flores-Moreno, H.; Schütz, M.; Buckley, Y.M.; Borer, E.T.; Seabloom, E.W.; La Pierre, K.J.; MacDougall, A.M.; et al. Leaf Nutrients, Not Specific Leaf Area, Are Consistent Indicators of Elevated Nutrient Inputs. Nat. Ecol. Evol. 2019, 3, 400–406. [Google Scholar] [CrossRef] [PubMed]
  50. Perdomo, F.A.; Acosta-Osorio, A.A.; Herrera, G.; Vasco-Leal, J.F.; Mosquera-Artamonov, J.D.; Millan-Malo, B.; Rodriguez-Garcia, M.E. Physicochemical Characterization of Seven Mexican Ricinus communis L. Seeds & Oil Contents. Biomass Bioenergy 2013, 48, 17–24. [Google Scholar]
  51. Hussein, H.M.; Ubaid, J.M.; Hameed, I.H. Inscticidal Activity of Methanolic Seeds Extract of Ricinus communis on Adult of Callosobruchus maculatus (Coleopteran: Brauchidae) and Analysis of Its Phytochemical Composition. Int. J. Pharmacogn. Phytochem. Res. 2016, 8, 1385–1397. [Google Scholar]
  52. Salimon, J.; Noor, D.A.M.; Nazrizawati, A.; Noraishah, A. Fatty Acid Composition and Physicochemical Properties of Malaysian Castor Bean Ricinus communis L. Seed Oil. Sains Malays. 2010, 39, 761–764. [Google Scholar]
  53. Nangbes, J.G.; Nvau, J.B.; Buba, W.M.; Zukdimma, A.N. Extraction and Characterization of Castor (Ricinus communis) Seed Oil. Int. J. Eng. Sci. 2013, 2, 105–109. [Google Scholar]
  54. Yusuf, A.K.; Mamza, P.A.P.; Ahmed, A.S.; Agunwa, U. Extraction and Characterization of Castor Seed Oil from Wild Ricinus communis Linn. Int. J. Sci. Environ. Technol. 2015, 4, 1392–1404. [Google Scholar]
  55. Schneider, C.A.; Rasband, W.S.; Eliceiri, K.W. NIH Image to ImageJ: 25 Years of Image Analysis. Nat. Methods 2012, 9, 671–675. [Google Scholar] [CrossRef] [PubMed]
  56. Singh, G. Plant Systematics: An Integrated Approach; CRC Press: Boca Raton, FL, USA, 2019; ISBN 1000576779. [Google Scholar]
  57. Ellis, B.; Daly, D.C.; Hickey, L.J.; Johnson, K.R.; Mitchell, J.D.; Wilf, P.; Wing, S.L. Manual of Leaf Architecture; Ithaca: New York, NY, USA, 2009; ISBN 9780801475184. [Google Scholar]
  58. Ash, A. Manual of Leaf Architecture: Morphological Description and Categorization of Dicotyledonous and Net-Veined Monocotyledonous Angiosperms; Smithsonian Institution: Washington, DC, USA, 1999. [Google Scholar]
  59. Barthlott, W. Epidermal and Seed Surface Characters of Plants: Systematic Applicability and Some Evolutionary Aspects. Nord. J. Bot. 1981, 1, 345–355. [Google Scholar] [CrossRef]
  60. Piper, C.S. Soil and Plant Analysis; Scientific Publishers: Jodhpur, India, 2019; ISBN 9386237539. [Google Scholar]
  61. Walkley, A.J.; Black, I.A. Estimation of Soil Organic Carbon by the Chromic Acid Titration Method. Soil Sci. 1934, 37, 29–38. [Google Scholar] [CrossRef]
  62. Pansu, M.; Gautheyrou, J. Phosphorus; Springer: Berlin/Heidelberg, Germany, 2006; ISBN 978-3-540-31211-6. [Google Scholar]
  63. Olsen, S.R.; Sommers, L.E. Phosphorus. Agronomy Monographs. In Methods of Soil Analysis; Academic Press: Madison, WI, USA, 1982; pp. 403–430. ISBN 9780891189770. [Google Scholar]
  64. Hanway, J.J.; Heidal, H. Soil Analysis Methods as Used in the Iowa State College Soil Testing Laboratory. Iowa State Coll. Agric. Bull. 1952, 57, 1–31. [Google Scholar]
  65. Tabassum, S.; Amin, F.; Erum, S.; Javed, H.; Kazmi, F.; Nisar, M.F.; Ullah, I.; Murtaza, I.; Ashraf, M. Effect of Hexane and Ethanol Extracts of Ten Basil Genotypes on the Growth of Selected Bacterial Strains. Int. J. Agric. Biol. 2016, 18, 735–740. [Google Scholar] [CrossRef]
  66. Sbihi, H.M.; Nehdi, I.A.; Mokbli, S.; Romdhani-Younes, M.; Al-Resayes, S.I. Hexane and Ethanol Extracted Seed Oils and Leaf Essential Compositions from Two Castor Plant (Ricinus communis L.) Varieties. Ind. Crops Prod. 2018, 122, 174–181. [Google Scholar] [CrossRef]
  67. Team, R.C. R: A Language and Environment for Statistical Computing. R Foundation for Statistical Computing, Vienna, Austria. 2013. Available online: https://www.gbif.org/tool/81287/r-a-language-and-environment-for-statistical-computing (accessed on 30 January 2023).
  68. Wickham, H. Data Analysis; Springer: Berlin/Heidelberg, Germany, 2016; ISBN 331924275X. [Google Scholar]
  69. Kolde, R. Pheatmap: Pretty Heatmaps, Version 1.0.8; R Package; R Foundation: Vienna, Austria, 2012.
  70. Viscosi, V.; Cardini, A. Leaf Morphology, Taxonomy and Geometric Morphometrics: A Simplified Protocol for Beginners. PLoS ONE 2011, 6, e25630. [Google Scholar] [CrossRef] [PubMed]
  71. Kassambara, A.; Mundt, F. Factoextr: Extract and Visualize the Results of Multivariate Data Analyses. 2020. Available online: https://cran.r-project.org/web/packages/factoextra/index.html (accessed on 30 January 2023).
  72. Soetewey, A. Correlation Coefficient and Correlation Test in R. Available online: https://www.statsandr.com/blog/correlationcoefficient-and-correlation-test-in-r/ (accessed on 20 February 2022).
  73. Murphy, M.R.C.; Jordan, G.J.; Brodribb, T.J. Differential Leaf Expansion Can Enable Hydraulic Acclimation to Sun and Shade. Plant Cell Environ. 2012, 35, 1407–1418. [Google Scholar] [CrossRef] [PubMed]
  74. Xiong, D.; Wang, D.; Liu, X.; Peng, S.; Huang, J.; Li, Y. Leaf Density Explains Variation in Leaf Mass per Area in Rice between Cultivars and Nitrogen Treatments. Ann. Bot. 2016, 117, 963–971. [Google Scholar] [CrossRef]
  75. James, J.J.; Tiller, R.L.; Richards, J.H. Multiple Resources Limit Plant Growth and Function in a Saline-Alkaline Desert Community. J. Ecol. 2005, 93, 113–126. [Google Scholar] [CrossRef]
  76. Meier, I.C.; Leuschner, C. Leaf Size and Leaf Area Index in Fagus sylvatica Forests: Competing Effects of Precipitation, Temperature, and Nitrogen Availability. Ecosystems 2008, 11, 655–669. [Google Scholar] [CrossRef]
  77. Liu, F.; Yang, W.; Wang, Z.; Xu, Z.; Liu, H.; Zhang, M.; Liu, Y.; An, S.; Sun, S. Plant Size Effects on the Relationships among Specific Leaf Area, Leaf Nutrient Content, and Photosynthetic Capacity in Tropical woody Species. Acta Oecologica 2010, 36, 149–159. [Google Scholar] [CrossRef]
  78. Bano, A.; Fatima, M. Salt Tolerance in Zea mays (L). Following Inoculation with Rhizobium and Pseudomonas. Biol. Fertil. Soils 2009, 45, 405–413. [Google Scholar] [CrossRef]
  79. Sathee, L.; Jain, V. Interaction of Elevated CO2 and Form of Nitrogen Nutrition Alters Leaf Abaxial and Adaxial Epidermal and Stomatal Anatomy of Wheat Seedlings. Protoplasma 2022, 3, 703–716. [Google Scholar] [CrossRef]
  80. Bravo, S.; Amorós, J.A.; Pérez-De-Los-Reyes, C.; García, F.J.; Moreno, M.M.; Sánchez-Ormeño, M.; Higueras, P. Influence of the Soil PH in the Uptake and Bioaccumulation of Heavy Metals (Fe, Zn, Cu, Pb and Mn) and Other Elements (Ca, K, Al, Sr and Ba) in Vine Leaves, Castilla-La Mancha (Spain). J. Geochem. Explor. 2017, 174, 79–83. [Google Scholar] [CrossRef]
  81. Mohamed, I.A.A.; Shalby, N.; MA El-Badri, A.; Saleem, M.H.; Khan, M.N.; Nawaz, M.A.; Qin, M.; Agami, R.A.; Kuai, J.; Wang, B. Stomata and Xylem Vessels Traits Improved by Melatonin Application Contribute to Enhancing Salt Tolerance and Fatty Acid Composition of Brassica napus L. Plants. Agronomy 2020, 10, 1186. [Google Scholar] [CrossRef]
  82. Galal, T.M.; Essa, B.; Al-Yasi, H. Heavy Metals Uptake and Its Impact on the Growth Dynamics of the Riparian Shrub Ricinus communis L. along Egyptian Heterogenic Habitats. Environ. Sci. Pollut. Res. 2021, 28, 37158–37171. [Google Scholar] [CrossRef]
  83. Azmat, R.; Saleem, A.; Ahmed, W.; Qayyum, A.; El-Serehy, H.A.; Ali, S. The Investigation of the Impact of Toxicity of Metals on Oxygen-Evolving Complex in Spinacia oleracea. Antioxidants 2022, 11, 1802. [Google Scholar] [CrossRef] [PubMed]
  84. Abdel Latef, A.A.H.; Zaid, A.; Abo-Baker, A.B.A.E.; Salem, W.; Abu Alhmad, M.F. Mitigation of Copper Stress in Maize by Inoculation with Paenibacillus polymyxa and Bacillus circulans. Plants 2020, 9, 1513. [Google Scholar] [CrossRef] [PubMed]
  85. Yruela, I. Copper in Plants. Braz. J. Plant Physiol. 2005, 17, 145–156. [Google Scholar] [CrossRef]
  86. delos Angeles, M.D.; Serino, C.B.M.; Granada, K.B. Leaf Morpho-Anatomical Responses of Mangifera indica L. and Ficus benjamina L. to Air Pollution in Selected Areas of Cebu City, Philippines. J. Nat. Stud. 2018, 17, 44–53. [Google Scholar]
  87. Morsy, A.A.; Youssef, A.M.; Mosallam, H.A.M.; Hashem, A.M. Assessment of Selected Species along Al-Alamein-Alexandria International Desert Road, Egypt. J. Appl. Sci. Res. 2008, 4, 1276–1284. [Google Scholar]
  88. Marzouk, R.I.; El-darier, S.M.; Nour, I.H.; Kamal, S.A. Numerical Taxonomic Study of Marrubium L. (Lamiaceae) in Egypt. Catrina 2015, 13, 25–35. [Google Scholar]
  89. Halmy, M.W.A.; Fawzy, M.; Ahmed, D.A.; Saeed, N.M.; Awad, M.A. Monitoring and Predicting the Potential Distribution of Alien Plant Species in Arid Ecosystem Using Remotely-Sensed Data. Remote Sens. Appl. Soc. Environ. 2019, 13, 69–84. [Google Scholar] [CrossRef]
  90. Shankar, V.G.; Venkata Ramana Rao, P.; Reddy, A.V. Inheritance of Certain Morphological Characters and Fusarium Wilt Resistance in Castor, Ricinus communis L. Sabrao J. Breed. Genet. 2010, 42, 57–64. [Google Scholar]
  91. Santha, E.B.M.; Prasad, L.; Yadav, P.; Bee, H. Defense Responses to Fusarium oxysporum f. sp. ricini Infection in Castor (Ricinus communis L.) Cultivars. Indian Phytopathol. 2019, 72, 647–656. [Google Scholar] [CrossRef]
  92. Toscano, S.; Branca, F.; Romano, D.; Ferrante, A. An Evaluation of Different Parameters to Screen Ornamental Shrubs for Salt Spray Tolerance. Biology 2020, 9, 250. [Google Scholar] [CrossRef]
  93. Lacerda, C.F.; Assis Júnior, J.O.; Lemos Filho, L.C.A.; de Oliveira, T.S.; Guimarães, F.V.A.; Gomes-Filho, E.; Prisco, J.T.; Bezerra, M.A. Morpho-Physiological Responses of Cowpea Leaves to Salt Stress. Braz. J. Plant Physiol. 2006, 18, 455–465. [Google Scholar] [CrossRef]
  94. Matesanz, S.; Horgan-Kobelski, T.; Sultan, S.E. Phenotypic Plasticity and Population Differentiation in an Ongoing Species Invasion. PLoS ONE 2012, 7, e44955. [Google Scholar] [CrossRef]
  95. Cookson, S.J.; Radziejwoski, A.; Granier, C. Cell and Leaf Size Plasticity in Arabidopsis: What Is the Role of Endoreduplication? Plant Cell Environ. 2006, 29, 1273–1283. [Google Scholar] [CrossRef] [PubMed]
  96. Barthlott, W.; Neinhuis, C.; Cutler, D.; Ditsch, F.; Meusel, I.; Theisen, I.; Wilhelmi, H. Classification and Terminology of Plant Epicuticular Waxes. Bot. J. Linn. Soc. 1998, 126, 237–260. [Google Scholar] [CrossRef]
  97. Reddy, P. Influence of Nutrient Rich Organic Wastes in Wastelands Reclamation; GRIN Verlag: München, Germany, 2014. [Google Scholar]
  98. Öncel, I.; Keleş, Y.; Üstün, A.S. Interactive Effects of Temperature and Heavy Metal Stress on the Growth and Some Biochemical Compounds in Wheat Seedlings. Environ. Pollut. 2000, 107, 315–320. [Google Scholar] [CrossRef]
  99. Jeschke, W.; Wolf, O. Effect of NaCI Salinity on Growth, Development, Ion Distribution, and Ion Translocation in Castor Bean (Ricinus communis L.). J. Plant Physiol. 1988, 132, 45–53. [Google Scholar] [CrossRef]
  100. Papazoglou, E.G.; Alexopoulou, E.; Papadopoulos, G.K.; Economou-Antonaka, G. Tolerance to Drought and Water Stress Resistance Mechanism of Castor Bean. Agronomy 2020, 10, 1580. [Google Scholar] [CrossRef]
  101. Zhou, H.; Zhou, G.; He, Q.; Zhou, L.; Ji, Y.; Zhou, M. Environmental Explanation of Maize Specific Leaf Area under Varying Water Stress Regimes. Environ. Exp. Bot. 2020, 171, 103932. [Google Scholar] [CrossRef]
  102. Elliott-kingston, C.; Haworth, M.; Yearsley, J.M.; Batke, S.P.; Lawson, T.; Mcelwain, J.C.; Elliott-kingston, C. Does Size Matter? Atmospheric CO2 May Be a Stronger Driver of Stomatal Closing Rate than Stomatal Size in Taxa That Diversified under Low CO2. Front. Plant Sci. 2016, 7, 1253. [Google Scholar] [CrossRef] [PubMed]
  103. Ullah, S.; Khan, M.N.; Lodhi, S.S.; Ahmed, I.; Tayyab, M.; Mehmood, T.; Din, I.U.; Khan, M.; Sohail, Q.; Akram, M. Targeted Metabolomics Reveals Fatty Acid Abundance Adjustments as Playing a Crucial Role in Drought-Stress Response and Post-Drought Recovery in Wheat. Front. Genet. 2022, 13, 972696. [Google Scholar] [CrossRef] [PubMed]
  104. Yaghoubian, I.; Antar, M.; Ghassemi, S.; Modarres-Sanavy, S.A.M.; Smith, D.L. The Effects of Hydro-Priming and Colonization with Piriformospora indica and Azotobacter chroococcum on Physio-Biochemical Traits, Flavonolignans and Fatty Acids Composition of Milk Thistle (Silybum marianum) under Saline Conditions. Plants 2022, 11, 1281. [Google Scholar] [CrossRef] [PubMed]
  105. Aparna, V.; Dileep, K.V.; Mandal, P.K.; Karthe, P.; Sadasivan, C.; Haridas, M. Anti-Inflammatory Property of n-Hexadecanoic Acid: Structural Evidence and Kinetic Assessment. Chem. Biol. Drug Des. 2012, 80, 434–439. [Google Scholar] [CrossRef]
Figure 1. Description of leaf morphological traits in Ricinus communis. The yellow arrow indicates the lobe sinus (depth between two lobes).
Agronomy 13 00985 g001
Figure 2. (a,b) Photographs of Ricinus communis: (a) very tall grayish-green stem showing both condensed and elongated internodes (sample no 7), (b) short purple-waxy stem (sample no 4). (ce) Dried herbarium leaves of the plant: (c) mesophyll blade with lanceolate lobes (sample no 11) and (d,e) macrophyll blade. (d) First, second and third lobes are oblong and the fifth is lanceolate (sample no 24). (e) First, second and third lobes are lanceolate and the fifth is linear-lanceolate (sample no 17). Scale bar = 30 cm (a,b); 4 cm (ce).
Agronomy 13 00985 g002
Figure 3. (a) Agglomerative cluster analysis of Ricinus communis based on 34 vegetative morphometric characters. Red asterisks show the six investigated samples using SEM. (b) Heatmap of Ricinus communis based on 34 vegetative morphometric characters.
Agronomy 13 00985 g003
Figure 4. Principal Component Analysis (PCA) of 25 Ricinus communis samples based on 27 quantitative morphometric characters with the correlation between different variables and the first two components. Length of the variable arrow representing the importance of different variables where longer arrows contribute the most to the discrimination of the three groups.
Agronomy 13 00985 g004
Figure 5. Scanning electron microscope (SEM) photomicrographs of Ricinus communis leaf surfaces. (a,c) General view showing the epidermal cell outline, anticlinal wall, and curvature of the outer periclinal wall. (df) Showing the striation density of the fine relief of the periclinal wall: (d) dense, (e) moderate, (f) sparse. (g,h) Rodlets of epicuticular crystalloid wax. (ik) Anomalous stomata. Abaxial leaf surface (a,fi). Adaxial leaf surface (be,j,k). Scale bar = 100 μm (i–k); 50 μm (a,c); 10 μm (b,dg); 2 μm (h).
Agronomy 13 00985 g005aAgronomy 13 00985 g005b
Figure 6. Boxplots of the leaf ultrastructure traits of Ricinus communis for all samples and for groups, respectively. (a,b) closed stomatal traits, (c,d) opened stomata, (e,f) epidermal cell size traits.
Agronomy 13 00985 g006
Figure 7. Bar plots and boxplots for soil analysis per site and for groups, respectively: (a,b) soil texture and profile, (c,d) nutrient concentrations, (e,f) soluble salts concentration, and (g,h) CaCO3 (%), EC (ds/m), organic matter (O.M %), and pH.
Agronomy 13 00985 g007
Figure 8. GC-MS chromatogram of Ricinus communis hexane extract.
Agronomy 13 00985 g008
Figure 9. (a,b) Bar plots and boxplots for major phytochemical compounds identified in hexane extract of Ricinus communis per site and for groups.
Agronomy 13 00985 g009
Figure 10. (a) Pearson’s correlation analysis based on the correlation coefficients of Ricinus communis traits of vegetative morphometric characters, soil analysis, and chemical composition. (b) Pearson’s correlation analysis based on the correlation coefficients of Ricinus communis traits of vegetative morphometric characters, soil analysis, and chemical composition.
Agronomy 13 00985 g010
Figure 11. Heatmap analysis of Ricinus communis combined traits (vegetative morphometry, leaf micromorphology, soil analysis, and GC-MS analysis).
Agronomy 13 00985 g011
Table 1. Localities and coordinates of Ricinus communis samples from Egypt.
SiteSample NoCoordinationLocation
11–431°02′40.3″ N 29°42′13.9″ EMehwar Al-Ta’ameir, about 700 m from kilo 26 wastewater treatment plant, and 26 km from West Alexandria.
25–731°00′00.0″ N 29°36′35.2″ E36 km from Alexandria–Matrouh International Coastal Road, and 200 m from Amoun Resort, Sidi Kirayr.
38–930°59′19.3″ N 29°35′27.2″ E39 km from Alexandria–Matrouh International Coastal Road, Sidi Kirayr.
410–1130°49′19.5″ N 29°11′47.8″ EOmayed Biosphere Reserve, Alexandria Desert Road.
512–1330°49′16.4″ N 29°11′49.9″ E1 km from East Omayed biosphere reserve, Alexandria Desert Road.
614–1530°52′07.4″ N 29°20′20.3″ EInternational Coastal Road, 5 km west of El Hammam Central Hospital,
El Hammam.
71630°52′50.7″ N 29°22′07.9″ EInternational Coastal Road, 2 km west of El Marwa Resort, El Hammam, Egypt.
817–1931°00′43.6″ N 29°38′04.7″ E175 m from South Sidi Kirayr Bridge.
920–2130°56′57.6″ N 29°41′27.5″ E3 km from Borg-El Arab International Airport, Borg El-Arab.
1022–2330°56′50.7″ N 29°50′31.9″ ECairo–Alexandria Desert Road, 7 km south of Amaria General Hospital, second Al Amaria.
1124–2530°56′14.3″ N 29°50′57.9″ ECairo–Alexandria Desert Road, 11 km south of Amaria General Hospital, second Al Amaria.
Table 2. Descriptive quantitative data of Ricinus communis vegetative morphometry.
VariableMean ± StDevSE MeanMin.Q1MedianQ3Max.IQR
Plant length (m)2.144 ± 0.7250.1451.021.572.032.73.721.13
Petiole length/leaf length ratio0.9756 ± 0.27850.05570.490.7551.011.1551.540.4
Petiole attachment (%)18.302 ± 2.8380.56811.7616.3117.6520.805234.495
Leaf area (cm2)178.7 ± 90.918.252.9112.1151.8251352.9138.9
Leaf incision (%)63.796 ± 4.4540.89154.8261.52563.7765.75574.44.23
Leaf length (cm)19.351 ± 4.7220.94411.615.80518.4223.3827.497.575
Leaf width (cm)20.57 ± 5.331.0712.316.8219.6225.3830.528.55
Leaf length/width ratio0.9444 ± 0.033180.006640.880.920.940.9710.05
First lobe length (cm)13.51 ± 3.3660.6738.2210.77513.6316.49520.065.72
First lobe width (cm)4.579 ± 1.2170.2432.173.6154.535.51571.9
First lobe length/width ratio3.0224 ± 0.32830.06572.432.78533.2053.970.42
Second lobe length (cm)12.505 ± 3.1610.6327.5510.0911.8315.0418.844.95
Second lobe width (cm)3.864 ± 1.0190.2041.973.263.694.625.511.36
Second lobe length/width ratio3.3036 ± 0.27360.05472.753.153.33.464.150.31
Third lobe length (cm)10.855 ± 2.9240.5856.648.76510.0313.44516.624.68
Third lobe width (cm)3.075 ± 0.8930.1791.722.522.923.8654.721.345
Third lobe length/width ratio3.6092 ± 0.290.0582.943.393.663.8254.170.435
Fourth lobe length (cm)8.916 ± 2.5880.5184.937.148.3411.09513.693.955
Fourth lobe width (cm)2.39 ± 0.7570.1511.251.932.262.773.780.84
Fourth lobe length/width ratio3.8452 ± 0.3780.07563.083.543.794.164.590.62
Fifth lobe length (cm)6.933 ± 2.1870.4373.55.0456.469.13510.214.09
Fifth lobe width (cm)1.739 ± 0.5830.1170.881.2251.722.1952.80.97
Fifth lobe length/width ratio4.103 ± 0.5080.1023.293.7254.064.445.330.715
Depth between first and second lobe (cm)4.948 ± 1.8070.2071.53.6824.6176.0299.192.348
Depth between second and third lobe (cm)4.68 ± 1.690.1941.5593.5244.4355.4728.9021.948
Depth between third and fourth lobe (cm)3.922 ± 1.4890.1711.3132.6973.6434.7977.6092.099
Depth between fourth and fifth lobe (cm)3.028 ± 1.1820.1360.982.0432.8173.8486.2041.805
Table 3. Principal component analysis (PCA) with their Eigenvalues and variance for Ricinus communis based on 27 quantitative morphometric traits.
Dimension 1rDimension 2r
Leaf area (cm2)0.987Third lobe length/width ratio0.818
Depth of third and fourth lobe (cm)0.984Second lobe length/width ratio0.793
Second lobe width (cm)0.980Fourth lobe length/width ratio0.691
Third lobe width (cm)0.980First lobe shape0.679
Fourth lobe length (cm)0.980First lobe length/width ratio0.651
Third lobe length (cm)0.978Second lobe shape0.626
Depth of fourth and fifth lobe (cm)0.9745Third lobe shape0.555
Leaf width (cm)0.973Fifth lobe length/width ratio0.463
Leaf length (cm)0.970Petiole attachment (%)−0.613
First lobe length (cm)0.970
Second lobe length (cm)0.970
Fourth lobe width (cm)0.967
Depth of second and third lobe (cm)0.966
Depth of first and second lobe (cm)0.953
Fifth lobe length (cm)0.948
First lobe width (cm)0.932
Fifth lobe width (cm)0.887
Blade class0.878
Leaf incision (%)−0.568
Leaf length/width ratio−0.425
Eigenvalue17.68Eigenvalue4.640
Variance %53.59Variance %14.06
Cumulative variance %53.59Cumulative variance %67.66
Table 4. One-way ANOVA results and pairwise comparisons between the three groups of Ricinus communis showing the significant morphological traits. Groups that share same letters are non-significant, while different letters represent significantly different groups.
VariableGroup 1Group 2Group 3
Plant length (m)2.207 ± 0.721 a1.931 ± 0.72 a2.403 ± 0.764 a
Petiole length/leaf length ratio0.91 ± 0.2776 a0.962 ± 0.262 a1.097 ± 0.316 a
Petiole attachment (%)17.824 ± 2.417 a19.165 ± 2.671 a17.58 ± 3.74 a
Leaf area (cm2)283.7 ± 50.2 a145.57 ± 17.9 b76.61 ± 22.31 c
Leaf incision (%)60.75 ± 3.64 b64.74 ± 4.19 ab66.8 ± 3.62 a
Leaf length (cm)24.523 ± 1.79 a18.393 ± 1.409 b13.19 ± 1.676 c
Leaf width (cm)26.493 ± 2.318 a19.281 ± 1.459 b13.813 ± 1.622 c
Leaf length/width ratio0.92333 ± 0.01936 a0.958 ± 0.02974 a0.9533 ± 0.0427 a
First lobe length (cm)17.168 ± 1.489 a12.832 ± 1.016 b9.152 ± 1.081 b
First lobe width (cm)5.801 ± 0.575 a4.412 ± 0.549 b3.023 ± 0.624 c
First lobe length/width ratio2.991 ± 0.303 a2.968 ± 0.2523 a3.16 ± 0.475 a
Second lobe length (cm)15.961 ± 1.587 a11.839 ± 0.699 b8.432 ± 0.861 c
Second lobe width (cm)4.937 ± 0.496 a3.672 ± 0.319 b2.577 ± 0.526 c
Second lobe length/width ratio3.2778 ± 0.2954 a3.275 ± 0.1203 a3.39 ± 0.426 a
Third lobe length (cm)14.174 ± 1.402 a10.009 ± 0.645 b7.285 ± 0.769 c
Third lobe width (cm)4.047 ± 0.541 a2.832 ± 0.243 b2.023 ± 0.334 c
Third lobe length/width ratio3.57 ± 0.358 a3.607 ± 0.2132 a3.672 ± 0.33 a
Fourth lobe length (cm)11.871 ± 1.122 a8.121 ± 0.689 b5.81 ± 0.845 c
Fourth lobe width (cm)3.198 ± 0.517 a2.183 ± 0.1863 b1.523 ± 0.315 c
Fourth lobe length/width ratio3.801 ± 0.403 a3.812 ± 0.3083 a3.967 ± 0.48 a
Fifth lobe length (cm)9.416 ± 0.586 a6.249 ± 1.029 b4.35 ± 0.681 c
Fifth lobe width (cm)2.303 ± 0.395 a1.641 ± 0.338 b1.055 ± 0.142 c
Fifth lobe length/width ratio4.252 ± 0.63 a3.923 ± 0.415 a4.178 ± 0.426 a
Depth between first and second lobe (cm)6.744 ± 0.866 a4.494 ± 0.488 b3.052 ± 0.494 c
Depth between second and third lobe (cm)6.322 ± 0.772 a4.3113 ± 0.3129 b2.88 ± 0.459 c
Depth between third and fourth lobe (cm)5.403 ± 0.567 a3.5332 ± 0.2429 b2.373 ± 0.394 c
Depth between fourth and fifth lobe (cm)4.2 ± 0.512 a2.7431 ± 0.1295 b1.766 ± 0.303 c
Table 5. Two-way ANOVA analysis of Ricinus communis abaxial and adaxial leaf ultrastructure traits. Different letters represent significant differences.
CharactersGroup 1
(Samples 8 and 17)
Group 2
(Samples 4 and 12)
Group 3
(Samples 11 and 22)
AbaxialAdaxialAbaxialAdaxialAbaxialAdaxial
Number of stomata14.67 ± 5.77 a13.75 ± 1.258 a16.5 ± 0.707 a15 ± 1.41 a25 ± 13 a17.67 ± 7.23 a
Closed stomata length (µm)9.095 ± 1.337 bc8.567 ± 1.934 c13.5 ± 1.238 ab8.28 ± 3.21 c16.68 ± 4.9 a12.22 ± 1.315 abc
Closed stomata width (µm)4.719 ± 0.395 a3.889 ± 1.345 a5.525 ± 0.602 a3.737 ± 1.469 a6.37 ± 3.1 a4.478 ± 1.261 a
Closed stomata length/width ratio1.948 ± 0.406 b2.288 ± 0.44 ab2.451 ± 0.1606 ab2.2152 ± 0.0771 ab2.957 ± 1.096 a2.87 ± 0.635 a
Closed stomata area (µm2)29.4 ± 2.26 a b26.18 ± 15.42 b60.51 ± 9.43 a21.81 ± 12.36 b88.2 ± 72.9 a40.45 ± 14.81 ab
Opened stomata length (µm)16.78 ± 1.516 a48.9 ± 53.7 a14.26 ± 3.61 a8.652 ± 2.046 b19.263 ± 3.033 a16.922 ± 3.069 a
Opened stomata width (µm)9.323 ± 2.19 ab26 ± 25.6 a6.919 ± 1.473 b4.567 ± 1.076 c9.177 ± 1.37 ab8.577 ± 1.765 ab
Opened stomata length/width ratio1.859 ± 0.337 a1.666 ± 0.294 a2.076 ± 0.358 a1.921 ± 0.321 a2.114 ± 0.276 a2.006 ± 0.322 a
Opened stomata area (µm2)122.3 ± 37.4 a2099 ± 2996 a80.6 ± 36.9 a27.31 ± 11.71 b132.6 ± 38 a110 ± 43.2 a
Stomatal pore length (µm)11.07 ± 2.99 a41.2 ± 48.1 a9.91 ± 2.86 a5.212 ± 1.202 b13.27 ± 2.975 a11.766 ± 2.614 a
Stomatal pore width (µm)5.004 ± 2.176 a12.97 ± 12.99 a4.021 ± 1.12 ab2.319 ± 1.255 b3.611 ± 0.937 ab4.127 ± 1.374 a
Stomatal pore length/width ratio2.411 ± 0.663 b2.621 ± 0.735 ab2.491 ± 0.336 b2.555 ± 0.816 b3.808 ± 0.894 a3 ± 0.631 ab
Stomatal pore area (µm2)38.8 ± 26.9 a743 ± 1063 a29.06 ± 14.69 a8.29 ± 5.11 b33.36 ± 18.13 a35.25 ± 18.73 a
Epidermal cell length (µm)25.4 ± 3.07 bc30.57 ± 5.12 ab22.42 ± 2.7 c13.909 ± 1.818 d35.32 ± 4.51 a31.94 ± 5.65 ab
Epidermal cell width (µm)11.47 ± 3.68 bc21.26 ± 5 a10.491 ± 2.224 c10.75 ± 2.97 c17.83 ± 3.96 a17.06 ± 5.43 ab
Epidermal cell length/width ratio2.369 ± 0.663 a1.494 ± 0.393 ab2.224 ± 0.54 a1.389 ± 0.453 b2.054 ± 0.428 ab1.977 ± 0.52 ab
Epidermal cell area (µm2)260.4 ± 85.1 b600.9 ± 246.8 a199.8 ± 44.1 bc123.7 ± 38.5 c674.6 ± 121.5 a623.7 ± 200.5 a
Table 6. Physicochemical soil properties of Ricinus communis. Where SP refers to Saturation Percentage, and SAR refers to Sodium Adsorption Ration. Different letters represent significant differences.
VariableMean ± StDevSE MeanMin.Q1MedianQ3Max.IQR
Gravel (%)3.533 ± 1.317 c0.5381.72.3753.754.255.61.875
Sand (%)73.5 ± 13.05 abc5.336061.57286.259024.75
Silt (%)19 ± 9.25 c3.7889.519.527.753018.25
Clay (%)7.5 ± 4.04 c1.6524.257.511.25127
SP (%)50.67 ± 6.98 abc2.853945.755156.755911
pH7.5483 ± 0.2046 c0.08357.37.397.557.64757.910.2575
EC (dS/m)17.3 ± 23.75 c9.74.055.968.2524.7165.5518.75
Ca++ (meq/L)118.2 ± 169.8 abc69.32843.855159.5464115.8
Mg++ (meq/L)63.1 ± 89.8 abc36.714.623.129.586.324663.1
Na+ (meq/L)79.1 ± 115.8 abc47.319.625.936.510831582.1
K+ (meq/L)3.217 ± 0.999 c0.4082.12.4752.94.254.71.775
HCO3 (meq/L)9.18 ± 3.8 c1.555.26.178.4511.88165.7
Cl (meq/L)73 ± 100.6 abc41.120.228.335.398.427870.1
SO4−− (meq/L)181 ± 272 ab111396180248736187
SAR7.1 ± 4.75 c1.944.24.55.658.5216.74.02
N (ppm)0.93 ± 0.275 c0.1120.560.6430.9751.151.30.508
P (ppm)9.65 ± 3.7 c1.5166.978.313166.03
K (ppm)192.2 ± 78.5 a32.1137146167225.834879.8
Fe (ppm)0.643 ± 0.279 c0.1140.280.4080.620.9071.020.5
Zn++ (ppm)0.3217 ± 0.0679 c0.02770.270.27750.2950.36750.450.09
Mn++ (ppm)0.2883 ± 0.1158 c0.04730.180.21750.230.4050.480.1875
Cu++ (ppm)0.2133 ± 0.1724 c0.07040.030.060.1750.39250.460.3325
O.M. (%)0.1267 ± 0.0758 c0.03090.060.060.10.2150.230.155
CaCO3 (%)19.67 ± 3.41 c1.3915.716.91922.75255.85
Table 7. Major phytochemical compounds identified in hexane extract of Ricinus communis. RT: Retention time (in minutes); MF: molecular formula; MW: molecular weight. Different letters represent significant differences.
RtPhytochemical CompoundsM.FM.WMean ± StDevSE MeanMin.Q1MedianQ3Max.IQR
10.97IsophytolC20H40O2961.383 ± 0.965c0.3940.420.4951.32.033.081.535
13.53n-Hexadecanoic acidC16H32O225629.78 ± 6.15a2.5122.0423.6630.6735.2136.2511.55
16.889,12,15-Octadecatrienoic acidC18H30O227822.65 ± 3.92b1.617.3118.9823.2625.9726.866.99
15.27Oleic acidC18H34O22820.22 ± 0.1361c0.05560.130.13750.170.28750.490.15
17.10Octadecanoic acidC18H36O22843.63 ± 0.676c0.27633.2033.53.9124.940.71
19.24Tributyl acetylcitrateC20H34O84021.552 ± 1.54c0.6290.150.1651.1453.253.553.085
Disclaimer/Publisher’s Note: The statements, opinions and data contained in all publications are solely those of the individual author(s) and contributor(s) and not of MDPI and/or the editor(s). MDPI and/or the editor(s) disclaim responsibility for any injury to people or property resulting from any ideas, methods, instructions or products referred to in the content.

