Article

Influence of Long-Term Organic Fertilization on Changes in the Content of Various Forms of Sulfur in the Soil under Maize Monoculture

Department of Agro-Environmental Chemistry and Plant Nutrition, Faculty of Agrobiology, Food and Natural Resources, Czech University of Life Sciences, 16500 Prague, Czech Republic
*
Author to whom correspondence should be addressed.
Agronomy 2023, 13(4), 957; https://doi.org/10.3390/agronomy13040957
Submission received: 10 February 2023 / Revised: 20 March 2023 / Accepted: 21 March 2023 / Published: 23 March 2023
(This article belongs to the Topic Plants Nutrients)

Abstract

:
Sulfur nutrition is a crucial part of proper crop growth. In this study, we investigated the influence of organic fertilizers in a long-term field experiment (23 years) with continuous maize monoculture. We focused on: (a) changes in the soil sulfur fraction pools, (b) the balance of total sulfur inputs and outputs, and (c) sulfur uptake by maize. The following treatments were selected: unfertilized control (Control), urea and ammonium nitrate (UAN), UAN and wheat straw (UAN + St), sewage sludge (SS), farmyard manure (FYM), and slurry (Slurry). Using sequential extraction, we determined water-soluble (SW—in water), adsorbed (Sads—in 0.032 mol L−1 NaH2PO4), and available (Sav = SW + Sads) sulfur content. Microwave-assisted digestion in an Aqua regia solution was used to measure the pseudo-total sulfur content (Spt). Organic-bound sulfur (Sorg) was calculated as a difference between Spt and Sav. We found that average biomass yields responded to a uniform 120 kg N ha−1 year−1 dose, rather than the dose of S in fertilizers, with an increase over the Control by 34–49%. The effect of an additional 33.5 kg N ha−1 year−1 on UAN + St treatment was not significant. Average sulfur uptake responded to increased yields (69-121% higher than Control), rather than the sulfur application, with the exception of SS, where the dose of sulfur was high enough to cause an additional uptake. In the topsoil, we discovered a significant decrease over time (from 1997 to 2019) in water-soluble (SW), adsorbed (Sads), available (Sav), and pseudo-total (Spt) fractions on all treatments to 29, 59, 37, and 82% of their initial values, respectively. For all treatments, the proportion of Sorg in Spt increased over time, which was caused by the decrease in mineral fractions (SW, Sads, Sav). The absolute content of Sorg decreased over time for all treatments except SS and FYM to about 85% of the initial value. Using the simple balancing method, we calculated that UAN + St, SS, FYM, and Slurry treatments annually lost 8.04, 66.1, 21.4, and 26.8 kg of S ha−1, respectively. This loss was attributed to the decrease in atmospheric depositions, as well as the release of sulfur from soil organic matter (for UAN + St and Slurry treatments) and a high proportion of easily mineralizable and inorganic sulfur from the SS treatment. Generally, the FYM fertilizer provided the highest potential for maintaining soil Spt status.

1. Introduction

Sulfur is a key nutrient in agriculture. It influences the metabolism of the plant itself [1], as well as crop yields and quality [2]. Some soil sulfur inputs are required for proper crop production.
In the most recent history, one of the biggest avenues of sulfur inputs was atmospheric depositions, but, due to desulfurization technologies in the industry, this path is no longer sufficient [3,4]. In the Czech Republic, the amount of sulfur supplied through wet and dry atmospheric depositions decreased from the hundreds to tens of kilograms of sulfur per hectare in the late 1980s to the 1990s, respectively [5,6]. Currently, in the Czech Republic, the sulfur inputs through the atmosphere are in the range of 4–5 kg per hectare annually [7]. This trend is reflected throughout all of Europe, where a similar decrease was reported by Gao et al., [8]. This decrease is a consequence of the reduction of sulfur-containing emissions from the industry. The European environmental agency reported a decrease in emissions in Europe by 74% between 1990 and 2011 [9]. Similarly, a 90% decrease in sulfur-containing emissions has also been present in the Czech Republic [7,10]. The development in the sulfur depositions, as well as the use of high-analysis fertilizers with a low content of sulfur, has caused the crops to show symptoms of sulfur deficiency [3]. On top of that, another contributing factor is also high pure nitrogen fertilization, which leads to an increase in yields and can lead to an increase in the uptake of other nutrients [11,12,13]. The combination of these factors can lead to deficiencies in plant sulfur nutrition [4] for crops such as maize (Zea mays L.), which seem to respond well to sulfur fertilizers at doses in the range of 25 to 60 kg of sulfur [14,15,16].
Sulfur in the soil is present either in the organic or mineral (inorganic) form [1]. The mineral fraction represents around 5–10% of the total sulfur content, and the content of mineral sulfate (SO4−2) anions is important for plant nutrition [17,18]. Mineral sulfates can be present in three forms: (i) water-soluble and most easily available to plants, which usually represents around 1% of the total S content, (ii) adsorbed sulfur on the soil particles, which can be released easily into the water-soluble fraction and supply the plants with sulfur (together, water-soluble and adsorbed sulfate fractions are regarded as plant available), and (iii) as a co-precipitated sulfur fraction occluded in the precipitates of magnesium and calcium carbonates [17,19], which are generally unavailable to plants, yet can be very slowly released [20].
Mineral sulfates are very mobile and susceptible to leaching into the subsoil [21,22,23,24], or even the ground waters [25]. Due to high mineral S inputs from atmospheric depositions, this release was measured in the European soils [21,22], as well as the Czech Republic [23,26]. On the other hand, organic-bounded sulfur is generally unavailable to plants, as it is less soluble; nevertheless, throughout the vegetation, a certain mass can be mineralized and released [20,21,27] to help with maintaining a steady supply of sulfur. This process can lead to a significant increase in sulfates in water streams [3].
A decrease in total sulfur content in the soil was reported in the Czech Republic between the years 1981 and 2007, from 221 mg S kg−1 to 204 mg S kg−1 [28]. This decrease does not seem dramatic at first, but in the study, the authors also measured an average decrease in water-soluble, adsorbed, and available sulfur content by 66.5, 41.5, and 50%, respectively. A similar investigation between the years 1996 and 2014 was carried out in the study by [29], and the same trend was found. Mehlich 3 sulfur extraction [30] has recently been introduced as a possible determination of plant-available sulfur in soil in the Czech Republic [18,31], and there is also a significant decrease in Mehlich 3 extractable sulfur in the Czech soils [31], which further confirms the trends.
The application of sulfur-containing fertilizers is helpful in sustaining good crop nutritional status. Generally, mineral fertilizers contain sulfur in the sulfate anion (for example, ammonium sulfate or magnesium sulfate) [11], but these are quite mobile [21,22,24] or different forms of elemental sulfur (S0), such as micronized or mixed with bentonite clay [21], that are less mobile and less susceptible to leaching, yet might be problematic in sustaining proper sulfur supply for fast-growing crops such as maize [32].
On the other hand, the application of organic wastes in agriculture can be of great importance to maintain soil fertility [33]. It was found that, in order to maintain or even increase total sulfur content (and organic-bound sulfur as well) to a steady supply of sulfur in the soil, there must be a steady input of carbon in the organic matter [34], and this has been demonstrated in farmyard manure and sewage sludge application. This is something that Knights et al. [35] did not find in their experiment, where the annual application of mineral sulfur fertilizers over the course of 150 years did not, in fact, increase total sulfur content. The ability of organic fertilizers to maintain steady levels of sulfur in the soil can be different and is based on the kind of fertilizer and its origin. Therefore, more stable materials might prove more effective than materials with more unstable compositions (such as slurries, [36,37]). For example, the sewage sludge produced by water treatment facilities is an environmental problem and can partially be resolved by using the sludge as a fertilizer [38]. Out of total sewage sludge production, about 37% is used in agriculture in Europe [39]. Out of all the countries in the European Union, more than half recycle over 50% of their sewage sludge production into their agriculture [40]. This material has a large pool of potentially mineralizable sulfur [34] and is water soluble [41,42].
This study aimed to investigate the soil sulfur status under the conditions of 23 years of continuous maize monoculture fertilized by several organic fertilizers. Specifically, the assessment included: (a) changes in the soil sulfur fraction pools, (b) the balance of total sulfur inputs and outputs, and (c) sulfur uptake by maize.

2. Materials and Methods

The experiment was conducted at the long-term stationary experiment site of the Czech University of Life Sciences in Prague located at Červený Újezd. The field trials were initiated in the year 1993. The experimental site characteristics at the beginning of the trials are presented in Table 1. Information about current nutrient levels, as well as pH, is presented in Table 2. The trials were conducted in a complete block design. There were four blocks; each block had all fertilizer treatments arranged into individual plots. This means each treatment was replicated 4 times. Area of plot was 170 m2. The silage maize hybrids (Zea mays L.) were planted at a density of 80,000 plants per ha. Average monthly air temperature and precipitation are displayed in Figure 1.

2.1. Treatments

Six fertilizer treatments were selected, namely: (1) unfertilized control (Control); (2) urea and ammonium nitrate (UAN); (3) UAN and wheat straw (UAN + St); (4) sewage sludge from municipal water treatment facility (SS); (5) cattle farmyard manure (FYM); and (6) cow slurry (Slurry). Annual nutrient inputs from fertilizers are described in Table 3. UAN fertilizer was applied in spring before sowing. Other fertilizers were applied in the autumn before tillage. All organic fertilizers were immediately incorporated into the soil by ploughing. Every fertilizer was applied in a single dose. No additional amendments were added to individual treatments; only stubble from the previous year was incorporated into the soil. Sulfur content analysis in stubble and roots was not performed.
Total sulfur inputs including annual sulfur deposition (dry and wet) are described in Table 4. Precipitation (as the only source of soil water) was measured directly at the experimental site; however, the site was not equipped to detect S depositions. The sulfur deposition data were provided by the meteorological station at Prague in Ruzyně that belonged to the Czech Hydrometeorological Institute. This was the nearest professional station measuring S depositions (the distance is about 10 km by air; GPS: 50°6′0.6″ N, 14°15′19.8″ E).

2.2. Plant Analyses

Every year, once the silage maize reached maturity (BBCH 75 or R4 vegetative stage, roughly 65% biomass moisture), the aboveground maize biomass from every plot was harvested and weighed to obtain the biomass yield (BY)—more precisely, two middle rows were harvested (area of 20 m2). Dry matter content was determined at 105 °C.
To determine the plant sulfur content, the dried samples (for 72 h at 40 °C) were fine milled (<1 mm) (Retsch SM100, Haan, Germany) in laboratory. To determine the plant sulfur content, a wet digestion analysis was performed. Briefly, an aliquot 0.25 g of milled sample was weighed and immersed in nitric acid (7 mL of 65% HNO3) and hydrogen peroxide (2 mL of 30% H2O2). Samples were then digested in a microwave-assisted high-pressure environment. The whole procedure is further described in Tlustoš et al. [44]. This analysis was performed twice for every plot, that is, 8 times per treatment.

2.3. Soil Analyses

Topsoil subsamples (0–30 cm depth) were collected in 1997, 2008, and 2019 after the biomass harvest from every plot and pooled together to get one soil sample per plot. Subsoil subsamples (30–60 cm depth) were collected in 1997 and 2019 after harvest from every plot and pooled together to get one subsoil sample. Every sample was later air dried in a forced-air oven until reaching constant weight at 40 °C; then, samples were ground and sieved for particles <2 mm. These samples were archived until further analysis.
To study the changes of different sulfur fractions in topsoil and subsoil, the following methods were selected: A sequential extraction method by Morche [20] and modified by Kulhánek et al. [18] for available sulfur fractions determination. Briefly, samples were extracted with demineralized water (1/10 w/v) to extract the readily available S (SW) fraction and subsequently with 0.032 mol L−1 NaH2PO4 to extract the adsorbed sulfur (Sads) fraction After the distilled water was added, the sample was shaken for 30 min, then centrifuged for 5 min at 8000 g. The supernatant was removed and stored in the freezer at 5 °C until further analysis. The same soil sample was then extracted with sodium dihydrogen phosphate, and the process was repeated. The sum of sulfur in these fractions was then the bioavailable sulfur (Sav). Usually, extraction by 1 mol L−1 HCl follows the extraction of Sads to determine carbonate-occluded S, but this determination was omitted due to the low carbonate content in the investigated soil.
The pseudo-total sulfur (Spt) concentration in the soil was determined by the modified ISO 11466 1995 [45] method using Aqua regia extraction. The modification was microwave-assisted high-pressure digestion and evaporation of samples using a heating plate (150 °C) and subsequent quantitative transfer with distilled water to a final volume of 25 mL glass tube, which were topped up by deionized water and kept at laboratory temperature until measurements were taken.
The organic sulfur content (Sorg) was calculated as the difference between the pseudo-total content (Spt) and available (Sav) content. Mehlich 3 extraction was also performed following Mehlich [30] in order to also evaluate the SM3 fraction. Briefly, an aliquot of the soil sample was extracted by Mehlich 3 solution (1/10 w/v). The sample was then shaken for 5 min and filtered. The filtered extract was stored in a freezer at 5 °C until further analysis. Sequential extraction, Mehlich 3 extraction, and Aqua regia digestion were performed once on every plot, that is, four times per treatment. In 1997 and 2008, the sequential and Mehlich 3 extractions were not performed for subsoil. Aqua regia digestion was not performed in 2008.
Sulfur concentrations in all digests and extracts were determined using optical emission spectroscopy with inductively coupled plasma (ICP-OES) with axial plasma configuration, Varian, VistaPro, equipped with autosampler SPS-5 (Mulgrave, Australia). The operating measurement wavelength for ICP-OES was 180.7 nm for S.
All statistical evaluations were performed using STATISTICA software, version 13 (TIBCO, Palo Alto, CA, USA). Even though trials started in 1993, we evaluated the period of 1997–2019, since a more representative dataset was available. Two-way ANOVA was performed to investigate the interaction of year x treatment and its influence on topsoil S fractions. Since we did not have historical data for the subsoil S content (except for Spt), a two-way ANOVA was not performed. The one-way ANOVA analysis was performed to individually test the influence of year on the topsoil and subsoil sulfur fractions, as well as biomass sulfur content. The same was performed to test the influence of the fertilizer treatment over topsoil and subsoil sulfur fraction content, plant biomass sulfur, uptake, and yield. The differences between means were determined using Tukey´s HSD post-hoc test at p < 0.05. The Spearman rank correlation was performed to determine which topsoil sulfur fraction was most related to the content of sulfur in biomass. Only results for p < 0.05 are presented, as lower p-values (0.01) produced no significant results.

3. Results

3.1. Biomass Yield and S Uptake

Statistical analysis of the average maize yield during the period 1993–2019 (Figure 2a) revealed significant differences between the unfertilized Control treatment and all other fertilized treatments. Meanwhile, differences between the fertilized treatments were all within variance and were not significant.
Further data are shown in Figure 2b, where the average sulfur uptake in the period of 1993–2019 is reported. The Control treatment showed the significantly lowest values of sulfur uptake by maize in comparison with the fertilized treatments. During this time, there were significant differences, even between the fertilized treatments. Maize with FYM and Slurry treatments had significantly lower S uptakes than plants on SS treatment (which reached the highest uptake of S). UAN and UAN + St treatments were comparable to Slurry and FYM, as well as SS treatments.
Table 5 shows plant sulfur content in the years 1997, 2008, and 2019. Judging by the italic letters (comparison of treatments) the Control treatment always reached the significantly lowest S content, while the SS treatment reached the highest content in 2008 and 2019. Judging by the standard letters (comparing the difference between the year in one treatment), it is evident that the S content for all treatments decreased as time moved on.
The maize sulfur uptake is further examined in Table 6. Judging by the italic letters, there were significant differences between treatments, even at the beginning of the experiment. UAN and SS treatments already differed enough from the Control treatment and kept this trend for the duration of the entire experiment. UAN + St was comparable with the Control in the first period; however, in the second and all the following periods, it became significantly different from the Control. Generally, during all of the following periods, all treatments produced significantly higher values than the Control. Overall, the highest uptake was always present in the SS treatment.
Evaluating the changes in treatments in years (judging by standard letters) shows that all treatments produced lower uptakes in later periods than the earlier ones, even in the fertilized treatments. Only results from the last three periods were compared, as these periods consisted of an equal number of years.
Spearman’s correlation coefficient was calculated in order to evaluate the importance of each soil sulfur fraction in maize nutrition (Table 7, results of 1997, 2008, and 2019 were pooled together for this analysis). Given the influence of the fertilizer treatment over the values, the relationship between the values was monotonic. Therefore, Spearman’s correlation was chosen. The test revealed that SW, Sads, Sav, SM3, and Sorg fractions were significant in this relationship. The relationship between plant S content and soil Spt fractions was not significant.

3.2. Topsoil Sulfur Content

A two-way ANOVA was performed for topsoil in order to establish the influence of the year and treatment and their interaction with the content of S fractions in topsoil. The results in Table 8. show that there was no significant interaction for year and treatment. On the other hand, individually, these effects had significant influences on the content of S fractions in topsoil.
To further investigate the effect of the year on the content of S fractions in topsoil, a one-way ANOVA was performed. The results of the soil S content analysis revealed the same pattern across all soil sulfur fractions. The mineral fraction, namely SW, Sads, Sav, and SM3 in Figure 3, Figure 4, Figure 5 and Figure 6, respectively showed a significant decrease in sulfur pools in all treatments, whether fertilized or not. Generally, the biggest significant decrease happened between the years 1997 and 2008 for SW and Sav, while the decrease from 2008 and 2019 was smaller and, in many cases, was not significant. The rate of decrease in S pools for Sads and SM3 fractions from 1997 to 2008 was not as big as the rate for SW and Sav. The Sav content resembled the changes in the SW and Sads fractions, because the Sav fraction content was calculated as a sum of water-soluble and adsorbed content. The proportion of SW in Sav changed over the years. In 1997, the proportion of SW in Sav from all treatments around was, on average, 76%. In 2019, this proportion was, on average, around 60%. On the other hand, the proportion of Sads in Sav increased accordingly.
The significantly decreasing soil sulfur pools were found even in the Spt (Figure 7) fraction with few exceptions. Firstly, although the SS treatment showed a decreasing trend, due to variability in results, the decrease was insignificant. Given several more years, the situation would be likely to change. The second exception was the FYM treatment, which produced insignificant changes. The FYM and SS treatments had, in general, the highest contents of Spt fractions. The percentages present in each column of Figure 7 show the proportion of organic sulfur out of the pseudo-total. It is evident that, in all treatments, the proportion of organic sulfur increased over time. This means that mineral S pools accordingly decreased over the course of the experiment. On average, the proportion of Sav in Spt in 1997 was 15.4%, while the same proportion in 2019 was only 7.7%.
The results present in Figure 8 describe changes in the Sorg fraction over time for each treatment (calculated as the difference between the pseudo-total content and available content). The lowest content of sulfur in this fraction, as well as the most significant decreases, were present in the Control and UAN. On the other hand, the organic sulfur content did not produce any significant change in organic fertilized treatments, namely, the SS, FYM, and Slurry. It is important to note that the Slurry treatment showed a decreasing trend. This trend might become significant over more time.
The data presented in Table 9 allow further investigation of the soil S changes in individual fractions. The presented values are a ratio comparing the 1997 S content to the 2019 S content. Generally, we can see that the biggest decrease in soil S happened for the SW fraction, down to 23–42%, of the 1997 content. The FYM SW content for this treatment was significantly higher than that of the control. The content of S in the Sav fraction decreased to 31–48%; however, there were no differences between treatments, which is likely due to the fact that the Sav fraction has to reflect changes in both the SW (where some changes were significant) and Sads fractions (where all the values were not statistically different from each other). Sulfur in the Sorg fraction showed a change to 81–101% of the 1997 values. Organic fertilizer treatments in this fraction produced a smaller decrease than the Control and UAN treatments. On the other hand, statistical differences were only present between the control and FYM treatments. This also corresponded to a decrease in the Spt fraction, where the SS, FYM and UAN + St fractions showed a smaller decrease than the other treatments.

3.3. Subsoil

The results of the subsoil S content analysis are presented in Table 10. Since the results in previous years are incomplete, we decided to only present the findings of the year 2019. Table 10 shows differences between the treatments in each of the investigated S fractions. For the SW fraction, the Control was comparable to the UAN and UAN + St, while it was significantly lower than the FYM and Slurry. It is also important to note that the SS treatment was significantly higher than all of the previous treatments (with a roughly six times greater value than the Control). For the Sav fraction, the S content in the Control reached higher values than the UAN and UAN + St and lower values than the FYM and Slurry. Nevertheless, the Control was statistically comparable to those treatments. The UAN and UAN + St had significantly lower S contents than the FYM and Slurry. All treatments showed also significantly lower values than the content of S in the SS treatment. Interestingly, the sulfur content of the SS treatment was comparable to the FYM, Slurry, and UAN + St treatments in the Sads fraction and, furthermore, the SS treatment in the Sorg fraction was comparable to the content of the Control, UAN + St, and UAN. The highest Sorg content reached by the FYM treatment was significantly different from all fractions, except for the Slurry. Out of the Sav fraction, the SW fraction for the Control, UAN, and UAN + St treatments comprised 56.7–59.3%. The FYM and Slurry comprised 68.2–68.7%, and the SS reached up to 81.3%.
Changes in the Spt fraction in the subsoil are described in Figure 9. Both the SS and UAN treatments presented a decrease in sulfur from the year 1997 to 2019 in this fraction. Due to variability, this decrease is not significant. The Control, UAN + St, and Slurry treatments showed an insignificant increase, while the FYM content stayed the same in both years. Judging by the italic letters, the content of S in this fraction in the year 2019 was lowest for the UAN treatment, which was statistically comparable to the Control, UAN + St, and Slurry treatments. Significantly high S contents were produced by the SS and FYM treatments.
The SW and Sav content proportion of the Spt in 2019 subsoil was, on average, 6.2% and 8.9%, respectively. It is important to note that, for the SS treatment, this proportion was 15.7% and 19.3% for the SW and Sav, respectively. Other values fell close to the average.

3.4. Comparing the Pseudo-Total Sulfur Pools in Topsoil and Subsoil

Pseudo-total sulfur content in the topsoil (0–30 cm depth) and subsoil (30–60 cm depth) is present in Table 11 in kilograms of sulfur per hectare. These values were calculated from the Spt content, which is also presented in Figure 7 (for topsoil) and Figure 9 (for subsoil).
Judging by the italic letters for the topsoil, the differences between treatments were the same for both years 1997 and 2019. Generally, the Control, UAN, and UAN + St treatments had statistically comparable contents of S. The SS and FYM significantly had the highest contents of S and were comparable to each other. The Slurry treatment was comparable to both groups. When focusing on the development of the S content over the years (judging by the standard letters) it is visible that the Control, UAN, and Slurry treatments showed a significant decrease in soil S.
Regarding the subsoil, there were no statistically significant differences between treatments in the year 1997. In the year 2019, the lowest values were produced by the UAN treatment, which was comparable to the Control. The SS and FYM reached the highest significant contents of S. The Slurry and UAN + St were comparable to all groups, due to their high variability.
The balance row describes how much sulfur each of the treatments gained (+) or lost (−) during the entire experiment. Overall, in the topsoil, only the loss of pseudo-total sulfur content was registered (ranging from −76 to −260 kg S ha−1). For the subsoil, the only treatments that registered the influx were the UAN + St and Slurry (+67 and +45 kg S ha−1, respectively), while all other treatments lost S content (ranging from −1 to −171 kg S ha−1).

3.5. Sulfur Movement in Topsoil and Subsoil

Table 12 describes the vertical movement of the pseudo-total sulfur in topsoil and subsoil during the trials. In the topsoil, the smallest loss was present for the UAN treatment, followed by the UAN + St and Control treatments at 221, 252, and 356 kg S ha−1, respectively. The FYM and Slurry reached the loss of 492 and 661 kg S ha−1, respectively. The greatest S loss was calculated for the SS treatment with 1350 kg S ha−1. The trend was similar for the subsoil, where the smallest loss was present for the UAN + St, Control, and UAN treatments at 186, 309, and 366 kg S ha−1, respectively. The FYM and Slurry lost 493 and 616 kg S ha−1, respectively. The SS treatment also lost the most S in the subsoil at 1521 kg S ha−1.

4. Discussion

4.1. Biomass Yields and Maize Sulfur Uptake

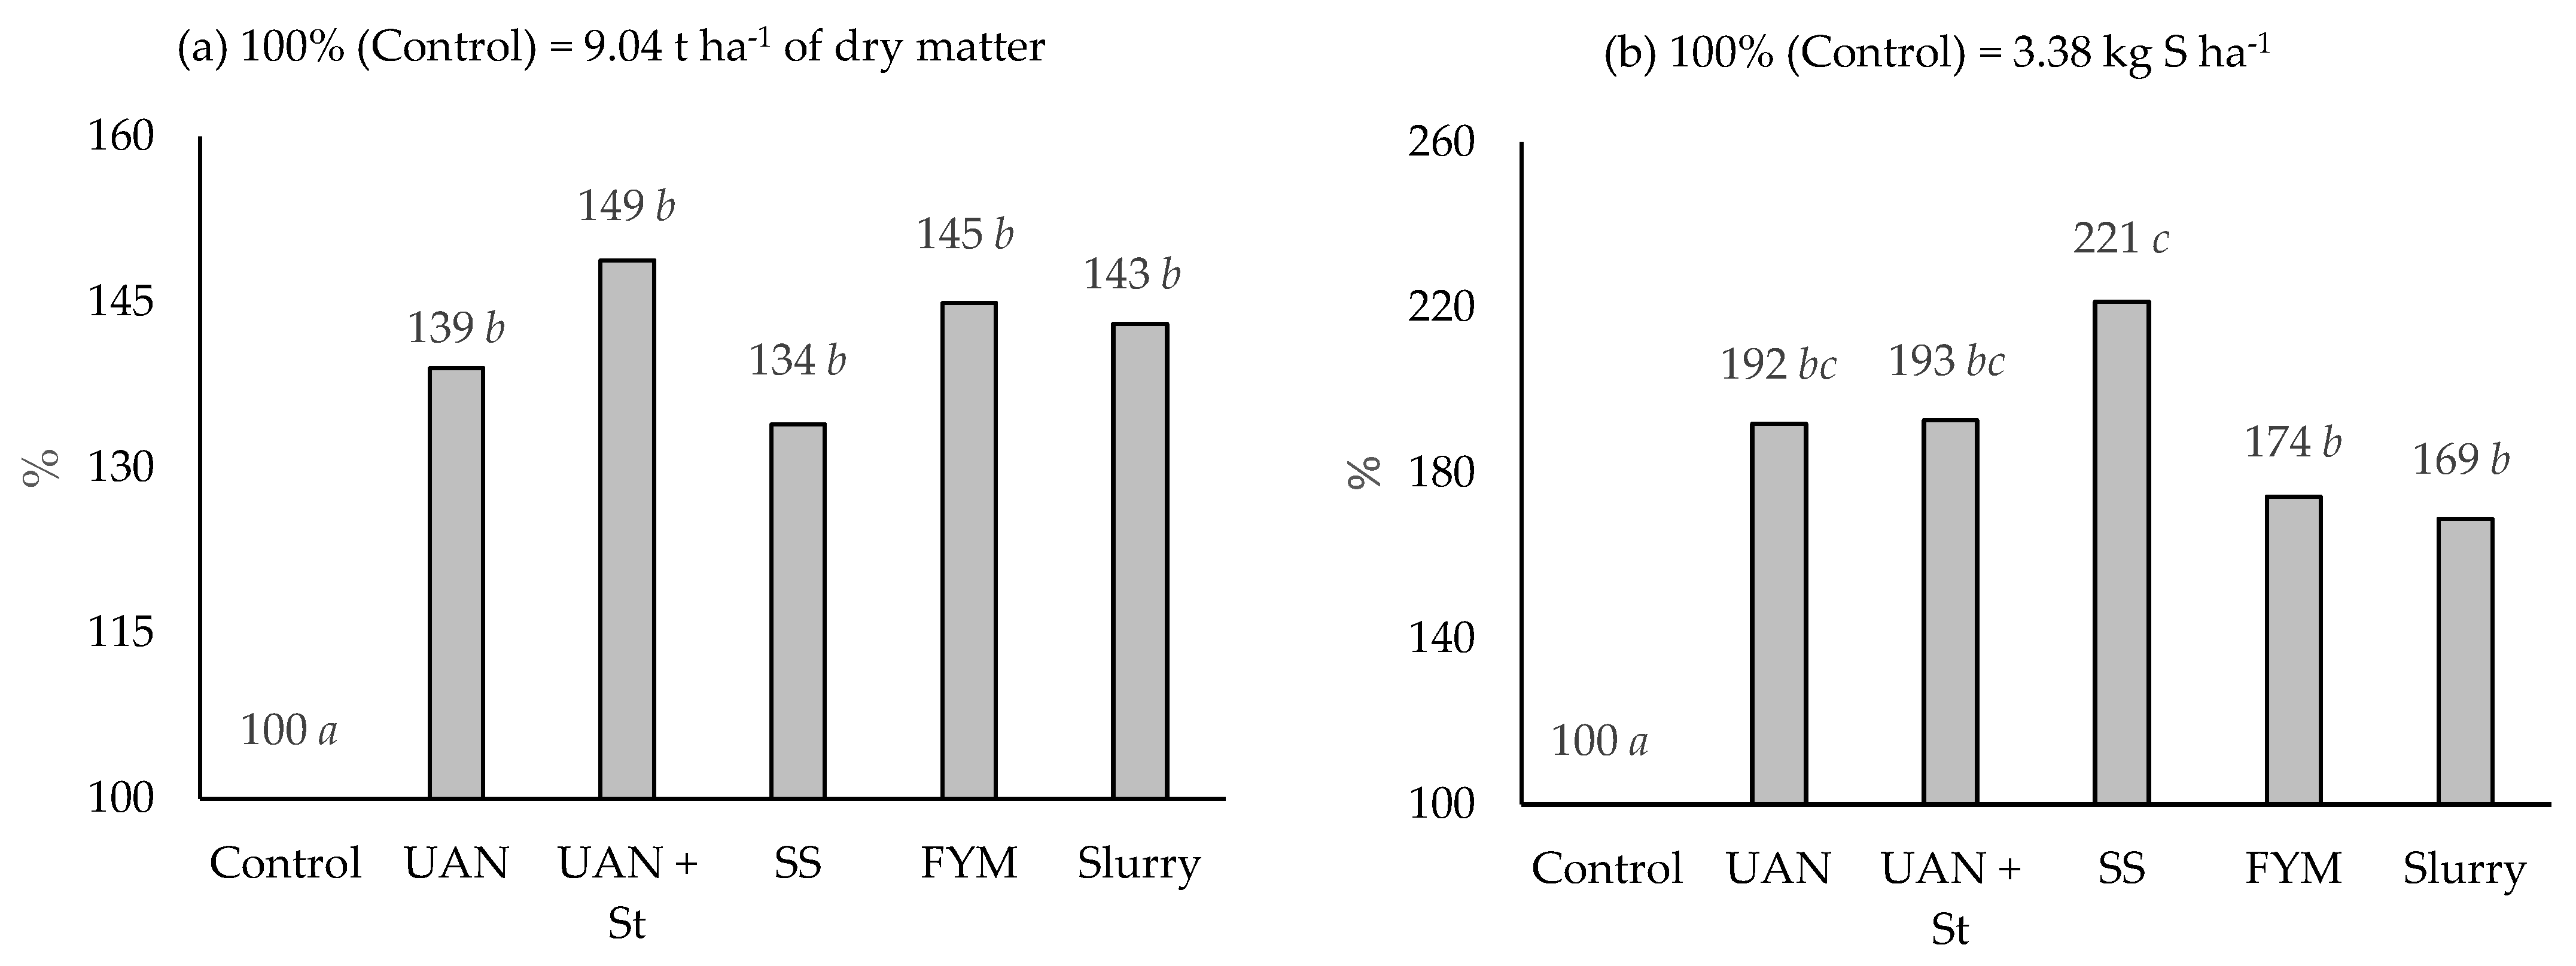
The average relative biomass yields from the entire experiment are displayed in Figure 2a. The Control treatment significantly produced the lowest yields of biomass from the fertilizer treatments. The differences in yields between all fertilizer treatments were insignificant. All treatments, with the exception of the Control, received 120 kg of N ha−1 year−1 as fertilizer. On top of that, the UAN + St treatment received an additional dose of 33.5 kg of N ha−1 year−1 from the straw. Even though the yields for this treatment were, on average, the highest, there was no significant difference from other fertilizer treatments. Different sulfur inputs played no role in the production of yields, as maize seemed to respond to nitrogen fertilizer. The soil P, K, Mg, and Ca supply (Mehlich 3 extractables) was sufficient for maize growth for all treatments (Table 2).
The relative sulfur uptake (Figure 2b) from the entire experiment showed more varying results than yields. Maize from the Control treatment without any fertilizer inputs significantly produced the lowest uptake. On the other hand, the highest uptake was produced by maize from the SS treatment, which received 52.4 kg of S ha−1 year−1 as fertilizer (the highest dose in this experiment).
Godlewska [46] reported an increase of 140% and 130% in S uptake over their control by plants in composted sewage sludge and fresh sewage sludge treatments, respectively. An increase in the uptake of sulfur by maize was also reported by Sakal et al. [47]. An increased uptake of S was also presented by Knights et al. [35], where a long-term application of FYM in a maize monoculture caused an increase in uptake to 11 kg of S ha−1 year−1 over their control (2.0 kg of S ha−1 year−1).
Statistically comparable to the uptake of S for the SS treatment were the UAN and UAN + St treatments, although the UAN + St received 2.61 kg of S ha−1 year−1. Interestingly, the increases in the uptake of S for the UAN and UAN + St treatments were most likely produced by the dose of 120 kg of N ha−1 year−1 on these treatments. This phenomenon was also measured by Weil and Mughogho [12], where a significant increase in S uptake was produced for a treatment that received 80 kg of N ha−1 year−1 and no sulfur as fertilizer. Similarly, Knights et al. [35] also determined that pure mineral N fertilization (96 kg N ha−1 year−1) with zero sulfur caused a 2.6 fold increase in S uptake.
Table 7 shows a correlation analysis of the plant sulfur content with the soil sulfur content in individual fractions. SW, Sads, Sav, and Sorg content correlated with plant p < 0.05. The results of correlation analysis agree with Boye et al. [27] and Morche [20], who mentioned that these fractions are very critical for proper plant nutrition. These authors also mentioned that Sorg content can be mineralized throughout the period of crop growth and resupply the mineral fractions, thus explaining the correlation of plant S content with soil Sorg content. There was a significant correlation between SM3 content and plant sulfur content. Sedlář et al. [48] also describe this relationship between plant sulfur content and SW and SM3 soil content on a wide variety of soil types and crop rotation systems that included maize across the entire Czech Republic.
Generally, the content of plant S was greater for fertilizer treatments in comparison with the Control (Table 5), although, in some cases, in years 2008 and more so in 2019, the difference was insignificant. This is an important factor to note, since S is part of the primary and secondary metabolism in crops [1] and generally can influence yield quality [2]. Since we analyzed the entire aboveground biomass and not just the grain, we cannot comment on the influence of fertilization on the S content in the grains. In summary, the increase in yields can be attributed to the dose of nitrogen, and the sulfur dose had no significant effect on yields. The overall increase in S uptake for all N fertilizer treatments in our experiment can be mostly attributed to the application of nitrogen. The application of nitrogen fertilizer in sufficient doses increases crop yields [12,13,47] and, thus, also increases the uptake of other nutrients [13], including sulfur [49]. On the other hand, the application of sulfur in the SS treatment at the dose of 52.4 kg of S ha−1 year−1 was sufficient enough to produce a significant increase in biomass sulfur concentration and, in turn, increase the sulfur uptake over the FYM and Slurry treatments, which both received approximately only 16 kg of S ha−1 year−1 and the same dose of N as the SS treatment.

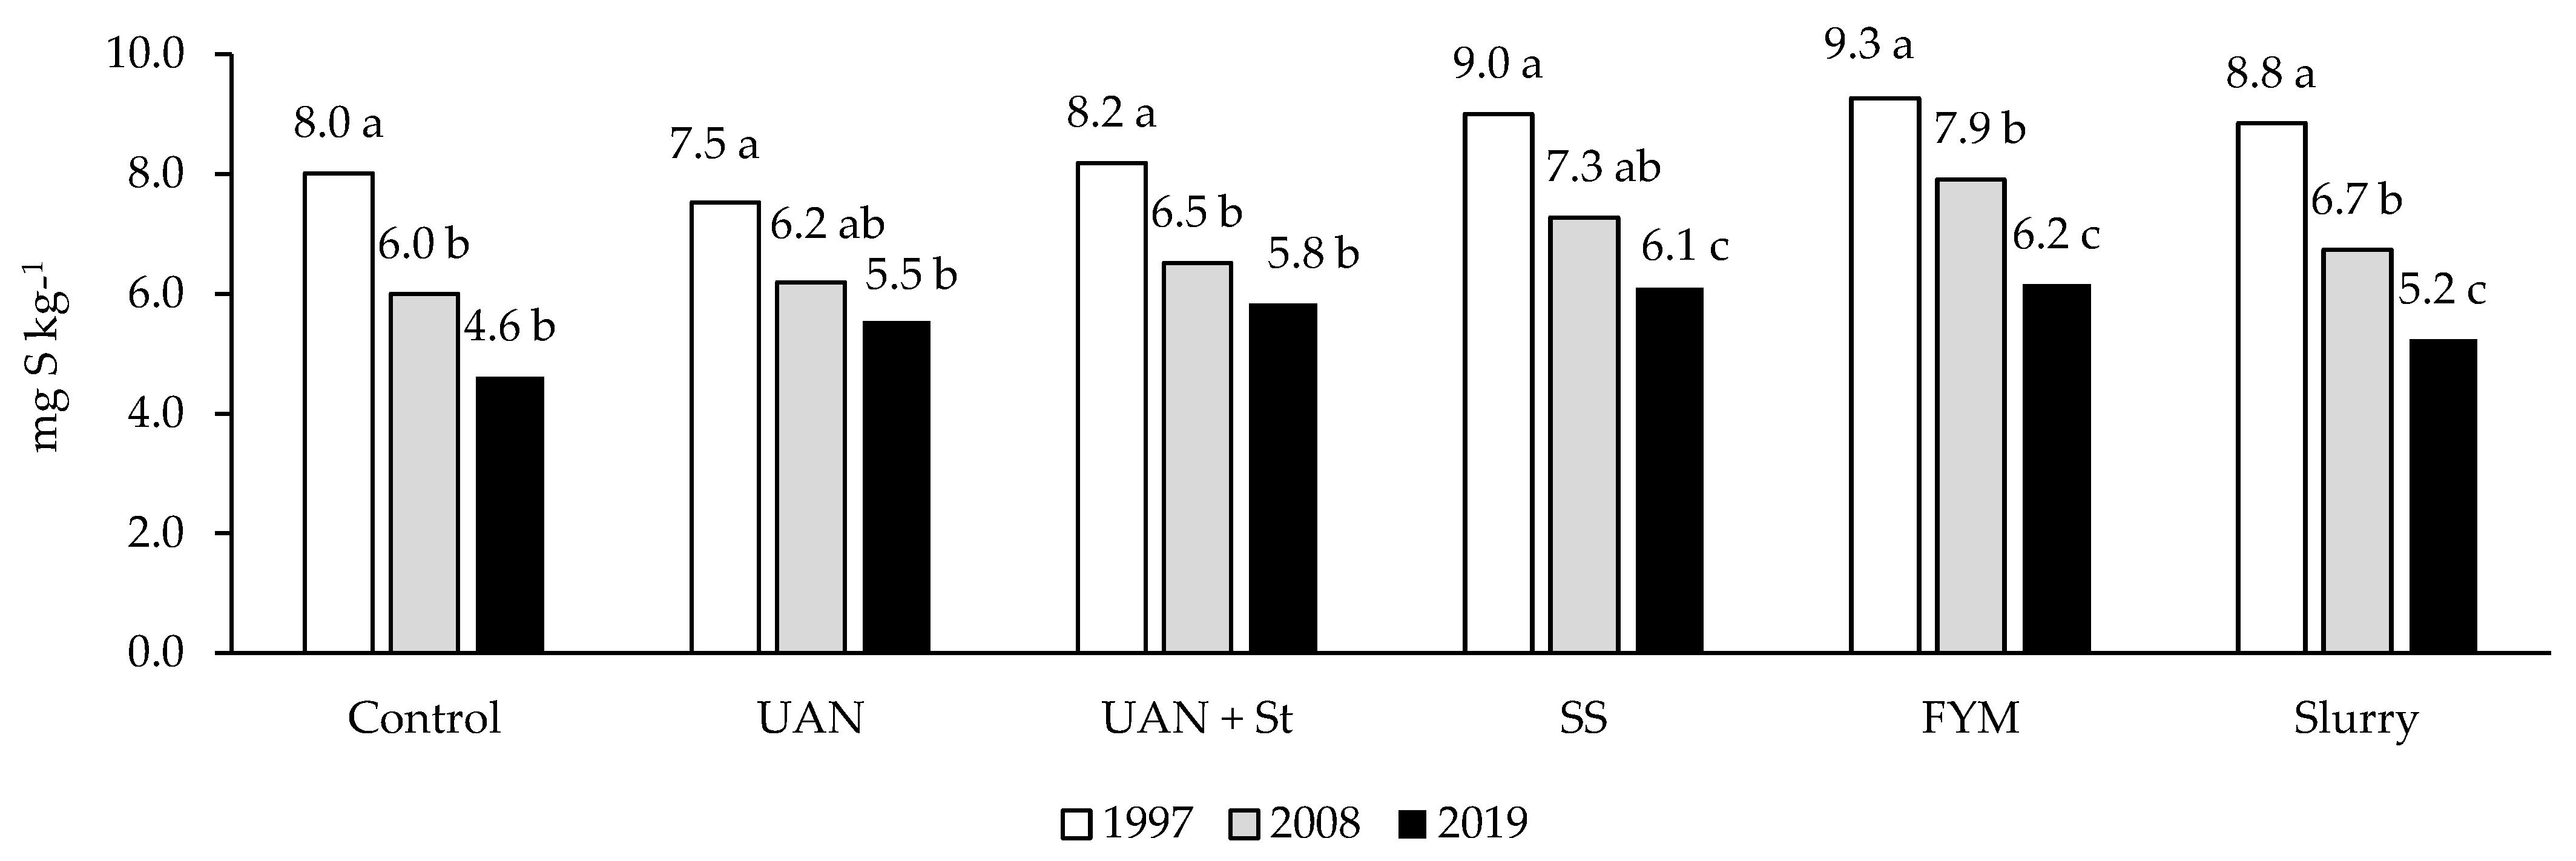
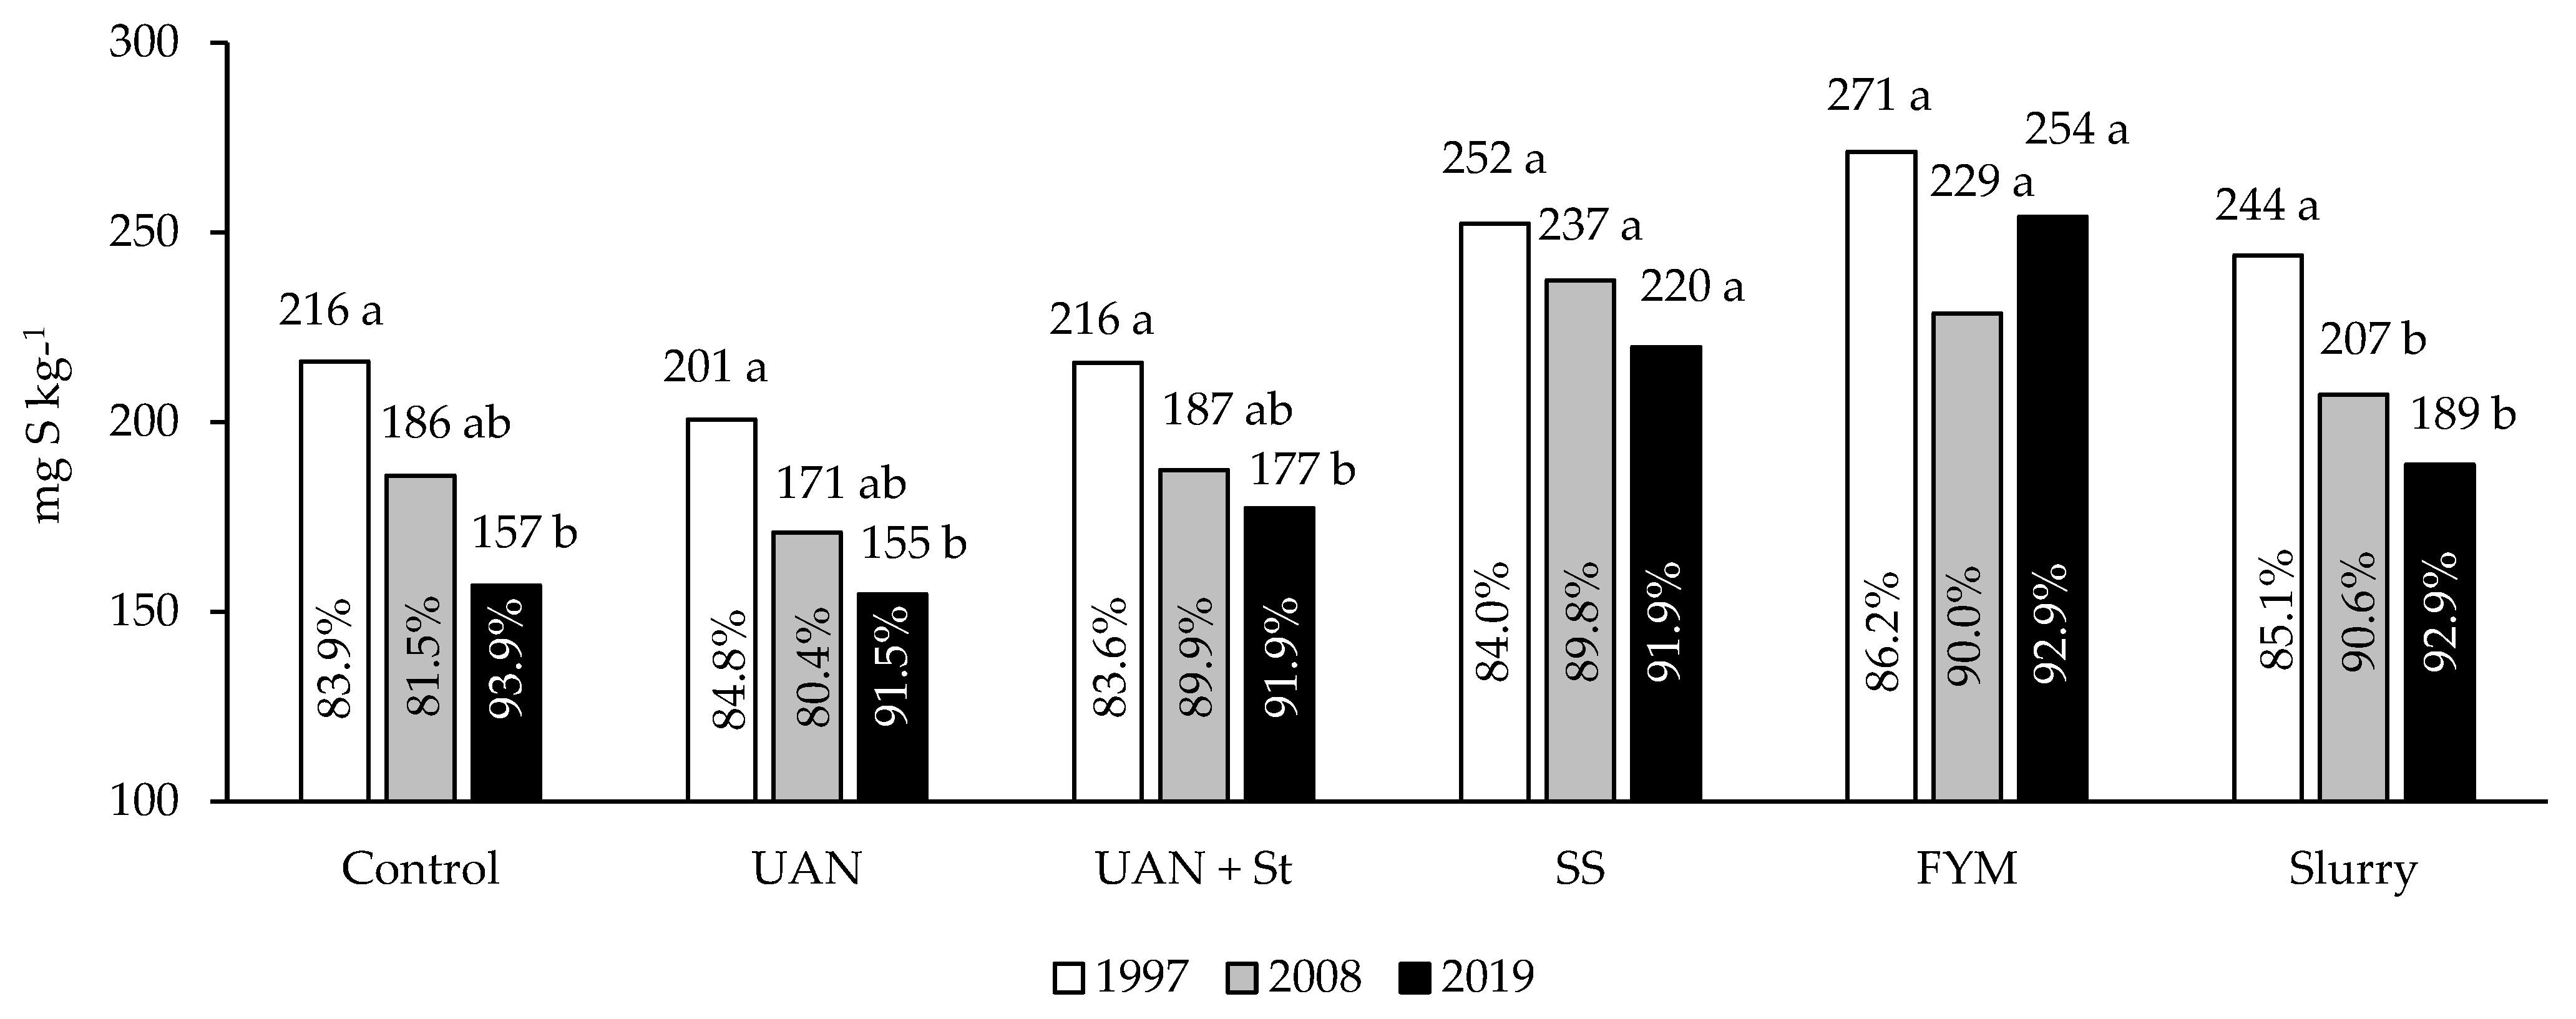
4.2. Topsoil and Subsoil Sulfur Content

For maize to have a sufficient supply of sulfur, there needs to be at least 10 mg of S kg−1 of soil in the plant available fraction (Sav) [50]. In our experiment, the Sav content was not lower than that amount (Figure 5), even though the soil samples were collected after the maize biomass harvest when the S pools were drained. This means that, during vegetation, the content of Sav should be high enough to supply the crop with a sufficient amount of sulfur.
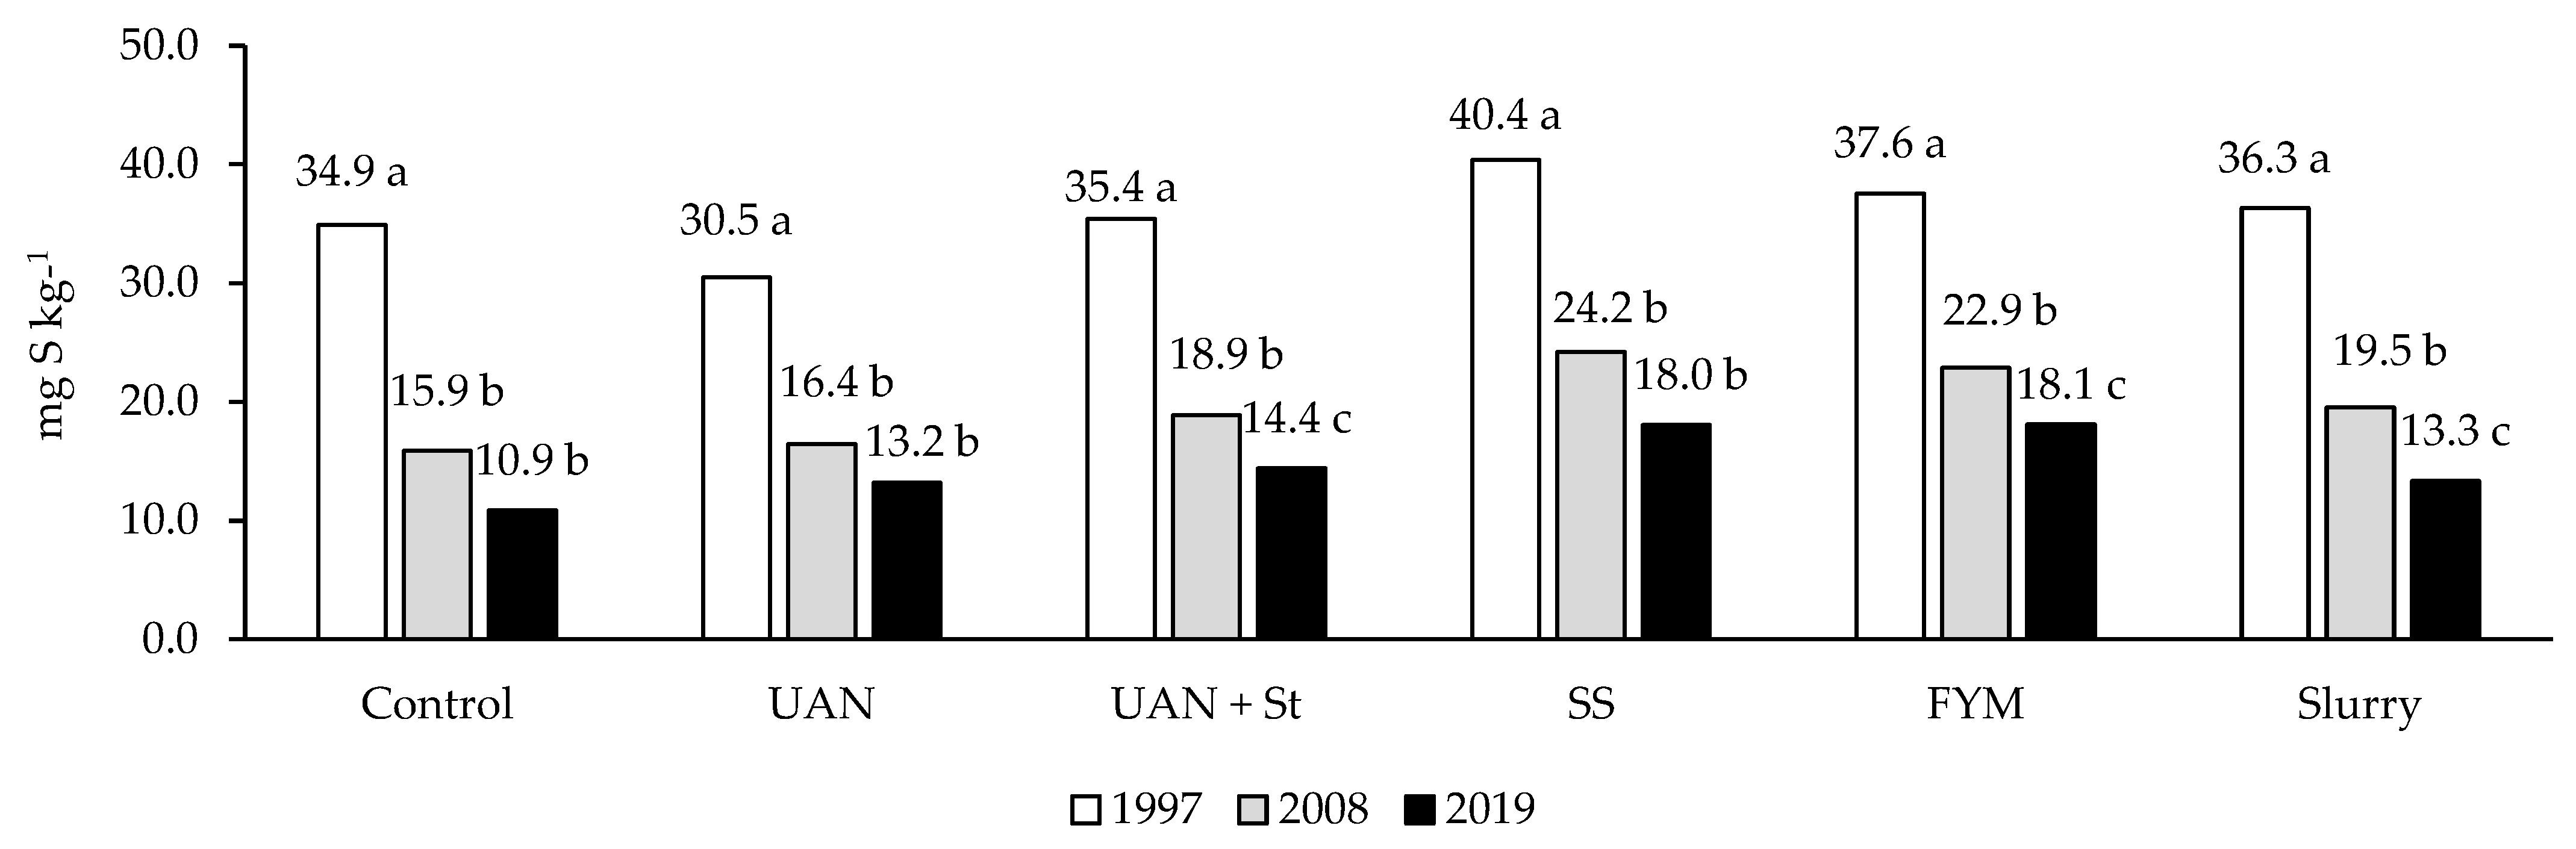
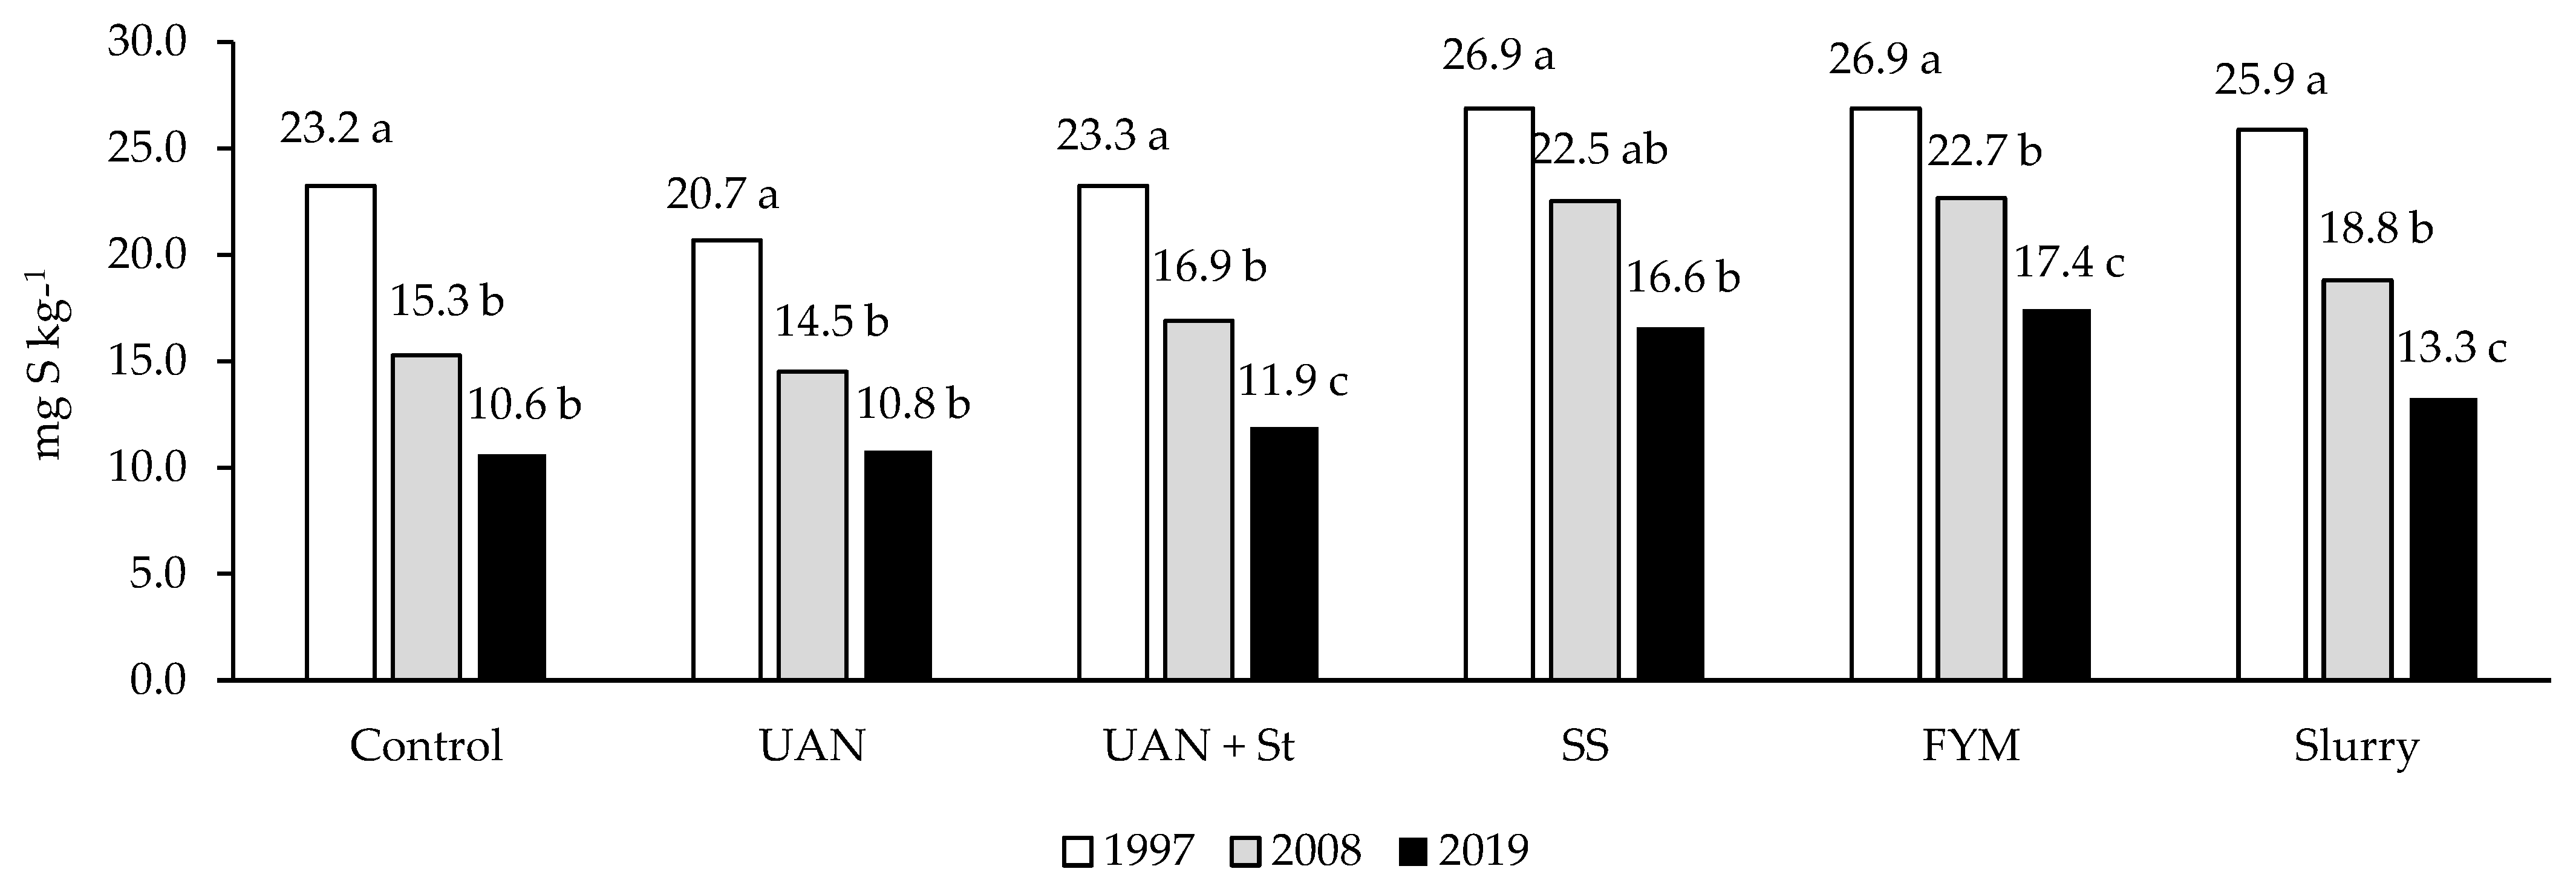
The results displayed in Figure 3, Figure 4, Figure 5 and Figure 6 show that there was a significant decrease in sulfur content in the soil from 1997 to 2019 in terms of SW, Sads, Sav, and SM3 fractions.
Balík et al. [28] investigated soil sulfur status changes from 1981 to 2007 from a wide variety of sites and crop rotations under FYM, FYM + NPK, and unfertilized Control treatments. The authors found a decrease in the SW, Sads, Sav, and Spt fraction contents to 32, 61, 50, and 92% of their initial values in 1981, respectively. Furthermore, they also found an increase in the proportion of Sorg in the Spt content from 79.3% in 1981 to 88% in 2007. The results in our study (Table 9, Figure 7) show a very similar trend to the results of Balík et al. [28]. Table 9 also shows a slight decrease in Sorg content for all treatments except the FYM, which seemed to stay near the original value. The differences between treatments in this sulfur fraction were insignificant with the exception of the Control, which reached the significantly lowest value. This is in accord with Forster et al. [34], who showed an increase in Sorg for treatments amended with FYM. Figure 8 shows the decrease in Sorg in absolute numbers for the Control, UAN, and UAN + St in 2019 in comparison to 1997. The SS, FYM, and Slurry treatments had rather high initial values of Sorg content in comparison with the Control, UAN, and UAN + St treatments. This was caused by the fact that the site was already fertilized since 1993, and inputs of organic carbon and sulfur influenced the Sorg content. The same can be said for the Spt content (Figure 7). Interestingly, the slurry treatment also showed a decrease in Sorg (unlike the SS and FYM treatments), but it was insignificant. If given enough time, this trend might become significant in the future.
Foster et al. [34] evaluated the status of soil S pools in the long-term experiment initiated in 1962 under crop rotation using different fertilizer treatments. They found that sewage sludge and farmyard manure fertilization increased total sulfur content significantly, which is generally in agreement with the results of Spt in our study. Furthermore, the authors determined the Sav content in the interval between 10.0 and 17.8 mg of S kg−1, which also confirms our results (Figure 5) with the interval of 10.9 to 18.1 mg S kg−1. The SW content in the soil is the most labile and susceptible to changes [20] and is most influenced by plant uptake [34,35], available soil sulfur supply [28,29], sulfur added in terms of fertilizers [51], and, most notably, the decrease in inorganic sulfur inputs from the atmosphere [3,4,31]. Another major factor that comes into play here is organic fertilization; this effect is later discussed in
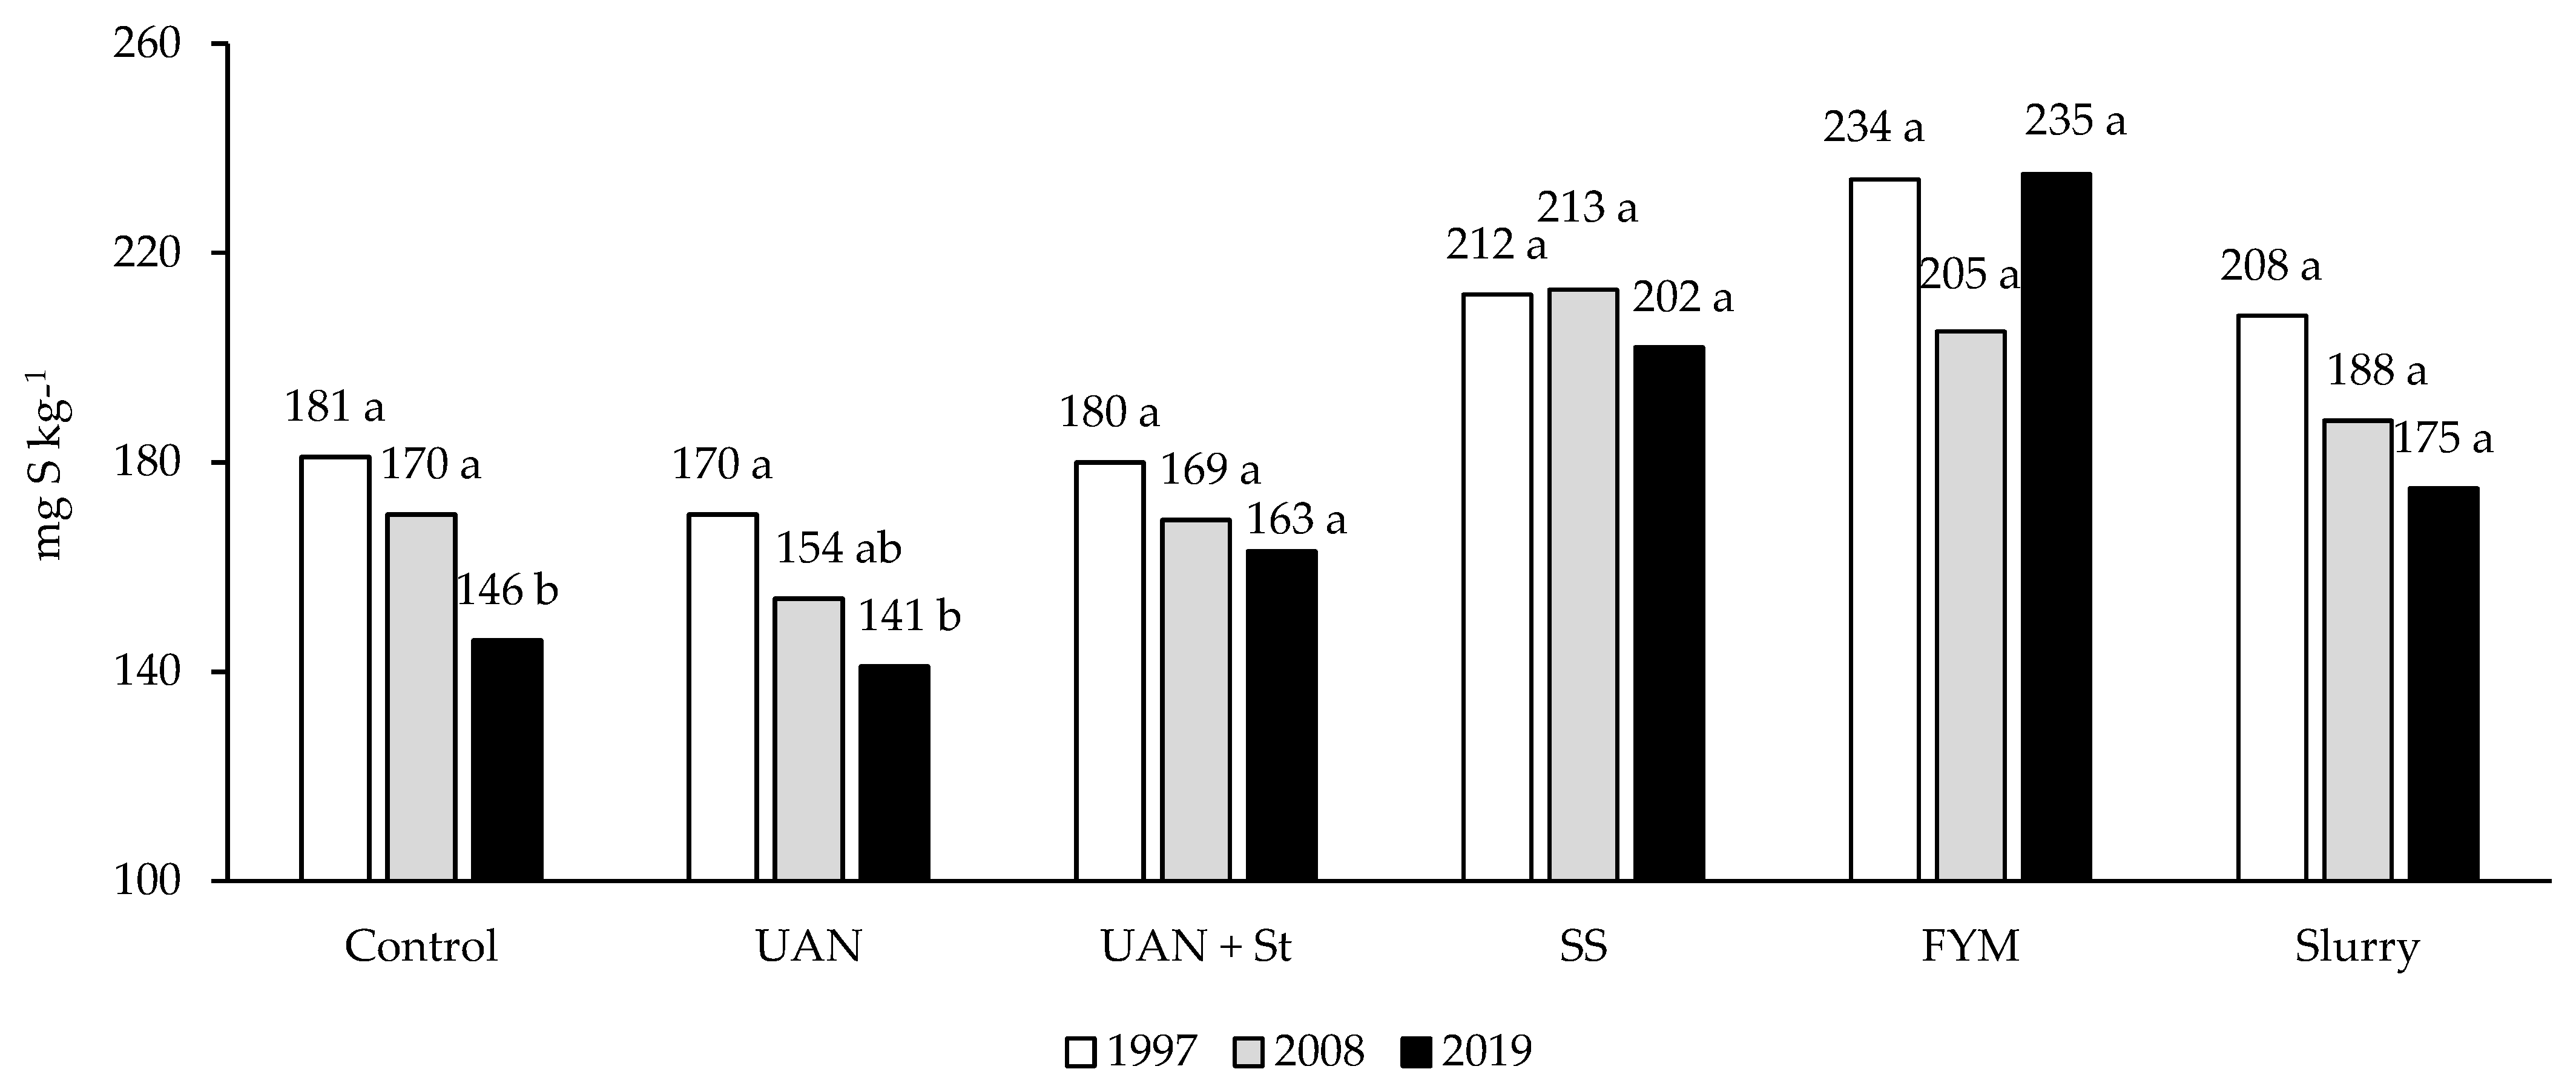
 Section 4.3.
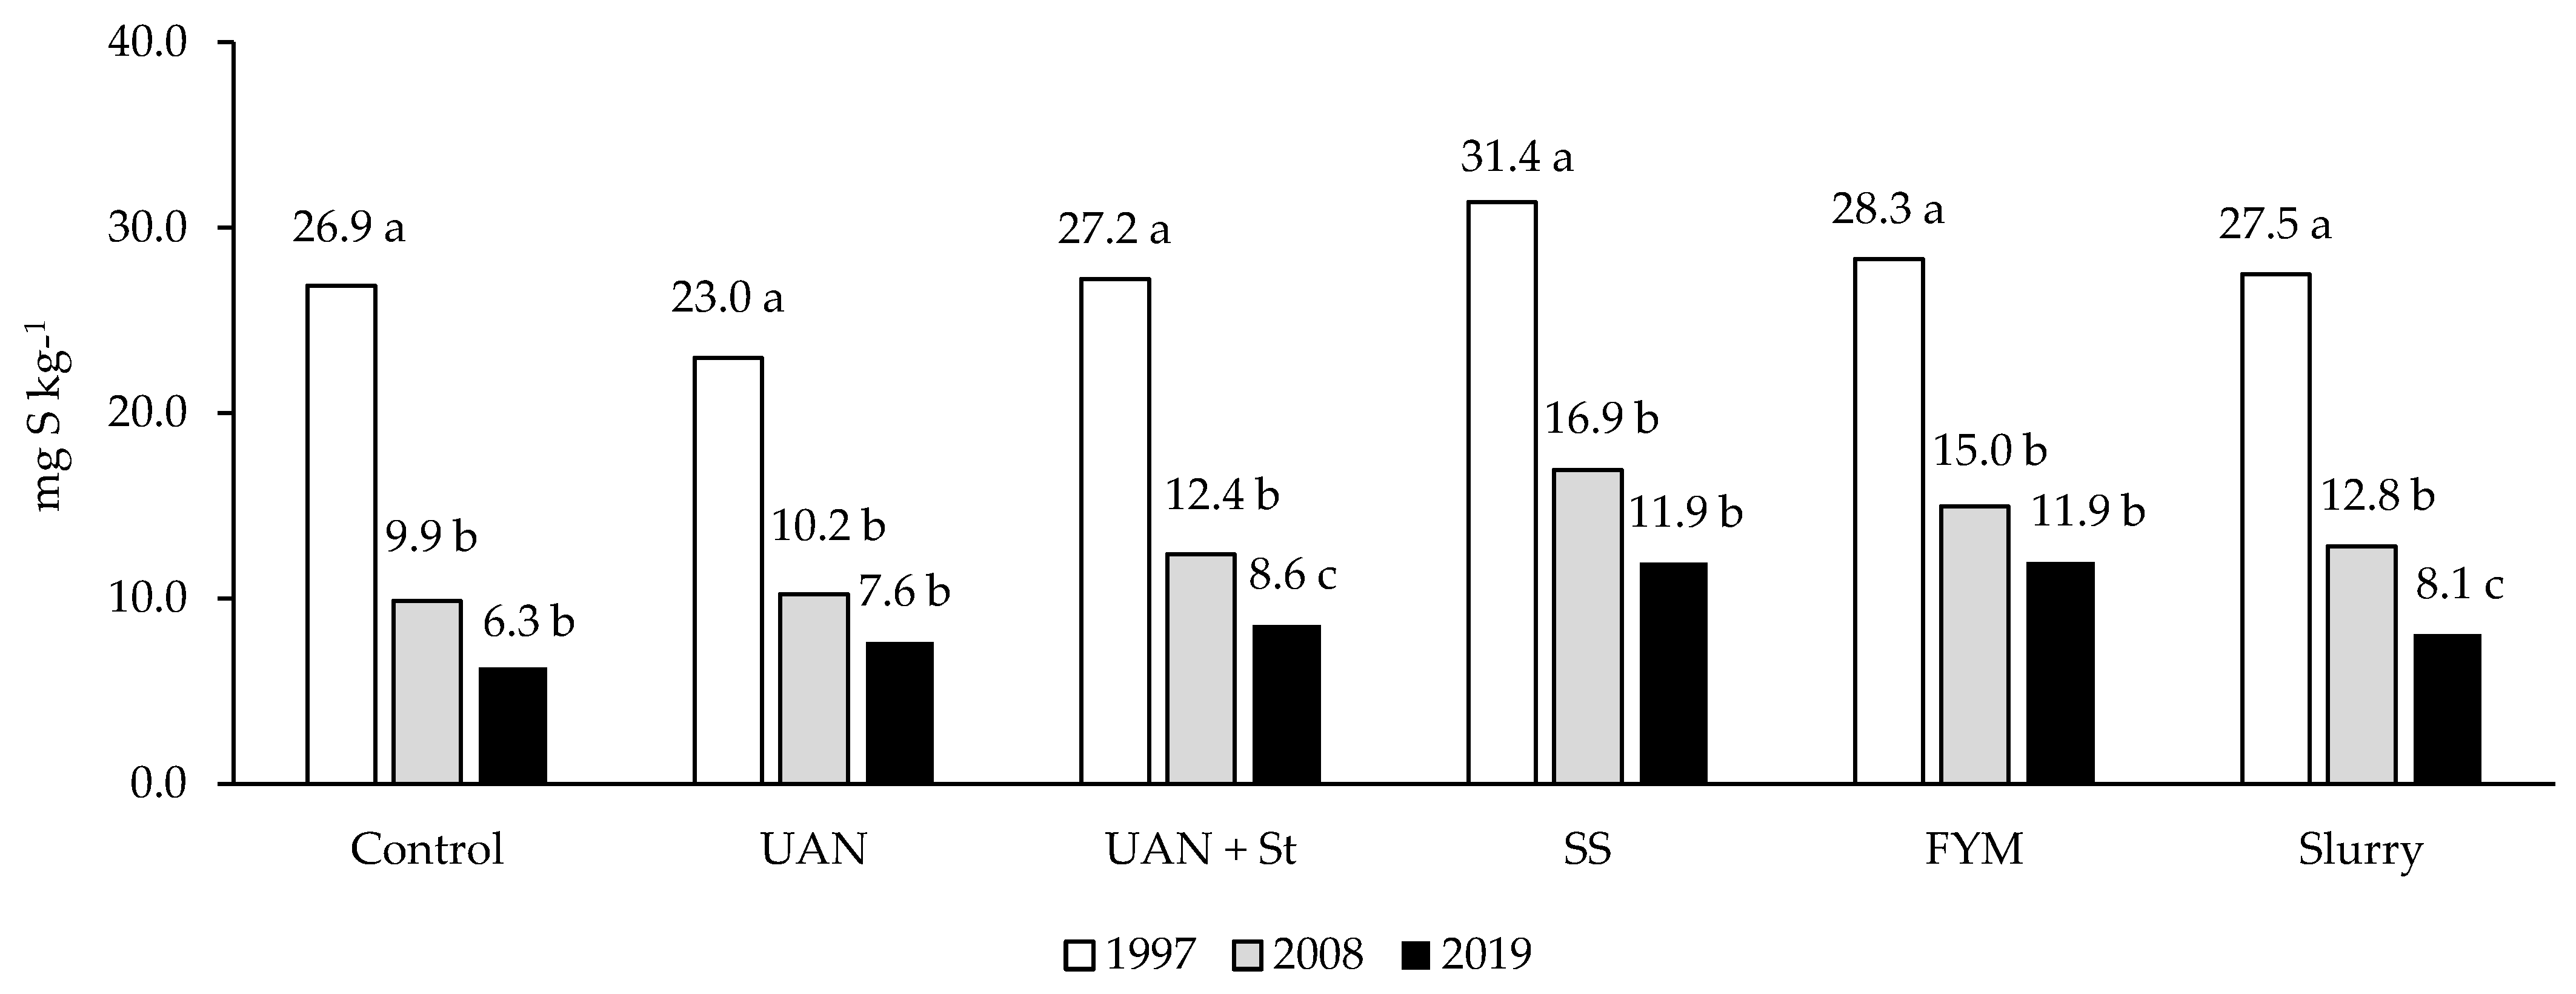
In the Czech Republic, the Mehlich 3 extraction method has been used to determine plant-available nutrients (e.g., P, Mg, Ca, K), and, recently, this method has been adopted in order to evaluate the plant-available S in soil. The methodology according to [52] puts arable soil into five categories according to the SM3 status. In 1997, all of the treatments in our study would have fit into the “satisfactory” category (ranging from 21–30 mg SM3 kg−1). In 2008, all treatments except the SS and FYM shifted into the “low” category (ranging from 11–20 mg SM3 kg−1), and, by 2019, even the SS and FYM would place in the same category as the others. For the subsoil, there is no comparison. Zbíral et al. [31] evaluated sulfur soil pools for a wide range of Czech soils using the Mehlich 3 method. The authors found that, on average, there was a decrease in SM3 content in the soil from 33 mg of S kg−1 in 1981 to 8 mg of S kg−1 in 2017 for control treatments with no fertilizers. They also reported a decrease from 26 mg of S kg−1 in 1995 to 17 mg of S kg−1 in 2013. This corresponds well to the results in our study, where Zbíral et al. [31] attributed this decrease to the reduction in SO2 emissions and, in turn, the reduction in total sulfur depositions that occurred in the 1990s in the Czech Republic.
In consideration of the SM3 fraction (Figure 6), the extracted S content was almost identical to the Sav fraction (Figure 5). The correlation coefficient between plant S content and soil SM3 content (Table 7) was 0.694 (significant at p < 0.05), which suggests that a Mehlich 3 extractant could release plant-available sulfur content. Kulhánek et al. [18] determined the correlation coefficient at 0.882 (significant at p < 0.001) for the SM3 and Sav fractions. Unlike our results, the results in Kulhánek et al. [18] were collected for a wider range of soil types and from farms, which included crop rotation, as well as monocultures. A significant positive correlation between the Sav and SM3 content has also been reported outside of the Czech Republic [53,54], thereby making this method suitable for determining the plant-available sulfur.
The general decrease in S in mineral sulfur fractions (including SM3) in topsoil from all organic, mineral, or even control treatments can only be attributed to the decrease in SO2 emissions, as suggested by Zbíral et al. [31] or Balík et al. [28], from hundreds of kg of S ha−1 year−1 in the late 1980s or early 1990s to just units of kg of S ha−1 year−1 [6], which was even reflected by authors in Europe [34,35].
The results of the subsoil Spt content are presented in Figure 9; however, the variability of the results does not help the interpretation. When comparing the Spt content in 1997 and 2019, there seems to be no statistical differences when judging by standard letters, yet the content for the SS treatment decreased by 21.5%. It seems to resemble the results of the topsoil (Figure 7). The initial content of Spt for this treatment was, however, 1.68 fold that of the Control. Given the fact that sewage sludge contains a lot of potentially mineralizable S [34], it is possible that the content of sulfur was mineralized over time and was susceptible to upward movement caused by plant uptake (maize roots can reach a depth greater than 60 cm) [55] or downward movement in terms of the leaching of sulfate anions [21,22]. Indeed, the mineral SW content in this treatment sustained a 6.23-fold increase (Table 10) over the Control in 2019, while the Sorg content was almost identical to the Control. The UAN treatment produced a decrease in Spt content (Figure 9). This can be explained by the fact that the initial Spt content of this treatment was higher than the Control and also by the fact that the CSOM content in this treatment decreased in the subsoil [56]. This is further supported by Table 10, where the lowest content of Sorg was present in the UAN treatment. The Control, UAN + St, and Slurry treatments produced a slight increase in Spt content from 1997 to 2019 (Figure 9). These treatments had comparable contents of Sorg (Table 10). This would suggest that the doses of S and C in the UAN + St and Slurry were not enough to have a significant effect on the topsoil and subsoil Spt and Sorg pools, and the S supplied by the Slurry was easily mineralized [36,37]. This is further confirmed in Table 10, where we can see a 2.14-fold increase in SW for the Slurry over the Control. The levels of Spt in the FYM in the subsoil did not change over time. The SW and Sorg contents for this treatment in 2019 was also significantly higher than those in the Control, which suggest that FYM plays an important role in maintaining sufficient S levels in the subsoil. The trend for the FYM in the subsoil was identical to that in the topsoil.

4.3. Influence of Organic Carbon

One of the main effects of organic matter application is the sustaining and/or improvement of the soil organic matter (CSOM) content. Balík et al. [56] reported changes in the CSOM content for their current experimental site in a prior paper. At the beginning of the experiment in 1993, the CSOM content was 1.26%. In 2018, the CSOM content changed for the Control, UAN, UAN + St, and FYM treatments to 0.98, 0.95, 1.16, and 1.49%, respectively. This was due to the fact that maize biomass was harvested, and only stubble and roots were again incorporated into the soil. The dose of straw for the UAN + St treatment was also not sufficient to maintain the levels of CSOM and produced an insignificant decrease in the CSOM. On the other hand, the FYM treatment was supplied with enough carbon to produce a significant increase.
The content and quality of organic matter supplied with fertilizers has influence over the content of Sorg and Spt fractions in the topsoil. Although the dose of S was greater in the SS (52.4 kg of S ha−1 year−1) than in the FYM (16.4 kg of S ha−1 year−1), the Spt and Sorg content was greater in the FYM than in the SS. Meanwhile, the Slurry treatment received almost identical doses as the FYM and reached a lower content of S for the Spt and Sorg fractions in 2019, respectively. Generally, organic materials with higher C:S ratios are prone to immobilization [34], which includes manures. Sewage sludge has a large pool of potentially mineralizable S [34], where a significant portion of inorganic sulfur is present in sulfate and metal sulfides [41]. The SS also had the highest overall S content. Slurries have generally much lower C:S ratios [36] and are more prone to mineralization than other organic fertilizers [37]. In Table 3, we can see the C:S ratios for organic fertilizers. The highest ratio (over 700) was present in the UAN + St treatment, which would suggest immobilization according to Zhang et al. [57]. Based on Figure 8, it is obvious that the Sorg content did not, in fact, significantly decrease. However, given the trend, it is very likely that the change will be significant over time. After all, the dose of sulfur was only 2.61 kg of S ha−1 year-. The trend of Sorg content for the Slurry treatment was similar to that of the UAN + St, where the dose of applied sulfur was higher (16.3 kg of S ha−1 year−1); however, the C:S ratio was 36.3. The combination of a relatively higher fulvic acid content, which is less stable (discussed later, Section 4.4.), can explain the trend in Sorg content. The SS treatment had the lowest C:S ratio (17.0), which means that the mineralization of sulfur should occur [57]. According to Dewill et al. [41] and Sommers et al. [42], a significant percentage of sulfur in SS fertilizer is inorganic and could possibly be released [21,22]. The Sorg content (Figure 8) did not change over the course of the experiment, which suggests that the dose of sulfur in the SS was right to maintain the content of organic-bound sulfur. The FYM treatment produced no change in the Sorg content (Figure 8) at a much lower sulfur dose than the SS. This is due to the fact that FYM materials have a higher C:S ratio and are more stable than many other organic materials [34]. Generally, the increase in total soil sulfur is mainly driven by the increase in organic carbon [34], which is in accordance with our results. In a different experiment, with over 150 years of constant pure mineral S application, there was no significant increase in soil sulfur content [35].
The application of organic matter into the soil can generally increase the water-holding capacity [58] and, in turn, increase the content of the water-soluble SW fraction. The results in Figure 3 show that the SW content was indeed higher for the organic fertilized treatments; most notably, the SS and FYM treatments reached 1.89-fold increases over the Control treatment. Kulhánek et al. [29] investigated changes in the SW and Sav content from 1996 to 2014 with a crop rotation through long-term field experiments. They found a decreasing tendency in the Sav fraction, but for the sludge fertilized treatment of potatoes, there was an increase in SW content, while a decreasing tendency was observed for the following crops, thereby suggesting that the effectiveness of SS deteriorates over time.

4.4. Topsoil and Subsoil Sulfur Movement

Table 11 shows the change in topsoil and subsoil pseudo-total sulfur content from 1997 to 2019 in kg of S ha−1. These values were calculated from Figure 7 and Figure 9 for the topsoil and subsoil, respectively, using the bulk density of soil.
The balance of sulfur in the soil is, of course, influenced by maize sulfur uptake and leaching. [21,22]. From among the organic fertilizer treatments, the FYM produced a lower decrease in soil sulfur pools, followed by the SS and UAN + St treatments. This was due to inputs of organic carbon in fertilizers that cause an increase in organic carbon in soil [35,38,58] and, in turn, increase organic-bound sulfur in the soil [34,35]. The Control and mineral-only UAN produced a similar, high decrease in balance, as these treatments received no organic carbon. The Slurry treatment showed interesting results. It also received organic carbon but balanced more similarly to the Control and UAN treatments. A possible criterion for the evaluation of the stability of soil organic carbon can be the humic and fulvic acid ratio (CHA/CFA) [59,60], where a higher content of CFA represents a lower stability of the soil organic carbon [61]. The CSOM content and CHA/CFA in the Slurry treatment were 1.12% and 0.84, respectively, in 2019 (Table 2) in comparison with the FYM treatment, where the same parameters were measured at 1.49% and 1.04, respectively, in 2019. The Slurry treatment, overall, had a lower content of organic carbon as well as a higher proportion of a less stable carbon fraction. Our original expectations for balance regarding the UAN + St and SS treatments were also surpassed—in a negative way. We did not expect the balance of these treatments to be this low. Looking at the CSOM content and CHA/CFA ratio might shed some light on the results (Table 2). The CSOM content and CHA/CFA ratios for the UAN + St were 1.16% and 0.82, respectively. For the SS treatment, the CSOM content and CHA/CFA ratio were 1.20% and 0.78, respectively. This could explain their similar behavior. On top of that, in Table 3, we can see that the Slurry and SS had similar C:N ratios (5.05 and 7.32, respectively), which means that the carbon content in these fertilizers was similar, yet the C:S ratio for the SS was double in comparison to the Slurry. If we consider that the sulfur in the Slurry is organic in nature at the dose of 16.3 kg of S ha−1 year−1, and the closeness of the C:N ratio with SS treatment, we can also consider that 16.3 kg of S out of the annual dose of SS (52.4 kg of S ha−1 year−1) was organic bound, which would mean that 68% of the SS dose was in fact inorganic, which is not in opposition with the literature. For example, Dewill et al. [41] mention that sludges can have inorganic sulfates as their dominant sulfur species.
In the subsoil, the situation is more complicated. None of the treatments (Table 11, subsoil section) showed significant differences in time due to variability in results, which was influenced by the variability in subsoil on site, as well as the fact that the experiment was fertilized for 4 years before the trial evaluation started. The FYM was in balance in 2019, while the UAN + St and Slurry were in positive balance. A possible explanation might be the mobilization of fulvic acids from the topsoil and their release, thus inducing the mobilization of sulfur into the subsoil, since they are less stable than organic carbon in the FYM [34]. The negative balance for the UAN treatment could be caused by the plant uptake, even in the subsoil (30–60 cm depth). Maize roots can even grow into the subsoil [55]. This would also explain why the balance for the UAN was lower than for the Control, as the UAN treatment produced a higher yield (Figure 2a), which caused an increased uptake of sulfur (Figure 2b) [13,16] and, thus, caused a decrease in the subsoil sulfur content. The problematic treatment was the SS. We can see high initial values (Table 11) for this treatment. This treatment received 52.4 kg of S ha−1 year−1 in fertilizer 4 years prior to the beginning of the experiment, as well as atmospheric inputs from the deposition. Judging by the 1997 value, it is clear that both factors led to an increase in the 1997 value. The negative balance of this treatment can, therefore, be attributed to maize uptake, as well as to the decrease in atmospheric sulfur depositions and leaching [21], since the SS contained a significant portion of easily mineralizable sulfur [34] and possibly a major portion of inorganic sulfur [41] that could be made up from water-soluble sulfates [42]. The significant decrease in depositions led to a significant response in soil and crops. However, this response takes time [62], and it is possible that, even though the biggest decrease happened in the late 80s and early 90s [5,6,7,31], the response in subsoil could lag behind. On top of these, the sludge materials have higher amounts of easily mineralizable sulfur [34], which could cause a decrease through the leaching of sulfate anions. Before venturing forth, this would be an appropriate moment to mention inputs for the SS treatment. Our experiment received the annual supply of sewage sludge from the same water treatment facility every year. The inputs of sulfur for the SS treatment from the sewage sludge were 52.4 kg of S ha−1 year−1, which is substantially more than other organic fertilizers had. Sulfates are a significant primary ion present in municipal and industrial waters [63] that can reach the water treatment facility, where inorganic sulfates can be added as water softeners or for phosphate precipitation [64]. As a result, sewage sludge can have a high content of sulfur [41]. This explains the rather high content of sulfur in this organic fertilizer.
In Table 12, we can see the vertical movement of the total sulfur balance in the topsoil and subsoil calculated based on inputs (Table 4), uptakes (Table 6), and status of the topsoil and subsoil (Table 11). The content of sulfur that could not be accounted for by inputs, uptakes, or pseudo-total content was considered to be lost by leaching. It can be argued that a possible loss of sulfur can happen from the emissions of H2S and SO2 gases, as was reported by Kinsela et al. [65]. The problem is that it is hard to estimate the exact values. Taking the work of Kinsela et al. [65] into consideration, the authors conducted an experiment where the emission of SO2 and H2S gases was measured in Australia with sulfur-rich soils and 1445 L m−2 of precipitation, and they measured a release of 3.66 kg of S ha−1 year−1. By taking this value and applying it to the SS treatment in our experiment (as it had the highest S inputs), we can calculate that, over the course of 23 years, 84.2 kg of S ha
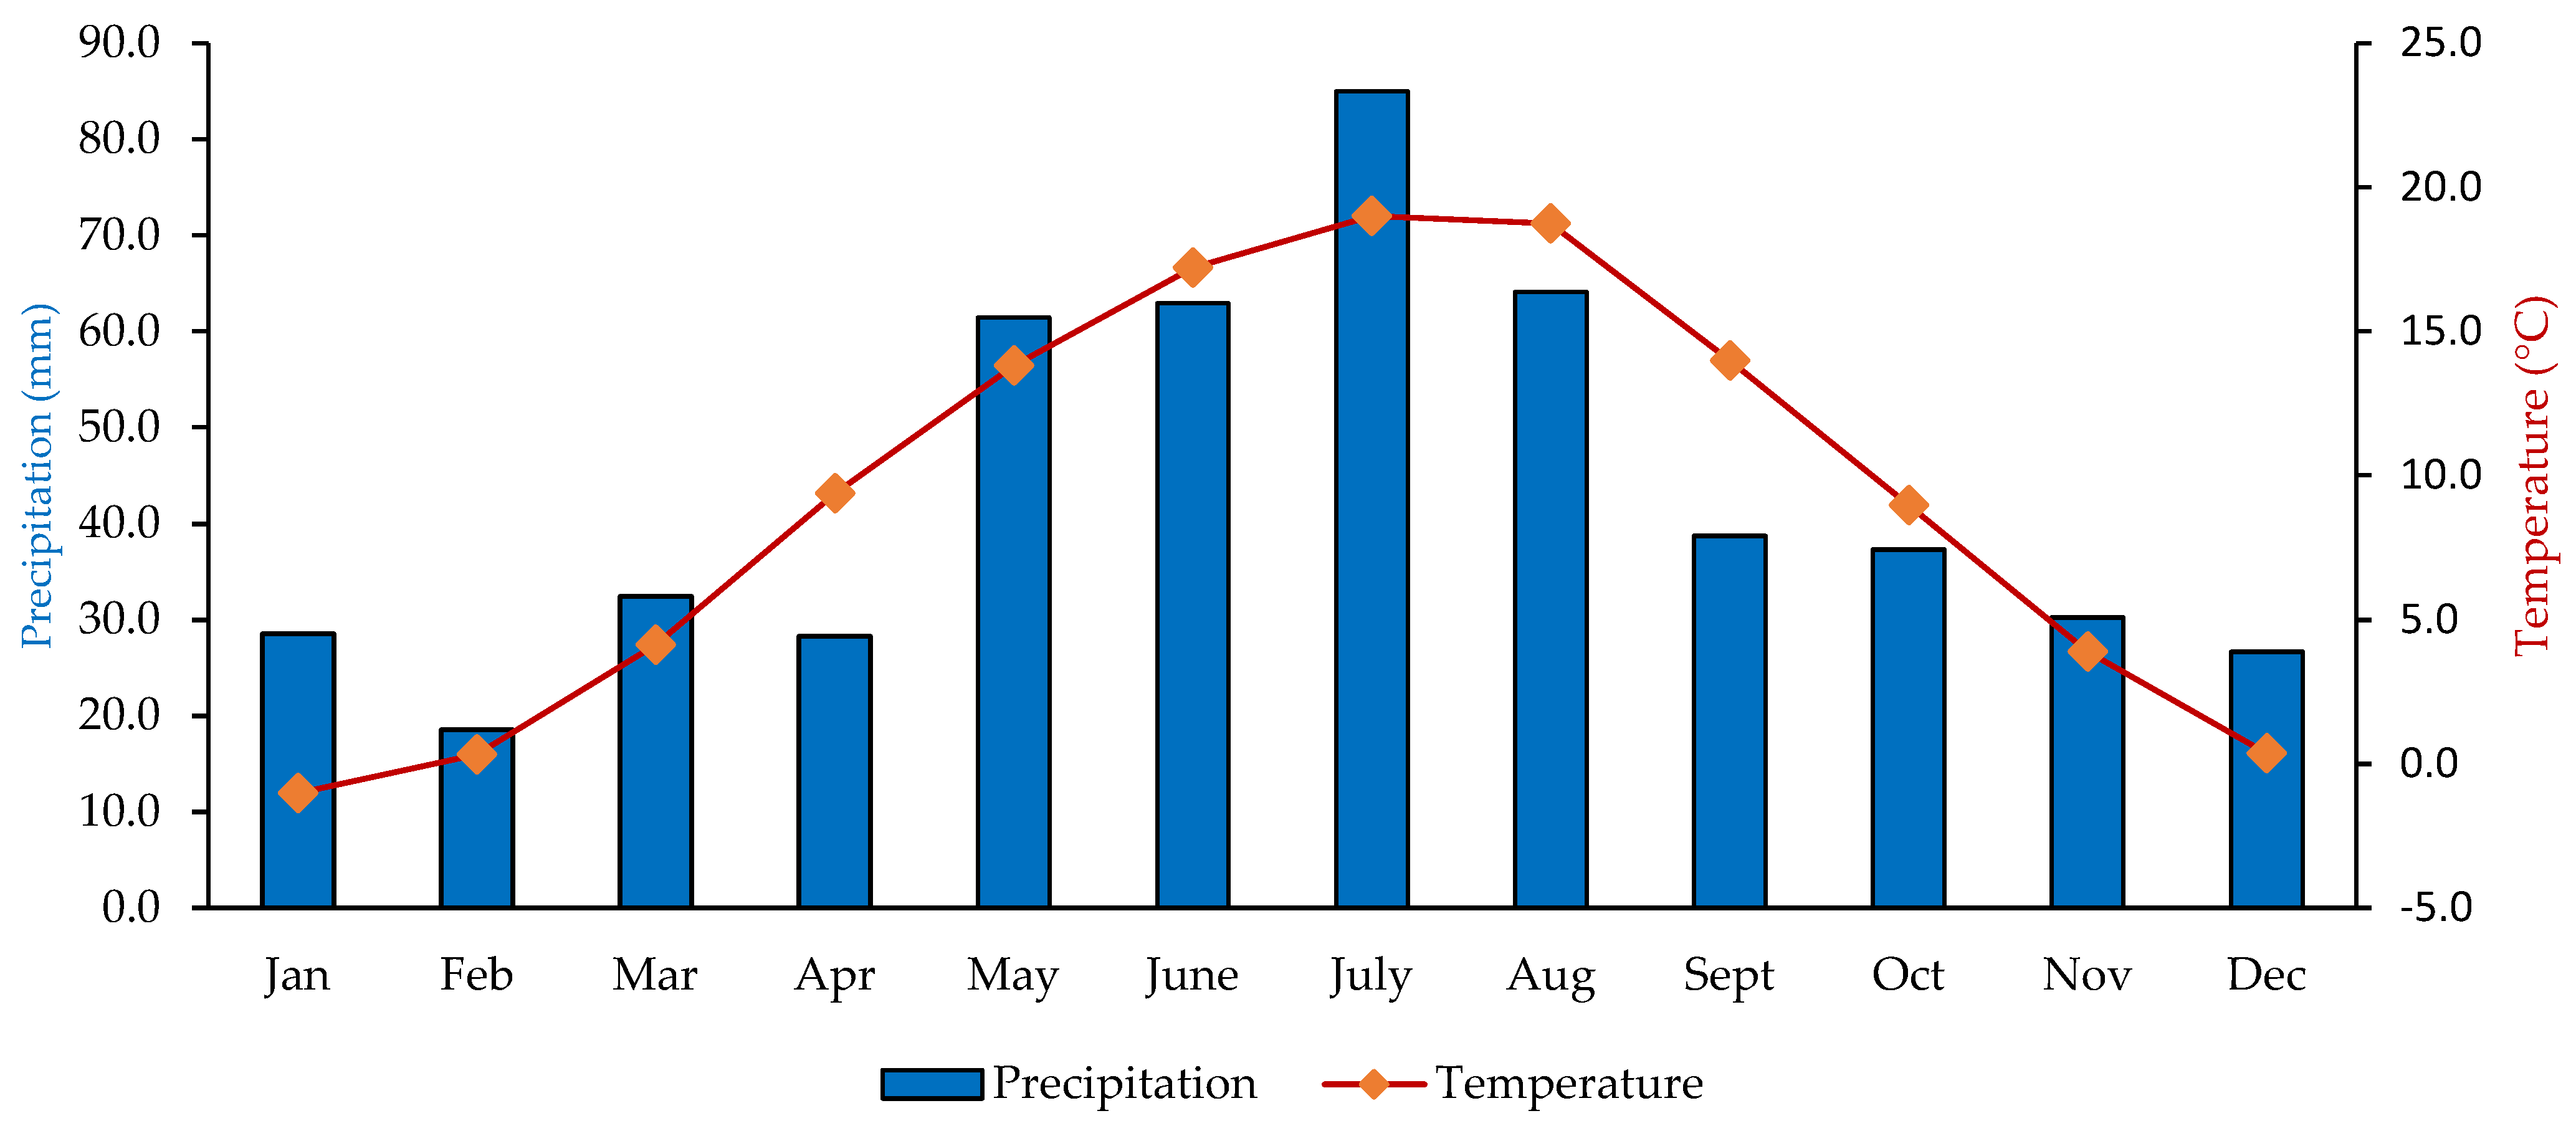
−1 after 23 years would be released in gases. Given the fact that the precipitation in our experiment was 493 L m−2, (Table 1) and considering the precipitation trend (Figure 1) at the time of fertilizer application, we assumed that the potential for sulfur volatilization was negligible, so a decision to omit it was made—therefore, leaching would be the most dominant cause of sulfur loss. Additional water input was calculated in terms of organic fertilizers. The highest moisture content was measured for the Slurry treatment (5.7% of dry matter). Given the moisture content and applied doses of dry matter (Table 3), we can calculate that this treatment received 3.77 L m−2 year−1 with fertilizers. This would not be enough to influence the soil moisture content. The same applied to the other treatments as well.
The results in Table 12 show that a loss was present in all treatments. The total loss from the entire investigated profile (0–60 cm depth) is online (d). At this point, it was not surprising that even the organic fertilized treatments produced a loss of sulfur. The decrease in mineral fractions could be attributed to the decrease in atmospheric depositions that supplied mineral sulfur into the soil [31]. Interestingly, even the organic fertilized treatments sustained a loss of sulfur. The decrease in organic-bound sulfur can be explained by findings in Riley et al. [21]. In our experiment, the outputs were also greater than the inputs.
When comparing just the fertilizer inputs and annual loss, the SS annually received 52.4 kg of S ha−1 year−1 in fertilizer, while the annual loss was calculated (loss from subsoil divided by 23) at 66.1 kg of S ha−1 year−1. The same could be calculated for the FYM, Slurry, and UAN + St treatments, which received 16.4, 16.3, and 2.61 kg of S ha−1 year−1 as a fertilizer, respectively. After the calculation, we obtained 21.4, 26.8, and 8.04 kg of S ha−1 year−1 of lost sulfur for the FYM, Slurry, and UAN + St, respectively. All fertilized treatments produced higher annual losses than the annual fertilizer inputs.

5. Conclusions

This study examined the influence of organic sulfur fertilization and atmospheric depositions on soil and plants in a 23-year-long maize monoculture for Control, UAN, UAN + St, SS, FYM, and Slurry treatments. In terms of maize, the sulfur supply was not the limiting factor, and yields were influenced by the nitrogen dose on all treatments. Sulfur fertilization, however, caused a significant increase in sulfur uptake for the SS treatment, as it received the highest sulfur dose, while the increased uptake of the other treatments was mostly caused by the increase in yields.
In the soil, we found a decrease in Spt for all treatments except the FYM. For all treatments, the proportion of the Sorg in Spt increased over time, which was caused by the decrease in mineral fractions (SW, Sads, Sav) for all treatments. The absolute content of the Sorg was decreasing over time for all treatments except the SS and FYM, as the dose of sulfur for the SS was highest, and the FYM was rich in stable organic compounds. The Slurry and UAN + St in our experiment were relatively richer in labile forms of carbon, which resulted in the decrease in the Sorg.
By using the total sulfur balance, we demonstrated significant leaching for all treatments (even the unfertilized Control) of sulfur below the 60 cm depth over the period of the entire experiment. We conclude that high inputs of sulfur from atmospheric depositions in the 1990s were the major cause for this decrease, as well as the possible release of sulfur from the organic fertilizer treatments. The highest leaching was measured for the SS treatment, where the highest inputs in terms of S were present. We contribute the leaching to the dose and the fact that sewage sludges are generally rich in inorganic and easily releasable sulfur. If considered for fertilization, we would recommend a much lower dose of sewage sludge than the amounts administered in our work to reduce sulfur leaching and inputs of potentially toxic elements. Based on these results, it is possible to say that the periodical application of farmyard manure is the best choice for maintaining a proper sulfur nutrient status.

Author Contributions

Conceptualization, P.S. and J.B.; Formal Analysis, M.K.; Methodology, O.S. and J.Č.; supervision, J.B.; writing—original draft, P.S. All authors have read and agreed to the published version of the manuscript.

Funding

This work was funded by the European Regional Development Fund (ERDF)–Center for the investigation of synthesis and transformation of nutritional substances in the food chain in interaction with potentially harmful substances of anthropogenic origin: Comprehensive assessment of soil contamination risks for the quality of agricultural products (NutRisk Center, Registration number: CZ.02.1.01/0.0/0.0/16_019/0000845), as well as a student funding project No. SV22-2-21140 by the Ministry of Education, Youth, and Sports of the Czech Republic.

Institutional Review Board Statement

Not applicable.

Data Availability Statement

Data are present and available upon request from the corresponding author.

Acknowledgments

We give thanks to the team of the Department of Agroenvironmental Chemistry and Plant Nutrition of the Czech University of Life Sciences in Prague for their help and support, to the Czech Hydrometeorological Institute for necessary data, and to Hana Zámečníková and Jana Najmanová for their help with laboratory work and measurements.

Conflicts of Interest

The authors declare no conflict of interest.

Abbreviations

ControlControl treatment
UANUrea and ammonium nitrate
UAN + WheatUrea and ammonium nitrate + wheat straw
SSSewage sludge
SlurryCow slurry
FYMFarmyard manure
SWWater-soluble sulfur
SadsAdsorbed sulfur
SavPlant-available sulfur
SptPseudo-total sulfur
SorgOrganic-bound sulfur
SM3Mehlich 3 extractable sulfur
CSOMSoil organic matter carbon
CHA/FAHumic and fulvic acid ratio
DMDry matter
C:N:SCarbon:nitrogen:sulfur ratio in fertilizer
BYBiomass yield
SDStandard deviation

References

  1. Marschner, H. (Ed.) Marschner’s Mineral Nutrition of Higher Plants, 3rd ed.; Elsevier: London, UK, 2012; p. 672. ISBN 978-0-12-384905-2. [Google Scholar]
  2. Steinke, K.; Rutan, J.; Thurgood, L. Corn Response to Nitrogen at Multiple Sulfur Rates. Agron. J. 2015, 107, 1347–1354. [Google Scholar] [CrossRef]
  3. Lehmann, J.; Solomon, D.; Zhao, F.J.; McGrath, S.P. Atmospheric SO2 Emissions Since the Late 1800s Change Organic Sulfur Forms in Humic Substance Extracts of Soils. Environ. Sci. Technol. 2008, 42, 3550–3555. [Google Scholar] [CrossRef]
  4. Yang, Z.; Singh, B.R.; Hansen, S.; Hu, Z.; Riley, H. Aggregate Associated Sulfur Fractions in Long-Term (>80 Years) Fertilized Soils. SSSA J. 2007, 71, 163–170. [Google Scholar] [CrossRef]
  5. Tlustoš, P.; Pavlíková, D.; Balík, J.; Száková, J. Sulphur cycle in the soil and in the environment. In Proceedings of the 7th International Conference Reasonable Use of Fertilizers Focused on Sulphur in Plant Production, Prague, Czech Republic, 29 November 2001. [Google Scholar]
  6. Krupová, D.; Pavlendová, H.; Pavlenda, P.; Šrámek, V. Atmospheric deposition of sulphur and nitrogen in forests of the Czech and Slovak Republic. J. For. 2018, 64, 249–258. [Google Scholar] [CrossRef]
  7. Czech Hydrometeorological Institute. Available online: https://www.chmi.cz/files/portal/docs/uoco/isko/grafroc/19groc/gr19cz/09_depozice_v1.pdf (accessed on 10 August 2020). (In Czech).
  8. Gao, Y.; Ma, M.; Yang, T.; Chen, W.; Yang, T. Global atmospheric sulfur deposition and associated impaction on nitrogen cycling in ecosystems. J. Clean. Prod. 2018, 195, 1–9. [Google Scholar] [CrossRef]
  9. European Environmental Agency. Sulphur Dioxide Emissions. European Environment Agency. 2015. Available online: https://www.eea.europa.eu/data-and-maps/indicators/eea-32-sulphur-dioxide-so2-emissions-1/assessment-3#tab-related-briefings (accessed on 1 March 2022).
  10. Ministry of the Environemtn of the Czech Republic. Národní Program Snižování Emisí České Republiky. 2007. Available online: https://www.mzp.cz/C1257458002F0DC7/cz/strategicke_dokumenty/$FILE/OOO-NPSE_2007-20200217.pdf (accessed on 28 February 2022). (In Czech).
  11. Chien, S.H.; Gearhart, M.M.; Villagarcía, S. Comparison of Ammonium Sulfate with Other Nitrogen and Sulfur Fertilizers in Increasing Crop Production and Minimizing Environmental Impact: A review. Soil Sci. 2011, 176, 327–335. [Google Scholar] [CrossRef]
  12. Weil, R.R.; Mughogho, S.K. Sulfur nutrition of maize in four regions of Malawi. Agron. J. 2000, 92, 649–656. [Google Scholar] [CrossRef] [Green Version]
  13. Pasley, H.R.; Cairns, J.E.; Camberate, J.J.; Vyn, T.J. Nitrogen fertilizer rate increases rate increases plant uptake and soil availability of essential nutrients in continuous maize production in Kenya and Zimbabwe. Nutr. Cycl. Agroecosyst. 2012, 115, 373–389. [Google Scholar] [CrossRef] [Green Version]
  14. Kim, K.; Kaiser, D.E.; Lamb, J. Corn response to starter fertilizer and broadcast sulfur evaluated using strip trials. Agron. J. 2013, 105, 401–411. [Google Scholar] [CrossRef]
  15. Khan, M.J.; Khan, M.H.; Khattak, R.A.; Jan, M.T. Response of maize to different levels of sulfur. Commun. Soil Sci. Plant Anal. 2006, 37, 41–51. [Google Scholar] [CrossRef]
  16. Carciochi, W.D.; Divito, G.A.; Fernández, L.A.; Echeverría, H.E. Sulfur affects root growth and improves nitrogen recovery and internal efficiency in wheat. J. Plant Nutr. 2017, 40, 1231–1242. [Google Scholar] [CrossRef]
  17. McLaren, R.G.; Cameron, K.C. Soil, plant and fertilizer sulphur. In Soil Science; McLaren, R.G., Cameron, K.C., Eds.; Oxford University Press: Auckland, New Zealand, 1996; pp. 221–228. ISBN 13 9780195583458. [Google Scholar]
  18. Kulhánek, M.; Černý, J.; Balík, J.; Sedlář, O.; Suran, P. Potential of Mehlich 3 method for extracting plant available sulfur on the Czech agricultural soils. Plant Soil Environ. 2018, 64, 455–462. [Google Scholar] [CrossRef] [Green Version]
  19. Tisdale, S.L.; Nelson, W.L.; Beaton, J.D.; Havlin, J.L. Soil Fertility and Fertilizers, 5th ed.; Macmillan Publishing Company: New York, NY, USA, 1993; p. 634. ISBN 13 978-0024208354. [Google Scholar]
  20. Morche, L. S-Fluxes and Spatial Alterations of Inorganic and Organic Sulfur Fractions in Soil as Well as Their Accumulation and Depletion in the Rhizosphere of Agricultural Crops by Partial Use of the Radioisotope 35S. Ph.D. Thesis, Rheinische Friedrich-Wilhelms-Universität, Bonn, Germany, 2008; p. 321. (In German). [Google Scholar]
  21. Riley, N.G.; McGrath, S.P. Leaching losses of sulphur from different forms of sulphur fertilizers: A field lysimeter study. Soil Use Manag. 2002, 18, 120–126. [Google Scholar] [CrossRef]
  22. Bergholm, J.; Majdi, H. Accumulation of nutrients in above and below ground biomass in response to ammonium sulfate addition in a Norway spruce stand in southwest Sweden. Water Air Soil Pollut. 2001, 130, 1049–1054. [Google Scholar] [CrossRef]
  23. Suran, P.; Kulhánek, M.; Balík, J.; Černý, J.; Sedlář, O. Evaluation of Soil S pools under 23 Years of Maize Monoculture. Agronomy 2021, 11, 2376. [Google Scholar] [CrossRef]
  24. Dijksterhuis, H.G.; Oenema, O. Studies on the effectiveness of various sulfur fertilizers under controlled conditions. Fertil. Res. 1990, 22, 147–159. [Google Scholar] [CrossRef]
  25. Sharma, M.K.; Kumar, M. Sulphate contamination in groundwater and its remediation: An overview. Environ. Monit. Assess. 2020, 192, 74. [Google Scholar] [CrossRef]
  26. Kopáček, J.; Hejzlar, J.; Porcal, P.; Posch, M. Sulphate leaching from diffuse agricultural and forest sources in a large central European catchment during 1900–2010. Sci. Total Environ. 2014, 470–471, 543–550. [Google Scholar] [CrossRef]
  27. Boye, K.; Eriksen, J.; Nilsson, I.; Mattson, L. Sulfur flow in a soil-plant system—Effects of long-term treatment history and soil properties. Plant Soil 2010, 334, 323–334. [Google Scholar] [CrossRef]
  28. Balik, J.; Kulhánek, M.; Černý, J.; Száková, J.; Pavlíková, D.; Čermák, P. Differences in soil sulfur fractions due to limitation of atmospheric deposition. Plant Soil Environ. 2009, 55, 344–352. [Google Scholar] [CrossRef] [Green Version]
  29. Kulhánek, M.; Balík, J.; Černý, J.; Sedlář, O.; Vašák, F. Evaluating of soil sulfur forms changes under different fertilizing systems during long-term field experiments. Plant Soil Environ. 2016, 62, 408–415. [Google Scholar] [CrossRef] [Green Version]
  30. Mehlich, A. Mehlich 3 soil test extractant: A modification of Mehlich 2 extractant. Commun. Soil Sci. Plant Anal. 1984, 15, 1409–1416. [Google Scholar] [CrossRef]
  31. Zbíral, J.; Smatanová, M.; Němec, P. Sulphur status in agricultural soils determined using the Mehlich 3 method. Plant Soil Environ. 2018, 64, 255–259. [Google Scholar] [CrossRef]
  32. -Santoso, D.; Lefroy, R.D.B.; Blair, G.J. Sulfur and phosphorus dynamics in an Acid soil/crop system. Aust. J. Soil Res. 1995, 33, 113–124. [Google Scholar] [CrossRef]
  33. Kayikcioglu, H.H.; Yener, H.; Ongun, A.R.; Okur, B. Evaluation of soil and plant health associated with successive three-year sewage sludge field application under semi-arid biodegradation condition. Arch. Agron. Soil Sci. 2019, 12, 1659–1676. [Google Scholar] [CrossRef]
  34. Förster, S.; Welp, G.; Scherer, H.W. Sulfur speciation in bulk soil as influenced by long-term application of mineral and organic fertilizers. Plant Soil Environ. 2012, 58, 316–321. [Google Scholar] [CrossRef] [Green Version]
  35. Knights, J.S.; Zhao, F.J.; Spiro, B.; McGrath, S.P. Long-term effects of land use and fertilizer treatments on sulfur cycling. J. Environ. Qual. 2000, 29, 1867–1874. [Google Scholar] [CrossRef]
  36. Islam, M.R.; Bilkis, S.; Hoque, T.S.; Uddin, S.; Jahiruddin, M.; Rahman, M.M.; Siddique, A.B.; Hossain, M.A.; Marfo, T.D.; Danish, S.; et al. Mineralization of Farm Manures and Slurries under Aerobic and Anaerobic Conditions for Subsequent release of Phosphorus and Sulphur in Soil. Sustainability 2021, 13, 8605. [Google Scholar] [CrossRef]
  37. Barlóg, P.; Hlisnikovský, L.; Kunzová, E. Effect of Digestate on Soil Organic Carbon and Plant-Available Nutrient Content Compared to Cattle Slurry and Mineral Fertilization. Agronomy 2020, 10, 379. [Google Scholar] [CrossRef] [Green Version]
  38. Van Vuuren, D.P.; Bouwman, A.F.; Beusen, A.H.W. Phosphorus demand for the 1970–2100 period: A scenario analysis of resource depletion. Glob. Environ. Chang. 2010, 20, 428–439. [Google Scholar] [CrossRef]
  39. European Commission. Environmental, Economic and Social Impacts of the Use of Sewage Sludge on Land; Final Report; Part II: Report on Options and Impacts (10/02/2010, DG ENV.G.4/ETU/2008/0076r); Milieu Ltd.: Brussels, Belgium; WRc and Risk & Policy Analysts Ltd. (RPA): London, UK, 2010; p. 158. [Google Scholar]
  40. European Commission. Environmental, Economic and Social Impacts of the Use of Sewage Sludge on Land; Final Report; Part III: Project interim reports (10/02/2010, DG ENV.G.4/ETU/2008/0076r); Milieu Ltd.: Brussels, Belgium; WRc and Risk & Policy Analysts Ltd. (RPA): London, UK, 2010; p. 116. [Google Scholar]
  41. Dewil, R.; Baeyens, J.; Roles, J.; Van De Steene, B. Distribution of Sulphur Compounds in Sewage Sludge Treatment. Environ. Eng. Sci. 2008, 25, 879–886. [Google Scholar] [CrossRef]
  42. Sommers, L.E.; Tabatabai, M.A.; Nelson, D.W. Forms of sulphur in sewage sludge. J. Environ. Qual. 1977, 6, 42. [Google Scholar] [CrossRef]
  43. Balík, J.; Kulhánek, M.; Černý, J.; Sedlář, O.; Suran, P.; Asrade, D.A. The Influence of Organic and Mineral Fertilizers on the Quality of Soil Organic Matter and Glomalin Content. Agronomy 2022, 12, 1375. [Google Scholar] [CrossRef]
  44. Tlustoš, P.; Hejcman, M.; Kunzová, E.; Hlisinkovský, L.; Zámečníková, H.; Száková, J. Nutrient status of soil and winter wheat (Triticum aestivum L.) in response to long-term farmyard manure application under different climatic and soil physicochemical conditions in the Czech Republic. Arch. Agron. Soil Sci. 2018, 64, 70–83. [Google Scholar] [CrossRef]
  45. International Organization for Standardization. Soil Quality—Extraction of Trace Elements Soluble in Aqua Regia (ISO Standard No. 11466:1995). 1995. Available online: https://www.iso.org/standard/19418.html (accessed on 20 December 2022).
  46. Godlewska, A. Sulphur content in test plants and arylsulfatase activity in soil after application of waste materials. Appl. Ecol. Environ. Res. 2018, 16, 145–152. [Google Scholar] [CrossRef]
  47. Sakal, R.; Sinha, R.B.; Singh, A.O.; Bhogal, N.S.; Ismail, M.D. Influence of sulphur on yield and mineral nutrition of crops in maize-wheat semence. J. Indian Soc. Soil Sci. 2000, 48, 325–329. [Google Scholar] [CrossRef]
  48. Sedlář, O.; Balík, J.; Kulhánek, M.; Černý, J.; Matěchová, M.; Suran, P. Crop sulfur status in relation to soil sulfur determined using anion exchange membranes and Mehlich 3. J. Plant Nutr. 2021, 44, 1563–1570. [Google Scholar] [CrossRef]
  49. Prietzel, J.; Weick, C.; Korintenberg, J.; Seybold, G.; Thumerer, T.; Treml, B. Effects of repeated (NH4)2SO4 application on sulfur pool in soil, soil microbial biomass, and ground vegetation of two watersheds in the Black Forest/Germany. Plant Soil 2001, 230, 287–305. [Google Scholar] [CrossRef]
  50. Grobler, L.; Bloem, A.A.; Claassens, A.S. A critical soil sulphur level for maize (Zea mays L.) grown in a glasshouse. S. Afr. J. Plant Soil 1999, 16, 204–206. [Google Scholar] [CrossRef]
  51. Scherer, W.H. Sulfur in soils. J. Plant Nutr. Soil Sci. 2009, 172, 326–335. [Google Scholar] [CrossRef]
  52. Kulhánek, M.; Balík, J.; Sedlář, O.; Zbíral, J.; Smatanová, M.; Suran, P. Determining of Bioavailable Sulfur in Soil Using Mehlich 3 Method; Czech University of Life Sciences: Prague, Czech Republic, 2018; p. 32. ISBN 978-80-213-2893-8. (In Czech) [Google Scholar]
  53. Rogers, C.W.; Dari, B.; Schroeder, K.L. Comparison of soil-test extractants for potassium, calcium, magnesium, sulfur, and micronutrients in Idaho soils. Agrosyst. Geosci. Environ. 2019, 2, 190067. [Google Scholar] [CrossRef] [Green Version]
  54. Kowalenko, C.G.; Bittman, S.; Neilsen, G.H.; Kenney, E.; Hunt, D.E.; Neilsen, D. Potential for improving sulfur tests on agricultural soils in contrasting ecoregions of British Columbia, Canada. Geoderma Reg. 2014, 1, 10–20. [Google Scholar] [CrossRef]
  55. Gao, Y.; Duan, A.; Qiu, X.; Liu, Z.; Sun, J.; Zhang, J.; Wang, H. Distribution of roots and root length density in a maize/soybean strip intercropping system. Agric. Water Manag. 2010, 98, 199–212. [Google Scholar] [CrossRef]
  56. Balík, J.; Kulhánek, M.; Černý, J.; Sedlář, O.; Suran, P. Soil organic matter degradation in long-term maize cultivation and insufficient organic fertilization. Plants 2020, 9, 1217. [Google Scholar] [CrossRef] [PubMed]
  57. Zhang, H.; Kariman, K.; Zhu, L.; Liu, L.; Chen, J.J.; Zhu, L.; Li, D. Spatial distribution of carbon, nitrogen and sulfur in surface soil across the Pearl River Delta area, South China. Geoderma Reg. 2021, 25, e00390. [Google Scholar] [CrossRef]
  58. Lal, R. Soil organic matter and water retention. Agron. J. 2020, 112, 3265–3277. [Google Scholar] [CrossRef]
  59. Schnitzer, M. Organic matter, Principles and Processes. In Encyclopedia of Soils in the Environment, 3rd ed.; Hillel, D., Ed.; Elsevier Ltd.: Amsterdam, The Netherlands, 2005; pp. 85–93. [Google Scholar]
  60. Menšík, L.; Hlisnikovský, L.; Pospíšilová, L.; Kunzová, E. The e_ect of application of organic manures and mineral fertilizers on the state of soil organic matter and nutrients in the long-term field experiment. J. Soil Sediment 2018, 18, 2813–2822. [Google Scholar] [CrossRef]
  61. Klučáková, M. Size and charge evaluation of standard humic and fulvic acids as crucial factors to determine their environmental behavior and impact. Front. Chem. 2018, 6, 265. [Google Scholar] [CrossRef]
  62. Mitchell, R.J.; Hewison, R.L.; Fielding, D.A.; Fisher, J.M.; Gilbert, D.J.; Hurskainen, S.; Pakeman, R.J.; Potts, J.M.; Riach, D. Decline in atmospheric sulphur deposition and changes in climate are the major drivers of long-term change in grassland plant communities in Scotland. Environ. Pollut. 2018, 235, 956–964. [Google Scholar] [CrossRef]
  63. Tang, J.; He, J.; Liu, T.; Xin, X.; Hu, H. Removal of heavy metal from sludge by the combined application of a biodegradable biosurfactant and complexing agent in enhanced electrokinetic treatment. Chemosphere 2017, 187, 599–608. [Google Scholar] [CrossRef]
  64. Dai, Y.; Li, Y.; Ke, Y.; Li, B. Efficiency and mechanism of advanced treatment for phosphate wastewater by high efficiency and low consumption coagulation and phosphorus removal system. IOP Conf. Sef. Earth Environ. Sci. 2021, 631, 012002. [Google Scholar] [CrossRef]
  65. Kinsela, A.S.; Denmead, T.O.; Macdonald, B.C.T.; Melville, M.D.; Reynolds, J.K.; White, I. Field-based measurements of sulfur gas emissions from an agricultural coastal acid sulfate soil, eastern Australia. Soil Res. 2011, 49, 471–480. [Google Scholar] [CrossRef]
Figure 1. A climograph of average air temperatures and monthly precipitation calculated as average of 1997 to 2019 values.
Agronomy 13 00957 g001
Figure 2. Relative average yields (a) and relative average sulfur uptake (b) at harvest during the period 1993-2019; the different italic letters describe statistically significant differences between treatments. Tukey HSD test; p < 0.05. n = 27.
Agronomy 13 00957 g002
Figure 3. Content of water-soluble sulfur fraction (SW) in topsoil. Different letters describe significant differences between years within the treatment. Tukey HSD test (p < 0.05), (n = 4).
Agronomy 13 00957 g003
Figure 4. Content of adsorbed sulfur fraction (Sads) in topsoil. Different letters describe significant differences between years within the treatment. Tukey HSD test (p < 0.05), (n = 4).
Agronomy 13 00957 g004
Figure 5. Content of available sulfur fraction (Sav) in topsoil. Different letters describe significant differences between years within the treatment. Tukey HSD test (p < 0.05), (n = 4).
Agronomy 13 00957 g005
Figure 6. Content of Mehlich 3 extractable sulfur fraction (SM3) in topsoil. Different letters describe significant differences between years within the treatment. Tukey HSD test (p < 0.05), (n = 4).
Agronomy 13 00957 g006
Figure 7. Content of pseudo-total sulfur fraction (Spt) in topsoil. Different letters describe statistically significant differences between years within the treatment. Tukey HSD test (p < 0.05), (n = 4). Percentages shown inside the columns are a proportion of organic sulfur fraction out of pseudo-total sulfur content.
Agronomy 13 00957 g007
Figure 8. Content of organic sulfur fraction (Sorg) in topsoil. Different letters describe statistically significant differences between years within the treatment. Tukey HSD test (p < 0.05), (n = 4).
Agronomy 13 00957 g008
Figure 9. Content of pseudo-total sulfur (Spt) fraction in the subsoil in 1997 and 2019; the different standard letters describe statistically significant differences between years. The different italic letters (for 2019) describe significant differences between treatments. Tukey HSD test (p < 0.05), (n = 4).
Agronomy 13 00957 g009
Table 1. Experimental site characteristics.
GPS Coordinates50°4′22″ N
14°10′19″ E
Altitude (meters above sea level)410
Mean annual precipitation (mm)493
Mean annual temperature (°C)7.7
Soil typeHaplic luvisol
Soil textureSilty Loam
pH (CaCl2)6.5
Clay (%) (<0.002 mm)5.4
Silt (%) (0.002–0.05 mm)68.1
Sand (%) (0.05–2 mm)26.5
Bulk density topsoil (g cm−3)1.47
Bulk density subsoil (g cm−3)1.50
CSOM (%)1.26
Cation exchange capacity (mmol(+)/kg)118
Table 2. Content of Mehlich 3 extractable nutrients (P, K, Ca, and Mg) and other soil properties in 2019, topsoil.
PropertiesTreatments
ControlUANUAN + StSSFYMSlurry
P (mg P kg−1)141102125366317303
K (mg K kg−1)141115138129247228
Ca (mg Ca kg−1)251220002041243530322797
Mg (mg P kg−1)11178.1152166178153
CSOM (%)0.980.951.161.201.491.12
CHA/FA0.560.630.820.781.040.84
pH (CaCl2)6.365.915.886.256.816.70
P—phosphorus, K—potassium, Ca—calcium, Mg—magnesium, CSOM—carbon soil organic matter, CHA/FA—humic and fulvic acid ratio, UAN—urea and ammonium nitrate, UAN + St—UAN and wheat straw, SS—sewage sludge, FYM—farmyard manure.
Table 3. Experimental design and nutrient inputs with fertilizers.
Treatmentkg Nutrient ha−1 Year−1C:N:S *C:S
NSPK
Control0000--
UAN120000--
UAN + St120 + 33.52.614.3445.014.6:1:0.02728
SS12052.482.116.07.32:1:0.4317.0
FYM12016.432.612913.4:1:0.1495.7
Slurry12016.323.21055.08:1:0.1436.3
UAN—urea ammonium nitrate solution, St—wheat straw in average dose of 5000 kg DM (dry matter) ha−1 year−1, SS—sewage sludge in average dose of 3101 kg DM ha−1 year−1, 30.3% DM. FYM—farmyard manure in average dose of 5027 kg DM ha−1 year−1, 23.7% DM. Slurry—slurry in the average dose of 2280 kg DM ha−1 year−1, 5.7% DM. * Nutrient ratios in fertilizers calculated based on C:N ratio results in Balík et al. [43] and internal results.
Table 4. Total sulfur inputs (depositions and fertilizer) during the experiment.
Input PeriodControlUANUAN + StSSFYMSlurry
kg S ha−1 per Period
1993–1996808090290146145
1997–2001616174323143143
2002–2007484864362146146
2008–2013373753351135135
2014–2019292945343127127
1993–20192542543251670697696
1997–20191751752351380552551
Numbers in the Control and UAN treatments represent the atmospheric depositions that every treatment received. UAN + St, SS, FYM, and Slurry treatments also include inputs from the application of their respective fertilizer.
Table 5. Plant sulfur content (mg S kg−1) after harvest in dry biomass (n = 8).
YearControlUANUAN + StSSFYMSlurry
MeanMeanMeanMeanMeanMean
1997568 a c714 b c712 b c681 b b717 b c710 b c
2008472 a b637 b b590 b b754 c b545 b b538 ab b
2019381 a a522 b a484 b a618 c a447 ab a441 ab a
The different italic letters describe statistically significant differences between treatments (in rows). The different standard letters describe statistically significant differences between years (in columns). Tukey HSD test p < 0.05.
Table 6. Detailed sulfur plant uptake in the period during the experiment (kg S ha−1 per period).
Uptake PeriodControlUANUAN + StSSFYMSlurry
MeanMeanMeanMeanMeanMean
1993–199615.7 a25.3 b24.2 ab28.8 b23.0 ab21.7 ab
1997–200124.8 a42.7 bc35.4 bc43.6 b34.7 b33.5 b
2002–200722.2 a b43.2 b b42.9 bc b48.2 b b39.5 b b40.6 b b
2008–201317.6 a ab39.8 bc b40.3 bc b42.9 c ab32.5 bc a28.3 ab a
2014–201916.1 a a32.3 b a33.1 bc a38.6 b a29.4 ab a30.1 ab a
1993–201996.3183176202159154
1997–201980.6158152173136133
The different italic letters describe statistically significant differences among treatments (in rows). The different standard letters describe statistically significant differences among years (in columns). Tukey HSD test (p < 0.05); n = 4 for years 1993–1996 and 1997 and 2001; n = 6 for following periods.
Table 7. Spearman’s correlation coefficient values comparing the relationship of plant sulfur content with soil sulfur content.
SWSadsSavSM3SptSorg
Plant S content0.741 *0.6690.743 *0.694 *0.2450.564 *
Values marked with * were significant at p < 0.05; n = 72.
Table 8. Results for two-way ANOVA comparing the effects of treatment, year, and their interaction on the S content in individual S fractions in topsoil.
Topsoil S FractionTreatmentYearTreatment × Year
FdfFdfFdf
SW6.62 *5206.96 *20.4410
Sads7.80 *591.99 *20.8410
Sav7.51 *5205.69 *20.4910
SM315.19 *5108.07 *20.4610
Sorg19.76 *55.80 *20.9810
Spt22.43 *523.13 *20.9510
The values marked with asterisk (*) are significant effect at p < 0.05.
Table 9. Relative changes (%) in the content of respective sulfur fractions in topsoil. Values represent relative content in the year 2019 in comparison with the year 1997 (100% = content in 1997). Mean plus standard deviation (SD).
TreatmentSWSadsSavSorgSpt
Mean ± SDMean ± SDMean ± SDMean ± SDMean ± SD
Control23 ± 8.00 a58 ± 9.40 a31 ± 9.44 a81 ± 7.93 a73 ± 5.05 a
UAN33 ± 10.1 ab73 ± 11.4 a43 ± 10.7 a83 ± 9.85 ab77 ± 10.5 a
UAN + St32 ± 4.52 ab71 ± 11.0 a41 ± 5.18 a90 ± 6.18 ab82 ± 4.17 ab
SS38 ± 3.44 ab68 ± 4.43 a45 ± 2.49 a95 ± 6.43 ab87 ± 5.41 ab
FYM42 ± 7.93 b67 ± 5.08 a48 ± 7.13 a101 ± 3.29 b94 ± 2.95 b
Slurry29 ± 2.42 ab59 ± 3.17 a37 ± 1.90 a85 ± 6.85 ab77 ± 5.25 a
The different italic letters describe statistically significant differences between treatments per soil sulfur fraction. Tukey HSD test p < 0.05 (n = 4).
Table 10. The content of sulfur fractions in subsoil (mg S kg−1) in the year 2019.
SWSadsSavSorg
Control3.5 a2.7 a6.1 ab109 ab
UAN3.0 a2.2 a5.1 a93 a
UAN + St4.6 a3.1 ab7.7 a112 ab
SS21.8 c5.0 b26.8 c112 ab
FYM8.9 b4.0 b12.9 b138 c
Slurry7.5 b3.5 ab11.1 b119 bc
The different italic letters describe statistically significant differences between treatments in a fraction at p < 0.05 Tukey HSD test, n = 4.
Table 11. Balance of pseudo-total sulfur in topsoil and subsoil comparing the year 1997 to 2019.
TreatmentControlUANUAN + StSSFYMSlurry
kg S ha−1
Topsoil
1997952 ab b885 a b951 ab a1113 bc a1197 c a1076 abc b
2019692 ab a682 a a782 ab a969 bc a1121 c a832 abc a
Balance−260−203−169−144−76−243
Subsoil
1997471 a a587 a a473 a a795 a a683 a a540 a a
2019519 ab a442 a a540 abc a625 bc a682 c a585 abc a
Balance+48−146+67−171−1+45
The different italic letters describe statistically significant differences between treatments in a year (in rows). The different standard letters describe statistically significant differences between years of treatment (in columns). Tukey HSD test, p < 0.05, n = 4.
Table 12. Movement of sulfur in topsoil and subsoil during the trials.
TreatmentControlUANUAN + StSSFYMSlurry
Topsoil (kg S ha−1)
Status 1997 and inputs in 1997 to 2019 (a)112710601186249317491626
Status in 2019 and uptake 1997 to 2019 (b)77183893411431257965
Loss from topsoil (a,b)3562212521350492661
Subsoil (kg S ha−1)
Status in 1997 and loss from topsoil (c)828808726214611751201
Status in 2019 (d)519442540625682585
Loss from subsoil (c,d)3093661861521493616
Disclaimer/Publisher’s Note: The statements, opinions and data contained in all publications are solely those of the individual author(s) and contributor(s) and not of MDPI and/or the editor(s). MDPI and/or the editor(s) disclaim responsibility for any injury to people or property resulting from any ideas, methods, instructions or products referred to in the content.

