Article

Impact of Sandy Soil Amendment with Dairy Slurry Treated through pH Adjustment on Nutrient and Coliform Leaching

LEAF—Linking Landscape, Environment, Agriculture and Food Research Center, Associated Laboratory TERRA, Instituto Superior de Agronomia, Universidade de Lisboa, Tapada da Ajuda, 1349-017 Lisboa, Portugal
*
Author to whom correspondence should be addressed.
Agronomy 2023, 13(4), 1176; https://doi.org/10.3390/agronomy13041176
Submission received: 26 March 2023 / Revised: 15 April 2023 / Accepted: 17 April 2023 / Published: 20 April 2023

Abstract

:
Livestock farming produces high volumes of animal slurry that can be sanitized using low-cost treatments by pH adjustment, reducing pathogen contamination, and promoting slurry valorization as a safe fertilizer. This work aims to evaluate the impact of sandy soil amendment with dairy slurry treated by pH adjustment on the potential release of nutrients and coliforms into groundwater. A laboratory soil column leaching experiment was conducted and the surface application of six treatments was tested: raw dairy slurry, dairy slurry acidified with H2SO4, dairy slurry alkalinized with KOH, alkalinized/neutralized dairy slurry, mineral fertilizer, and a control. The fertilizer application rate was 0.08 g N kg−1 dry soil. Leachates were analyzed for pH, electrical conductivity, N-NH4+ and N-NO3, macro- and micronutrients, and fecal coliforms. Results showed that amendment with dairy slurry led to significantly lower nitrate leaching potential than mineral fertilizer (maximum 16.1 vs. 50.4%). The use of hygienized slurry by alkalinization decreased the potential leaching of coliforms relative to raw slurry. However, incomplete sanitization by acidification strongly promoted coliform leaching and the risk of groundwater contamination. It can be concluded that the use of alkalinized dairy slurry is a safer solution than raw slurry with regard to the risk of groundwater pollution.

1. Introduction

Intensive livestock farming has been responsible for the production of increasingly higher quantities of animal manure, namely, slurry (1200 million tons year−1 in the EU) [1], which points to the necessity of new strategies for animal slurry (AS) management and valorization. Traditionally, AS has been applied to agricultural soils as organic fertilizer, promoting an integrated and regenerative use of natural resources and by-products and contributing to the global sustainability of the agri-food system. However, the over-application of untreated AS to the soil may lead to the contamination of crops, as well as surface and groundwater, with coliforms that may include pathogenic microorganisms (e.g., Salmonella) [2,3,4,5].
Pathogen survival in the environment depends fundamentally on factors such as: (i) type of microorganism; (ii) slurry source; (iii) slurry physicochemical composition (pH, dry matter content, moisture content); (iv) temperature; (vi) oxygen availability; and (vi) microbial competition [6,7,8,9]. According to Cools et al. [10], after field application, slurry-borne microorganisms can survive for up to three months at 5–25 °C. These microorganisms can be physically strained in narrow soil pore spaces or water films, or they can be chemically linked to soil and slurry particles [11,12]. In comparison to surface water, groundwater is considered to be a safer water resource, as infiltration can mitigate potential contaminants, and soil bacteria can impair pathogen survival [13]. Mechanical properties of the soil (particle size, porosity) and physicochemical composition (presence of soluble organic substances, pH) determine its depuration capacity [14]. Nevertheless, a slurry hygienization treatment before soil application is strongly recommended to decrease the risk of disease transmission to humans and other animals, through direct contact with AS or indirect contact through contaminated food products or water resources. Rodrigues et al. [15] tested a low-cost dairy and pig slurry sanitization treatment by pH adjustment with promising results, considering technical feasibility, economical aspects, and the fertilizer value of the AS. Three different AS hygienization treatments were tested: (i) alkalinization (AL) to pH 9.5 with KOH; (ii) acidification (AC) to pH 5.0 with H2SO4; and (iii) a combined treatment—alkalinization with KOH followed by addition of H2SO4 until neutrality (pH 7.0) (NE)—to prevent NH3 emissions due to alkaline pH. All these AS hygienization strategies have proved to be efficient in reducing pathogen contamination [15]. Besides slurry sanitization, these treatments also influenced the slurry’s chemical composition. KOH was selected as the alkalinizing agent for slurry sanitization and subsequent use as an organic fertilizer in horticulture, since its use enriched the slurry potassium (K) content, a major plant macronutrient with an important role in the synthesis of organic compounds [16].
According to Rodrigues et al. [15], the total concentration of other plant macronutrients—calcium (Ca) and magnesium (Mg)—and micronutrients—copper (Cu), zinc (Zn), iron (Fe), manganese (Mn) and boron (B)—were not affected by the sanitization treatments, but the soluble fraction of these elements should be affected by treatments; specifically, by acidification [17]. The same is true for total phosphorus (P) concentration, one of the most important parameters that determine the AS fertilizer value. Regarding the total nitrogen (N) content of slurry, it is worth mentioning that slurry acidification with concentrated sulfuric acid strongly reduces ammonia (NH3) emissions and consequently increases the AS fertilizer value by preserving N [17].
Several studies reported the impact of animal production on water pollution, namely, that caused by the leaching of nitrate (NO3), P, and slurry-borne microorganisms [3,13,18,19,20,21,22]. Even when AS is treated and applied to the soil, there is still a potential risk of pathogenic contamination of water resources since, depending on certain conditions, AS may not be successfully sanitized [23]. However, to our knowledge, the impact of AS sanitization by pH adjustment on nutrient leaching and the environmental fate of the elements and microbiota after application to soil has been infrequently studied. Hence, this study aimed to assess the impact of sandy soil amendment with dairy slurry (DS) treated by three different strategies of sanitization by pH modification (AC, AL, NE) on the potential release of nutrients and coliforms into groundwater.

2. Materials and Methods

2.1. Soil Sampling and Slurry Preparation

The soil used in the leaching experiment was collected from the top-soil layer (0–20 cm) of an arable field located in Palmela (38°57′95.7″ N; 8°82′95.4″ W), Portugal. The field has not received any animal slurry in the last 20 years.
Dairy slurry (DS) was collected from the main slurry storage tank at a commercial dairy farm located in Setubal (38°33′44.7″ N; 8°49′38.0″ W) and stored at 4 °C in non-hermetic plastic containers before treatments were applied based on the optimized pH conditions defined by Rodrigues et al. [15]. Briefly, for the slurry acidification treatment (AC) targeting pH 5.0 and the alkalinization treatment (AL) targeting pH = 9.5, 12 mL of H2SO4 (95% H2SO4 w/w, d = 1.84) and 6 g of KOH were added per kg of DS, respectively; for the alkalinization/neutralization (NE) treatment targeting pH 7.0, 6 mL of H2SO4 was added per kg of alkaline slurry to decrease the pH to a neutral range. The pH values of the slurries were measured after each addition of acid/alkali using a Russell RL 150 pH meter. Slurry treatments were performed 24 h before application (day 0). Sub-samples were collected for microbiological and physicochemical analysis: pH; electrical conductivity (EC); dry matter content (DM); organic matter content (OM); total Kjeldahl nitrogen (TN), ammonium N (N-NH4+), P, K, sodium (Na), Mg, Ca, sulfur (S), Cu, Zn, Fe, Mn, and B concentrations; and microbiological composition—detection of Salmonella in 25 g of slurry and enumeration of E. coli (CFU g−1) as described in Section 2.2.

2.2. Physicochemical Analysis

2.2.1. Soil

Soil was characterized in terms of pH, EC, OM, and soil macro- and micronutrients and exchange bases (Table 1) according to the following standard laboratory methods: (i) pH and EC were determined in a soil:water (1:2.5 w/v) suspension after 1 h magnetic stirring; (ii) OM was quantified by loss-on-ignition after incineration at 500–550 °C of dry sample; (iii) TN was determined by the Kjeldahl method [24]; (iv) mineral N was extracted with 2M potassium chloride (KCl) solution (30 mL + 6.0 g of moist soil) [25], and the extract was analyzed by molecular absorption spectrophotometry for N-NH4+ and nitrate N (N-NO3) contents in a Skalar segmented flow auto-analyzer (ScanPlus, Skalar, Breda), as described by Fangueiro et al. [26]; (v) K and P contents were determined according to the Egner–Riehm method [27]; (vi) available Cu, Zn, Fe, and Mn were extracted based on the procedure described by Lakanen and Erviö [28] and quantified by atomic absorption spectrophotometry; (vii) exchangeable cations were extracted by 1 mol L−1 ammonium acetate at pH 7 and measured by atomic absorption spectrophotometry [29]. The pipette method was used for the determination of soil texture by sedimentation [30].

2.2.2. Dairy Slurry and Leachates

Slurry was analyzed as described by Fangueiro et al. [31]. Slurry and leachate samples were analyzed for pH and EC using a Metrohm 680 conductivity meter (Switzerland) and a Russell RL 150 pH meter (Thermedics, Chelmsford, MA, USA), respectively.
The DM content of slurry samples was determined gravimetrically at 105 °C to constant weight and the OM content by loss-on-ignition after calcination at 550 °C for 4 h. The TN was analyzed in fresh samples by the Kjeldahl method, following the digestion, distillation, and titration steps [32], while the N-NH4+ content was determined directly, by distillation and titration with HCl.
Leachates’ N-NH4+ and N-NO3 content were analyzed by spectrophotometry, using the Berthelot and sulfanilamide methods for NH4 and NO3, respectively, in an automatic segmented flow analyzer (Autoanalyzer Skalar, Breda, The Netherlands).
Macro- and micronutrients (P, K, Na, Mg, Ca, S, Cu, Zn, Fe, Mn, and B) were determined by quantification by inductively coupled plasma—mass spectrometry directly in leachate samples after acid digestion of slurry samples at 105 °C with a 9:3 (v/v) mixture of HCl (37% HCl w/w, d = 1.19) and HNO3 (65% HNO3 w/w, d = 1.39). Samples were analyzed in triplicate.

2.3. Microbiological Analysis

2.3.1. Detection of Salmonella in DS

The method for the detection of Salmonella in DS samples was based on ISO 6579-1:2017 [33], a horizontal method for the detection of Salmonella in animal feces and environmental samples from the primary production stage. The sample was submitted to a pre-enrichment step in a non-selective medium (buffered peptone water) and incubated at 37 °C for 18 ± 2 h. Afterwards, a selective enrichment was performed on plates of modified semi-solid Rappaport-Vassiliadis (MSRV, Biokar, Beauvais, France) inoculated with the pre-enriched sample and incubated at 41.5 ± 1 °C for (2×) 24 h. Plates of xylose lysine desoxycholate (XLD, Biokar, Beauvais, France) were then inoculated from the selective enrichment plates and incubated for 24 h at 37 °C for the detection of presumptive Salmonella colonies. The presence or absence of Salmonella was reported to 25 g of fresh material. The analyses were replicated using three biologically independent samples (biological replicates), with two repetitions under identical conditions (technical replicates).

2.3.2. Enumeration of Escherichia coli (E. coli) in DS

The method for the enumeration of E. coli in DS samples was performed following ISO 16649-2-2015 [34], a horizontal method for the enumeration of beta-glucuronidase-positive E. coli by the colony-count technique at 44 °C using 5-bromo-4-chloro-3-indolyl beta-D-glucuronide. As recommended for animal feces, 1:10 dilutions of the samples in Ringer solution were prepared and kept for 20 h in an orbital shaker at +5 °C, to favor the release of the microorganisms from slurry particles, particularly important in non-homogeneous materials. Afterwards, Tryptone-Bile-Glucuronic plates (TBX, Biokar, Beauvais, France) were inoculated with serial decimal dilutions of the samples. The inoculated plates were incubated for 18–24 h at 44 °C, and the typical β-glucuronidase-positive (blue color) E. coli colony-forming units (CFU) were counted and the number of CFU of β-glucuronidase-positive E. coli per g of slurry was calculated. The analyses were replicated using three biological replicates and two technical replicates.

2.3.3. Enumeration of Fecal Coliforms in Leachates (MPN/100 mL)

The method used for the enumeration of fecal (thermotolerant) coliforms in leachates was based on fermentation in multiple tubes, the subculture of positive tubes in confirmation media, and the determination by the most probable number per 100 mL of leachate (MPN/100 mL) [35]. Briefly: Series of 15 tubes of Lactose Broth (LacB) (Biokar Diagnostics, Beauvais, France), each with Durham fermentation tubes inside, were inoculated with appropriate volumes of leachate: (i) five tubes with 10 mL of double concentration of LacB were inoculated with 10 mL of the leachate sample (1:1); (ii) five tubes of single concentrated LacB were inoculated with 1 mL of leachate sample (1:10); and (iii) five tubes of single concentrated LacB were inoculated with 0.1 mL of leachate sample (1:100). The tubes were then incubated at 35 ± 0.5 °C and examined for turbidity after 24 to 48 ± 3 h. After this period, all tubes with gas and/or turbidity were subjected to the confirmation test for fecal coliforms, gently shaken/rotating to homogenize the broth, and transferring 0.1 mL of the culture from each tube to fermentation tubes containing 10 mL of E. coli broth (Biokar Diagnostics, Beauvais, France) with Durham tubes inside. Tubes were incubated at 44.5 ± 0.2 °C for 24 ± 2 h. Growth with gas production in E. coli broth at 44.5 °C within 24 ± 2 h or less was considered a positive thermotolerant (fecal) coliform reaction. Failure to produce gas (with little or no growth) was considered a negative reaction. The most probable number (MPN) of fecal coliforms/per 100 mL of sample and 95% confidence limits for various combinations of positive and negative results (when five 10 mL, five 1 mL, and five 0.1 mL test portions were used) were calculated from the number of positive EC broth tubes according to tabulated values [35].

2.4. Experimental Setup

The leaching experiment was performed in PVC columns (30 cm long, 5.7 cm internal diameter), sealed at the bottom by a layer of glass wool, and a PVC net filled with 1 kg of sandy soil. The soil columns were placed in 30 L PVC containers with distilled water, which rose by capillarity for 48 h until the soil was uniformly saturated. The soil columns were placed on a shelf, and excess water was drained for 24 h. Surface application of the treatments was carried out when the soil was at field capacity. Six treatments were tested: (i) raw DS (RA); (ii) DS acidified with H2SO4 [pH = 5] (AC); (iii) DS alkalinized with KOH [pH = 9.5] (AL); (iv) alkalinized/neutralized DS [pH = 7] (NE); (v) ammonium nitrogen aqueous solution (92 g NH4NO3 L−1) as a mineral fertilizer (MN); plus (vi) a control without any application (CT). Four replicates (n = 4) of each treatment were performed in a total of 24 soil columns. The application rate of raw/treated DS or mineral fertilizer was 0.08 g N kg−1 dry soil, corresponding to 240 kg N ha−1. The soil columns were weighed regularly to check the moisture content and kept at 20 °C during the experiment.
The columns were equipped at the bottom with a funnel and Erlenmeyer flask to allow the recovery of the leachates, and rainfall was simulated by carrying out three irrigation events (IEs) [18]. The total volume of distilled water applied in each irrigation event was 210 mL, equivalent to 100% of the soil water holding capacity (WHC). The three irrigation events (IEs) were performed three, ten and seventeen days after the application of the treatments. According to the revised Portuguese version of the code of Good Agricultural Practices [36], organic amendments must not be applied under adverse climatic conditions, namely, in periods of precipitation or when precipitation is imminent. A three-day waiting period between slurry application and the first IE should be respected, as a three-day weather forecast is a common strategy used by Portuguese farmers in planning this type of field activity. After each IE, 12 h were allowed for drainage to cease. The total volume of leachate was then measured, and a sample was collected for subsequent analysis.

2.5. Statistical Analysis

The effects of the slurry sanitization treatments (RA, AC, AL, NE, MN, and CT), time after fertilizer application (t = 3, 10, and 17 d), and their interaction (sanitization treatment × time after fertilizer application) on the microbial and physicochemical characteristics of the collected leachates were determined by a two-way ANOVA. The normality and homogeneity of the variances were first checked by the Shapiro Wilk and Levene tests, respectively. Three levels of significance were considered: p ≤ 0.05 and ˃0.01, ≤0.01 and ˃0.001, and ≤0.001. Whenever significant differences were found (p ≤ 0.05), a post hoc Tukey HSD (Honest Significant Difference) test was used to elucidate differences between means (p ≤ 0.05). The statistical software package used was Statistica 10.0 (StatSoft Inc., Tulsa, OK, USA).

3. Results and Discussion

3.1. Physicochemical and Microbiological Characterization of Raw and Treated Slurries

The physicochemical and microbiological characterization of raw and treated dairy slurries used in the leaching test are presented in Table 2. The nutrient content of raw dairy slurry can be highly variable [37] and can be affected by animal species, age, production and animal diet, farm management, and housing system [38]. N is normally present in dairy slurry in two forms: (i) N-NH4+ and (ii) organic N, which is less available to plants. The N-NH4+ content of the RA was 1.44 ± 0.03 g kg−1, corresponding to approximately 40% of the total N content (Table 2). The sustainable use of slurry as fertilizer results in a slow release of nutrients, reducing its potential environmental impact [39]. In the present study, the slurry was applied on the soil surface without incorporation, which might have promoted ammonia losses in RA, AL, and NE treatments relative to AC [40], and consequently decreased the amount of NH4+ in the soil available to be nitrified and potentially leached.
The sanitization treatments by pH adjustment, with the addition of chemical reagents, had an impact on the EC of the DS. The highest increase in EC was observed in the alkalinized/neutralized slurry (NE) with the addition of H2SO4 and KOH (Table 2). Considering that the main objective of the slurry treatment would be its application as an organic fertilizer, this increase of almost 28% in EC could lead to problems of soil salinity and phytotoxicity during plant growth and impair the DS’s value as a fertilizer, an issue that needs proper evaluation [41,42].
The alkalinized/neutralized dairy slurry (NE) presented the highest value of DM content, whereas the acidified dairy slurry (AC) presented the highest OM content (Table 2). DS sanitization treatments that included KOH addition (AL and NE) doubled the total K concentration compared with raw slurry, while treatments with the addition of concentrated H2SO4 (AC and NE) resulted in a 10 time increase in total S concentration (Table 2).
Slurry acidification treatment may lead to nutrient solubilization, which increases the fraction of available nutrients to plants, but it may also increase the risk of nutrient leaching. However, total concentrations of macronutrients (Ca and Mg) and micronutrients (Cu, Zn, Fe, Mn, and B) were not affected by the sanitization treatments. The same was true for total P concentration, one of the most important parameters for DS fertilizer value. The legal microbiological criterion for fertilizers is the absence of Salmonella in 25 g of material and less than 103 CFU of E. coli per g of fresh material. Salmonella was not detected in any of the slurry samples used in this study (Table 2).
In previous work [15], it was possible to reduce E. coli, both in dairy and pig slurry, below the legal criterion of 103 CFU g−1. DS is a more heterogeneous material than pig slurry and, consequently, may be more difficult to sanitize. In this work, the three treatments of the DS (AC, AL, and NE) were performed based on the optimized pH conditions defined by Rodrigues et al. [15]. Although the three treatments were able to reduce E. coli by about 1 log CFU g−1, the sanitization of the slurries was not completely achieved (Table 2). This emphasizes the heterogeneity of the material mainly related to farm management, making it difficult to use a standard recipe for sanitizing DS.

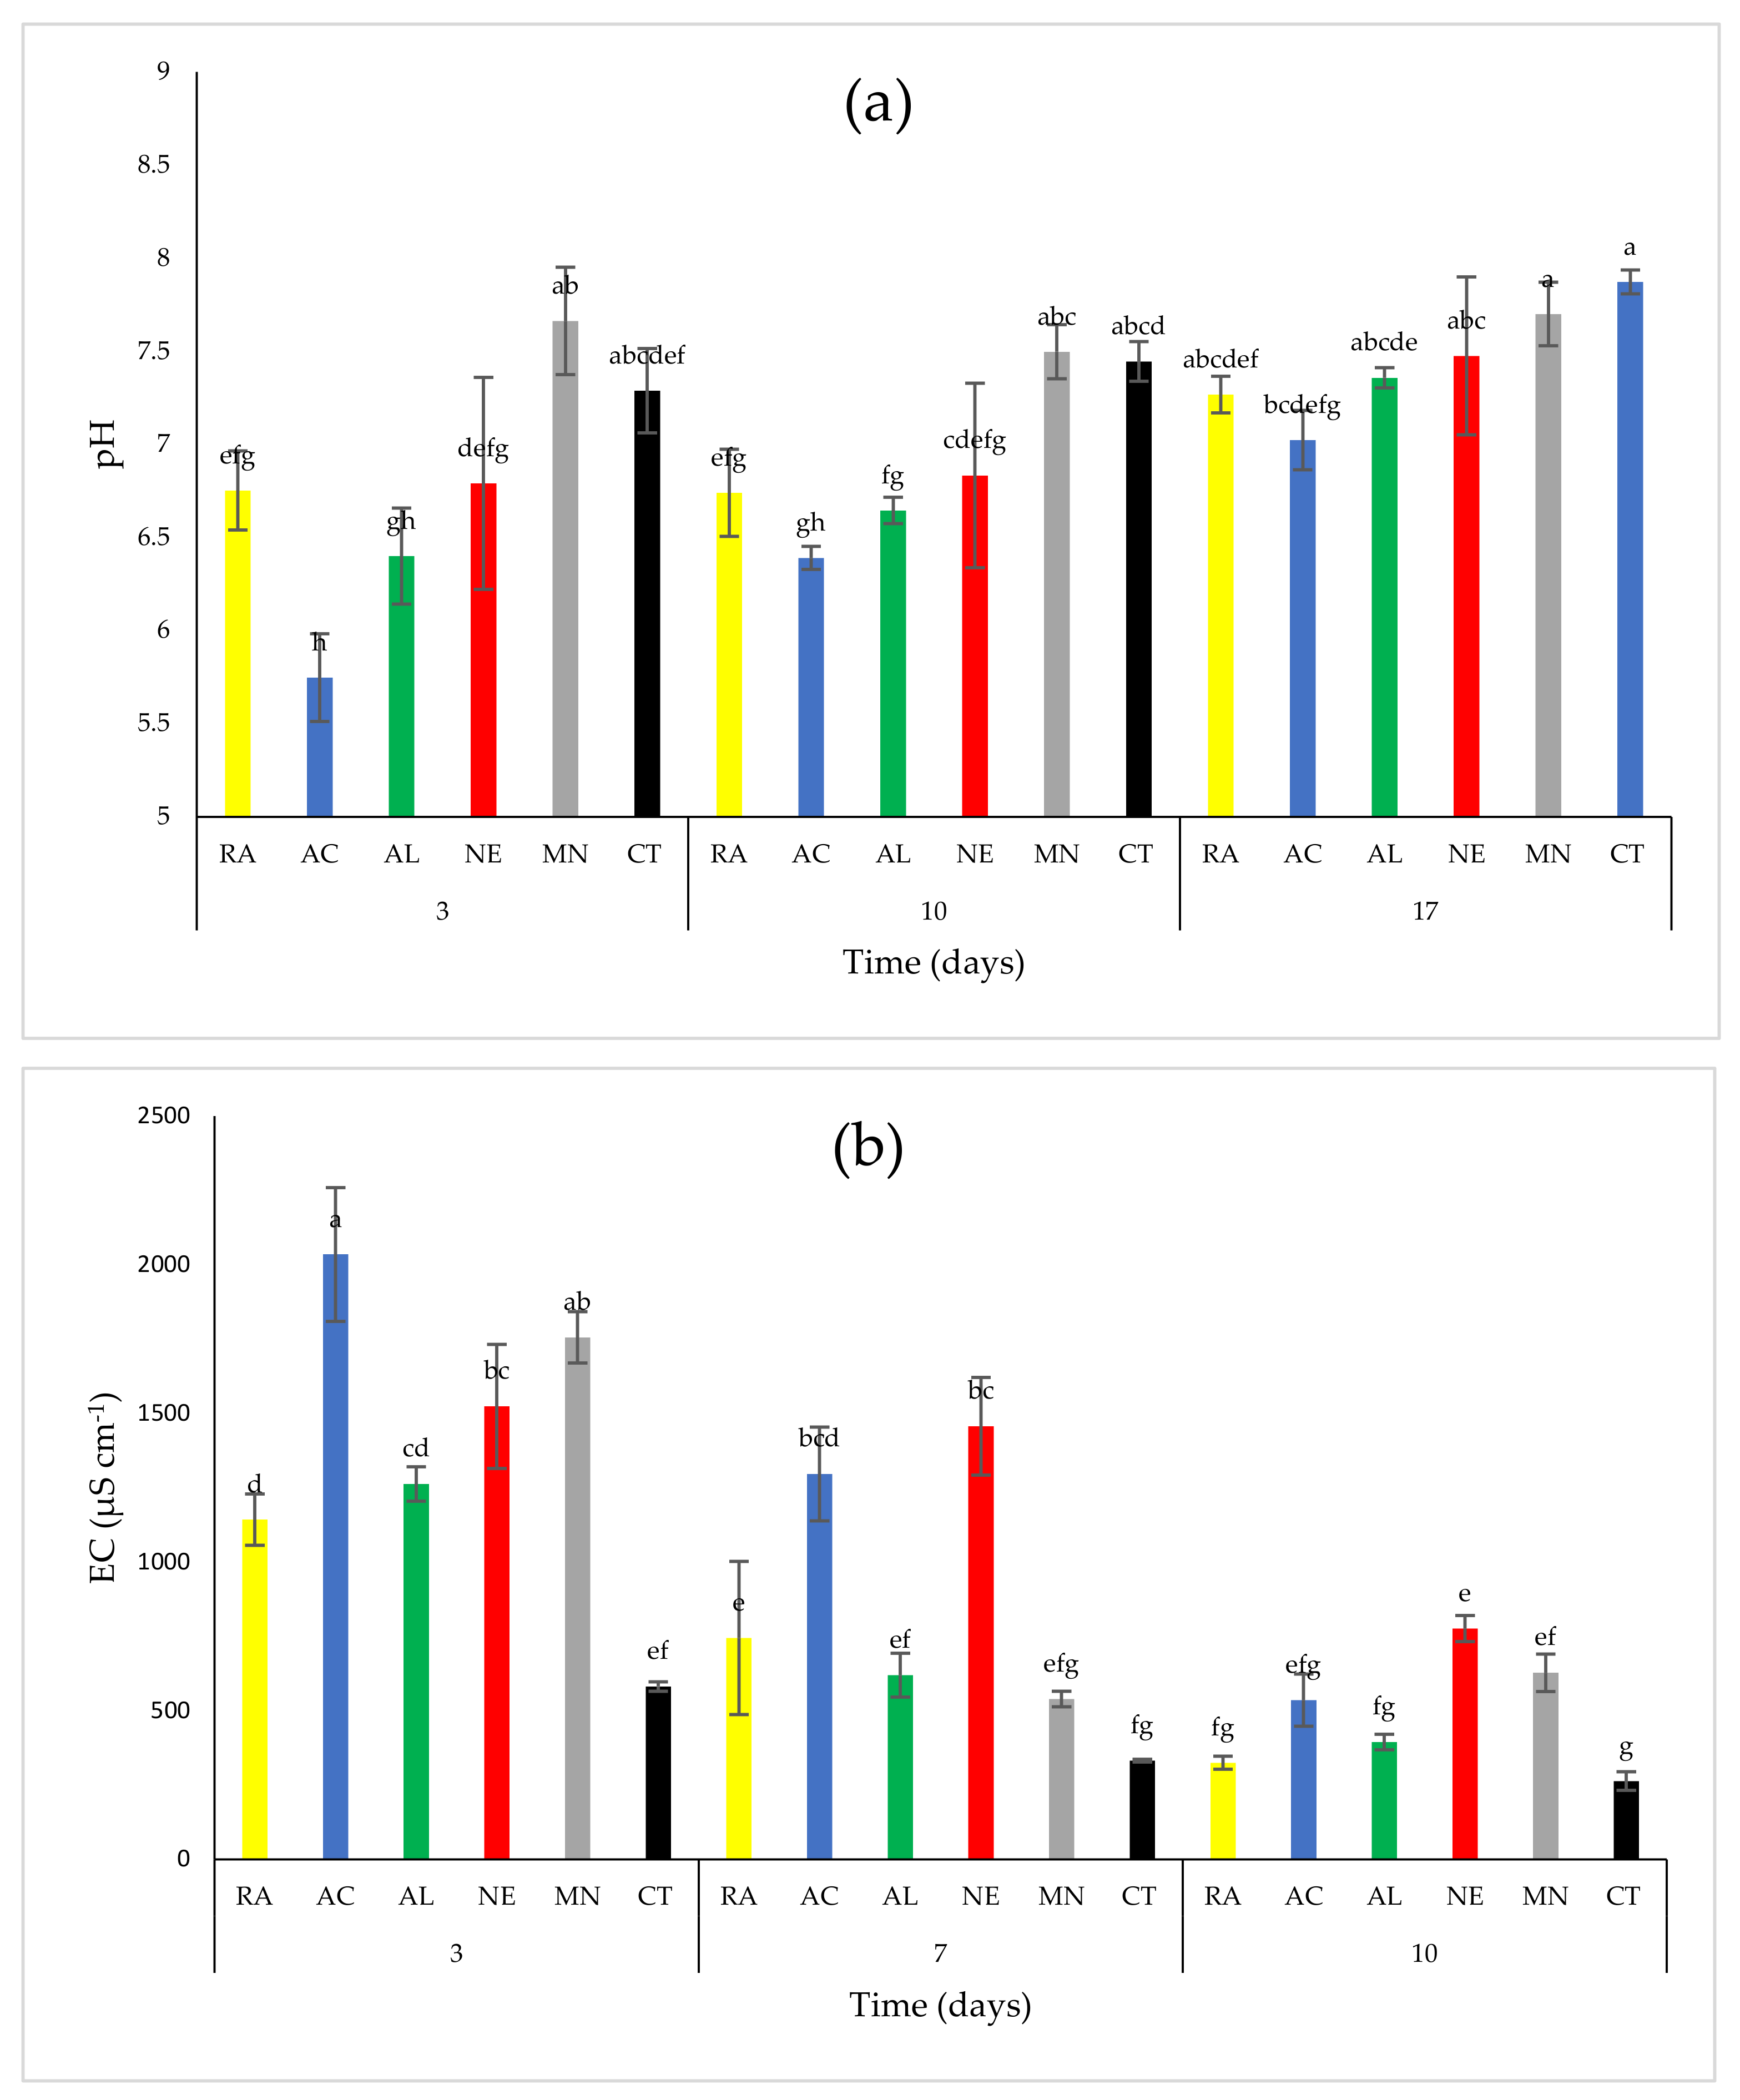
3.2. Physicochemical Characterization of the Leachates

The volumes of collected leachates did not vary significantly between treatments (RA, AC, AL, NE, MN, CT) for the same leaching event (3, 10, and 17 days after application) (Table S1). The variation of pH and EC (µS cm−1) of leachates collected 3, 10, and 17 days after the fertilizer application for each treatment considered (RA, AC, AL, NE, MN and CT) are presented in Figure 1. The leachates collected from soils with the application of acidified dairy slurry (AC) had a pH of 5.75 at the first leaching event. However, pH values of leachates from AC tended to increase over time towards a more neutral value (t = 17 d, pH = 7.02). The pH of leachates collected in RA, NE, and MN was not significantly different from the control (CT) and remained close to a neutral range over the three IEs (Figure 1A). As previously discussed in Section 3.1, the addition of acids or bases to the slurries leads to an increase in their EC and, consequently, such an increase was reflected in the EC of the leachates collected during the first leaching event (Figure 1B), where higher values of EC were observed in AC, MN, NE, and AL. Nevertheless, 17 days after the fertilizer application, the EC of leachates did not present any significant differences. Fangueiro et al. [18] observed the same trend in a study about the impact of slurry acidification and application techniques on potential leaching. According to the authors, in the first event, the EC of leachates was always significantly higher in slurry-amended treatments than in the control due to the higher risk of leaching of slurry particles. The same authors also determined that slurry acidification led to a significant increase of leachate EC over the four events performed, relative to the untreated slurry.

3.2.1. Nutrient Leaching

To evaluate the impact of mineral and organic fertilizer application on the composition of the leachates, variations in the concentration of some macronutrients (N-NO3, N-NH4+, S, P, and K) in leachates collected 3, 10, and 17 days after the fertilizer application for each treatment were assessed, and these are presented in Figure 2. Table 3 presents the cumulative amount of nutrient lost by leaching over the three IEs, expressed as a percentage (%) of the amount initially applied.

Nitrogen Content of the Leachates

The two main sources of N for agriculture are mineral fertilizers and animal manure. While many studies have considered the risk of N leaching following mineral N fertilizers [43,44,45], there is less information available regarding the potential risk of N leaching in soils amended with animal slurry, namely, slurry treated by pH modification. In the first days following slurry application, N immobilization is normally greater than mineralization [46]. Ammonia that is not lost during or after the application is adsorbed by soil clay particles and organic matter, remaining immobile. Net mineralization is affected by (i) the breakdown characteristics of the organic material, (ii) soil temperature, and (iii) the C/N ratio.
N release from organic components may occur at different rates, and there is still a lack of knowledge on the availability of the N applied with dairy slurry, which has important consequences for assessing the slurry’s fertilizing value [47].

Nitrate (NO3)

When nitrate is washed out of agricultural soil, contamination of shallow groundwater occurs first, and at a later stage, deeper groundwater. Most groundwater supplies in the EU are from deep wells and are not immediately affected by high nitrate concentrations [48].
However, in areas where water is obtained from shallow groundwater sources, there is a risk to human health with high nitrogen concentrations. When comparing dairy slurry and inorganic fertilizer, applied at the same total N rate, previous studies have shown lower N leaching losses with slurry [49,50]. Accordingly, in this study, mineral fertilizer had a significantly higher nitrate leaching potential than the treated and untreated slurries (approximately 50% N applied was lost by leaching for MN versus less than 17% N applied for the slurries) (Table 3).
It is important to mention that the incorporation of acidified slurry into the soil can affect pH-sensitive biological soil processes, including N mineralization [51,52]. According to Fangueiro et al. [53], slurry acidification might inhibit or delay the nitrification process after soil application, and such an effect relies on the soil properties, namely, its buffer capacity.
However, leachates from RA, AC, and AL were not significantly different in terms of nitrate concentration (Figure 2). Nevertheless, NE reduced the potential for nitrate leaching on the first event when compared with RA (NE 13.0 mg L−1 vs. RA 48.5 mg L−1), but in the second and third events, treatments were no longer significantly different.
In a field experiment, three different rates of fresh pig slurry (50, 100, and 150 m3 ha−1) and a mineral treatment were applied as fertilizers to soil to assess the risk of nitrate leaching in an irrigated Mediterranean ecosystem [54]. Nitrate concentrations in the soil solution at a 0.9–1.2 m depth were higher for the mineral treatment (44.7 mg NO3−_N L−1) than for the slurry treatments (19.9–28.0 mg NO3-N L−1), indicating higher susceptibility to nitrate leaching for the mineral treatment, which corroborates the results obtained in this study.
Fangueiro et al. [18] showed that the amount of NO3 leached three days after the application of raw or acidified slurry represented less than 5% of the mineral N applied and concluded that acidification did not affect the loss of N-NO3, as seen in this study.

Ammoniacal nitrogen (NH4+)

Ammonium is less prone to leaching than N-NO3 due to its binding to soil particles [55] and its fast conversion into N-NO3. In the first event, MN treatment had a significantly higher leaching potential for ammoniacal nitrogen (36.7 mg L−1) than the chemically treated and raw slurry treatments (<25.0 mg L−1). Furthermore, in the first event, AC (25.0 mg L−1) and NE (21.9 mg L−1) dairy slurries presented a higher leaching potential for NH4+ than the RA and AL dairy slurries (14.3 and 13.8 mg L−1, respectively) (Figure 2).
On the other hand, in the second event, the leaching potential of NH4+ in AC and NE treatments increased (AC 39.4 mg L−1; NE 39.5 mg L−1) compared with the first event, with NH4+ concentrations in the leachates not significantly different from the MN treatment (MN = 30.7 mg L−1) (Figure 2). It indicates that slurry acidification and neutralization treatments might delay the nitrification process, as already reported by Fangueiro et al., and increase the risk of NH4+ leaching [53].
In terms of N-NH4+ concentration in the leachates, AC and NE treatments were similar to MN treatment but showed significantly higher concentrations than in RA and AL treatments.
Previous studies [56,57] reported low concentrations of NH4+ in the leachates from slurry-amended soils, contributing marginally to N leaching. However, Fangueiro et al. reported that 17% of the NH4+ applied was lost by leaching in soil amended with acidified slurry, right in the first event [18]. This unusually high NH4+ leaching rate was attributed by the authors to the sandy texture and low cation exchange capacity of the soil. Still, these results are merely indicative of what may occur in field conditions before plant growth. Crops uptake mostly N in inorganic form during their vegetative growth period which might limit the potential leaching of NH4+ and NO3 during the growing season. Furthermore, it is known that soil characteristics affect the N form that is preferably used by plants, e.g., in acidic or low redox potential soils, plants preferably take up ammonium, whereas in calcareous, high-pH soils, plants prefer nitrate [58].

Phosphorus (P)

Phosphorus is a limiting macronutrient that is becoming scarce in soils worldwide due to the depletion of phosphate rock [59]. Application of animal slurry as an alternative organic soil fertilizer is a way to mitigate P deficiency [60,61]. However, in areas with high livestock densities, excessive slurry application rates on agricultural land, to levels far above plant requirements, could result in agronomic P surpluses and accumulation in the soil [62,63,64].
In the first event, P concentration in leachates was higher for RA and AL (RA = 14.9 mg L−1; AL = 13.6 mg L−1) than for AC (4.1 mg L−1), while P concentrations of leachates for NE (6.1 mg L−1) were not significantly different from the control (Figure 2).
The P concentration in leachates increased with the time elapsed since the fertilizer application day for all treatments because of the mineralization process. However, as shown in Figure 2, in AC treatment, the mineralization kinetics was slower, since P concentrations in the leachates collected in the first and second events (4.1 and 5.0 mg L−1, respectively) were lower and significantly different from the other fertilizer treatments and about three to four times lower than in the RA (14.9 and 14.7 mg L−1). This is in agreement with the fact that the incorporation of acidified slurry into the soil can affect pH-sensitive biological soil processes [65,66], including P mineralization [51]. Furthermore, the application of acidified slurry may have caused greater P sorption, as in non-calcareous soil, P sorption increases with decreased pH [67]. However, some studies have shown that acidification can increase the total dissolved P content of slurry [17,68], and increased solubility could imply greater P mobility in soil solution. Overall, it can be said that P leaching increases with the increase of dissolved P content of acidified slurry and decreases with higher P sorption once applied to non-calcareous soil. However, cumulative P leaching did not differ significantly between treatments, with AC showing the lowest leaching percentage (Table 3). Li et al. [69] evaluated how slurry acidification affects the speciation and vertical movement of particulate and non-particulate phosphorus in the soil after cattle slurry application. The authors verified that the particulate fraction (0.45–63 μm) represented 62% of total P content, of which 46% was labile inorganic P and 20% labile organic P. Acidification through dissolution and desorption reduced the total P content of the particulate fraction by 26%. However, overall acidification had no impact on P leaching, as observed in the present study.

Sulfur (S) and Potassium (K)

In the acidification and the alkalinization/neutralization treatments, an amount of 6.86 g and 3.43 g of S were added per kg of DS, respectively, which corresponds to 0.17 g and 0.09 g of S added per soil column. The S content of the leachates resulting from the application of AC and NE were significantly higher than in the remaining treatment with values of 39.71 and 37.15 mg L−1 in the first LE, respectively, against less than 10.28 mg L−1 in the remaining treatments (Figure 2).
The S concentration in leachates decreased over time with less than 6.44 mg L−1 in all treatments in the last event (Figure 2). The percentage of T-S lost by leaching did not differ significantly between AC and NE, but both were significantly higher than in RA (Table 3). Although S is an important element in fertilizers, excessive levels of S can impair groundwater quality. Therefore, the application rate of AC or NE slurry should be carefully assessed to ensure that the amount of S-SO42− applied corresponds to the needs of the plants and does not endanger groundwater quality.
In the alkalinization and the alkalinization/neutralization treatments (NE), 3.55 g of K were added per kg of DS, which corresponds to 0.09 g of K added per soil column. Despite the added K in AL, after the first event, K concentration in the leachates collected from the soil columns with the application of the AL slurry did not differ significantly from the RA or the control (Figure 2), and neither NE treatment differed from mineral fertilizer or the AC slurry. However, after the second and third events, K concentration in the leachates from the NE treatment was significantly higher than in the other treatments (Figure 2). The addition of sulfuric acid to decrease the pH value of the alkalinized slurry to 7.0 might have led to K solubilization. The K cumulative leaching potential of NE was significantly different from RA and AL but did not differ significantly from AC (Table 3). So far, K losses by leaching have received little attention because of their low environmental impacts.
The effect of slurry acidification on S and K dynamics was studied in a column leaching trial with different slurry application rates (15 and 45 m3 ha−1) [70]. The use of acidified slurry resulted in an increase of S and K leaching in a similar way to our results.

Other Nutrient Leaching (Na, Ca, Mg, Fe, Cu, Zn, Mn, and B)

Cations such as Na, Ca, Mg, Fe, Cu, Zn, and Mn are held on the surfaces of the negatively charged colloidal clay and organic matter in the soil as exchangeable cations. They can be replaced and are in equilibrium with cations in the soil water. The percolating soil solution that carries nutrients in the soil profile is necessarily electrically neutral; therefore, anions are leached together with equivalent amounts of anions [71].
Since adsorbed/relatively insoluble forms of the nutrients are much less mobile in the soil, their leaching potential is relatively low. The concentration of Na, Ca, Mg, Fe, Cu, Zn, Mn, and B in the leachates was assessed, and the results are presented in Table 4. The highest concentrations were observed in the leachates collected after the first event.
The same trend was observed regarding the EC values as previously mentioned in Section 3.2.1. Electrical conductivity in leachates was higher when more ions were solubilized and leached. Acidification treatment enhanced Na, Ca, and Mg leaching after the first event. This is probably due to ion exchange, involving the movement of cations (Ca, Mg, Na) through the soil. A soil with a low cation exchange capacity (CEC) is less able to hold positively charged ions.
On the other hand, Fe leaching from soil columns amended with AL slurry was delayed, probably due to the capacity of humic substances to complex with iron at a higher pH. Fe concentration in leachates collected after the first event in soil amended with RA was close to the Fe concentration in leachates collected after the second event, in soil amended with AL. Acidification treatment promoted the leaching of Mn, probably due to the formation of complexes with dissolved OM (organic matter). Little scientific literature is available on micronutrient leaching. In most soils, the cations most likely to be leached are Ca and Mg [71]. In sandy soils, considerable amounts of Mg can be leached after the application of K chloride or K sulfate fertilizers [72]. K is usually leached in smaller quantities than Ca and Mg, even when applied as fertilizer. Among the micronutrients, Mn and B are susceptible to leaching in certain soils [72]. B has the highest leaching potential and Cu has the least [73]
Haynes and Swift [74] studied the effects of soil acidification (pH 6.5–3.8) on levels of extractable nutrients and subsequent leaching and concluded that below pH 5.5, exchangeable cations were displayed from exchange sites, and Ca, Mg, K and Na in the soil solution increased markedly [74].

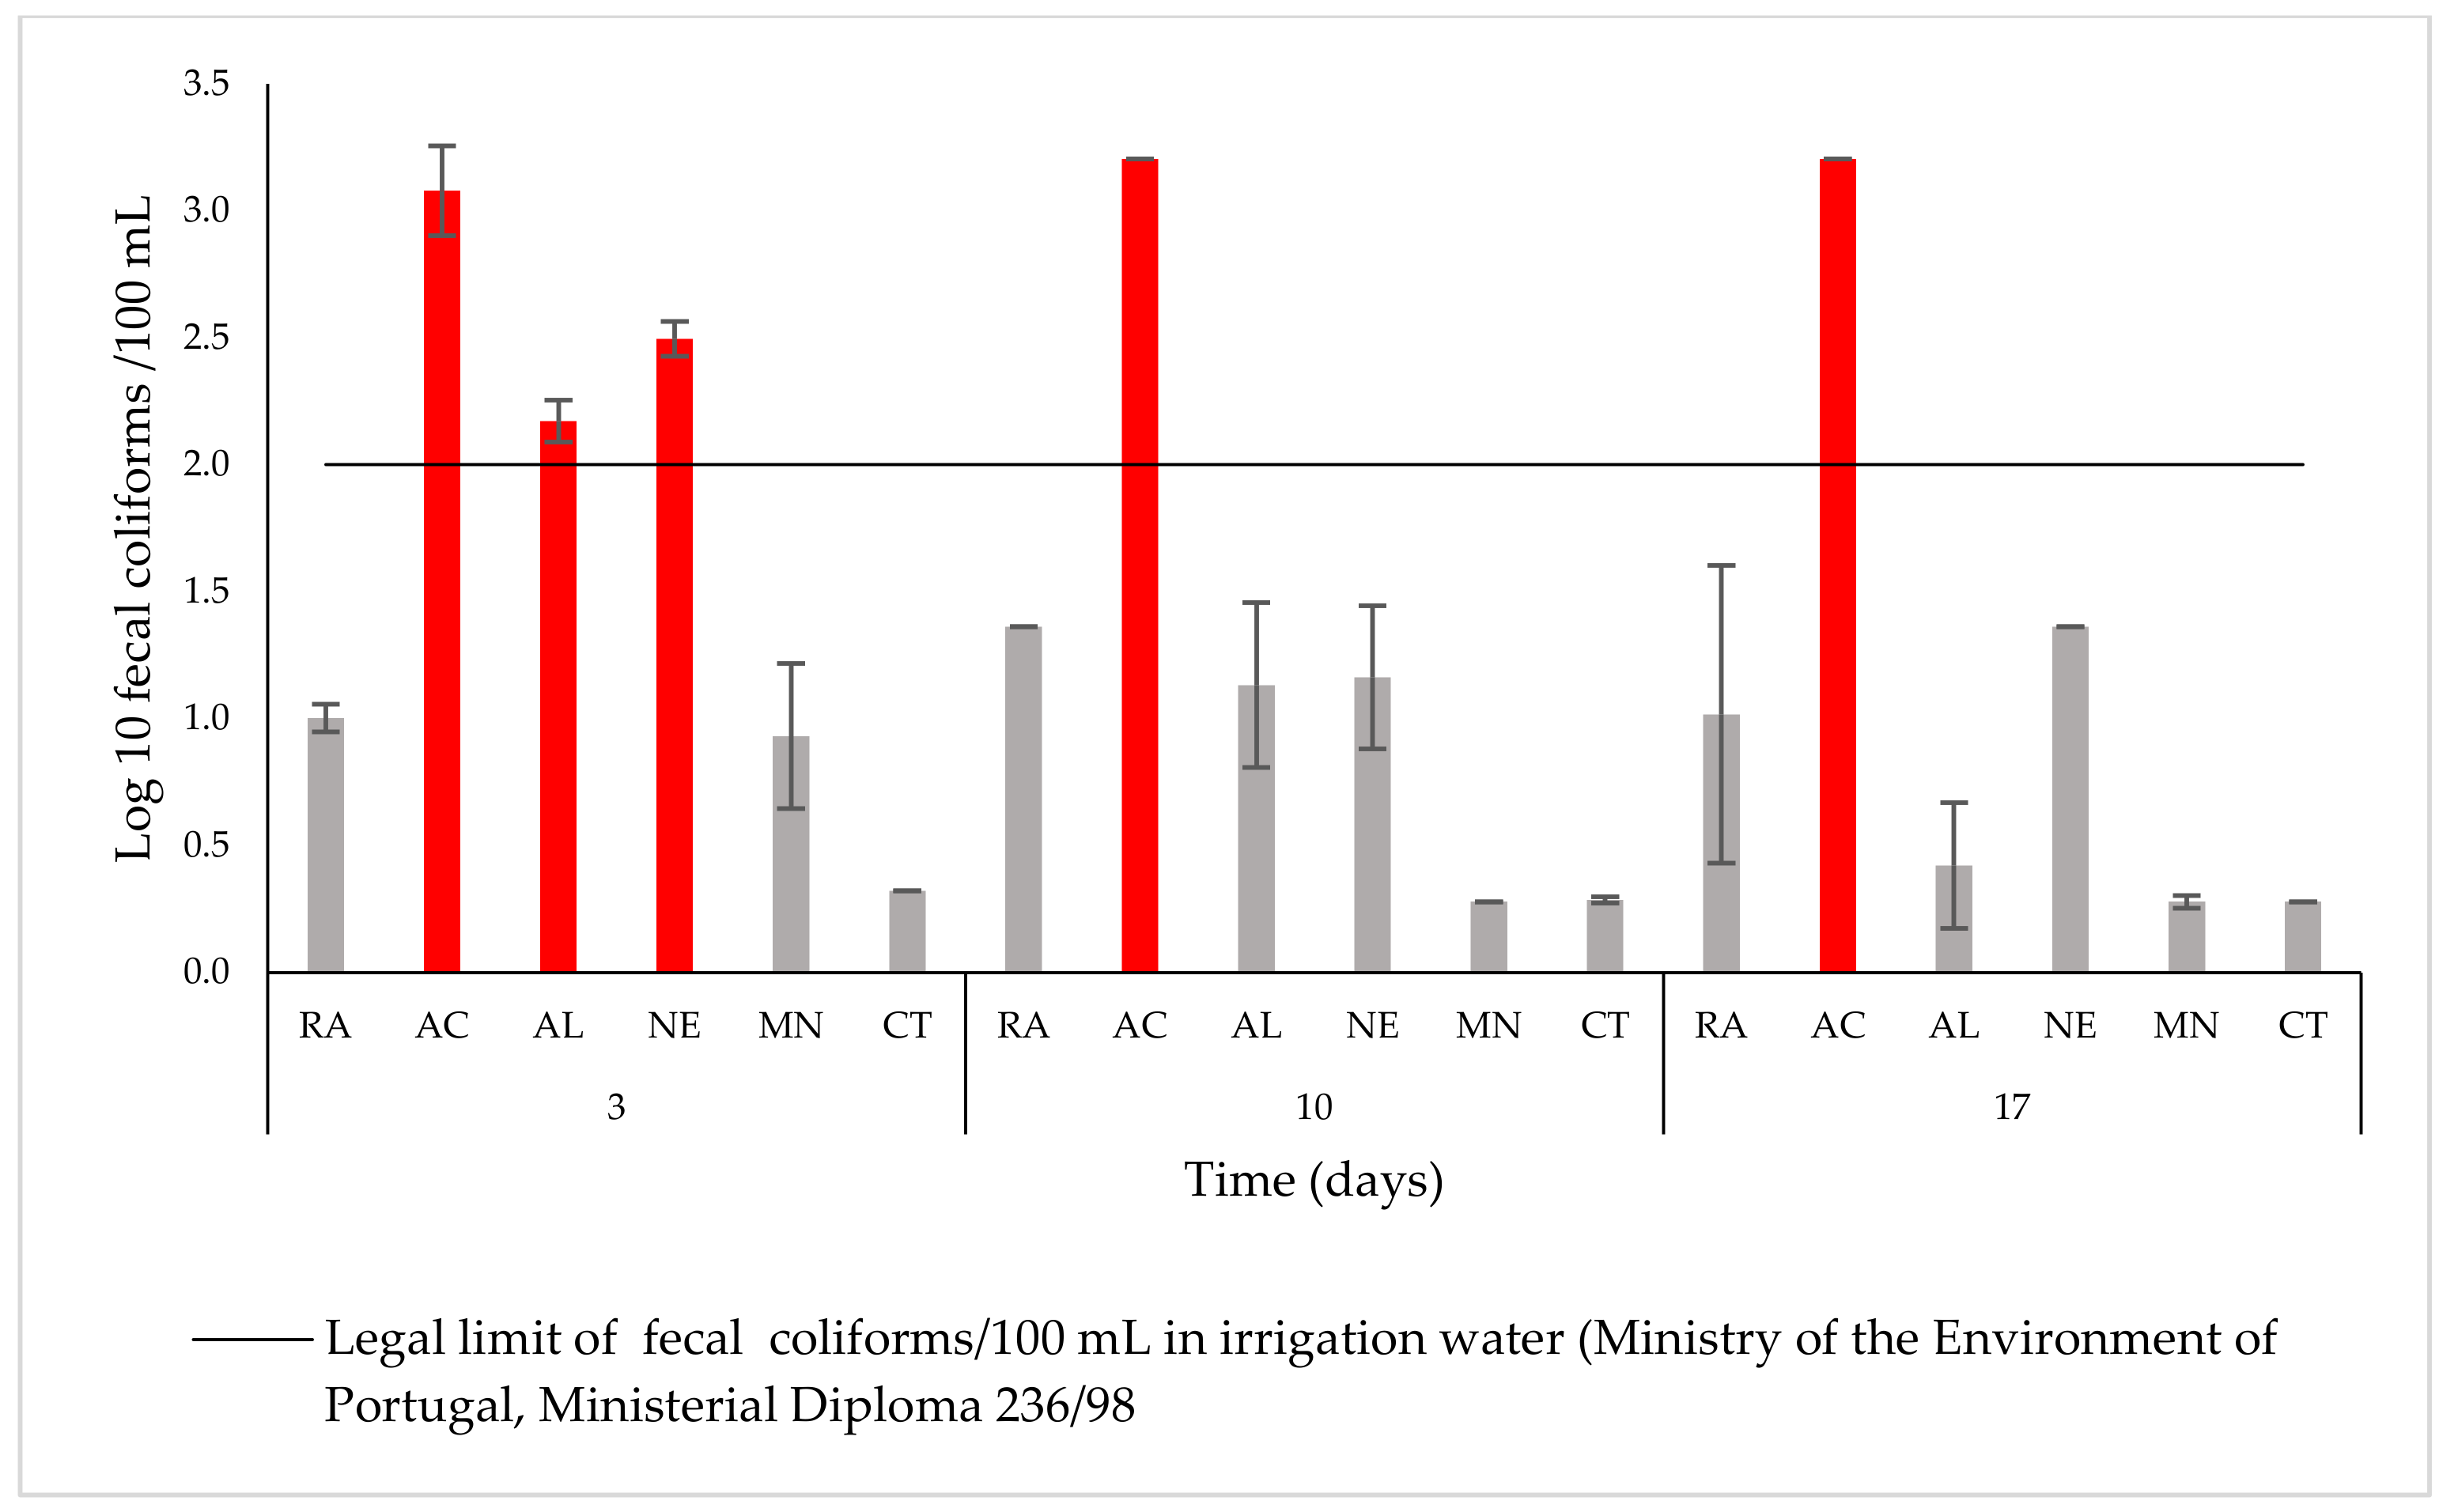
3.2.2. Coliform Leaching

In the absence of microbiological regulation for leachates, the legal framework for irrigation water (Ministry of the Environment of Portugal, Ministerial Diploma 236/98), which establishes a maximum recommended value of 100 fecal (thermotolerant) coliforms/100 mL, was used in this work to assess the microbiological quality of the leachates [75].
As seen in Figure 3, the incomplete sanitization of the slurries (E. coli > 103 CFU g−1, Table 2) resulted in the presence of fecal coliforms in the leachates above the recommended legal value. This effect was particularly noted with leachates from soil amended with acidified DS in LE1, LE2, and LE3. When the soil was amended with DS treated by AL or NE, the level of coliforms was above the legal limit in LE1, but after 7 days (in LE2 and LE3), the number of fecal coliforms was below the legal limit of 100/100 mL. In the remaining treatments (RA, MN, and CT), the leachates fulfilled the legal criteria for irrigation water in all events (Figure 3). Fangueiro et al. also observed a higher number of fecal coliforms in leachates from sandy soil amended with acidified slurry than with raw slurry [18]. Nevertheless, our results might also be due to incomplete slurry sanitization that can lead to the potential leaching of pathogens. The incomplete treatment may have eliminated part of the competing microbiota, favoring the multiplication and consequent leaching of coliforms. Indeed, the number of coliform present in the leachates rely not only on the survival rate of the pathogens after treatment by pH adjustment and after soil application but also on the movement of the pathogens in the soil column. More assays should be developed to validate these results, so that it can be possible to support decision-making and risk analysis regarding the slurry acidification strategy and to sanitize or minimize NH3 emissions.

4. Conclusions

This study showed that amendment with dairy slurry, sanitized or not, may lead to significantly lower nitrate leaching than mineral fertilizer (RA 11.0%, AC 16.1%, AL 14.2%, NE 6.0% vs. MN 50.4%). This aspect is relevant since the EU Nitrates Directive sets a limit of 170 kg N from livestock manure per ha and per year for Nitrate Vulnerable Zones. On the other hand, inorganic fertilizers, despite having a higher leaching potential of nitrate, do not face this restriction. Regarding nutrient leaching potential, the use of organic fertilizers should be combined with good agricultural practices to guarantee an efficient balance of quick/slow-release nutrients and to avoid leaching. It is also advisable to include phosphorous in the criteria of slurry management practices rather than defining application rates solely based on the crop’s N needs, which can lead to a P surplus that modifies the P dynamics and promotes leaching.
Incomplete slurry sanitization by acidification strongly promotes coliform leaching. Since the presence of coliform microorganisms in the water also indicates the potential contamination with pathogenic bacterial species, there is a greater risk of groundwater contamination. As slurry acidification is commonly used as a strategy to minimize NH3 emissions, for example, in countries like Denmark, further studies should be carried out to support decision-making and risk analysis regarding the slurry acidification strategy. It is important to address the potential impacts of manure amendment in a holistic way, considering the effects of the proposed strategies on water, air, and soil.

Supplementary Materials

The following supporting information can be downloaded at: https://www.mdpi.com/article/10.3390/agronomy13041176/s1, Table S1: Effect of fertilizer treatment (RA = Raw dairy slurry; AC = Acidified dairy slurry; AL = Alkalinized dairy slurry; NE = Neutralized dairy slurry; MN = Mineral fertilizer; CT: Control) and time after fertilizer application (3, 10, and 17 days) showed by a two-way ANOVA for volumes leached (L). Different letters in the mean volumes leached (n = 4) indicate significant differences based on the Tukey test (p < 0.05).

Author Contributions

Formal analysis, investigation, writing—original draft, J.R.; methodology, writing—review and editing, supervision, R.F.; methodology, writing—review and editing, supervision, L.B.; conceptualization, methodology, writing—review and editing, supervision, project administration, funding acquisition, D.F. All authors have read and agreed to the published version of the manuscript.

Funding

This research was funded by the Project CleanSlurry PTDC/ASP-SOL/28769/2017, “Animal slurry hygienization for use in industrial horticulture”, and by the logistic and institutional support of LEAF (Linking Landscape, Environment, Agriculture and Food Research Unit), funded by FCT (UIDB/04129/2020).

Acknowledgments

The authors thank Ana Karina Soares for support with the work performed.

Conflicts of Interest

The authors declare no conflict of interest.

References

  1. Scarlat, N.; Fahl, F.; Dallemand, J.-F.; Monforti, F.; Motola, V. A Spatial Analysis of Biogas Potential from Manure in Europe. Renew. Sustain. Energy Rev. 2018, 94, 915–930. [Google Scholar] [CrossRef]
  2. Amin, M.G.M.; Forslund, A.; Bui, X.T.; Juhler, R.K.; Petersen, S.O.; Lægdsmand, M. Persistence and Leaching Potential of Microorganisms and Mineral N in Animal Manure Applied to Intact Soil Columns. Appl. Environ. Microbiol. 2013, 79, 535–542. [Google Scholar] [CrossRef] [PubMed]
  3. Guber, A.; Pachepsky, Y.; Shelton, D.; Yu, O. Association of Fecal Coliforms with Soil Aggregates: Effect of Water Content and Bovine Manure Application. Soil Sci. 2009, 174, 543–548. [Google Scholar] [CrossRef]
  4. Mawdsley, J.L.; Bardgett, R.D.; Merry, R.J.; Pain, B.F.; Theodorou, M.K. Pathogens in Livestock Waste, Their Potential for Movement through Soil and Environmental Pollution. Appl. Soil Ecol. 1995, 2, 1–15. [Google Scholar] [CrossRef] [PubMed]
  5. Nørring, N.P.; Jørgensen, E. Eutrophication and Agriculture in Denmark: 20 Years of Experience and Prospects for the Future. In Eutrophication in Coastal Ecosystems: Towards Better Understanding and Management Strategies Selected Papers from the Second International Symposium on Research and Management of Eutrophication in Coastal Ecosystems, 20–23 June 2006, Nyborg, Denmark; Andersen, J.H., Conley, D.J., Eds.; Springer Netherlands: Dordrecht, Germany, 2009; pp. 65–70. ISBN 978-90-481-3385-7. [Google Scholar]
  6. Hess, T.F.; Grdzelishvili, I.; Sheng, H.; Hovde, C.J. Heat Inactivation of E. Coli During Manure Composting. Compost Sci. Util. 2004, 12, 314–322. [Google Scholar] [CrossRef]
  7. Manyi-Loh, C.E.; Mamphweli, S.N.; Meyer, E.L.; Makaka, G.; Simon, M.; Okoh, A.I. An Overview of the Control of Bacterial Pathogens in Cattle Manure. Int. J. Environ. Res. Public. Health 2016, 13, 843. [Google Scholar] [CrossRef]
  8. Martin, H.D. Manure Composting as a Pathogen Reduction Strategy; Ministry of Agriculture, Food and Rural Affairs: Guelph, ON, Cananda, 2005.
  9. Pell, A.N. Manure and Microbes: Public and Animal Health Problem? J. Dairy Sci. 1997, 80, 2673–2681. [Google Scholar] [CrossRef]
  10. Cools, D.; Merckx, R.; Vlassak, K.; Verhaegen, J. Survival of E. coli and Enterococcus spp. Derived from Pig Slurry in Soils of Different Texture. Appl. Soil Ecol. 2001, 17, 53–62. [Google Scholar] [CrossRef]
  11. Bradford, S.A.; Simunek, J.; Walker, S.L. Transport and Straining of E. Coli O157:H7 in Saturated Porous Media. Water Resour. Res. 2006, 42, 1–12. [Google Scholar] [CrossRef]
  12. Unc, A.; Goss, M.J. Transport of Bacteria from Manure and Protection of Water Resources. Appl. Soil Ecol. 2004, 25, 1–18. [Google Scholar] [CrossRef]
  13. Teixeira, P.; Almeida, L.; Brandão, J.; Costa, S.; Pereira, S.; Valério, E. Non-Potable Use of Lisbon Underground Water: Microbiological and Hydrochemical Data from a 4-Year Case Study. Environ. Monit. Assess. 2018, 190, 455. [Google Scholar] [CrossRef]
  14. Giglio, O.; Quaranta, A.; Barbuti, G.; Napoli, C.; Caggiano, G.; Montagna, M. Factors Influencing Groundwater Quality: Towards an Integrated Management Approach. Ann. Ig. Med. Prev. E Comunità. 2015, 27, 52–57. [Google Scholar] [CrossRef]
  15. Rodrigues, J.; Alvarenga, P.; Silva, A.C.; Brito, L.; Tavares, J.; Fangueiro, D. Animal Slurry Sanitization through pH Adjustment: Process Optimization and Impact on Slurry Characteristics. Agronomy 2021, 11, 517. [Google Scholar] [CrossRef]
  16. dos Santos, J.Q. Fertilização—Fundamentos Agroambientais da Utilização dos Adubos e Correctivos; Publindústria, Edições Técnicas: Porto, Portugal, 2015; ISBN 978-989-723-085-1. [Google Scholar]
  17. Fangueiro, D.; Hjorth, M.; Gioelli, F. Acidification of Animal Slurry—A Review. J. Environ. Manag. 2015, 149, 46–56. [Google Scholar] [CrossRef]
  18. Fangueiro, D.; Surgy, S.; Napier, V.; Menaia, J.; Vasconcelos, E.; Coutinho, J. Impact of Slurry Management Strategies on Potential Leaching of Nutrients and Pathogens in a Sandy Soil Amended with Cattle Slurry. J. Environ. Manag. 2014, 146, 198–205. [Google Scholar] [CrossRef]
  19. Lee, L.S.; Carmosini, N.; Sassman, S.A.; Dion, H.M.; Sepúlveda, M.S. Agricultural Contributions of Antimicrobials and Hormones on Soil and Water Quality. In Advances in Agronomy; Sparks, D.L., Ed.; Academic Press: Cambridge, MA, USA, 2007; Volume 93, pp. 1–68. [Google Scholar]
  20. Liu, X.-P.; Bi, Q.-F.; Qiu, L.-L.; Li, K.-J.; Yang, X.-R.; Lin, X.-Y. Increased Risk of Phosphorus and Metal Leaching from Paddy Soils after Excessive Manure Application: Insights from a Mesocosm Study. Sci. Total Environ. 2019, 666, 778–785. [Google Scholar] [CrossRef]
  21. Mantovi, P.; Fumagalli, L.; Beretta, G.P.; Guermandi, M. Nitrate Leaching through the Unsaturated Zone Following Pig Slurry Applications. J. Hydrol. 2006, 316, 195–212. [Google Scholar] [CrossRef]
  22. Toor, G.S.; Sims, J.T. Phosphorus Leaching in Soils Amended with Animal Manures Generated from Modified Diets. J. Environ. Qual. 2016, 45, 1385–1391. [Google Scholar] [CrossRef]
  23. Alegbeleye, O.O.; Sant’Ana, A.S. Manure-Borne Pathogens as an Important Source of Water Contamination: An Update on the Dynamics of Pathogen Survival/Transport as Well as Practical Risk Mitigation Strategies. Int. J. Hyg. Environ. Health 2020, 227, 113524. [Google Scholar] [CrossRef]
  24. Kalra, Y. Handbook of Reference Methods for Plant Analysis; CRC Press: Boca Raton, FL, USA, 1997; ISBN 978-1-4200-4939-8. [Google Scholar]
  25. Mulvaney, R.L. Nitrogen—Inorganic Forms. In Methods of Soil Analysis; John Wiley & Sons, Ltd.: Hoboken, NJ, USA, 1996; pp. 1123–1184. ISBN 978-0-89118-866-7. [Google Scholar]
  26. Fangueiro, D.; Pereira, J.L.S.; Fraga, I.; Surgy, S.; Vasconcelos, E.; Coutinho, J. Band Application of Acidified Slurry as an Alternative to Slurry Injection in a Mediterranean Double Cropping System: Agronomic Effect and Gaseous Emissions. Agric. Ecosyst. Environ. 2018, 267, 87–99. [Google Scholar] [CrossRef]
  27. Grigg, J.L. Prediction of Plant Response to Fertilisers by Means of Soil Tests. N. Z. J. Agric. Res. 1965, 8, 893–904. [Google Scholar] [CrossRef]
  28. Lakanen, E.; Erviö, R. A Comparison of Eight Extractants for the Determination of Plant Available Micronutrients in Soils. Acta Agric. Fenn. 1971, 123, 223–232. [Google Scholar]
  29. Plant Production and Protection Division. Guide to Laboratory Establishment for Plant Nutrient Analysis; FAO: Rome, Italy, 2008; ISBN 978-92-5-105981-4. [Google Scholar]
  30. Particle-Size Analysis—Gee—1986—SSSA Book Series—Wiley Online Library. Available online: https://acsess.onlinelibrary.wiley.com/doi/abs/10.2136/sssabookser5.1.2ed.c15 (accessed on 8 September 2021).
  31. Fangueiro, D.; Ribeiro, H.; Vasconcelos, E.; Coutinho, J.; Cabral, F. Treatment by acidification followed by solid-liquid separation affects slurry and slurry fractions composition and their potential of N mineralization. Bioresour. Technol. 2009, 100, 4914–4917. [Google Scholar] [CrossRef] [PubMed]
  32. Sáez-Plaza, P.; Navas, M.J.; Wybraniec, S.; Michałowski, T.; Asuero, A.G. An Overview of the Kjeldahl Method of Nitrogen Determination. Part II. Sample Preparation, Working Scale, Instrumental Finish, and Quality Control. Crit. Rev. Anal. Chem. 2013, 43, 224–272. [Google Scholar] [CrossRef]
  33. ISO 6579-1:2017; Microbiology of the Food Chain—Horizontal Method for the Detection, Enumeration and Serotyping of Salmonella—Part 1: Detection of Salmonella spp. [WWW Document]; ISO: Geneva, Switzerland, 2017. Available online: https://www.iso.org/cms/render/live/en/sites/isoorg/contents/data/standard/05/67/72756712.html (accessed on 25 June 2020).
  34. ISO 16649-2; ISO 16649-2; Microbiology of Food and Animal Feeding Stuffs—Horizontal Method for the Enumeration of 2-Glucoronidase-Positive Escherichia Coli—Part 2: Colony-Count Technique at 44 Degrees Using 5-Bromo-4-Chloro-3-Indolyl 2-D-Glucuronide [WWWDocument]. ISO: Geneva, Switzerland, 2015. Available online: https://infostore.saiglobal.com/en-us/Standards/GOST-ISO-16649-2-2015-551612_SAIG_GOST_GOST_1260029/ (accessed on 12 October 2020).
  35. Greenburg, A. (Ed.) Standard Methods for the Examination of Water and Wastewater, 16th ed.; American Public Health Association, American Water Works Association and Water Pollution Control Federation: Washington, DC, USA, 1985. [Google Scholar]
  36. Despacho n.o 1230/2018|DRE. Available online: https://dre.pt/dre/detalhe/despacho/1230-2018-114627305 (accessed on 19 July 2022).
  37. Van Kessel, J.S.; Reeves, J.B. On-Farm Quick Tests for Estimating Nitrogen in Dairy Manure1. J. Dairy Sci. 2000, 83, 1837–1844. [Google Scholar] [CrossRef]
  38. Martínez-Suller, L.; Provolo, G.; Brennan, D.; Howlin, T.; Carton, O.T.; Lalor, S.T.J.; Richards, K.G. A Note on the Estimation of Nutrient Value of Cattle Slurry Using Easily Determined Physical and Chemical Parameters. Ir. J. Agric. Food Res. 2010, 49, 5. [Google Scholar]
  39. Vervoort, R.W.; Radcliffe, D.E.; Cabrera, M.L.; Latimore, M. Nutrient Losses in Surface and Subsurface Flow from Pasture Applied Poultry Litter and Composted Poultry Litter. Nutr. Cycl. Agroecosyst. 1998, 50, 287–290. [Google Scholar] [CrossRef]
  40. Fangueiro, D.; Pereira, J.L.S.; Macedo, S.; Trindade, H.; Vasconcelos, E.; Coutinho, J. Surface Application of Acidified Cattle Slurry Compared to Slurry Injection: Impact on NH3, N2O, CO2 and CH4 Emissions and Crop Uptake. Geoderma 2017, 306, 160–166. [Google Scholar] [CrossRef]
  41. Cho, W.-M.; Ravindran, B.; Kim, J.K.; Jeong, K.-H.; Lee, D.J.; Choi, D.-Y. Nutrient Status and Phytotoxicity Analysis of Goat Manure Discharged from Farms in South Korea. Environ. Technol. 2017, 38, 1191–1199. [Google Scholar] [CrossRef]
  42. Zhao, J.; Zhao, J.; Pullens, J.W.M.; Sørensen, P.; Blicher-Mathiesen, G.; Olesen, J.E.; Børgesen, C.D. Agronomic and Environmental Factors Influencing the Marginal Increase in Nitrate Leaching by Adding Extra Mineral Nitrogen Fertilizer. Agric. Ecosyst. Environ. 2022, 327, 107808. [Google Scholar] [CrossRef]
  43. Zhao, J.; De Notaris, C.; Olesen, J.E. Autumn-Based Vegetation Indices for Estimating Nitrate Leaching during Autumn and Winter in Arable Cropping Systems. Agric. Ecosyst. Environ. 2020, 290, 106786. [Google Scholar] [CrossRef]
  44. Wang, Y.; Ying, H.; Yin, Y.; Zheng, H.; Cui, Z. Estimating Soil Nitrate Leaching of Nitrogen Fertilizer from Global Meta-Analysis. Sci. Total Environ. 2019, 657, 96–102. [Google Scholar] [CrossRef]
  45. Mufwanzala, N.; Dikinya, O. Impact of Poultry Manure and Its Associated Salinity on the Growth and Yield of Spinach (Spinacea Oleracea) and Carrot (Daucus Carota). Int. J. Agric. Biol. Pak. 2010, 12, 489–494. [Google Scholar]
  46. Masunga, R.H.; Uzokwe, V.N.; Mlay, P.D.; Odeh, I.; Singh, A.; Buchan, D.; De Neve, S. Nitrogen Mineralization Dynamics of Different Valuable Organic Amendments Commonly Used in Agriculture. Appl. Soil Ecol. 2016, 101, 185–193. [Google Scholar] [CrossRef]
  47. Meers, E.; Velthof, G.L.; Michels, E.; Rietra, R.P.J.J. Biorefinery of Inorganics: Recovering Mineral Nutrients from Biomass and Organic Waste; Wiley: Hoboken, NJ, USA, 2020; ISBN 978-1-118-92145-6. [Google Scholar]
  48. Eutrophication—European Environment Agency. Available online: https://www.eea.europa.eu/publications/signals-2000/page014.html (accessed on 18 March 2021).
  49. Di, H.J.; Cameron, K.C.; Moore, S.; Smith, N.P. Nitrate Leaching and Pasture Yields Following the Application of Dairy Shed Effluent or Ammonium Fertilizer under Spray or Flood Irrigation: Results of a Lysimeter Study. Soil Use Manag. 1998, 14, 209–214. [Google Scholar] [CrossRef]
  50. Salazar, F.; Martínez-Lagos, J.; Alfaro, M.; Misselbrook, T. Low Nitrogen Leaching Losses Following a High Rate of Dairy Slurry and Urea Application to Pasture on a Volcanic Soil in Southern Chile. Agric. Ecosyst. Environ. 2012, 160, 23–28. [Google Scholar] [CrossRef]
  51. Fangueiro, D.; Gusmão, M.; Grilo, J.; Porfírio, G.; Vasconcelos, E.; Cabral, F. Proportion, Composition and Potential N Mineralisation of Particle Size Fractions Obtained by Mechanical Separation of Animal Slurry. Biosyst. Eng. 2010, 106, 333–337. [Google Scholar] [CrossRef]
  52. Roboredo, M.; Fangueiro, D.; Lage, S.; Coutinho, J. Phosphorus Dynamics in Soils Amended with Acidified Pig Slurry and Derived Solid Fraction. Geoderma 2012, 189–190, 328–333. [Google Scholar] [CrossRef]
  53. Fangueiro, D.; Surgy, S.; Fraga, I.; Monteiro, F.G.; Cabral, F.; Coutinho, J. Acidification of Animal Slurry Affects the Nitrogen Dynamics after Soil Application. Geoderma 2016, 281, 30–38. [Google Scholar] [CrossRef]
  54. Daudén, A.; Quílez, D. Pig Slurry versus Mineral Fertilization on Corn Yield and Nitrate Leaching in a Mediterranean Irrigated Environment. Eur. J. Agron. 2004, 21, 7–19. [Google Scholar] [CrossRef]
  55. Eriksen, J.; Hermansen, J.E.; Strudsholm, K.; Kristensen, K. Potential Loss of Nutrients from Different Rearing Strategies for Fattening Pigs on Pasture. Soil Use Manag. 2006, 22, 256–266. [Google Scholar] [CrossRef]
  56. O’ Flynn, C.J.; Healy, M.G.; Lanigan, G.J.; Troy, S.M.; Somers, C.; Fenton, O. Impact of Chemically Amended Pig Slurry on Greenhouse Gas Emissions, Soil Properties and Leachate. J. Environ. Manag. 2013, 128, 690–698. [Google Scholar] [CrossRef] [PubMed]
  57. Svoboda, N.; Taube, F.; Wienforth, B.; Kluß, C.; Kage, H.; Herrmann, A. Nitrogen Leaching Losses after Biogas Residue Application to Maize. Soil Tillage Res. 2013, 130, 69–80. [Google Scholar] [CrossRef]
  58. Husson, O. Redox Potential (Eh) and PH as Drivers of Soil/Plant/Microorganism Systems: A Transdisciplinary Overview Pointing to Integrative Opportunities for Agronomy. Plant Soil 2013, 362, 389–417. [Google Scholar] [CrossRef]
  59. Cordell, D.; Neset, T.-S.S. Phosphorus Vulnerability: A Qualitative Framework for Assessing the Vulnerability of National and Regional Food Systems to the Multi-Dimensional Stressors of Phosphorus Scarcity. Glob. Environ. Chang. 2014, 24, 108–122. [Google Scholar] [CrossRef]
  60. Chadwick, D.; Wei, J.; Yan’an, T.; Guanghui, Y.; Qirong, S.; Qing, C. Improving Manure Nutrient Management towards Sustainable Agricultural Intensification in China. Agric. Ecosyst. Environ. 2015, 209, 34–46. [Google Scholar] [CrossRef]
  61. Elser, J.; Bennett, E. A Broken Biogeochemical Cycle. Nature 2011, 478, 29–31. [Google Scholar] [CrossRef]
  62. MacDonald, G.K.; Bennett, E.M.; Potter, P.A.; Ramankutty, N. Agronomic Phosphorus Imbalances across the World’s Croplands. Proc. Natl. Acad. Sci. USA 2011, 108, 3086–3091. [Google Scholar] [CrossRef]
  63. Hooda, P.S.; Truesdale, V.W.; Edwards, A.C.; Withers, P.J.A.; Aitken, M.N.; Miller, A.; Rendell, A.R. Manuring and Fertilization Effects on Phosphorus Accumulation in Soils and Potential Environmental Implications. Adv. Environ. Res. 2001, 5, 13–21. [Google Scholar] [CrossRef]
  64. Leytem, A.B.; Smith, D.R.; Applegate, T.J.; Thacker, P.A. The Influence of Manure Phytic Acid on Phosphorus Solubility in Calcareous Soils. Soil Sci. Soc. Am. J. 2006, 70, 1629–1638. [Google Scholar] [CrossRef]
  65. Eriksen, J.; Sørensen, P.; Elsgaard, L. The Fate of Sulfate in Acidified Pig Slurry during Storage and Following Application to Cropped Soil. J. Environ. Qual. 2008, 37, 280–286. [Google Scholar] [CrossRef]
  66. Schils, R.L.M.; van der Meer, H.G.; Wouters, A.P.; Geurink, J.H.; Sikkema, K. Nitrogen Utilization from Diluted and Undiluted Nitric Acid Treated Cattle Slurry Following Surface Application to Grassland. Nutr. Cycl. Agroecosystems 1999, 53, 269–280. [Google Scholar] [CrossRef]
  67. Gustafsson, J.P.; Mwamila, L.B.; Kergoat, K. The PH Dependence of Phosphate Sorption and Desorption in Swedish Agricultural Soils. Geoderma 2012, 189–190, 304–311. [Google Scholar] [CrossRef]
  68. Güngör, K.; Jürgensen, A.; Karthikeyan, K.G. Determination of Phosphorus Speciation in Dairy Manure Using XRD and XANES Spectroscopy. J. Environ. Qual. 2007, 36, 1856–1863. [Google Scholar] [CrossRef]
  69. Li, Y.; Jones, D.L.; Chen, Q.; Chadwick, D.R. Slurry Acidification and Anaerobic Digestion Affects the Speciation and Vertical Movement of Particulate and Nanoparticulate Phosphorus in Soil after Cattle Slurry Application. Soil Tillage Res. 2019, 189, 199–206. [Google Scholar] [CrossRef]
  70. Loide, V.; Saue, T.; Võsa, T.; Tamm, K. The Effect of Acidified Slurry on Crop Uptake and Leaching of Nutrients from a Loamy Topsoil. Acta Agric. Scand. Sect. B Soil Plant Sci. 2020, 70, 31–38. [Google Scholar] [CrossRef]
  71. Lehmann, J.; Schroth, G. Nutrient Leaching. In Trees, Crops and Soil Fertility: Concepts and Research Methods; Schroth, G., Sinclair, F.L., Eds.; CABI: Wallingford, UK, 2002; pp. 151–166. ISBN 978-0-85199-593-9. [Google Scholar]
  72. Havlin, J. (Ed.) Soil Fertility and Fertilizers: An Introduction to Nutrient Management, 6th ed.; Prentice Hall: Upper Saddle River, NJ, USA, 1999; ISBN 978-0-13-626806-2. [Google Scholar]
  73. Thakur, P.; Kumar, P. Leaching Losses of Micronutrient: A Review. Biol. Forum–Int. J. 2020, 9, 13–21. [Google Scholar]
  74. Haynes, R.J.; Swift, R.S. Effects of soil acidification and subsequent leaching on levels of extractable nutrients in a soil. Plant Soil 1986, 95, 327–336. [Google Scholar] [CrossRef]
  75. Decree-Law Nº 236/98 Establishing Quality Standards, Criteria and Objectives in Order to Protect the Aquatic Environment and Improve the Quality of Water According to Its Main Uses. Available online: https://faolex.fao.org/docs/pdf/por24403.pdf (accessed on 25 March 2023).
Figure 1. Effect of fertilizer treatment (RA = Raw dairy slurry; AC = Acidified dairy slurry; AL = Alkalinized dairy slurry; NE = Neutralized dairy slurry; MN = Mineral fertilizer; CT: Control) and time after fertilizer application (3, 10, and 17 days) on the EC (a) and pH (b) values measured in leachates. Two-way ANOVA indicated a positive interaction of both parameters. Mean values (n = 4) with different letters indicate significant differences based on the Tukey test (p < 0.05). Error bars represent standard errors of 4 replicates.
Agronomy 13 01176 g001
Figure 2. Effect of fertilizer treatment (RA = Raw dairy slurry; AC = Acidified dairy slurry; AL = Alkalinized dairy slurry; NE = Neutralized dairy slurry; MN = Mineral fertilizer; CT: Control) and time after fertilizer application (3, 10, and 17 days) on the [NH4+-N] (mg L−1) (a), [NO3-N] (mg L−1) (b), [S] (mg L−1) (c), [P] (mg L−1) (d), and [K] (mg L−1) (e) values in leachates. Two-way ANOVA indicated a positive interaction of both parameters. Mean values (n = 4) with different letters indicate significant differences based on the Tukey test (p < 0.05). Error bars represent standard errors of 4 replicates.
Agronomy 13 01176 g002
Figure 3. Log 10 of fecal coliforms per 100 mL of leachate collected after the first, second, and third IEs (corresponding to t = 3 d, t = 10 d, and t = 17 d after fertilizer application, respectively) for each treatment considered (RA = Raw dairy slurry; AC = Acidified dairy slurry; AL = Alkalinized dairy slurry; NE = Neutralized dairy slurry; MN = Mineral fertilizer; CT: Control) (mean values, n = 3).
Agronomy 13 01176 g003
Table 1. Physicochemical characterization of the soil used in the leaching tests (mean value, n = 3).
Parameter Mean Value and
Standard Error
(n = 3)
Soil nutrients
(mg kg−1)
TN914.5 ± 11.4
NH4+7.5 ± 0.7
NO343.4 ± 3.8
Extractable P43.4 ± 0.0
Extractable K336.1 ± 0.0
Available Fe3851.7 ± 1252.1
Available Cu26.8 ± 6.3
Available Zn23.5 ± 3.7
Available Mn29.5 ± 3.1
Exchangeable
cations
Ca419.1 ± 20.9
Mg161.7 ± 7.0
Na59.3 ± 17.4
Particle Size
Distribution
(%)
Coarse sand71.9
Fine sand20.3
Silt4.5
Clay3.3
pHKCl5.0 ± 0.0
H2O5.7 ± 0.1
EC (µS cm−1) 74.6 ± 3.6
OM (%) 1.5 ± 0.1
Table 2. Physicochemical and microbiological parameters of raw and treated dairy slurries used in the leaching test (Mean values, n = 3).
Slurry Sample IDRAACALNE
Physicochemical
parameters
pH 7.51 ± 0.035.13 ± 0.089.0 ± 0.017.11 ± 0.1
EC(mS cm−1)14.99 ± 0.3217.13 ± 0.6317.63 ± 0.4119.16 ± 0.61
DM(g kg−1)88.13 ± 4.3983.72 ± 0.6288.18 ± 2.3595.83 ± 3.19
OM(g kg−1) [DM]678.07 ± 4.69798.88 ± 147.86670.9 ± 25.41619.08 ± 6.39
N-NH4+(g kg−1)1.44 ± 0.031.38 ± 0.041.11 ± 0.021.25 ± 0.01
TN3.59 ± 0.163.53 ± 0.043.26 ± 0.023.40 ± 0.01
P0.60 ± 0.030.49 ± 0.040.55 ± 0.020.57 ± 0.01
K2.66 ± 0.162.08 ± 0.114.61 ± 0.234.70 ± 0.13
Na1.44 ± 0.101.12 ± 0.051.47 ± 0.061.53 ± 0.05
Mg0.57 ± 0.040.52 ± 0.120.54 ± 0.010.54 ± 0.01
Ca1.31 ± 0.091.14 ± 0.11.30 ± 0.011.26 ± 0.02
S0.36 ± 0.023.04 ± 0.240.36 ± 0.013.21 ± 0.12
Cu(mg kg−1)3.27 ± 0.272.95 ± 0.272.95 ± 0.072.89 ± 0.11
Zn20.19 ± 1.3017.96 ± 1.618.70 ± 0.2518.32 ± 0.4
Fe180.86 ± 14.04193.52 ± 53.74165.80 ± 6.15174.04 ± 24.5
Mn24.36 ± 1.5621.04 ± 1.6722.71 ± 0.1622.27 ± 0.3
B2.67 ± 0.192.90 ± 0.72.48 ± 0.12.45 ± 0.08
Microbiological
parameters
E. coliCFU g−11.56 × 1041.62 × 1031.40 × 1033.23 × 103
Salmonella Not detected in 25 g
Note: RA = Raw dairy slurry; AC = Acidified dairy slurry; AL = Alkalinized dairy slurry; NE = Neutralized dairy slurry.
Table 3. Amount of N-NO3, N-NH4+, T-P, T-K and T-S lost by leaching over the three IEs in the treatments considered (RA = Raw dairy slurry; AC = Acidified dairy slurry; AL = Alkalinized dairy slurry; NE = Neutralized dairy slurry; MN = Mineral fertilizer), expressed as a percentage of the amount applied (means, n = 4). For each nutrient, values followed by different letters are significantly different based on the Tukey test (p < 0.05).
NutrientUnitsRAACALNEMN
N-NO3% of N applied11.04 ± 2.92 bc16.06 ± 3.26 b14.17 ± 0.33 bc5.98 ± 3.26 c50.34 ± 7.65 a
N-NH4+2.59 ± 0.25 b16.75 ± 1.37 c7.40 ± 1.17 a16.58 ± 2.20 c19.68 ± 3.37 c
T-P% of T-P applied29.53 ± 19.63 a18.01 ± 9.78 a33.37 ± 22.02 a23.15 ± 13.80 a-
T-K% of T-K applied5.38 ± 6.97 b13.63 ± 1.91 ab5.38 ± 6.97 b24.22 ± 2.78 a-
T-S% of T-S applied69.43 ± 8.59 c87.16 ± 2.88 ab92.42 ± 7.12 a78.45 ± 5.65 bc-
Table 4. Concentration (mg L−1) of Na, Ca, Mg, Fe, Cu, Zn, Mn and B in the leachates collected after the three IEs (corresponding to t = 3 d, t = 10 d, and t = 17 d after fertilizer application, respectively) for each treatment considered (RA = Raw dairy slurry; AC = Acidified dairy slurry; AL = Alkalinized dairy slurry; NE = Neutralized dairy slurry; MN = Mineral fertilizer; CT: Control) (mean value, n = 3). Different letters indicate significant differences based on the Tukey test (p < 0.05).
Leachate
Sample ID
Time after Fertilizer
Application (d)
NaCaMgFeCuZnMnB
mg L−1
RA349.22 ± 2.44 b108.88 ± 18.72 c22.19 ± 4.69 bc5.74 ± 2.05 a0.25 ± 0.0 def0.19 ± 0.0 def3.51 ± 0.57 bc0.065 ± 0.010 ab
1032.63 ± 3.15 de58.78 ± 3.97 de12.25 ± 0.79 def2.91 ± 0.71 abcde0.94 ± 0.34 ab0.37 ± 0.07 abc2.15 ± 0.50 cd0.027 ± 0.004 f
1726.39 ± 3.86 ef19.16 ± 2.19 gh3.61 ± 0.53 g2.45 ± 0.45 bcde0.71 ± 0.18 bcd0.26 ± 0.05 cde0.41 ± 0.22 def0.040 ± 0.005 cdef
AC368.91 ± 4.42 a199.20 ± 22.92 a41.22 ± 5.35 a3.48 ± 1.44 abc0.17 ± 0.03 ef0.46 ± 0.13 a8.25 ± 1.72 a0.056 ± 0.004 abcd
1049.91 ± 5.54 b81.67 ± 10.27 d19.15 ± 4.94 cd2.40 ± 0.71 bcde0.41 ± 0.11 cdef0.43 ± 0.07 a4.26 ± 1.15 b0.062 ± 0.009 ab
1717.45 ± 1.63 gh15.60 ± 3.05 h3.39 ± 0.70 g2.18 ± 0.30 bcde0.65 ± 0.12 bcde0.26 ± 0.05 cde0.52 ± 0.27 def0.066 ± 0.006 a
AL350.45 ± 1.97 b111.39 ± 11.82 c22.87 ± 2.70 bc2.43 ± 1.47 bcde0.24 ± 0.02 def0.13 ± 0.03 defg3.62 ± 0.44 bc0.048 ± 0.004 abcde
1035.64 ± 3.92 cd44.09 ± 8.47 efg8.94 ± 2.00 efg5.93 ± 2.68 a1.25 ± 0.56 a0.40 ± 0.07 ab2.00 ± 0.44 cde0.032 ± 0.002 ef
1723.60 ± 2.75 fg20.09 ± 1.33 gh3.88 ± 0.48 g3.33 ± 0.83 abcd0.84 ± 0.22 abc0.27 ± 0.04 bcd0.48 ± 0.18 def0.038 ± 0.003 def
NE362.19 ± 4.80 a150.75 ± 13.20 b26.54 ± 6.16 b1.57 ± 0.24 cde0.21 ± 0.05 ef0.12 ± 0.07 fg3.93 ± 1.50 b0.048 ± 0.004 abcde
1049.92 ± 5.20 b75.62 ± 4.29 d15.96 ± 1.70 cde4.78 ± 2.10 ab0.69 ± 0.02 bcd0.12 ± 0.04 efg2.87 ± 0.49 bc0.026 ± 0.012 f
1731.78 ± 3.11 def30.39 ± 2.25 fgh4.57 ± 1.05 g2.55 ± 1.74 bcde0.59 ± 0.28 bcdef0.16 ± 0.06 defg0.28 ± 0.19 ef0.057 ± 0.015 abc
MN343.50 ± 1.50 bc140.71 ± 16.17 b20.32 ± 1.99 bc0.65 ± 0.18 cde0.18 ± 0.02 ef0.03 ± 0.02 g2.07 ± 0.55 cd0.047 ± 0.004 bcde
1011.69 ± 0.96 hi30.94 ± 2.97 fgh4.61 ± 0.56 g0.66 ± 0.16 cde0.40 ± 0.03 cdef0.09 ± 0.01 fg0.25 ± 0.07 ef0.032 ± 0.002 ef
175.99 ± 0.82 i28.58 ± 2.36 fgh3.89 ± 0.28 g0.25 ± 0.03 e0.23 ± 0.04 def0.07 ± 0.01 fg0.18 ± 0.14 f0.061 ± 0.002 ab
CT333.85 ± 1.55 de49.19 ± 1.54 ef7.62 ± 0.35 fg0.61 ± 0.16 cde0.21 ± 0.02 ef0.07 ± 0.01 fg0.66 ± 0.05 def0.047 ± 0.002 bcde
1015.23 ± 1.35 h27.99 ± 2.7 fgh4.66 ± 0.53 g0.41 ± 0.17 de0.18 ± 0.01 ef0.05 ± 0.01 g0.26 ± 0.08 ef0.032 ± 0.001 ef
179.28 ± 1.84 hi20.19 ± 1.62 gh3.05 ± 0.32 g0.23 ± 0.10 e0.12 ± 0.02 f0.04 ± 0.01 g0.13 ± 0.01 f0.057 ± 0.009 abc
Disclaimer/Publisher’s Note: The statements, opinions and data contained in all publications are solely those of the individual author(s) and contributor(s) and not of MDPI and/or the editor(s). MDPI and/or the editor(s) disclaim responsibility for any injury to people or property resulting from any ideas, methods, instructions or products referred to in the content.

