Article

Diversity in Coffea arabica Cultivars in the Mountains of Gorongosa National Park, Mozambique, Regarding Bean and Leaf Nutrient Accumulation and Physical Fruit Traits

by
Niquisse J. Alberto
1,
José C. Ramalho
2,3,*,
Ana I. Ribeiro-Barros
2,3,
Alexandre P. Viana
4,
Cesar A. Krohling
5,
Sional S. Moiane
6,
Zito Alberto
6,
Weverton P. Rodrigues
7 and
Fábio L. Partelli
8,*
1
Breeding Program, Federal University of Espírito Santo, S/N Guararema, Alegre, Vitoria 29375-000, ES, Brazil
2
Plant Stress & Biodiversity Lab, Forest Research Center (CEF) and Associate Laboratory TERRA, Instituto Superior de Agronomia (ISA), Lisboa University (ULisboa), Quinta do Marquês, Av. República, 2784-505 Oeiras, Portugal
3
Geobiociences, Geoengeneering and Geotechnologies Unit (GeoBioTec), Faculty of Science and Technology (FCT), New University of Lisboa (UNL), Monte de Caparica, 2829-516 Caparica, Portugal
4
Laboratory of Plant Breeding, Center of Agricultural Science and Technology, Darcy Ribeiro State University of Northern Rio de Janeiro, Av. Alberto Lamego, 2000, Campos dos Goytacazes 28013-602, RJ, Brazil
5
Espírito Santo Research Institute, Technical Assistance and Rural Extension (Incaper), Vitória 29052-010, ES, Brazil
6
Gorongosa National Park, Goinha 2112, Mozambique
7
Center of Agricultural, Natural and Literary Sciences, State University of the Region of Tocantina do Maranhão (UEMASUL), Brejo do Pinto Ave., Estreito 65975-000, MA, Brazil
8
Department of Agrarian and Biological Sciences (DCAB), Center of Northern Espírito Santo (CEUNES), Federal University of Espírito Santo (UFES), Rod. BR 101 Norte, Km 60, Bairro Litorâneo, São Mateus 29932-540, ES, Brazil
*
Authors to whom correspondence should be addressed.
Agronomy 2023, 13(4), 1162; https://doi.org/10.3390/agronomy13041162
Submission received: 27 February 2023 / Revised: 12 April 2023 / Accepted: 17 April 2023 / Published: 19 April 2023
(This article belongs to the Special Issue Coffee—from Plant to Cup)

Abstract

:
Genetic characteristics and their interaction with environmental conditions, including nutritional management, determine coffee productivity and quality. The objective of this study was to evaluate fruit traits and nutrient accumulation in the fruit, husk, and bean, as well as in the leaves of different Coffea arabica cultivars cropped in the Gorongosa National Park, Mozambique. The experiment evaluated nine coffee cultivars in a randomized block design, with four replicates. Fruit and leaf samples were collected over two months (June and July 2021), in the fruit maturation phase, oven-dried and analyzed, namely, through a clustering unweighted pair group method with arithmetic mean (UPGMA). The characterization of ripe and dried coffee bean indicated differences in the performance of the cultivars. The accumulation of the macronutrients N, K, and Ca and micronutrients Fe, Mn, and B was highest in the bean, husk, fruit, and leaves of the evaluated cultivars. Nutrient concentrations and accumulation in the different evaluated organs have a direct influence on the nutritional crop management. This is crucial for a nutritional diagnosis that ensures high yields, but such mineral levels are also a result of the existing genetic diversity among cultivars, which must be taken into account for management and breeding purposes.

1. Introduction

Coffee is socially and economically one of the most highly valued products in the world, representing an important source of revenue and employment in several tropical countries [1]. Coffee is native to Africa and belongs to the Rubiaceae family, with approximately 660 genera and, to date, 130 species [2]. Of these, C. arabica L. (Arabica coffee) and C. canephora Pierre ex A. Froehner (Conilon and Robusta coffee) dominate the international market. In 2021, ca. 10.2 million tons of coffee was harvested globally, of which ca. 59% was from C. arabica L. and 41% from C. canephora Pierre ex A. Froehner [1]. Brazil and Vietnam are the largest coffee producers, but the African continent has more than 10 coffee-producing countries, with Ethiopia ranking first, followed by Uganda, Ivory Coast, Tanzania, Kenya, and Angola, with Mozambique on the way to becoming a promising new frontier in the coffee sector.
Mozambique is a large country with a high regional diversity of soil climatic conditions. The country produces coffee of the species C. arabica, C. canephora (Café Conilon), C. zanguebariae, and C. racemosa (locally known as Inhambane coffee), of which the latter two are considered native [3,4,5,6]. This makes necessary the development of high-yielding and well-adapted genotypes for each region, as well as demand studies on the genetic diversity of cultivars. Only then will it be possible to accurately recommend the use of region-specific, superior, and divergent cultivars with region-specific adaptation. In the mountainous region of the Gorongosa National Park (GNP), Sofala province, the cultivation of C. arabica was only recently initiated. Nevertheless, the activity has already become socially and economically relevant with regard to employment, resources, and foreign exchange income. Additionally, this coffee is cultivated in agroforestry system (AFS) management with native trees, contributing to rainforest reforestation, essential for the life quality of local communities [7].
While other coffee species are diploid, Coffea arabica is tetraploid and has four basic chromosome sets (n = 11), i.e., with a total of 44 chromosomes. This resulted from a recent evolutionary whole-genome duplication between C. canephora (Robusta) and C. eugenioides on the Central Ethiopia plateau [8,9]. The breeding system of C. arabica is classified as autogamous, with the wind and insect-mediated pollination of ovules occurring with pollen from the same plant, with an auto fecundation up to 90% of the flowers [10].
The physical and chemical attributes of fruit and bean, with potential implications for quality, were then examined. These included color, size, special flavor, phenolic content, soluble solids, chlorogenic, caffeic and p-coumaric acids, caffeine, trigonelline, lipids, and minerals. Most of these parameters were mainly affected by temperature (although without a strong negative impact on bean quality), and only marginally, if at all, by elevated [CO2] [7,11,12,13].
The high cost of coffee cultivation under adequate soil and climate conditions is mainly due to crop management, primary processing, and pest and disease control [14]. Coffee farming has been modernized with significant technological advances in recent years, which have resulted in annual yield increases and cost savings, due to the monitoring and control of storage, organization, and agricultural activities [15]. Yet the ongoing climate changes and global warming are believed to already affect the current plantations with additional external constraints, mainly associated with supra-optimal temperatures and reduced water availability, mostly caused by reduced rainfall amounts and changes in their distribution pattern along the year [14]. To obtain segregating populations of Coffea species, the narrow genetic variation and low recombination capacity due to repeated self-fecundation processes represent major limitations [16,17,18]. On the other hand, due to the positive effect of elevated air CO2 (usually associated with global warming) on plant C-metabolism, and the use of elite coffee cultivars that exhibit greater environmental resilience, the extent of the negative environmental impacts associated with climate changes might be less dramatic than previously estimated in the context of climate change and global warming [19,20].
The nutritional status of plants can be determined by the nutrient content in plant tissues, so that the physiologically active organs of bean, husk, and leaf are used for nutritional diagnosis. The correct interpretation of nutritional analysis is key to defining the adequate nutrient amounts to supply the crop, reduce input waste, improve the nutritional balance of the plants, and, consequently, to increase productivity [21,22,23]. The nutritional status of a crop is strongly influenced by the species and varieties, management practices, altitude, and maturity level, among others [24]. Additionally, mineral uptake by coffee trees also varies within a plant according to location, time of year, age, organs and tissues [25], and throughout the maturation cycle [25,26,27], and might be also impacted by environmental conditions, namely, of high temperature [20]. Moreover, under conditions causing stomatal closure (water stress, low temperatures), the transpiration flow will be reduced and, consequently, nutrient translocation from the roots to the upper parts of the plant will be reduced as well [28]. However, the uptake efficiency of some nutrients is also genetically defined [29]. Several studies have pinpointed differences in the nutritional concentrations between C. arabica genotypes under the same management conditions [30,31]. This fact is due to the wide intra- and inter-specific extent of variability between C. arabica genotypes, especially in relation to characteristics such as growth, maturation cycle, nutrient accumulation, and stress tolerance [32]. Thus, this diversity can be exploited for the identification of genotypes better adapted to the range of edaphoclimatic conditions of the producing regions [30].
The objective of this study was to evaluate the fruit traits and nutrient accumulation in the bean, husk, fruit, and leaves of different Coffea arabica cultivars in the mountains of Gorongosa National Park, Mozambique.

2. Materials and Methods

2.1. Brief Characterization of Plant Material, Experimental Design, and Plant Area

The trial was conducted in the Gorongosa Mountains, in the Gorongosa National Park (GNP), one of the main conservation and reforestation areas of Mozambique, in the district Gorongosa, Sofala province, central Mozambique (longitude 34°04′05″ E, latitudes −18°4799″ to −18°48′05″ S; mean altitude 961 m asl). According to Köppen–Geiger, the mean annual temperature of the region is 29 °C, the mean annual rainfall is 1697 mm, and the climate is tropical savanna (Aw) and subtropical dry winter (Cw). The local soil was studied and the texture classified as clayey with wavy relief, based on the texture triangle [33]. The soil’s chemical and physical properties are listed in Table 1.
The nine C. arabica cultivars were sown in November 2018 (Table 2), arranged in a randomized complete block design with four replications, where the treatments corresponded to the different cultivars. The crop was grown in full sun at a spacing of 2 m between rows and 1.5 m between plants (2 × 1.5), with 3 m2 per plant, equivalent to 3333 plants per hectare. The crop treatments consisted of hand weeding only, without the application of fertilizers, insecticides, or fungicides, in respect of the conservation status of the experimental area.

2.2. Fruit and Leaf Collection

When the plants were approximately 32 months old, samples were collected between June and July 2021. Per plot, 200 g fruit (relative fresh weight (RFW), i.e., 800 g per treatment/cultivar) was packed into paper bags. The material was dried in a convection oven at 65 °C. Subsequently, the fruits were then manually depulped and 100 g samples of bean per plot were prepared. All dry samples were evaluated at a moisture content of 11% (11%MC). The evaluations included the percentage of bean in the fruit (%B), husk percentage in the fruit (%S), dry weight per bean 11%MC (DBW), ripe fruit weight (RFW), dry fruit weight 11%MC (DFW), ratio of ripe fruit weight/dry fruit weight (RFW/DFW), ratio of ripe fruit weight/dry bean weight (RFW/DBW), ripe fruit weight/ton of bean 11%MC, ripe fruit weight/60 kg bag, and dry coffee weight/ton of 11%MC.
Leaf samples (15 leaves per plot) were collected, i.e., a total of 60 leaves per treatment (cultivar), taken between rows from either side of the plants, in the middle third of the plants exposed to the sun, consisting of the third or fourth pair of leaves from the apex of the plagiotropic branches. The material was placed in paper bags and dried to constant weight at 65 °C in a convection oven for approximately 72 h.

2.3. Mineral Concentration in Fruit and Leaf Tissues

The mineral concentration in the collected materials (fruit and leaf) was quantified separately for bean, husk, and leaf. The contents of nitrogen (N), phosphorus (P), potassium (K), calcium (Ca), magnesium (Mg), sulfur (S), iron (Fe), zinc (Zn), copper (Cu), manganese (Mn), and boron (B) were assessed according to the previously described methodology [34]. The N content was determined after sulfuric acid digestion using the Nessler colorimetric method; P by molecular absorption spectrophotometry; K by flame photometry; and S by sulfate turbidimetry. The contents of Ca, Mg, Fe, Zn, Mn, and Cu were determined by atomic absorption spectrophotometry, and B by colorimetry using the Azometin-H method. The nutrients P, K, Ca, Mg, S, B, Fe, Zn, Mn, and Cu were quantified by ICP-OES, after digestion with concentrated HNO3 and H2O2 in an open digestion system. The ICP conditions were: plasma gas 8.0 L min−1, auxiliary gas 0.70 L min−1, and carrier gas 0.55 L min−1 [35,36,37].
The dry weight of the husks and beans in a 60 kg bag of processed coffee was inferred from the ratio of bean to husk. The accumulation of macro- and micronutrients in the husks and beans was calculated as dry weight × concentration of each nutrient. The macro- and micronutrients accumulated in the fruit were calculated based on the sum of these nutrients contained in the husks and beans.
Moisture was determined by oven-drying four repetitions of each sample to a fully dry state (105 °C, for 24 h) [38]. Bean moisture is usually considered with 11% humidity, therefore a correction from 0 to 11% moisture (Mo) was needed, using the following equation:
i n i t i a l   W . * 100 i n i t i a l   M o = f i n a l   W . * 100 f i n a l   M o
where initial W. = weight at 65 °C 170 h−1, final W. = weight at 105 °C 24 h−1, initial Mo = P. InitialP. Final, and V Final Mo = 88.
Based on these calculations, the bean weight 11%MC (i.e., dry bean weight (DBW)) and the proportion of ripe fruit to dry bean weight 11%MC (RFW/DSW) were determined.

2.4. Statistical Analyses

The data were subjected to analysis of variance and the characteristics with significantly different results among cultivars, at a level of 5% probability (p ≤ 0.05) by the F test, were compared by Tukey’s HSD mean comparison test, at the same significance level. The data were analyzed using the software Genes [39].
The following statistical model was used:
Y i j = μ + G i + B k + e i j k
where:
Yijk = observation regarding the i-th genotype in the j-th repetition;
μ = general constant;
Gi = effect of the i-th genotype, i = 1, 2, …, 9;
Bk = kth block effect, k = 1, 2, 3, 4;
eijk = experimental error.
The data matrix for cluster analysis consisted of 15 variables, namely, % of bean in the fruit, dry bean weight 11%MC, dry fruit weight 11%MC, kg of ripe fruit/60 kg of bean 11%MC, and total accumulation of N, P, K, Ca, Mg, S, Cu, Fe, Mn, Zn, and B in the fruit per ton of bean 11%MC.
To generate the dendrogram, the Mahalanobis generalized distance (D2) (1936) was estimated by the following formula:
D 2 i i = j = 1 n . j = 1 n . W J J d j d j
where:
D2ii is the Mahalanobis generalized distance between genotypes i and i′, i = 1, 2, … 9;
n = number of variables;
WJJ = element of the j-th row and j-th column of the inverse variance matrix and residual covariances between the genotypes;
dj = difference between the means of the j-th variable in the two studied genotypes.
To establish a cut-off point in the dendrogram and define the number of groups, the Monjena procedure (1977) was used, based on the relative size of the merger levels (distances) in the dendrogram.
The UPGMA (unweighted pair group method with arithmetic mean) method was used for clustering to obtain the highest cophenetic correlation coefficient (0.84). The analysis was based on the following formula:
d i j k = m e a n d i k ; d j k = d i k + d j k 2
where d(ij)k is given by the average distances between pairs of individuals (i and k) and (j and k).
To visualize the dendrogram, we used the R software package “Circlize” [40].
The relative contribution of the characteristics was calculated from the method proposed by Singh [41], based on the partition of the total estimates of distances D2ii, considering all possible pairs of individuals, with regard to each characteristic. The data were analyzed using R software [39].

3. Results

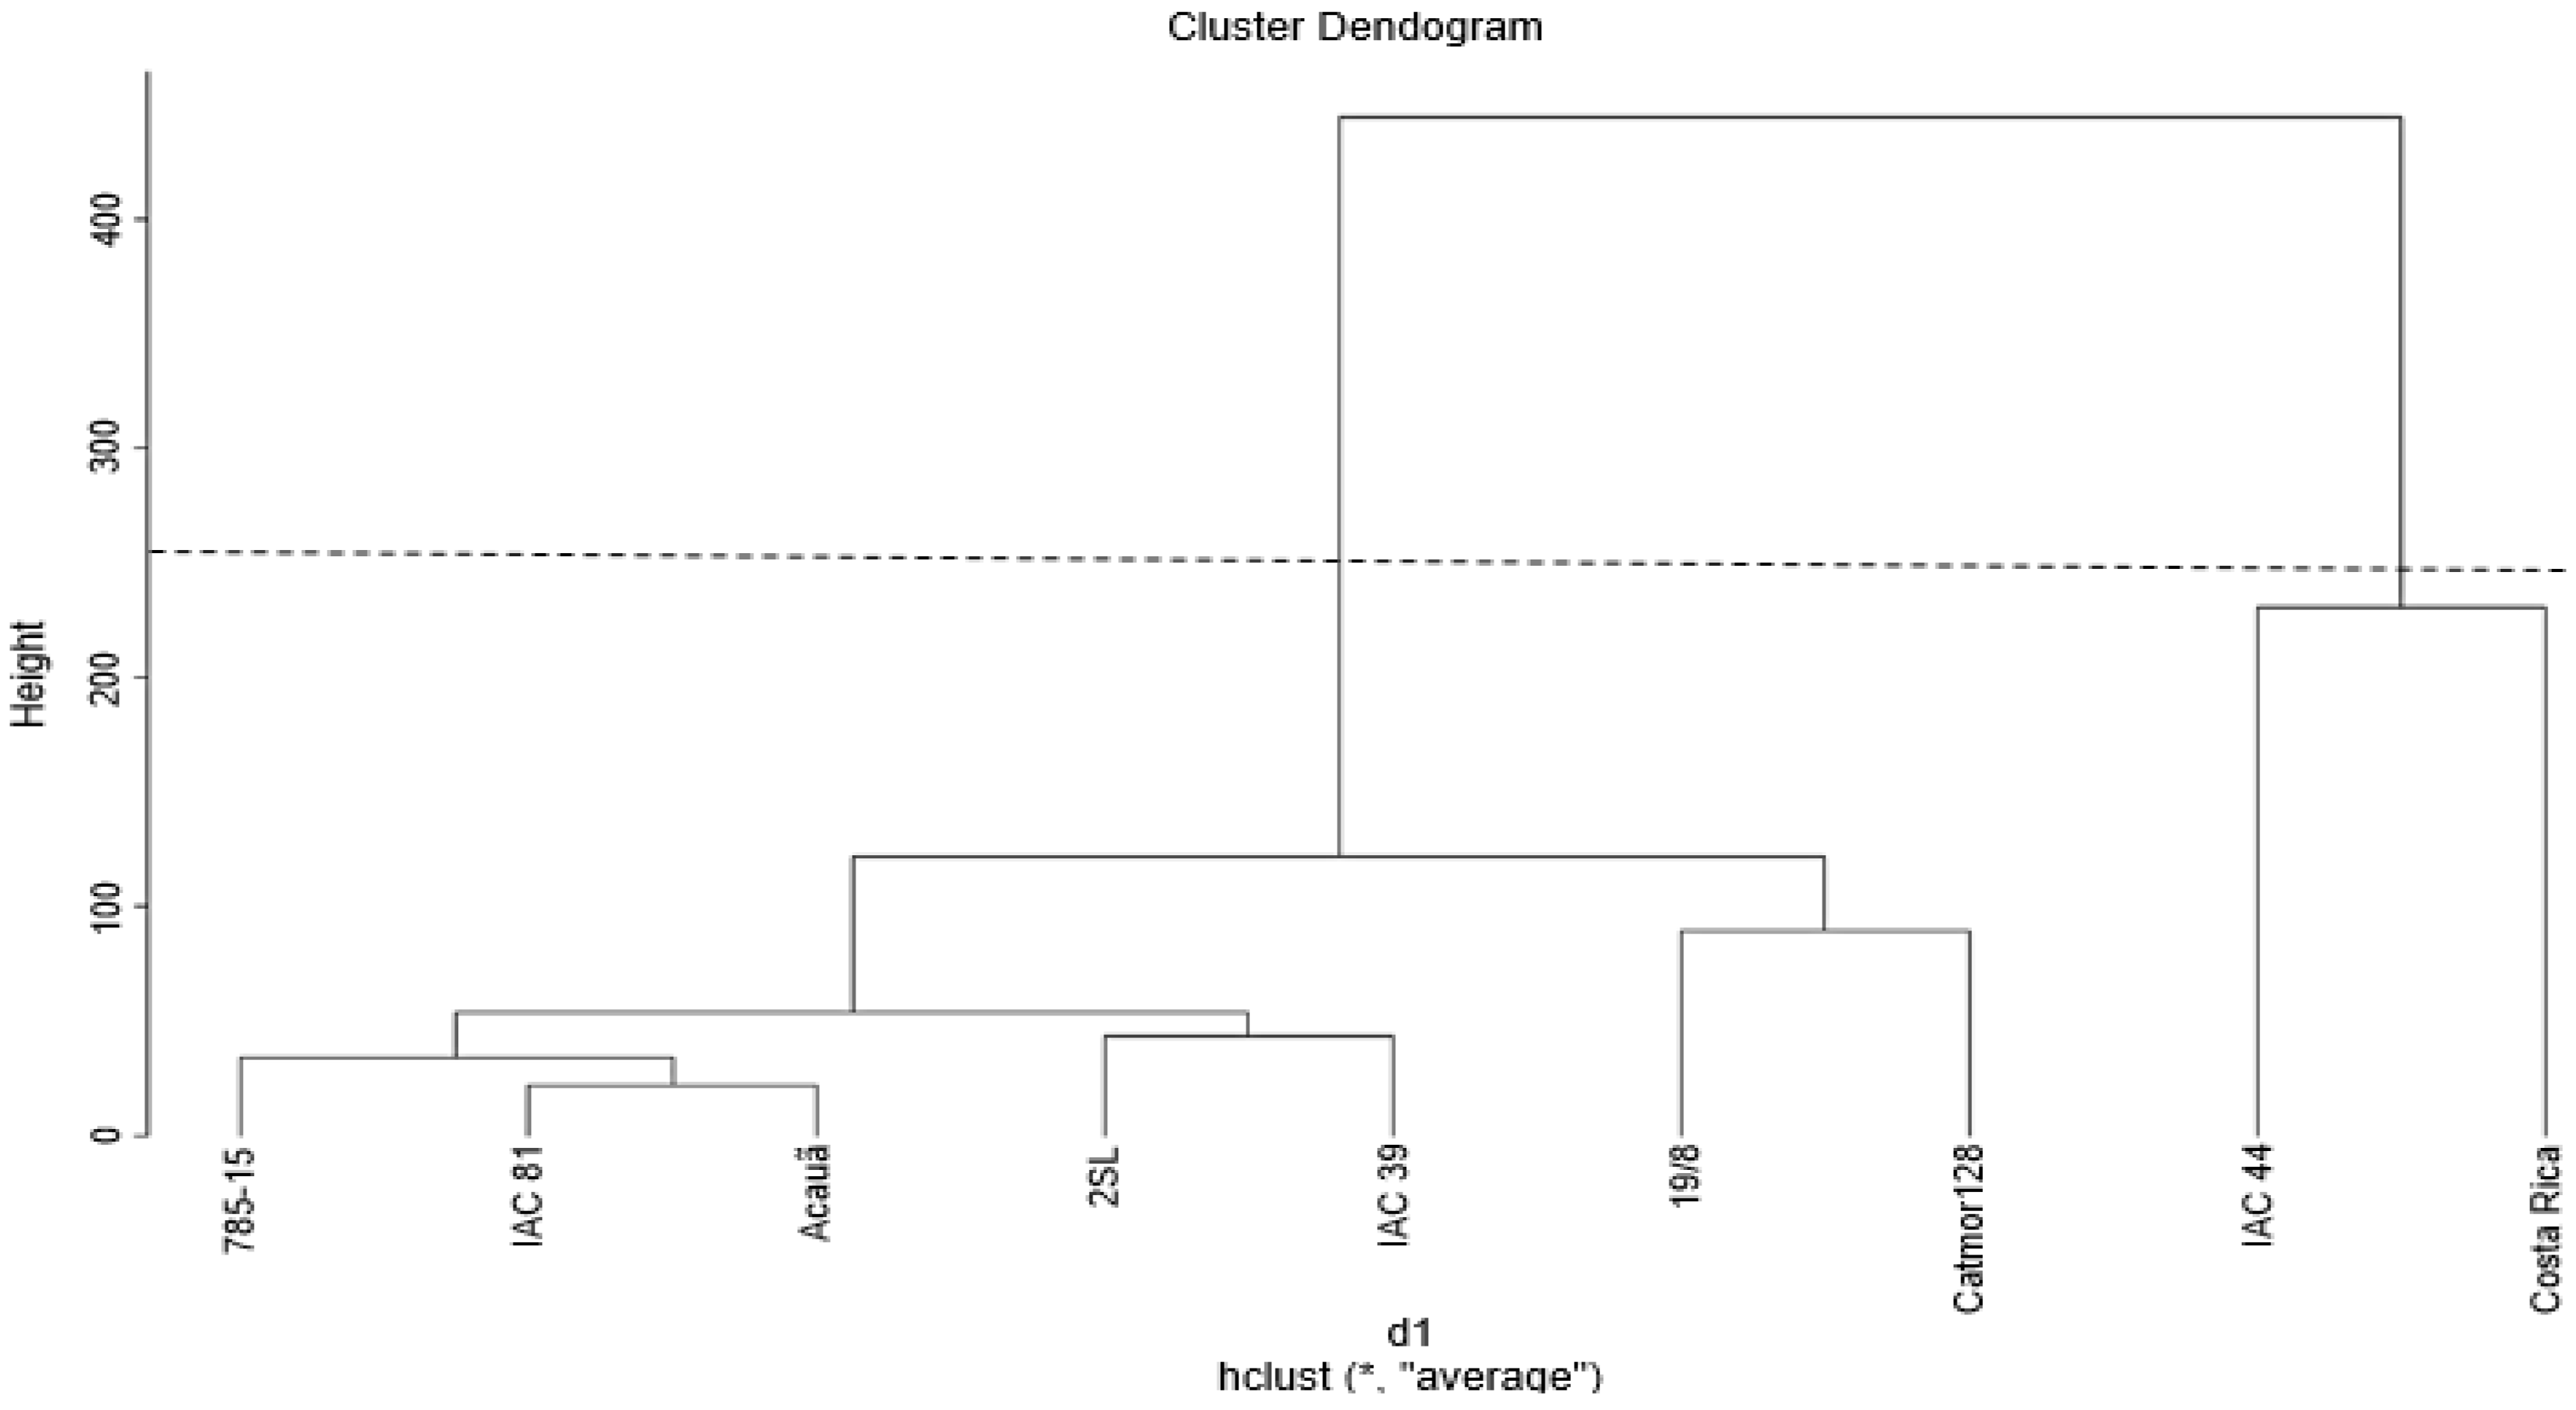
3.1. Dissimilarity between Genotypes and Genetic Contribution

The genetic diversity relative contribution was determined using the Singh method [41], resulting in values between 0.02% (fruit weight) and 44.45% (boron). The variables of bean weight (6.71%), micronutrient concentrations B (44.45%), Fe (20.58%), macronutrient S (10.48%), and macronutrient K (4.91%) were those that significantly contributed to the observed differences; that is, they were the variables that better expressed the existing genetic diversity, altogether representing 87.13% of the variability among the cultivars (Table 3).
The dendrogram was constructed based on genotype grouping by the hierarchical cluster analysis UPGMA, using Mahalanobis’ generalized distance as a dissimilarity measure, with regard to the variables % of bean in the fruit, bean weight 11%MC, dry fruit weight 11%MC, ripe fruit weight per 60 kg of bean 11%MC, and total nutrient accumulation (kg) in the fruit per ton of bean 11%MC. At the maximum cut-off limit of 250 of the dissimilarity between cultivars, the formation of two groups was observed (Figure 1). Group I included seven cultivars (Catucaí Amarelo 2SL, Catuaí Amarelo IAC 39, Catucaí 785-15, Catucaí Vermelho 19/8, Catuaí Vermelho IAC 81, Acauã and Catimor 128), and group II only included two cultivars (Costa Rica and Catuaí Vermelho IAC 44).
Slight differences were observed between the clustering methods, as the cultivars were also divided into two groups using the Tocher method. One group contained only one cultivar (Catuaí Vermelho IAC 44), while the other seven genotypes formed a second group (Table 4). For both UPGMA and Tocher methods, the cultivar Catuaí Vermelho IAC 44 was considered divergent because of its high dissimilarity degree.
The variables analyzed indicated different performances of the cultivars by Tukey’s test (Table 5). The coefficient of experimental variation ranged from 2.83% to 6.21%, which indicated good precision in the evaluation of the characteristics. The percentage of bean in the fruit, husk percentage in the fruit, ratio of ripe fruit weight/dry bean weight, ripe fruit weight/ton of bean 11%MC, ripe fruit weight/60 kg green bean 11%MC, and ripe fruit/ton of bean 11%MC did not differ significantly among the cultivars.
For the weight of one bean 11%MC, ripe fruit weight, and dry fruit weight 11%MC, the cultivars differed significantly. The highest mean proportions (0.18, 1.77, and 0.52, respectively) were always observed for cv. Catimor 128, and the lowest means (0.13, 1.34, and 0.41, respectively) for cv. Catucaí Amarelo 2SL.
A slight variation was observed in the ratio of fruit ripe weight/fruit dry weight. The Costa Rica cultivar obtained the highest mean ratio (3.44), and cv. Catuaí Amarelo IAC 39 the lowest (3.13).

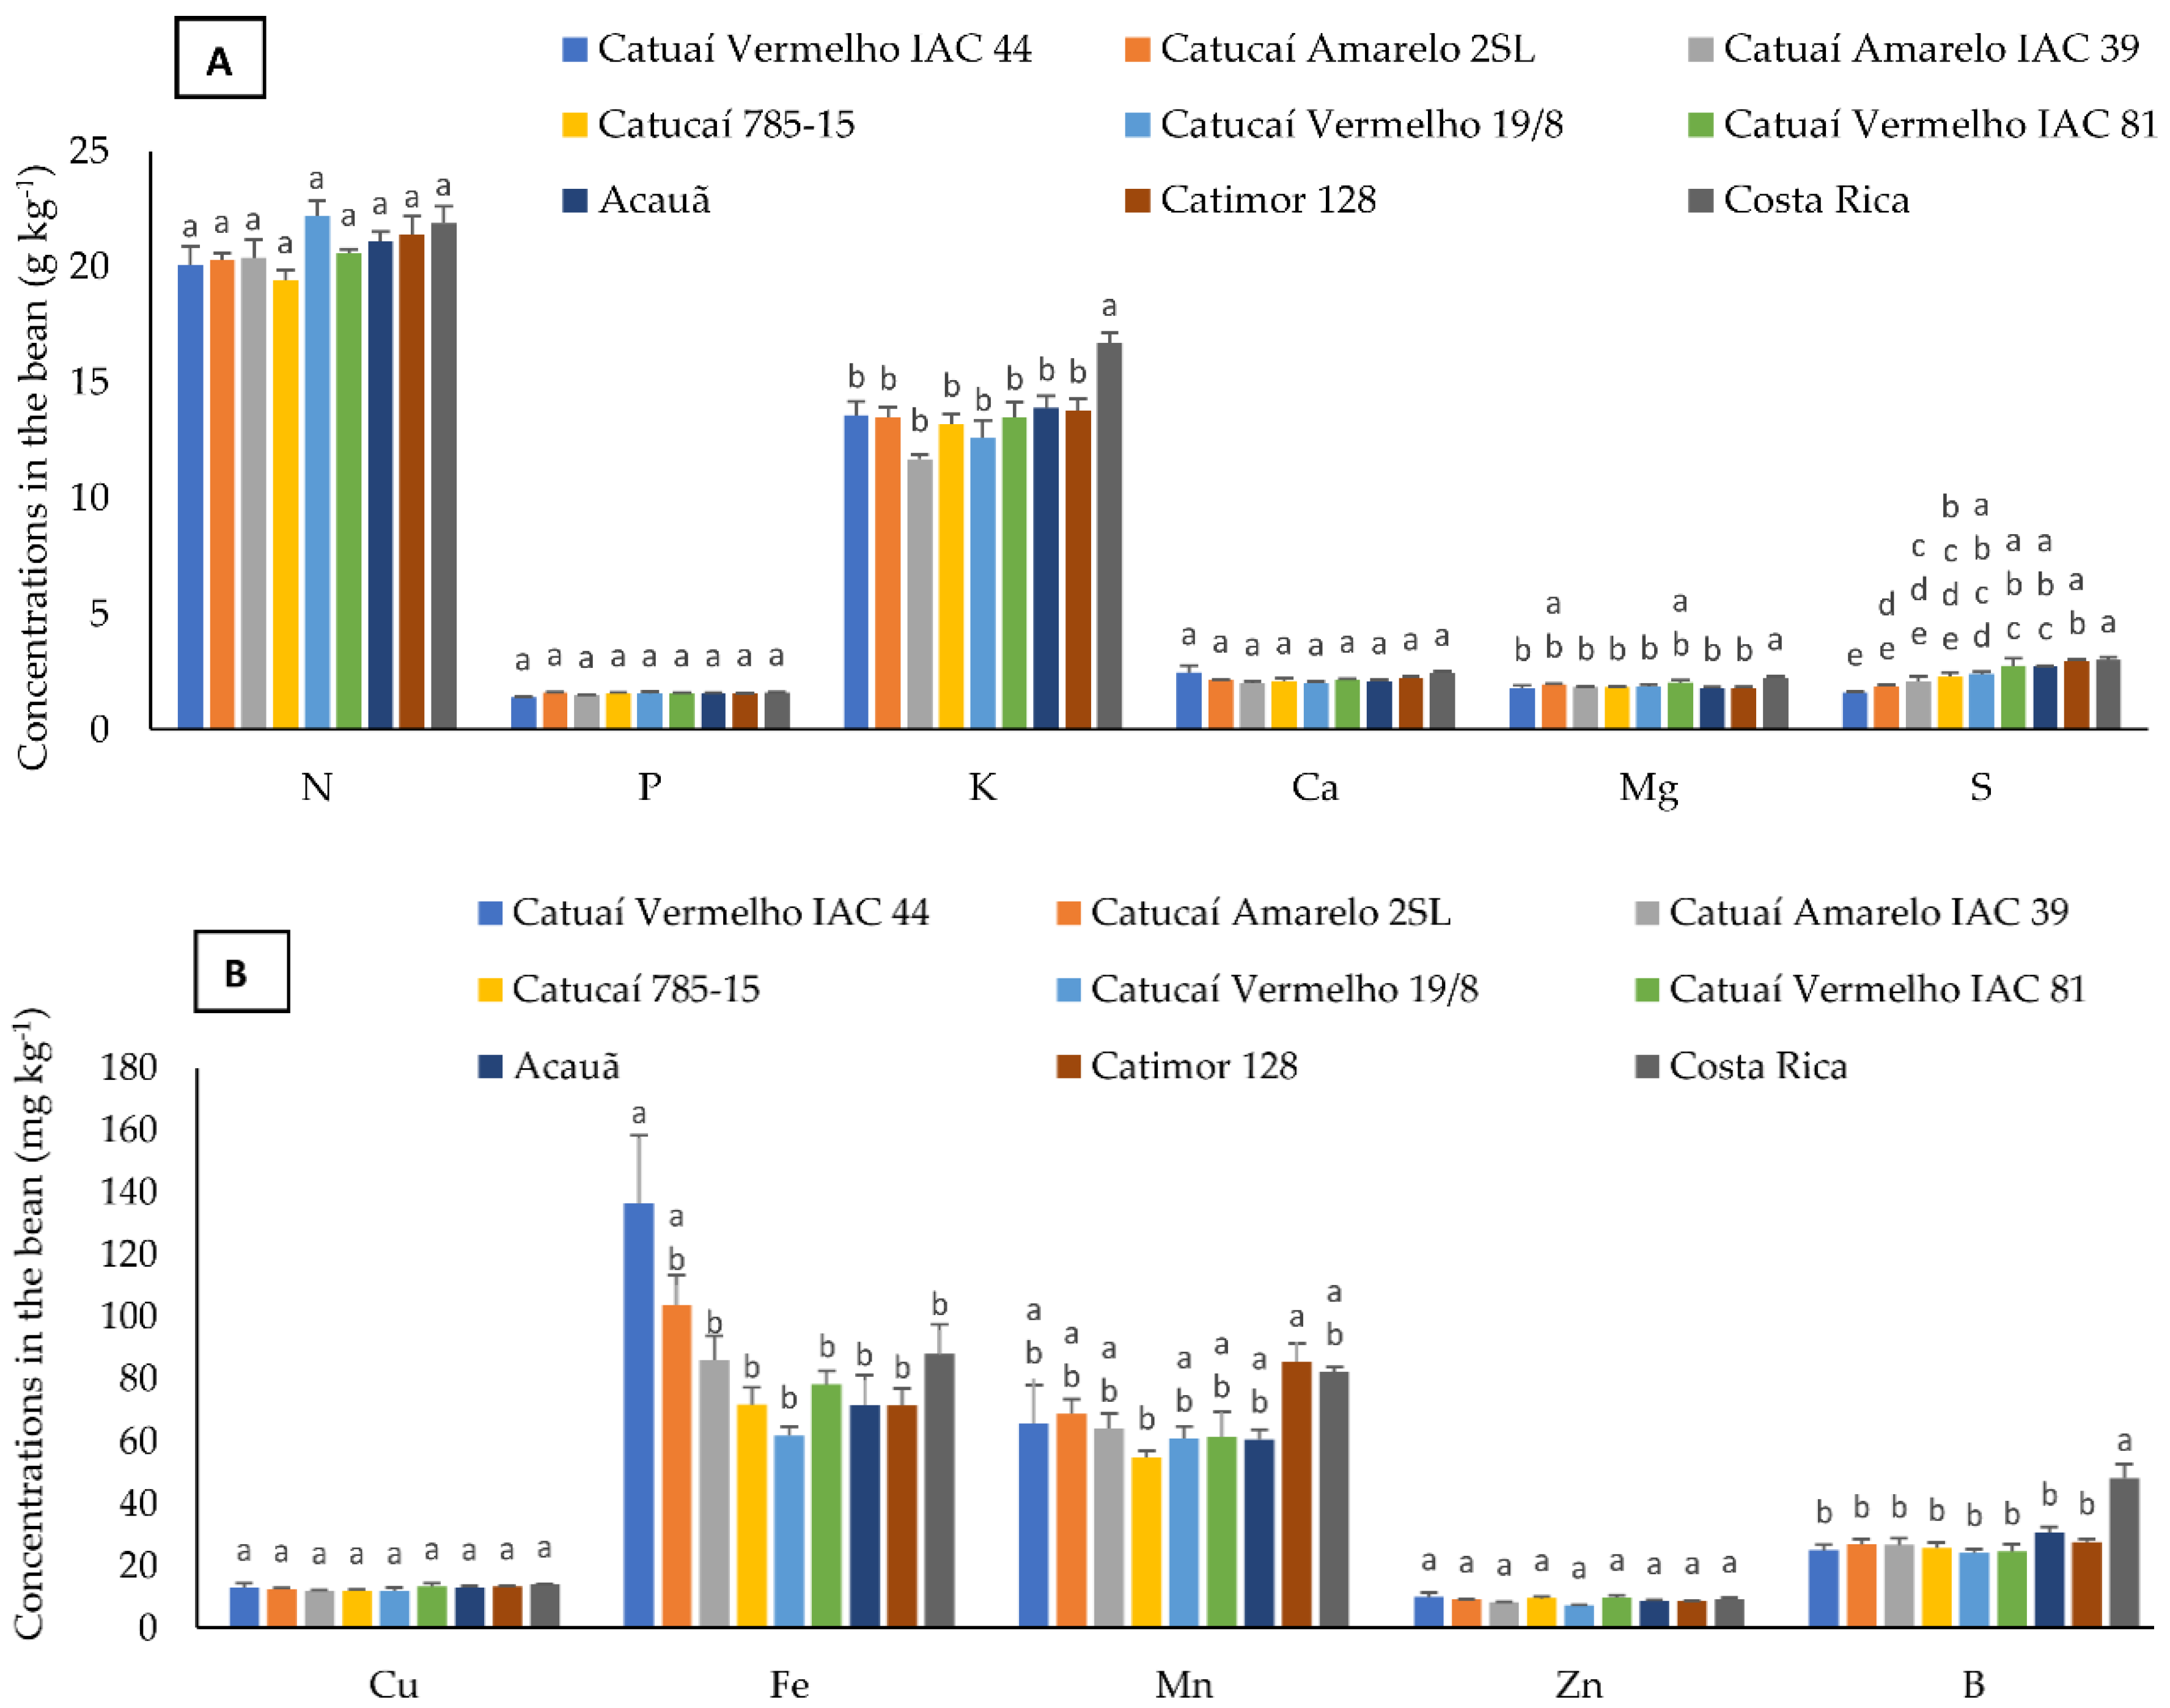
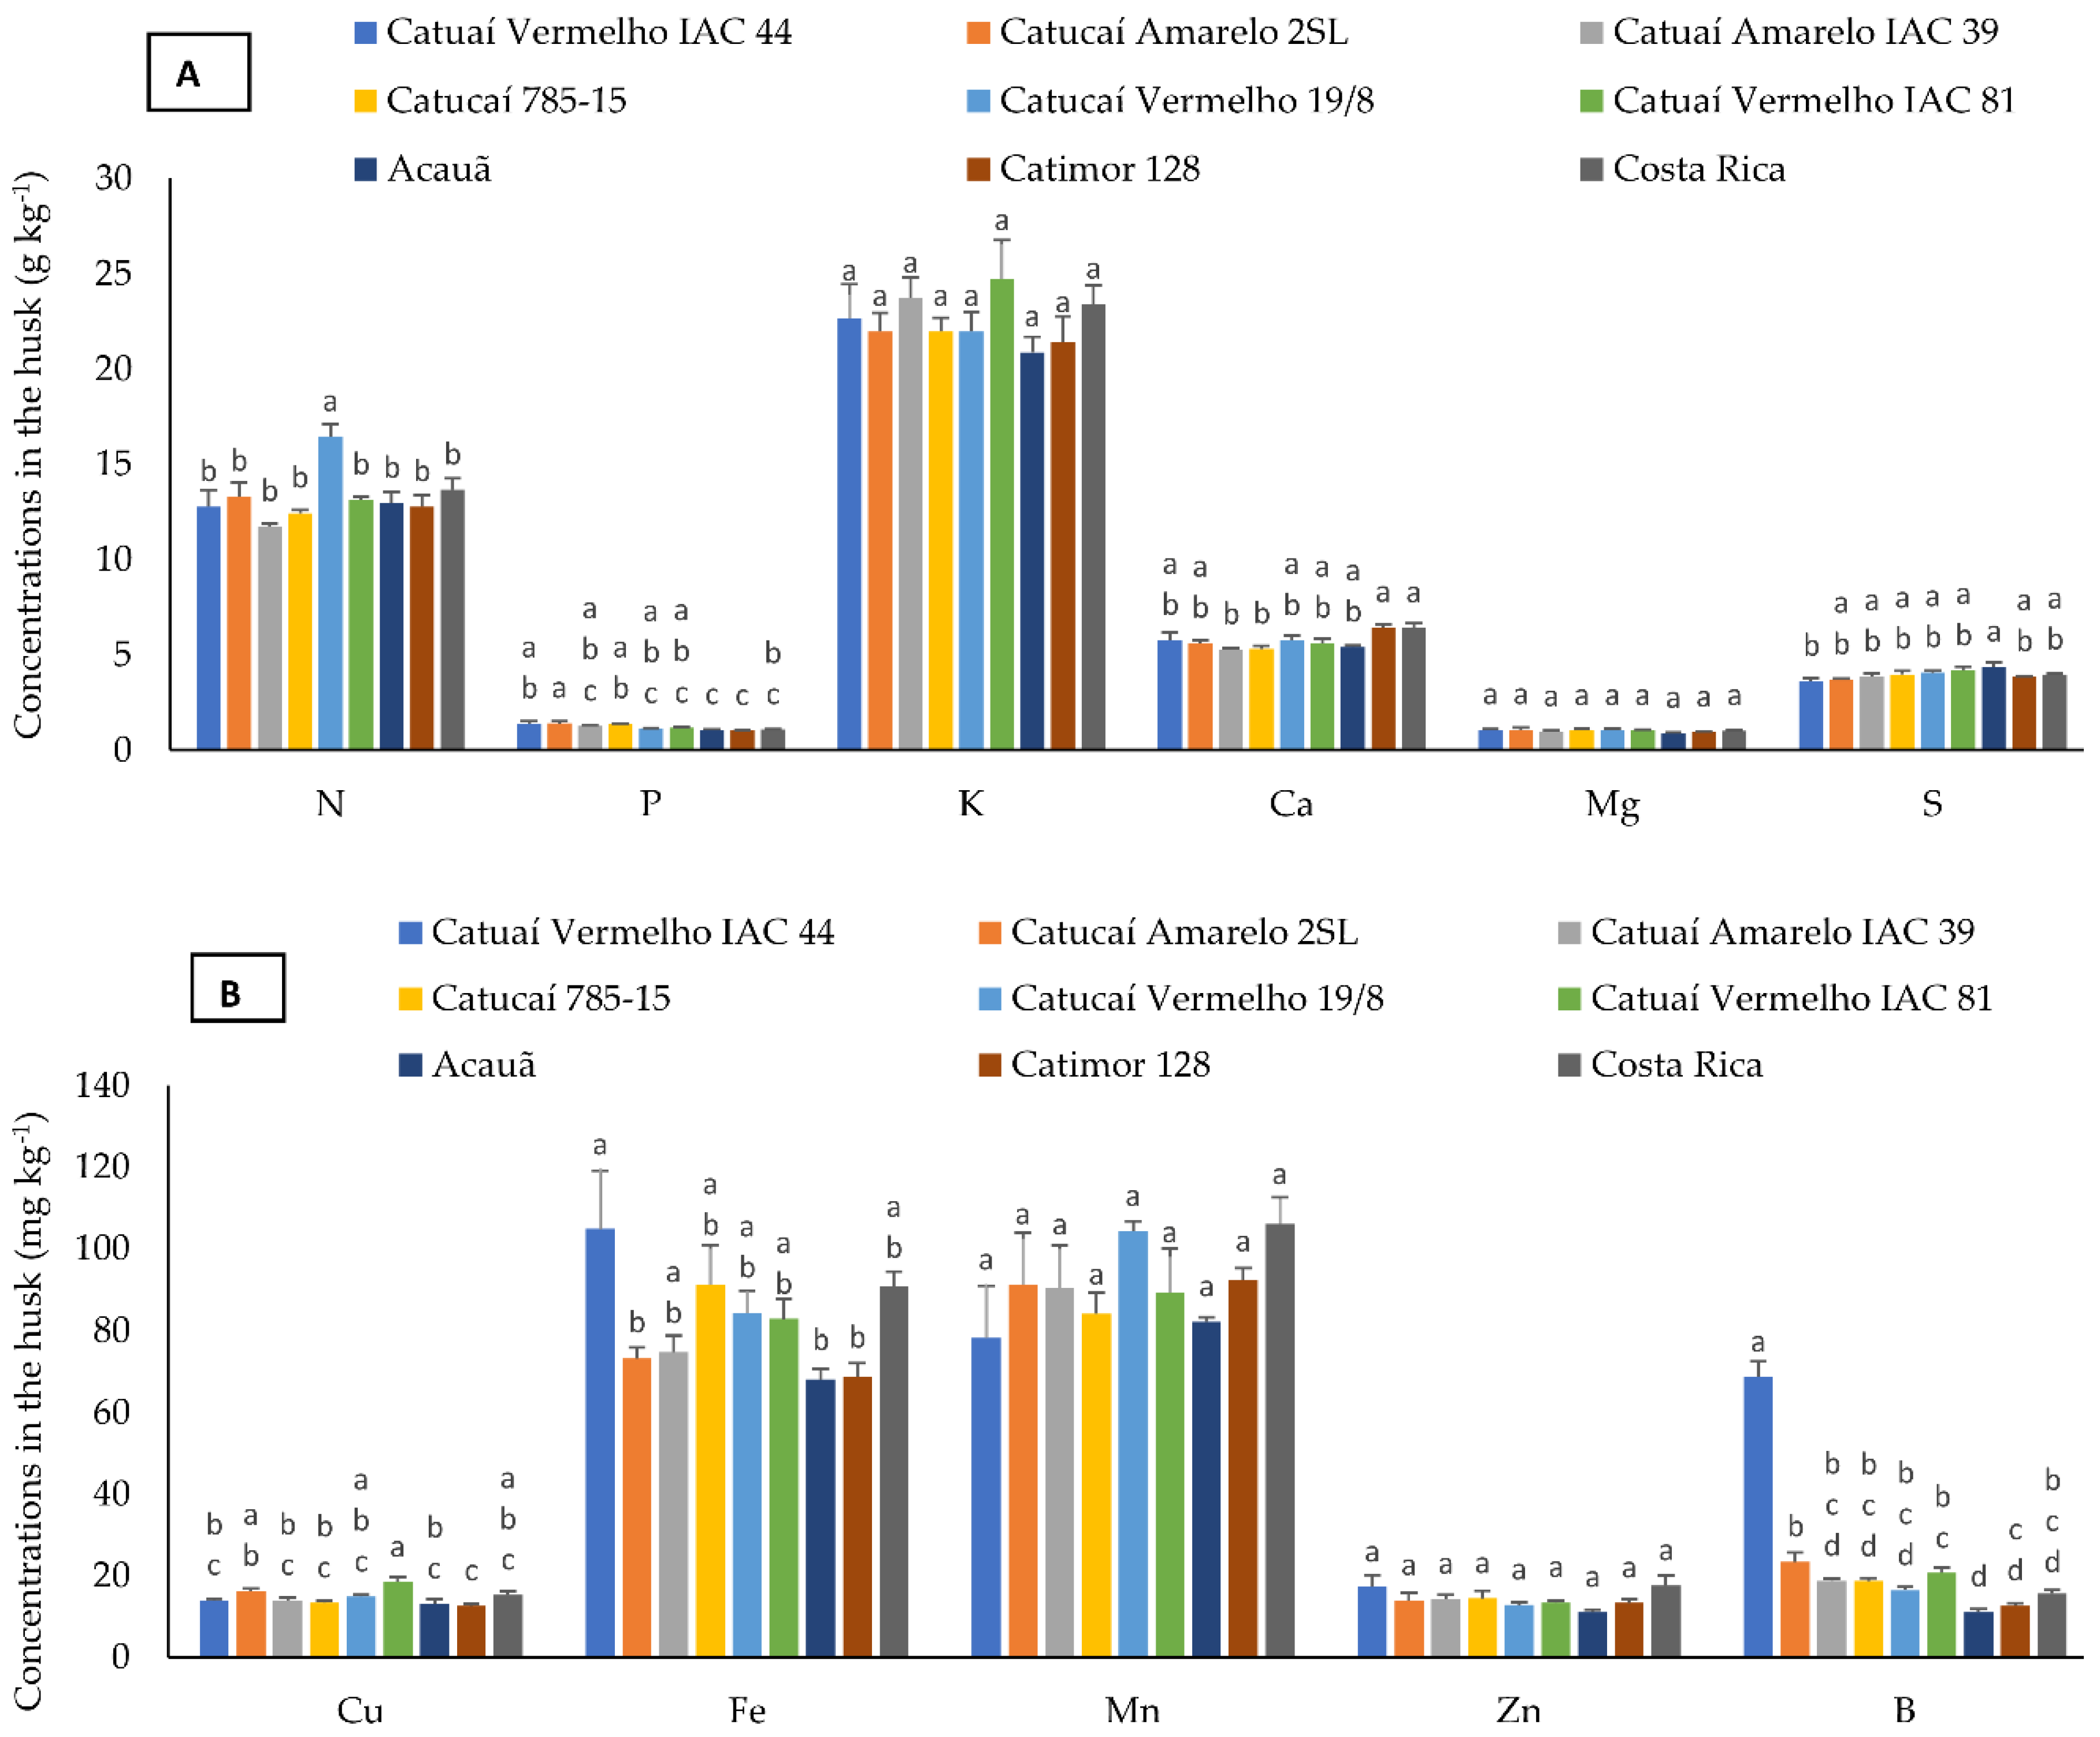
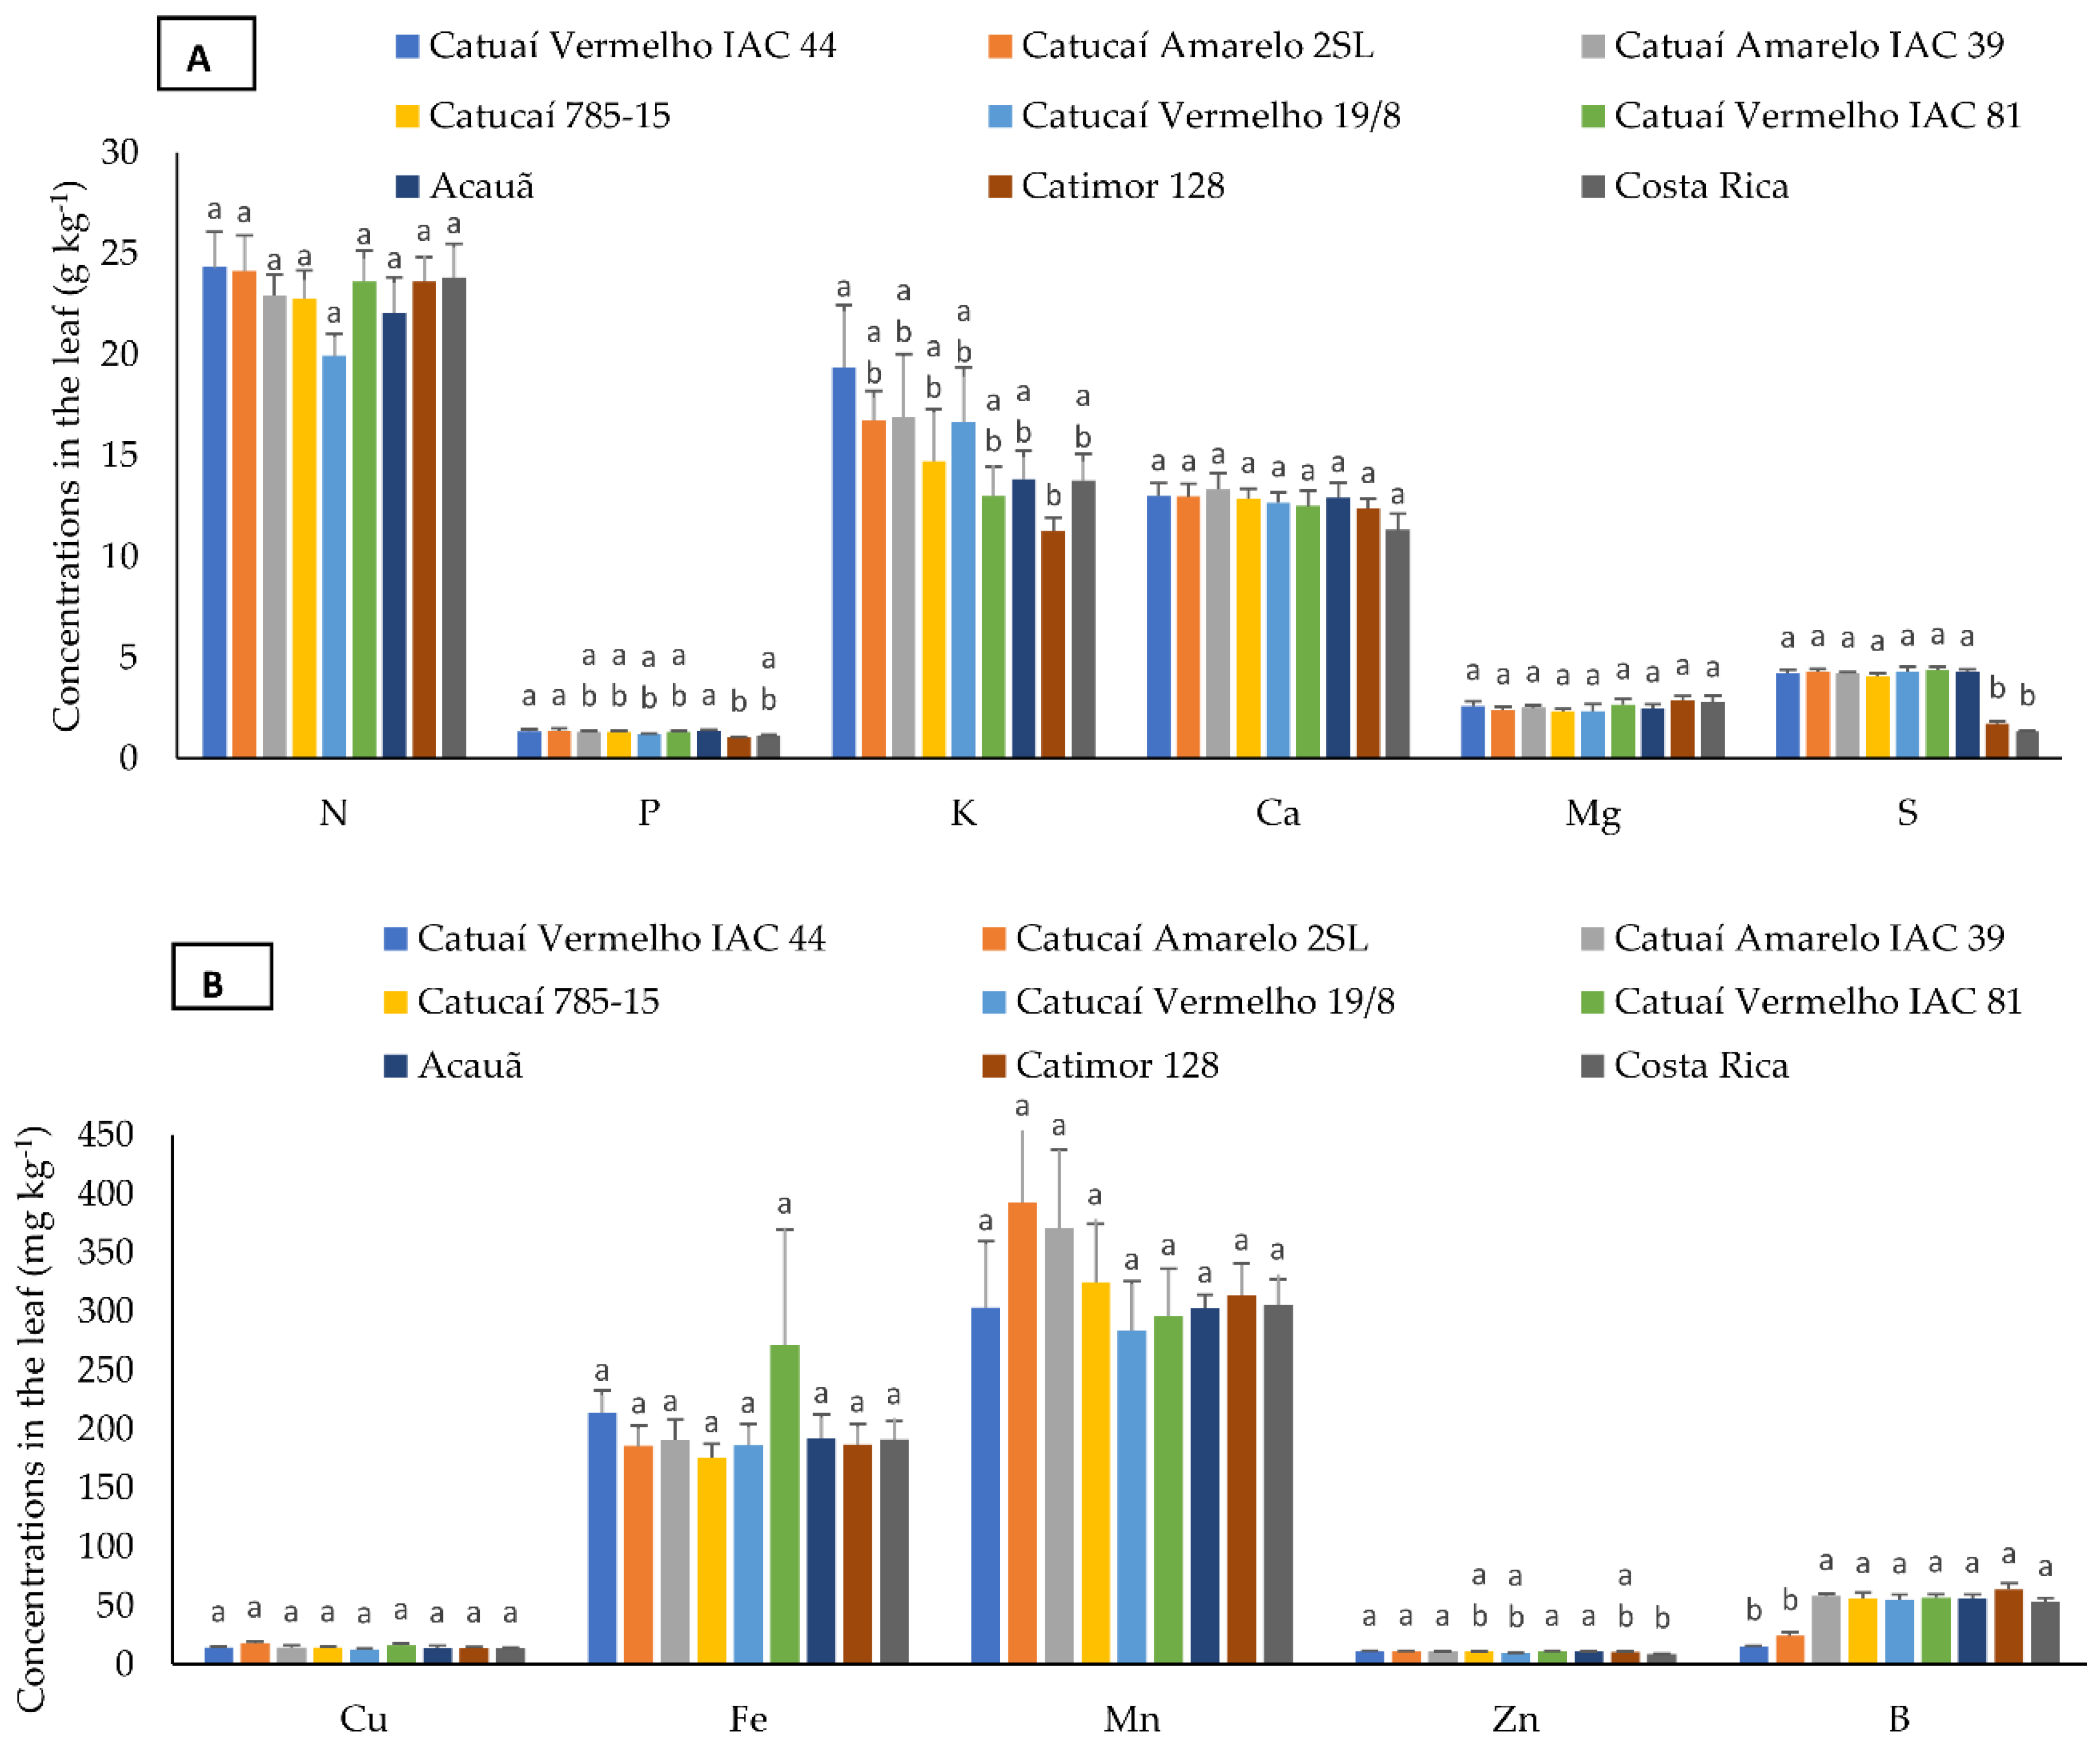
3.2. Nutrient Concentration in Bean, Husk, and Leaf

With regard to the bean nutrient concentrations, the macronutrients N, P, and Ca did not differ significantly among the cultivars (Figure 2A). For K and Mg, cv. Costa Rica had the highest concentrations (18 g kg1 and 2.42 g kg1), whereas the other cultivars did not differ from each other (except for K). The mean S concentration was highest (3.25 g kg1) for cv. Costa Rica and lowest (1.72 g kg1) for cv. Catuaí Vermelho IAC 44. In general, the mean concentrations of all macronutrients were the highest (24 g kg1) for cv. Catucaí Vermelho 19/8.
The micronutrient concentrations Cu and Zn in the bean were similar in all cultivars (Figure 2B). For B, cv. Costa Rica contained the highest concentrations (52.1 mg kg1), different from all other cultivars (which did not differ from each other). For Mn, cv. Catimor 128 contained the highest concentrations among all cultivars (92.4 mg kg1), and cv. Catucaí 785-15 the lowest (59.4 mg kg1). For Fe, cv. Catuaí Vermelho IAC 44 stood out with the highest concentration (147.3 mg kg1), cv. Catucaí Vermelho 19/8 had a low mean (66.6 mg kg1), and cv. Catucaí Amarelo 2SL did not differ from the others in terms of B.
For the macronutrients K and Mg in the husk, the cultivars did not influence the nutrient concentrations according to the Tukey test (Figure 3A). For N, cv. Catucaí Vermelho 19/8 had the highest mean concentration (16.5 g kg1). The highest mean P concentration was found in cv. Catucaí Amarelo 2SL (1.4 g kg1), and the lowest in cvs. Acauã and Catimor 128 (1.05 and 1.02 g kg1). For Ca, two groups were formed, although some cultivars did not differ significantly from the others. The highest means were found for cvs. Catimor 128 and Costa Rica (6.42 and 6.4 g kg1) and the lowest values for cvs. Catuaí Amarelo IAC 39 and Catucaí 785-15 (5.25 and 5.3 g kg1). For S, two groups were formed as well, and some cultivars did not differ from the others. The cultivar Acauã contained the highest mean concentration (4.35 g kg1), and cv. Catuaí Vermelho IAC 44 the lowest (3.6 g kg1).
The concentrations of the micronutrients Mn and Zn in the husk did not differ among the cultivars, all of which were grouped using Tukey’s test (Figure 3B). Iron was clustered in two groups, although some cultivars did not differ significantly from the others. Cultivar Catuaí Vermelho IAC 44 had the highest (104.9 mg kg1), and cvs. Catucaí Amarelo 2SL, Catimor 128, and Acauã exhibited the lowest mean concentrations (73.2, 68.8, and 68.1 mg kg1). The mean Cu concentrations were the highest for cv. Catuaí Vermelho IAC 44 (13.9 mg kg1) and the lowest for cv. Catimor 128 (12.6 mg kg1). For B, cv. Catuaí Vermelho IAC 44 had, by far, the highest mean concentration (68.7 mg kg1), and cv. Acauã the lowest (11.1 mg kg1).
The leaf macronutrient concentrations did not differ among the cultivars in N, Ca, and Mg (Figure 4A). Phosphorus differed only slightly, although some cultivars did not differ significantly from the others. The means were the highest for cvs. Acauã, Catucaí Amarelo 2SL, and Catuaí Vermelho IAC 44 (1.37, 1.37, and 1.35 g kg1, respectively), and lowest for cv. Catimor 128 (1.05 g kg1). For K, the highest means were recorded for cv. Catuaí Vermelho IAC 44 (19.4 g kg1), and the lowest for cv. Catimor 128 (12.4 g kg1). The mean S concentrations in cv. Catimor 128 and Costa Rica were the lowest (1.72 and 1.35 g kg1, respectively), significantly different from all other cultivars.
Regarding leaf micronutrients, no differences were found for Cu, Fe, and Mn among the cultivars (Figure 4B). For Zn, the cultivar means were divided into two groups, although some cultivars did not differ significantly from the others. The highest means were recorded for cv. Catucaí Amarelo 2SL, Catuaí Vermelho IAC 81, Catuaí Vermelho IAC 44, Acauã, and Catuaí Amarelo IAC 39 (11.1, 11, 10.9, 10.9, and 10.7 mg kg1, respectively). The cultivars Catucaí Vermelho 19/8 and Costa Rica were isolated with the lowest means (9.62 mg kg1 and 8.67 mg kg1). For B, the cvs. Catucaí Amarelo 2SL and Catuaí Vermelho IAC 44 presented the lowest concentrations (24.1 and 15.4 mg kg1) in comparison with the other cultivars. The cultivars Catuaí Amarelo IAC 39, Catuaí Vermelho IAC 81, and Acauã were always in the group with the highest micronutrient means.

3.3. Nutrient Accumulation in the Fruit

The accumulation of the macronutrients N, P, K, Mg, and S in the fruit differed significantly among the cultivars, according to the Tukey test (Table 6). The highest values were found for cvs. Catucaí Vermelho 19/8 (N), Catucaí Amarelo 2SL (P), and Costa Rica (K, Mg, and S) and the lowest values for cvs. Catucaí 785-15 (N), Acauã (P, K, Mg), and Catuaí Vermelho IAC 44 (S). Calcium was the only macronutrient with no significant differences among the cultivars.
Major differences in the micronutrient accumulation in the fruits were observed for Fe and B, with maximum values of both minerals in cv. Catuaí Vermelho IAC 44. Regarding Cu, Mn, and Zn, these minerals did not differ significantly among the cultivars. The highest mean for the micronutrients was observed for cv. Catuaí Vermelho IAC 44 (195.5 mg kg1), and the lowest values were observed for cv. Acauã (14.6 mg kg1).

3.4. Correlations between Cumulative Nutrient Concentrations in Bean, Husk, Fruit, and Husk Percentage, Bean Percentage, Bean Weight, and Fruit Weight

Spearman’s correlations for macro- and micronutrient concentrations of 30% were considered significant, with binary relationships (positive and negative) between the evaluated variables (Table 7). However, only significantly positive correlations were observed.
Among the macronutrients, N was very strongly correlated with Bean × NAB, Husk × NAF, and Fruit weight × Bean weight. Strong correlations were observed for Bean × NAF, Husk × NAH, NAF × NAH, %Bean× Fruit weight, %Bean × Bean weight, and Fruit weight × Bean weight, whereas moderate correlations were identified for Bean × Husk and NAH × %Husk.
For P, very strong correlations were observed for Bean × NAB, and Husk × NAH, and strong correlations for Husk × NAF, NAF × NAH, and NAF × %Husk. Moderate correlations were also found for Husk × %Husk and NAH × %Husk.
Potassium had very strong correlations with Bean × NAB, strong correlations with Husk × NAH and NAH × %Husk, and moderate correlations with Bean × %Husk and NAH × Bean weight.
Calcium was very strongly correlated with Bean × NAB, Husk × NAF, and NAF × NAH. Strong correlations were observed for Bean × Husk, Bean × NAF, and Husk × NAH.
Magnesium presented very strong correlations with Bean × NAB, Bean × NAF, and NAH × %Husk, as well as strong correlations with Husk × NAH, and moderate correlations for Bean × NAH, Bean × %Husk, Husk × %Husk, NAF × NAH, and NAF × %Husk.
Sulphur was shown to have very strong correlations with Bean × NAB and Bean × NAF, as well as strong positive correlations with Husk × NAH and Husk × NAF.
With regard to the micronutrients, Cu exhibited very strong correlations with the variables Bean × NAB and Husk × NAH, but also strong correlations with Husk × %Husk, Husk × NAF, NAF × NAH, and NAH × %Husk.
For Fe, only very strong correlations were recorded for Bean × NAB, Bean × NAF, and Husk × NAH.
Manganese was shown to have very strong correlations with Bean × NAB, strong correlations with Bean × NAF, Husk × NAH, and Husk × NAF, and moderate correlations with NAF × NAH and NAH × %Husk.
Very strong correlations were observed for Zn with Bean × NAB, Husk × NAH, and Husk × NAF, whereas strong correlations were depicted for Bean × NAF and NAF × NAH. A moderate correlation was also found with Bean × Husk.
The micronutrient B was very strongly correlated with Bean × NAB and Husk × NAH.
Finally, it is noteworthy that the variables Bean × NAB and Husk × NAH commonly presented very strong or strong correlations with all macro- and micronutrients.

4. Discussion

Two groups of cultivars were formed by the UPGMA (Figure 1) and two by the Tocher (Table 4) method, using the dissimilarity between the fruit traits and the macro- and micronutrient concentrations and accumulation in the leaf and fruit of the nine cultivars (Figure 1). The second method indicated that one of groups integrated only one cultivar, suggesting that this genotype differs significantly from all of the others with regard to the studied traits [36,42,43]. This hierarchical method was previously used [17,25] to assess genetic diversity, showing the formation of divergent groups of C. canephora and C. arabica based on nutritional characteristics; that is, the traits are expressed (and result) from the existing genetic diversity, which is extremely important for breeding.
Coffee fruits are morphologically characterized by the following parts: a pericarp (exocarp, mesocarp, and endocarp), perisperm, and endosperm, of which the latter constitutes storage tissue where the embryo is located [44,45]. Post-harvest processing eliminates part of these fruit components, resulting in a mixture of residues that can be re-applied as husk mulch to the crop in order to return nutrients to the soil, thus decreasing the use of chemical fertilizers. The higher or lower percentage of bean in the fruit indicated genotypic variation in the biomass allocation to the different fruit constituents. Unlike the others, cvs. Catimor 128, Catuaí Vermelho IAC 44, Acauã, and Catuaí Vermelho IAC 81 accumulate a higher percentage of the bean in each fruit, which is the commercially exploited part, consequently reducing the energy in the form of biomass in the other fruit parts. Dry matter accumulation in the fruit is influenced by the productivity of the ripe fruit; in other words, a higher ripe fruit yield results in more biomass accumulated in the fruit. The yield of green coffee is measured after the drying and depulping of the coffee fruit, and the greater or lesser weight of green coffee bean fruit is directly related to the biomass accumulation in the fruit [45,46].
Low variability was observed among cultivars regarding the weight of ripe fruit per 60 kg of bean 11%MC and dry coffee per ton of bean 11%MC. The productivity ranged from 306 to 335 kg−1 of ripe fruit to obtain a 60 kg bag, representing a coefficient of variation of 4.73% between the evaluated cultivars, where CVs below 7% are generally considered low [46].
From the studied macro- and micronutrients, N, K, and Ca, and Fe, Mn, and B stood out with highest accumulation in the bean, husk, fruit, and leaves, confirming previous findings for C. canephora cv. Conilon [20]. Among the micronutrients, Mn was the second most accumulated. Approximately 80% of Fe is accumulated in chloroplasts and plays a vital role in photosynthesis and chlorophyll production [19,37]. Nutrient concentration varies according to the soil conditions, season, plant age, and genotype maturation cycle [23,26]. In addition, some genotypes take up and translocate more nutrients than others [47]. Moreover, the efficiency and priority of uptake of some nutrients are genetically defined characteristics [29]. Several studies describe differences in the nutritional concentrations between C. arabica genotypes under the same management conditions [30,31]. This is related to a wide interspecific variability between C. arabica genotypes, especially in relation to characteristics such as growth, maturation cycle, nutrient accumulation, and stress tolerance [32]. This makes it possible to explore diversity for the identification and breeding of genetic material better adapted to the range of soil and climatic conditions of the producing regions [33]. Additionally, all studied minerals (both macro- and micro-nutrients) significantly correlated with the Bean × NAB and Husk x NAH variables, suggesting that these can be used to follow the mineral balance and help crop fertilization management. Nevertheless, for bean quality purposes, it should be pointed out that physical and chemical traits (including bean size and color, size, flavor, phenolic content, soluble solids, chlorogenic, caffeic and p-coumaric acids, caffeine, trigonelline, and lipids), but also mineral content, can be considerably impacted by higher temperatures (although less under elevated [CO2] [7,11,12,13]), and must be additionally considered when breeding new cultivars to cope with future expected climate conditions.

5. Conclusions

Genetic divergence in C. arabica cultivars was detected in the ripe and dried fruit and in the coffee bean with regard to the assessed variables.
The UPGMA detected the dissimilarity of cvs. Costa Rica and Catuaí Vermelho IAC 44 in relation to the others, whereas the Tocher method pointed to the dissimilarity of cv. Catuaí Vermelho IAC 44 in relation to the others.
The evaluated cultivars showed higher accumulation in most macronutrients and some micronutrients in the coffee bean, fruit, and husk. The macronutrients N, K, and Ca were the most accumulated in the bean, husk, fruit, and leaves, and the micronutrients Fe, Mn, and B were the most accumulated in the bean, husk, fruit, and leaves of C. arabica.
The results of this study may underlie the development of future coffee cultivars for recommendation in Mozambique as a new frontier of coffee cultivation, and future research is suggested to find develop region-specific lines for different environments.

Author Contributions

Conceptualization, F.L.P., A.I.R.-B., W.P.R. and J.C.R.; formal analysis, N.J.A. and F.L.P.; funding acquisition, J.C.R., A.I.R.-B. and F.L.P.; investigation, N.J.A., F.L.P., Z.A. and S.S.M.; methodology, C.A.K. and F.L.P.; project administration, F.L.P., A.I.R.-B. and J.C.R.; supervision, F.L.P.; visualization, N.J.A., F.L.P., J.C.R., C.A.K. and A.P.V.; writing—original draft, N.J.A., F.L.P., W.P.R. and A.P.V.; writing—review and editing, all authors. All authors have read and agreed to the published version of the manuscript.

Funding

This study was supported by the national funds of Camões—Institute for Cooperation and Language (Portugal), the Brazilian Cooperation Agency (Brazil), and the National Park of Gorongosa (Mozambique), through the Project Gorongosa Café (TriCafé). the Foundation for Support of Research and Innovation of Espírito Santo (FAPES). Portuguese national funding support was also provided by the Foundation for Science and Technology, I.P. (FCT), through the research units UIDB/00239/2020 (CEF) and UIDP/04035/2020 (GeoBioTec), and Associate Laboratory TERRA (LA/P/0092/2020). A grant from CNPq, Brazil, to F. Partelli is also greatly acknowledged.

Data Availability Statement

Data are contained within the article.

Acknowledgments

The Federal University of Espírito Santo—UFES, the Graduate Program in Genetics and Breeding—PPGGM, University of Lisbon, Gorongosa National Park, Conilon Coffee Research Excellence Core, the National Council for Scientific and Technological Development—CNPq, the Brazilian Federal Agency for Support and Evaluation of Graduate Education—CAPES, and the Support Foundation for Research and Innovation of Espírito Santo—FAPES for funding.

Conflicts of Interest

The authors declare no conflict of interest.

References

  1. International Coffee Organization. Available online: https://www.ico.org/new_historical.asp?section=Statistics (accessed on 15 July 2022).
  2. Davis, A.P.; Rakotonasolo, F. Six new species of coffee (Coffea) from northern Madagascar. Kew Bull. 2021, 76, 497–511. [Google Scholar] [CrossRef]
  3. Loureiro, J. Flora Cochinchinensis; Ulyssipone: Typis, et Expensis Academicis: Lisbon, Portugal, 1790. [Google Scholar]
  4. Bridson, D.M.; Polhill, R.M.; Verdcourt, B. “Coffea” in Flora of Tropical East Africa, Rubiaceae; East African Governments: Rotterdam, The Netherlands, 1988; pp. 703–723. [Google Scholar]
  5. Bridson, D.M. “Coffea” in Flora Zambesiaca; Pope, G.V., Ed.; Royal Botanic Gardens, Kew: Richmond, UK, 2003; pp. 452–463. [Google Scholar]
  6. Davis, A.P.; Gargiulo, R.; Almeida, I.N.d.M.; Caravela, M.I.; Denison, C.; Moat, J. Hot Coffee: The Identity, Climate Profiles, Agronomy, and Beverage Characteristics of Coffea racemosa and C. zanguebariae. Front. Sustain. Food Syst. 2021, 5, 740137. [Google Scholar] [CrossRef]
  7. Cassamo, C.T.; Mangueze, A.V.J.; Leitão, A.E.; Pais, I.P.; Moreira, R.; Campa, C.; Chiulele, R.; Reis, F.O.; Marques, I.; Scotti-Campos, P.; et al. Shade and Altitude Implications on the Physical and Chemical Attributes of Green Coffee Beans from Gorongosa Mountain, Mozambique. Agronomy 2022, 12, 2540. [Google Scholar] [CrossRef]
  8. Flávio, F.S.; Júlio, C.F.S.; José, N.M.C.; Milton, M.S. Características das Principais Variedades de Café Cultivadas em Rondônia In Embrapa Centro de Pesquisa Agroflorestal de Rondônia Ministério da Agricultura, Pecuária e Abastecimento; Embrapa: Porto Velho, Brazil, 2004; ISSN 0103-9865. [Google Scholar]
  9. Nantawan, U.; Kanchana-Udomkan, C.; Drew, R.; Ford, R. Identification of genes related to sugar content inCarica papaya L.: Differential expression and candidate marker development. Acta Hortic. 2018, 203, 129–136. [Google Scholar] [CrossRef]
  10. Sakiyama, N.S.; Pereira, A.A.; Zambolim, L. Melhoramento de café arábica. In Melhoramento de Espécies Cultivadas; Borém, A., Ed.; UFV: Viçosa, Brazil, 1999; pp. 189–204. [Google Scholar]
  11. Sant’ana, G.C.; Pereira, L.F.P.; Pot, D.; Ivamoto, S.T.; Domingues, D.S.; Ferreira, R.V.; Pagiatto, N.F.; da Silva, B.S.R.; Nogueira, L.M.; Kitzberger, C.S.G.; et al. Genome-wide association study reveals candidate genes influencing lipids and diterpenes contents in Coffea arabica L. Sci. Rep. 2018, 8, 465. [Google Scholar] [CrossRef]
  12. Hu, F.; Bi, X.; Liu, H.; Fu, X.; Li, Y.; Yang, Y.; Zhang, X.; Wu, R.; Li, G.; Lv, Y.; et al. Transcriptome and carotenoid profiling of different varieties of Coffea arabica provides insights into fruit color formation. Plant Divers. 2021, 44, 322–334. [Google Scholar] [CrossRef]
  13. Ramalho, J.C.; Pais, I.P.; Leitão, A.E.; Guerra, M.; Reboredo, F.H.; Máguas, C.M.; Carvalho, M.L.; Scotti-Campos, P.; Ribeiro-Barros, A.I.; Lidon, F.J.C.; et al. Can Elevated Air [CO2] Conditions Mitigate the Predicted Warming Impact on the Quality of Coffee Bean? Front. Plant Sci. 2018, 9, 287. [Google Scholar] [CrossRef]
  14. Van Der Vossen, H.; Bertrand, B.; Charrier, A. Next generation variety development for sustainable production of arabica coffee (Coffea arabica L.): A review. Euphytica 2015, 204, 243–256. [Google Scholar] [CrossRef]
  15. Santana, L.S.; Ferraz, G.A.e.S.; Teodoro, A.J.d.S.; Santana, M.S.; Rossi, G.; Palchetti, E. Advances in Precision Coffee Growing Research: A Bibliometric Review. Agronomy 2021, 11, 1557. [Google Scholar] [CrossRef]
  16. Rodrigues, W.P.; Martins, M.Q.; Fortunato, A.S.; Rodrigues, A.P.; Semedo, J.N.; Simões-Costa, M.C.; Pais, I.P.; Leitão, A.E.; Colwell, F.; Goulao, L.; et al. Long-term elevated air [CO2] strengthens photosynthetic functioning and mitigates the impact of supra-optimal temperatures in tropical Coffea arabica and C. canephora species. Glob. Chang. Biol. 2016, 22, 415–431. [Google Scholar] [CrossRef]
  17. Machado, C.M.S.; Pimentel, N.S.; Golynsk, A.; Ferreira, A.; Vieira, H.D.; Partelli, F.L. Genetic diversity among 16 genotypes of Coffea arabica in the Brazilian cerrado. Genet. Mol. Res. 2017, 16, gmr16039794. [Google Scholar] [CrossRef] [PubMed]
  18. DaMatta, F.M.; Avila, R.; Cardoso, A.A.; Martins, S.C.V.; Ramalho, J.C. Physiological and Agronomic Performance of the Coffee Crop in the Context of Climate Change and Global Warming: A Review. J. Agric. Food Chem. 2018, 66, 5264–5274. [Google Scholar] [CrossRef] [PubMed]
  19. DaMatta, F.M.; Rahn, E.; Läderach, P.; Ghini, R.; Ramalho, J.C. Why could the coffee crop endure climate change and global warming to a greater extent than previously estimated? Clim. Chang. 2019, 152, 167–178. [Google Scholar] [CrossRef]
  20. Martins, L.D.; Tomaz, M.A.; Lidon, F.C.; DaMatta, F.M.; Ramalho, J.C. Combined effects of elevated [CO2] and high temperature on leaf mineral balance in Coffea spp. plants. Clim. Chang. 2014, 126, 365–379. [Google Scholar] [CrossRef]
  21. Partelli, F.L.; Gomes, W.R.; Oliveira, M.G.; Dias, J.R.M.; Espindula, M.C. Normas foliares e diagnóstico nutricional do cafeeiro na pré-florada e granação. Espirito Santo. Coffee Sci. 2016, 11, 544–554. [Google Scholar] [CrossRef]
  22. Partelli, F.L.; Oliveira, M.G.; Covre, A.M.; Vieira, H.D.; Dias, J.R.M.; Braun, H. Nutritional standards and nutritional diagnosis of the Conilon coffee plants in phenological growth stages. J. Plant Nutr. 2018, 41, 2536–2546. [Google Scholar] [CrossRef]
  23. Oliosi, G.; Partelli, F.L.; Da Silva, C.A.; Dubberstein, D.; Gontijo, I.; Tomaz, M.A. Seasonal variation in leaf nutrient concentration of conilon coffee genotypes. J. Plant Nutr. 2020, 44, 74–85. [Google Scholar] [CrossRef]
  24. Campos, R.C.; Pinto, V.R.A.; Melo, L.F.; da Rocha, S.J.S.S.; Coimbra, J.S. New sustainable perspectives for “coffee wastewater” and other by-products: A critical review. Futur. Foods 2021, 4, 100058. [Google Scholar] [CrossRef]
  25. Bragança, S.M.; Martinez, H.E.P.; Leite, H.G.; Santos, L.P.; Sediyama, C.S.; Alvarez, V.V.H.; Lani, J.A. B, Cu, Fe, Mn & Zn accumulation by Conilon coffee plant. Rev. Ceres 2007, 54, 398–404. [Google Scholar]
  26. Partelli, F.L.; Espindula, M.C.; Marré, W.B.; Vieira, H.D. Dry matter and macronutrient accumulation in fruits of Conilon coffee with different ripening cycles. Rev. Bras. Ciência Solo 2014, 38, 214–222. [Google Scholar] [CrossRef]
  27. Covre, A.M.; Rodrigues, W.P.; Vieira, H.D.; Braun, H.; Ramalho, J.; Partelli, F.L. Nutrient accumulation in bean and fruit from irrigated and non-irrigated Coffea canephora cv. Conilon. Emir. J. Food Agric. 2016, 28, 402–409. [Google Scholar] [CrossRef]
  28. Covre, A.M.; Partelli, F.L.; Bonomo, R.; Gontijo, I. Micronutrients in the fruits and leaves of irrigated and non-irrigated coffee plants. J. Plant Nutr. 2018, 41, 1119–1129. [Google Scholar] [CrossRef]
  29. Larcher, W. Ecologia Vegetal; RiMa Artes e Textos: São Carlos, Brazil, 2000; 531p. [Google Scholar]
  30. Martins, L.; Rodrigues, W.; Machado, S.; Brinate, S.; Colodetti, T.; Amaral, J.; Tomaz, M. Evidence of genetic tolerance to low availability of phosphorus in the soil among genotypes of Coffea canephora. Genet. Mol. Res. 2015, 14, 10576–10587. [Google Scholar] [CrossRef]
  31. Gomes, W.R.; Rodrigues, W.P.; Vieira, H.D.; Oliveira, M.G.; Dias, J.R.M.; Partelli, F.L. Genetic diversity of standard leaf nutrients in Coffea canephora genotypes during phenological phases. Genet. Mol. Res. 2016, 15, gmr.15048839. [Google Scholar] [CrossRef]
  32. Marraccini, P.; Vinecky, F.; Alves, G.S.C.; Ramos, H.J.O.; Elbelt, S.; Vieira, N.G.; Carneiro, F.A.; Sujii, P.S.; Alekcevetch, J.C.; Silva, V.A.; et al. Differentially expressed genes and proteins upon drought acclimation in tolerant and sensitive genotypes of Coffea canephora. Ind. J. Gen. Plant Breed. 2012, 63, 4191–4212. [Google Scholar] [CrossRef] [PubMed]
  33. Santos, H.G.; Jacomine, P.K.T.; Anjos, L.H.C.; Oliveira, V.A.; Lumbreras, J.F.; Coelho, M.R.; Almeida, J.A.; Araujo Filho, J.C.; Oliveira, J.B.; Cunha, T.J.F. Sistema Brasileiro de Classificação de Solos, 5th ed.; Embrapa: Brasília, Brazil, 2018. [Google Scholar]
  34. Silva, F.C. Manual de Análises Químicas de Solos, Plantas e Fertilizantes, 2nd ed.; Embrapa Informação Tecnológica: Brasília, Brazil, 2009; pp. 191–233. [Google Scholar]
  35. Peters, J.B. Wisconsin Procedures for Soil Testing, Plant Analysis and Feed & Forage Analysis: Plant Analysis; Department of Soil Science, College of Agriculture and Life Sciences, University of Wisconsin-Extension: Madison, WI, USA, 2005; Available online: https://uwlab.soils.wisc.edu/files/procedures/plant_icp.pdf (accessed on 20 February 2014).
  36. Martins, M.Q.; Partelli, F.L.; Ferreira, A.; Bernardes, C.D.O.; Golynski, A.; Vieira, H.D.; Freitas, M.S.M.; Ramalho, J.C. Genetic variability on nutrient contents in Coffea canephora genotypes cultivated at 850 meters of altitude in two crop seasons. Funct. Plant Breed. J. 2019, 1, 1–12. [Google Scholar] [CrossRef]
  37. dos Santos, M.M.; da Silva, C.A.; Oza, E.F.; Gontijo, I.; Amaral, J.F.T.D.; Partelli, F.L. Concentration of Nutrients in Leaves, Flowers, and Fruits of Genotypes of Coffea canephora. Plants 2021, 10, 2661. [Google Scholar] [CrossRef]
  38. Brazil Ministério da Agricultura, Pecuária e Abastecimento. Regras Para Análise de Sementes. 2009. Available online: https://www.gov.br/agricultura/pt-br/assuntos/insumos-agropecuarios/arquivos-publicacoes-insumos/2946regrasanalisesementes.pdf/view (accessed on 17 April 2023).
  39. Cruz, C.D. Programa Genes—Ampliado e integrado aos aplicativos R, Matlab e Selegen. Acta Sci. Agron. 2016, 38, 547–552. [Google Scholar] [CrossRef]
  40. Gu, Z.; Gu, L.; Eils, R.; Schlesner, M.; Brors, B. circlize implements and enhances circular visualization in R. Bioinformatics 2014, 30, 2811–2812. [Google Scholar] [CrossRef]
  41. Singh, D. The relative importance of characters affecting genetic divergence. Ind. J. Gen. Plant Breed. 1981, 41, 237–245. [Google Scholar]
  42. Schmidt, R.; da Silva, C.A.; Dubberstein, D.; Dias, J.R.M.; Vieira, H.D.; Partelli, F.L. Genetic Diversity Based on Nutrient Concentrations in Different Organs of Robusta Coffee. Agronomy 2022, 12, 640. [Google Scholar] [CrossRef]
  43. Yan, L.; Ogutu, C.; Huang, L.; Wang, X.; Zhou, H.; Lv, Y.; Long, Y.; Dong, Y.; Han, Y. Genetic Diversity and Population Structure of Coffee Germplasm Collections in China Revealed by ISSR Markers. Plant Mol. Biol. Rep. 2019, 37, 204–213. [Google Scholar] [CrossRef]
  44. Castro, R.D.; Marraccini, P. Cytology, biochemistry and molecular changes during coffee fruit development. Braz. J. Plant Physiol. 2006, 18, 175–199. [Google Scholar] [CrossRef]
  45. Partelli, F.L.; Oliosi, G.; Dalazen, J.R.; da Silva, C.A.; Vieira, H.D.; Espindula, M.C. Proportion of ripe fruit weight and volume to green coffee: Differences in 43 genotypes of Coffea canephora. Agron. J. 2021, 113, 1050–1057. [Google Scholar] [CrossRef]
  46. Prezotti, L.C.; Bragança, S.M. Accumulation of dry mass, N, P and K in different genetic sources of Conilon coffee. Coffee Sci. 2013, 8, 284–294. [Google Scholar]
  47. Gomes, P.F. Curso de Estatística Experimental, 12th ed.; Livraria Nobel: Piracicaba, Brazil, 1985; 467p. [Google Scholar]
Figure 1. Dissimilarity dendrogram for nine Coffea arabica cultivars, grouped by UPGMA, using Mahalanobis’ generalized distance. Co-phenetic correlation: 0.8332.
Agronomy 13 01162 g001
Figure 2. Concentration of macronutrients (A) and micronutrients (B) in the bean of nine Coffea arabica cultivars grown in Gorongosa National Park, Mozambique. For each parameter, the mean values ± SE (n = 4) followed by different letters indicate significant differences between cultivars (a, b, c, d, e).
Agronomy 13 01162 g002
Figure 3. Concentration of macronutrients (A) and micronutrients (B) in the husk of nine Coffea arabica cultivars grown in Gorongosa National Park, Mozambique. For each parameter, the mean values ± SE (n = 4) followed by different letters indicate significant differences between cultivars (a, b, c, d).
Agronomy 13 01162 g003
Figure 4. Concentration of macronutrients (A) and micronutrients (B) in the leaves of nine Coffea arabica cultivars grown in Gorongosa National Park, Mozambique. For each parameter, the mean values ± SE (n = 4) followed by different letters indicate significant differences between cultivars (a, b).
Agronomy 13 01162 g004
Table 1. Chemical and granulometric characteristics of the soil of the experimental area of Gorongosa Mountain, Gorongosa National Park, Sofala, Mozambique.
Chemical PropertiesResults
M.O.Organic matter (Oxy-Red.)dag/dm35.5
Ph(water—ratio 1:2.5)unit5.1
P(Mehlich−1)mg/dm38.4
K(Mehlich−1)mg/dm380
Ca(Kcl−1 mol/L)cmolc/dm31.2
Mg(Kcl−1 mol/L)cmolc/dm30.4
Al(Kcl−1 mol/L)cmolc/dm30.6
H + Al(Calcium acetate)cmolc/dm311
S.B.(Sum of bases)cmolc/dm31.81
C.T.C.(Cation exchange capacity at pH = 7)cmolc/dm312.81
V%(Base saturation)%14
%K C.T.C(%K at CTC)%2
%Ca C.T.C(%Ca at CTC)%9
%Mg C.T.C.(%Mg at CTC)%3
%Al C.T.C.(%Al at CTC)%4.7
%H+Al C.T.C.(%H + Al at C.T.C.)%86
P (Resin) mg/dm313.6
P-rem(Remaining phosphorus)mg/L13
Na(Mehlich−1)mg/dm33
S(Monocalcium acetic phosphate)mg/dm322
B(Hot water)mg/dm30.2
Zn(Mehlich−1)mg/dm31.4
Mn(Mehlich−1)mg/dm330.6
Cu(Mehlich−1)mg/dm34.9
Fe(Mehlich−1)mg/dm328
Granulometric fractions (g kg−1)
Sand
Silt
Clay
Soil typeClayish
Table 2. Identification of the nine Coffea arabica L. cultivars, grown in the Gorongosa Mountain, Gorongosa National Park. Sofala, Mozambique.
IdentificationNameMAPA Registration NumberMaturation SeasonProductivity
1Catuaí Vermelho IAC 442929Medium and lateHigh
2Catucaí Amarelo 2SL4915MediumHigh
3Catuaí Amarelo IAC 392937LateHigh
4Catucaí 785-154996PrecociousHigh
5Catucaí Vermelho 19/84909PrecociousHigh/Medium
6Catuaí Vermelho IAC 812932MediumHigh
7Acauã4995LateHigh
8Catimor 128
9Called Costa Rica
So far, the cultivars Catimor 128 and Costa Rica have not been registered by the Brazilian Ministry of Agriculture, Livestock and Food Supply (MAPA).
Table 3. Relative contribution of bean, husk, leaves, fruit characteristics, and nutrient concentration and accumulation in nine Coffea arabica L. cultivars grown in the mountain region of the Gorongosa National Park, Sofala, Mozambique, according to Singh’s method [41], based on the Mahalanobis generalized distance (D2).
VariableS.jValue (%)Cumulative Value (%)
B5559.1244.4544.45
Fe2573.0320.5865.03
S1310.8410.4875.51
Bean weight839.466.7182.22
K614.214.9187.13
Mn482.873.8691.00
Mg278.872.2393.23
%Bean269.012.1595.38
ripe Kg214.371.7197.09
P145.691.1798.26
N101.210.8199.07
Ca70.370.5699.63
Cu23.630.1999.82
Zn20.870.1799.98
Fruit weight2.020.02100.00
S.j: value proposed by Singh [41].
Table 4. Clusters of the variables of coffee bean, husk, fruits and leaves, and nutrient concentration and accumulation in nine Coffea arabica L. cultivars, grown in the Gorongosa Mountain, Gorongosa National Park, Sofala, Mozambique, grouped by the Tocher method and Mahalanobis generalized distance (D2), with an average distance between the clusters of 362.9995.
GroupsCultivars
ICatuaí Vermelho IAC 81, Acauã, Catuaí Amarelo IAC 39, Catucaí 785-15, Catucaí Amarelo 2SL, Catucaí Vermelho 19/8, Catimor 128, Costa Rica
IICatuaí Vermelho IAC 44
Table 5. Characteristics of ripe and dried fruit and coffee bean in nine Coffea arabica cultivars, grown on the Gorongosa Mountain, Gorongosa National Park, Sofala, Mozambique.
CultivarsBHDBWRFWDFWRFW/
DFW
RFW/
DBW
Ripe Fruit Weight/ton of BeanRipe Fruit Weight/60 kg of BeanDry Fruit Weight/ton of Bean
%%ggG kg−1kg−1ton−1
Catuaí Vermelho IAC 4462.2 a 37.8 a0.17 ab1.60 ab0.50 ab3.21 b5.16 a5166 a310 a1608 a
Catucaí Amarelo 2SL59.9 a40.1 a0.13 c1.34 c0.41 c3.24 ab5.41 a5415 a325 a1671 a
Catuaí Amarelo IAC 3961.5 a38.5 a0.15 abc1.50 bc0.47 ab3.13 b5.09 a5096 a306 a1628 a
Catucaí 785-1561.5 a38.5 a0.15 bc1.46 bc0.44 bc3.24 ab5.28 a5282 a317 a1629 a
Catucaí Vermelho 19/860.9 a39.1 a0.15 bc1.54 abc0.47 abc3.27 ab5.39 a5398 a324 a1648 a
Catuaí Vermelho IAC 8161.1 a38.9 a0.16 ab1.57 abc0.49 ab3.15 b5.18 a5182 a311 a1640 a
Acauã 62.9 a37.1 a0.17 ab1.64 ab0.51 ab3.21 b5.11 a5111 a307 a1589 a
Catimor 12862.5 a37.5 a0.18 a1.77 a0.52 a3.35 ab5.36 a5360 a322 a1601 a
Costa Rica61.7 a38.3 a0.15 bc1.61 ab0.46 abc3.44 a5.58 a5586 a335 a1623 a
CV (%)3.745.996.216.175.412.834.734.734.733.76
For each parameter, the means followed by different letters indicate significant differences between cultivars (a, b, c). CV: coefficient of variation; B: % bean in the fruit; H: % husk in the fruit; DBW: weight of one bean 11%MC; RFW: ripe fruit weight; DFW: dry fruit weight 11%MC; RFW/DFW: ratio ripe fruit weight/dry fruit weight; RFW/DBW: ratio ripe fruit weight/dry bean weight; Ripe fruit weight per ton of bean: ripe fruit weight/ton of bean 11%MC; Ripe fruit weight per 60 kg bag: weight of ripe fruit per 60 kg of bean 11%MC; Ripe coffee per ton of processed bean: dry coffee per ton of bean 11%MC.
Table 6. Nutrients accumulated in the fruit of nine Coffea arabica cultivars, grown in the Gorongosa Mountain region, Gorongosa National Park, Sofala, Mozambique.
CultivarsMacronutrientsMicronutrients
NPKCaMgSCuFeMnZnB
(g kg−1)(mg kg−1)
Fruit
Catuaí Vermelho IAC 4427.3 b2.15 ab26.3 ab5.74 a2.40 ab3.62 b20.8 a195.5 a110.3 a19.9 a63.4 a
Catucaí Amarelo 2SL28.5 ab2.46 a27.1 ab5.63 a2.59 ab4.17 ab22.7 a149.2 ab125.1 a 17.7 a41.3 b
Catuaí Amarelo IAC 3927.2 b2.22 ab25.5 b5.06 a2.38 ab4.32 ab20.1 a129.2 b116.3 a 16.7 a37.6 b
Catucaí 785-1526.7 b2.35 ab26.0 ab5.19 a2.43 ab4.60 ab19.8 a124.8 b103.9 a 17.8 a36.5 b
Catucaí Vermelho 19/832.1 a2.22 ab25.8 b5.48 a2.47 ab4.84 ab20.9 a112.8 b123.0 a 15.0 a34.0 b
Catuaí Vermelho IAC 8128.6 ab2.24 ab27.9 ab5.41 a2.63 ab5.24 a24.1 a127.8 b115.3 a 17.7 a36.7 b
Acauã 28.1 ab2.12 b25.3 b5.03 a2.26 b5.11 a20.4 a108.8 b105.3 a 14.6 a36.8 b
Catmor 12828.5 ab2.14 ab25.6 b5.81 a2.31 ab5.08 a20.2 a109.8 b137.1 a 16.2 a34.7 b
Costa Rica29.7 ab2.21 ab30.1 a6.10 a2.82 a 5.28 a22.8 a140.2 ab143.1 a 19.2 a57.3 a
CV (%)6.416.096.529.48.6510.988.9618.418.014.210.5
For each parameter, the means followed by different letters indicate significant differences between cultivars (a, b).
Table 7. Spearman correlation matrix between nutrient accumulation in bean, husk, fruit, husk percentage, bean percentage, fruit weight, and bean weight in nine Coffea arabica cultivars, grown in the Gorongosa Mountain region, Gorongosa National Park, Sofala, Mozambique.
VariablesNutrients
NPKCaMgSCuFeMnZnB
Bean × Husk0.64 *−0.23−0.300.71 *0.380.540.150.380.500.6 *−0.55
Bean × NAB1 ***1 ***1 ***1 ***1 ***1 ***0.99 ***1 ***1 ***1 ***1 ***
Bean × NAH0.28−0.18−0.490.550.60 *0.270.000.420.220.48−0.56
Bean × NAF0.82 **0.180.230.80 **0.96 ***0.95 ***0.570.93 ***0.83 **0.83 **0.35
Bean × %Bean0.09−0.180.66 *0.30−0.69 *0.310.40−0.120.120.080.55
Bean × %Husk−0.090.18−0.66 *−0.300.69 *−0.31−0.400.12−0.12−0.08−0.54
Bean × Fruit weight0.29−0.350.370.11−0.65 *0.290.33−0.360.12−0.060.05
Bean × Bean weight0.14−0.310.470.29−0.66 *0.300.44−0.280.110.180.09
Husk × %Husk0.390.60 *0.39−0.240.64 *−0.060.75 **0.180.340.040.54
Husk × NAH0.85 **0.99 ***0.83 **0.80 **0.86 **0.85 **0.98 ***0.98 ***0.87 **0.92 ***1 ***
Husk × NAF0.91 ***0.75 **0.560.90 ***0.550.71 *0.83 **0.550.88 **0.93 ***0.47
Husk × %Bean−0.39−0.6 *−0.390.24−0.64 *0.06−0.75 **−0.18−0.34−0.04−0.54
Husk × Bean weight−0.29−0.60 *−0.290.39−0.440.12−0.59 *−0.20−0.39−0.31−0.33
Husk × Fruit weight−0.22−0.66 *−0.270.34−0.520.16−0.54−0.35−0.29−0.47−0.37
NAF × NAH0.73 *0.80 **0.520.9 **0.68 *0.470.77 **0.580.68 *0.86 **0.44
NAF × %Bean−0.3−0.90 ***−0.430.03−0.65 *0.24−0.38−0.35−0.17−0.090.14
NAF × %Husk0.30.80 **0.43−0.030.65 *−0.240.380.350.170.09−0.14
NAF × Fruit weight0.01−0.83 **−0.49−0.03−0.64 *0.22−0.13−0.48−0.11−0.40−0.19
NAF × Bean weight−0.097−0.80 **−0.360.06−0.60 *0.22−0.18−0.42−0.19−0.19−0.14
NAH × %Bean−0.66 *−0.63 *−0.75 **−0.23−0.90 ***−0.44−0.84 **−0.24−0.69 *−0.26−0.55
NAH × %Husk0.66 *0.63 *0.75 **0.230.90 ***0.440.84 **0.240.69 *0.260.55
NAH × Fruit weight−0.49−0.70 *−0.54−0.18−0.70 *−0.19−0.54−0.41−0.50−0.58−0.39
NAH × Bean weight−0.49−0.62 *−0.62 *−0.15−0.68 *−0.25−0.62 *−0.25−0.63 *−0.49−0.33
%Bean × %Husk−1 *
%Bean × Fruit weight0.73 *
%Bean × Bean weight0.80 **
%Husk × Fruit weight−0.73 *
%Husk × Bean weight−0.80 **
Fruit weight × Bean weight0.96 ***
Values in blue and red mean significant positive and negative correlations, respectively * p <0.05, ** p <0.01, *** p <0.001. %Bean: bean percentage; %Husk: husk percentage; NAB: total nutrient accumulation in beans; NAH: total nutrient accumulation in the husk; NAF: total nutrient accumulation in the fruits.
Disclaimer/Publisher’s Note: The statements, opinions and data contained in all publications are solely those of the individual author(s) and contributor(s) and not of MDPI and/or the editor(s). MDPI and/or the editor(s) disclaim responsibility for any injury to people or property resulting from any ideas, methods, instructions or products referred to in the content.

