Article

Modeling Soil Organic Carbon Dynamics of Arable Land across Scales: A Simplified Assessment of Alternative Management Practices on the Level of Administrative Units

1
Helmholtz Centre for Environmental Research GmbH-UFZ, Department of Computational Landscape Ecology, 04318 Leipzig, Germany
2
Helmholtz Centre for Environmental Research GmbH-UFZ, Department of Soil System Science, 06120 Halle (Saale), Germany
*
Author to whom correspondence should be addressed.
Agronomy 2023, 13(4), 1159; https://doi.org/10.3390/agronomy13041159
Submission received: 23 March 2023 / Revised: 17 April 2023 / Accepted: 18 April 2023 / Published: 19 April 2023
(This article belongs to the Section Precision and Digital Agriculture)

Abstract

:
Regional assessments of soil organic carbon (SOC) trends and the carbon sequestration potential of alternative management practices (AMP) are highly relevant for developing climate change mitigation strategies for the agricultural sector. Such studies could benefit from simplified SOC modeling approaches on the scale of administrative units as this often corresponds to the level of policy-making and data availability. However, there is a risk of systematic errors in such scaling operations. To overcome this problem, we performed a scaling experiment where we simulated the SOC dynamics of the arable soils of the State of Saxony (Germany) across a series of scales using the CANDY Carbon Balance (CCB) model. Specifically, we developed model set-ups on four different administrative levels (NUTS1, NUTS2, NUTS3, and LAU) and evaluated the simulation results of the upscaled models against a 500 m grid-based reference model. Furthermore, we quantified the carbon sequestration potential of selected AMP scenarios (addressing field grass, cover crops, and conservation tillage) across all scales. The upscaled model set-ups adequately simulated the SOC trends of Saxon arable land compared to the grid-based reference simulation (scaling error: 0.8–3.8%), while providing significant benefits for model application, data availability and runtime. The carbon sequestration potential of the AMP scenarios (1.33 Mt C until 2050) was slightly overestimated (+0.07–0.09 Mt C) by the upscaled model set-ups. Regardless of the scale of model set-up, we showed that the use of aggregated statistical input data could lead to a systematic underestimation of SOC trends. LAU and NUTS3 levels were shown to be a suitable compromise for effectively quantifying SOC dynamics and allowed for an acceptable spatial prioritization of AMPs. Such simplified, scale-adapted assessments are valuable for cross-regional comparisons and for communication to and among decision-makers, and might provide a quantitative basis for discussions on the effectiveness of AMPs in various stakeholder processes.

1. Introduction

Soil organic carbon (SOC) is an important contributor to global carbon cycles, and increasing the carbon storage in soils could contribute to climate change mitigation [1]. The importance of this positive impact is underlined by the “4 per 1000” initiative that has been launched at the COP 21 [2,3]. This initiative aims to demonstrate that agricultural soils can play a crucial role in food security and climate change, stimulating current discussions about the feasibility of CO2 certificates for carbon sequestration in soils [4,5]. Political, socio-economic and environmental drivers affect the carbon storage of agricultural soils by changing carbon turnover conditions (e.g., climate change and choice of tillage system) or the amount of carbon influx into soil (e.g., from cultivated crops and organic amendments from livestock or biogas plants) [6]. The scale of origin and impact of these drivers can be very different. Developing scale-adequate strategies for managing and fostering SOC storage thus requires an assessment of the impact of different drivers and measures across various scales as well. This is also important for reaching targeted communication, as a scale-adapted view would ease discussion between different groups of stakeholders [7].
Consistent approaches are thus needed that could be used for assessing the effects of specific drivers and measures on SOC over different scales and thus be able to be locally adapted and prioritize specific targets or measures. Ideally, such an approach should be easily applicable and allow quantitative assessments, at least on most of the scales that are relevant for policy and environmental management. Hierarchical administrative units could be an important basis for scaling levels [8]. Although administrative units typically do not have a relation to environmental processes such as carbon sequestration, they are essential in terms of external drivers and data [9]. They have their own sets of policies, are relevant in a variety of planning processes and are often used for cross-regional comparison and communication. Furthermore, most of the relevant statistical datasets are maintained and provided on the level of administrative units.
A prominent example for such administrative units are the European ‘Nomenclature of Territorial Units for Statistics’ (NUTS) and ‘Local Administrative Units’ (LAU). The current classification of Europe lists four levels of administrative units: NUTS1 (92 regions), NUTS2 (244 regions), NUTS3 (1215 regions) and LAU (99,387 regions) [10]. Several studies that developed spatially distributed estimations of SOC stocks on regional to large scales at least partly made use of input datasets that were aggregated on those administrative levels [11,12,13,14]. Lugato et al. [12], for example, estimated the SOC stocks of agricultural soils across Europe using NUTS3 and NUTS2 level statistics on agricultural land-use and management in the agro-ecosystem SOC model CENTURY. Kaczynski et al. [14] modeled the regional SOC trends of a 1800 km2 case study area using the Rothamsted C model (RothC) and LAU level information on agricultural management. Farina et al. [15] used statistical datasets (e.g., on crop yields) for the spatially distributed modeling of SOC stock changes and CO2 emissions in Southern Italy using the RothC10N model and RothCIS tool. Additionally, outside of Europe, statistical input data on administrative levels are often used without an alternative for SOC modeling. Begum et al. [16], for example, estimated the regional carbon sequestration potentials of rice cropland on the level of 64 districts of Bangladesh using the model DayCent because most of the information available was on the district level.
For many of the existing large-scale simulations of SOC stocks and trends, the scalability of the quantitative approaches is sparsely tested. Due to a lack of data, different datasets with varying spatial resolutions are often combined in a high-resolution model set-up. This raises two important questions: (1) does the use of aggregated input data (such as agricultural parameters on the NUTS level) lead to systematic errors in the modeled SOC dynamic? (2) is it reasonable (for certain research questions) to model SOC dynamics directly on the level of administrative units and thus make use of the various benefits such an upscaled approach promises to provide? To the best of our knowledge, this paper is the first study that explicitly addresses those questions and presents a scaling experiment for the assessment of alternative management practices on arable land, which could provide important insights for regional SOC management.
We simulated the current stocks and trends in SOC for the arable soils of the State of Saxony (NUTS 1 region in Eastern Germany) using five different model set-ups. In the first four set-ups, the spatial resolution of the models and all input data were scaled to the four administrative levels of Europe (LAU, NUTS3, NUTS2, and NUTS1). The fifth set-up was a 500 m grid-based reference model of the arable land of Saxony [17] that was used to evaluate the simulation quality of the upscaled model set-ups. Furthermore, we selected two alternative management practices (AMP) for our scaling experiment that are in line with Saxony’s policy efforts and assessed their effects on all of the mentioned scales. Specifically, the AMPs addressed policies that aim to increase the share of grass mixtures in the fodder system and prevent soil erosion by increasing the use of winter cover crops and conservation tillage [18]. On all of the five scales considered in this study, the same model approach as well as the type and source of input data were used, but all set-ups had their own spatial resolution of input data. We expect that such simplified and scale-adapted assessments of different drivers, measures and pathways could be valuable for political, economic and environmental considerations as well as easing applicability and communication.

2. Materials and Methods

2.1. Study Area

The Federal State of Saxony is a NUTS1 region in Eastern Germany (Figure 1), which is dominated by agricultural land-use (52%). The arable areas (7330 km2) are managed rather intensively due to the fertile soils (esp. loamy silt and sandy silt) and accordingly high yield potential. However, three “agro-economic regions” can be distinguished which are characterized by quite different agricultural activities, landscape characteristics and soils [19]: (1) the heath landscape in the north/north-east, (2) the loess region in the center, and (3) the low mountain range in the south/south-west of Saxony. A detailed characterization of these regions is given in Table S1 (Supplementary Materials). The climate is temperate, but the lowlands (8–10 °C; 500–800 mm) are considerably drier and milder than the low mountain range (6–8 °C; 900–1200 mm). The most important crops cultivated in Saxony are different types of cereals (esp. winter wheat, winter barley, winter rye, and triticale) as well as winter oilseed rape and silage maize.

2.2. Modeling Approach

2.2.1. CCB Model

The CCB model (CANDY Carbon Balance; [20]) is a simplified version of the CANDY model (CArbon and Nitrogen DYnamics; [21,22]) and requires less input data because it was developed for practice-oriented research questions. It has been validated over various site conditions and cropping systems in Europe and applied in several case studies, especially in Germany and Austria [17,20,23,24,25,26,27,28,29,30,31,32]. CCB was selected for this study as it is capable to simulate in a specific regional mode [17], in which the model can be driven by proportional coverages and area averages of different management activities (cropping, tillage, fertilization, etc.) in any kind of spatial modeling unit (e.g., field, farm, pixel, or municipality). The ability to use common input data such as crop share statistics is essential for being able to model directly on the level of administrative units.
CCB simulates carbon dynamics in annual time steps considering three different pools of soil organic matter (SOM) (active, stabilized, and long-term stabilized) as well as a set of pools for fresh organic matter (FOM). FOM pools are differentiated by the origin of the organic substances, specifically organic amendments (e.g., slurry), crop by-products (e.g., straw) and crop residues (e.g., roots). The simulation of carbon turnover is controlled by land management and site conditions. To quantify turnover conditions, CCB uses the ‘Biological Active Time (BAT)’ approach [33], which provides an absolute measure that considers soil physical parameters, climate (precipitation and temperature) and information on tillage systems. In CCB, the decomposition of FOM results in a ‘soil carbon reproduction flux’ (Crep), which recreates SOM. The calculation of Crep considers the properties of the FOM and allows the calculation of an integrated value across all different FOM sources. A detailed description of CCB’s pools and fluxes is given by Franko et al. [20] and in Figure S1 (Supplementary Materials).
The indicators BAT and Crep can be used to describe and compare the state and development of SOC across different sites or regions [34]. Their usage in CCB allows for and simplifies the scalability of model set-ups. The spatially upscaled model set-ups in our study should have a similar amount of Crep and BAT as the reference model.

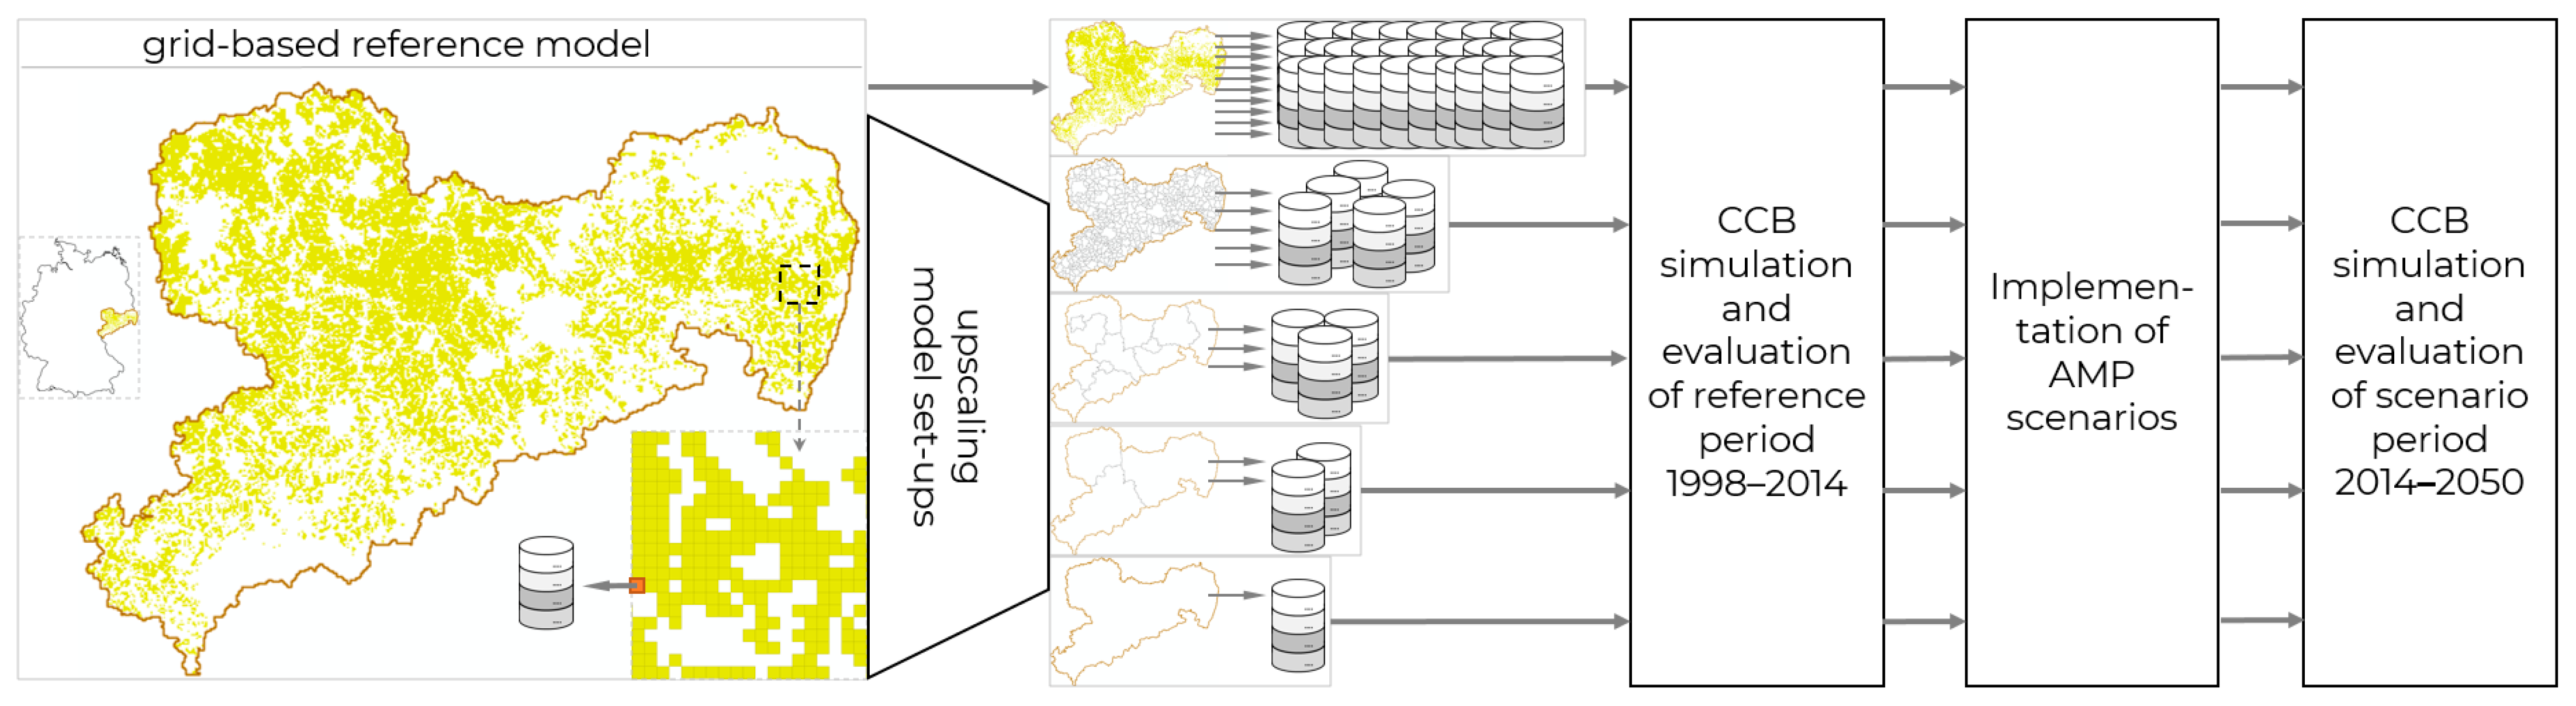
2.2.2. Reference Model Set-Up

The basis of our scaling experiment was a grid-based CCB model set-up for the arable soils of Saxony that uses the best information available to local public authorities of agriculture and water sectors, including inter alia field-discrete cultivation data [17]. The grid-based reference model was developed by Witing et al. [17] and introduced a ‘regional-mode’ of the CCB model, which allows the handling of various spatially and temporally aggregated input datasets related to agricultural management and climate. The results of this reference model are used to evaluate the performance of a second set of CCB models that are set-up with aggregated input data (as described below). The reference model was set-up on a 500 m grid and included 29,319 modeling units (Figure 1), where each unit had a specific parameterization of soil, climate and agricultural management. Soil properties were derived from the soil map series of Saxony [35], climate data originated from the regional climate information system ReKIS (www.rekis.org) and cultivation data (crops, yields, tillage systems, fertilizer, etc.) were based on field-scale IACS (Integrated Administration and Control System) data and regional statistics at the municipality level. Data on agricultural management were available for five time periods (2000, 2005, 2010, 2011 and 2012) and stayed constant between two periods. The simulation period covered 17 years between 1998 and 2014. More details on the set-up of the reference model are given by Witing et al. [17]. The initialization of SOC levels was updated in accordance with the approach of Drexler et al. [36], which provides typical organic matter contents for the agricultural soils of Germany based on land-use, soil texture, C/N ratio and annual precipitation (for more details, see Supplementary Materials, Explanation S1).

2.3. Upscaling of Model Set-Ups, Agricultural Parameters, Climate and Soils

The case study region Saxony is a NUTS1, unit and its further administrative division includes 3 NUTS2 units, 13 NUTS3 units and 414 LAU units [10]. A large set of environmental and agricultural statistics relevant for SOC modeling is available especially on the level of NUTS regions, either provided by Eurostat [37,38] or in the statistical reports of the individual administrative units (e.g., [39] for Saxony). However, within our study we did not directly use those statistics, but aggregated the more detailed input data of our grid-based reference model to the level of administrative units. We thus mimicked the procedure of creating agricultural census data, which typically aggregate the information of smaller reporting units. In doing so, we excluded the potential quality issues of different publicly available datasets and focused our analysis on the effects that may arise when upscaling model set-ups.
The spatial references for the data aggregation procedure were the NUTS and LAU boundaries of the year 2016 [40] (©EuroGeographics for the administrative boundaries). Based on a spatial overlay, each of the 29,319 grid-based modeling units of the reference model were assigned to a specific administrative unit. This was carried out for all four administrative levels. Subsequently, for each input dataset of the reference model, an aggregation operation was conducted. Agricultural parameters were aggregated using the area-weighted mean of the grid-based datasets within one administrative unit, specifically considering the harvest areas and yields of 20 crop types, cultivation of cover crops, management of crop by-products, tillage systems, and fertilizer applications. As the “regional mode” of CCB is capable of processing area shares of crops and management operations [17], the results of the input data aggregation could be directly used in the upscaled model set-ups. With respect to climate data, the area-weighted mean was calculated from the 500m grid for the annual mean temperature and annual precipitation. In contrast to agricultural management and climate, soil texture is rather constant and is barely changed by management and other external drivers other than erosion. Furthermore, soil texture and the related soil physical properties are important drivers of SOC storage [41]. Thus, we kept all of the existing soil types and did only aggregate the shares of different soil types within one administrative unit. In the CCB model set-ups, each soil type of an administrative unit was thus considered as an own modeling unit, but could be seen as a property of that administrative unit without spatial reference. Accordingly, all soil types within one administrative region received the same input data on agricultural management and climate. For the initialization of SOC levels, the same approach that is used in the reference model was applied [36]. Table S2 (Supplementary Materials) provides a descriptive summary of the aggregation procedure for all relevant datasets.

2.4. Alternative Management Practices

We simulated two alternative management practices (AMPs) on all the five scales considered in this study (500 m grid, LAU, NUTS3, NUTS2, and NUTS1). Both AMPs are in line with current policy efforts in Saxony, which are aimed at increasing the share of grass mixtures in the fodder system, and preventing soil erosion by increasing the use of cover crops and conservation tillage [18,42]. These alternative management practices were selected to analyze the sensitivity and suitability of the upscaled model set-ups regarding two different types of processes—the input and turnover of soil-related carbon. The scenario assumptions of both AMPs are summarized in Table 1.
To address the changes in carbon input, we considered an increase in field grass cultivation, based on a reduction of silage maize and winter fodder barley as well as an increased use of winter cover crops on areas that are cultivated by summer crops (silage maize, sugar beet, and summer barley). In order to enable the comparability of the AMP-1 scenario across all model set-ups, we applied relative changes to the mix of cultivated crops of each modeling unit of each model set-up. Specifically, the areas cultivated with silage maize and winter fodder barley were reduced by 35% within each modeling unit (e.g., from 100 ha to 65 ha), which led to absolute changes on the level of Saxony shown in Table 1. Accordingly, the absolute share of field grass cultivation increased by 8.3% in the first AMP scenario. Furthermore, the absolute share of areas under cover crop cultivation in Saxony was increased by 10%, which ensured winter soil coverage of nearly all areas under summer crop cultivation within the AMP-1 scenario.
As a second alternative management practice (AMP-2), an increase in conservation tillage was parameterized, which changed the turnover conditions of fresh and soil organic matter. Specifically, 30% of the areas with conventional soil management were converted into minimum tillage areas within each modeling unit, which led to a total increase in conservation tillage of 18.9% for Saxony (Table 1). The simplified scenario assumptions are meant to represent a “moderate” degree of AMP implementation with the main objective of testing the scaling experiment of this study.
For implementing the AMP scenarios into the models, we adapted the management parameterization of the year 2014 within all five model set-ups and simulated this setting for 37 years (2014–2050). The final year of the scenario runs was set to be 2050 as this is the target year for reaching net-zero emissions adopted by the IPCC [43] and the European Green Deal [44]. To have a clear baseline, the original 2014 parameterization was applied to this simulation period as well. This ‘business-as-usual’ (BAU) scenario served as a basis for comparing the effects of the two alternative management practices. All other parameterizations including climate were kept and repeated during the scenario runs.

2.5. Model Application, Post-Processing and Evaluation

In total, 15 different models were set-up, considering the aforementioned five scales (500 m grid, LAU, NUTS3, NUTS2, and NUTS1) as well as three scenarios (BAU, AMP-1, and AMP-2) for each scale. All model set-ups were pre- and post-processed using the R statistical software [45], and the simulations were carried out using CCB version 20.16.2.26. The results of the grid-based reference models were aggregated to the level of administrative units and compared to the results of the upscaled model set-ups. Due to the concept and structure of CCB, all soil types of an administrative unit were modeled individually in the upscaled model set-ups and the related carbon stocks were aggregated during post-processing. Both AMP scenarios were related to the BAU scenario to extract the AMP driven effects from the overall trends in SOC of the period 2014–2050. All analyses were carried out for the case study of Saxony as a whole as well as for all spatial units of the upscaled model set-ups. To identify the drivers behind potential scaling errors, a series of correlation analyses were conducted considering CCB internal indicators (Crep and BAT), soil properties as well as different datasets that had been aggregated within the upscaling process (e.g., climate parameters and tillage systems). Specifically, spatial dispersion parameters (the regional standard deviation) of the mentioned predictors were used. The analysis of the CCB databases as well the visualization of the results were carried out in R using the packages ggplot2 [46], ggthemes [47], PerformanceAnalytics [48], PupillometryR [49], raster [50], reshape2 [51], RODBC [52], scales [53] and viridis [54].

3. Results

3.1. Comparing Model Complexities and Overall Trends in SOC Dynamics

The case region of Saxony (NUTS1 region) represents the main spatial reference unit of this study. Table 2 provides an overview of the five model set-ups for Saxony and the SOC dynamics simulated with different input data sets for the reference period (1998–2014). The differences in model complexity were substantial between the five set-ups, as demonstrated by the number of modeling units that ranged between 49 and 29,319. Only for the grid-based approach, the number of modeling units was equal to the number of spatial units, as in this set-up a spatially explicit soil type, agricultural management and climate data set was assigned to each grid cell. The upscaled set-ups considered the distribution of soil types in each spatial unit (without their exact location; see Section 2.3) and an averaged climate and agricultural management condition. Obviously, the number of soil types per administrative region increases with larger administrative levels. While each LAU included 4.8 different soil types on average, this number was already 18.1 for each NUTS3 unit and up to 49 for the NUTS1 level of Saxony. The difference in model complexity can also be described by database sizes and the computation time of the respective model set-ups, which ranged between 7–467 megabytes and from a few seconds to several hours, respectively, on a standard personal computer. The initialization of soil carbon levels was similar for all levels of aggregation and only minor deviations to the grid-based model set-up were observed (Table 2).
Despite the differences in model complexity, the simulated SOC trends of the case study region as a whole were very similar across all model set-ups. All models predicted a carbon sequestration level in the Saxon arable soils of about 2.6 Mt C (+/−0.05 Mt C) for the reference period (1998–2014). This equals to an overall annual increase in carbon storage of 205–213 kg C ha−1 y−1 or 3.6–3.8‰ when related to the SOC stocks of the model initialization. However, we could observe that all model set-ups using aggregated input data showed an underestimation of the simulated SOC trends when compared to the grid-based reference simulation. While the LAU-level simulation was still close to the reference simulation (−0.8%), the stronger upscaled simulations showed more significant deviations of up to −3.8% for the NUTS2 set-up.

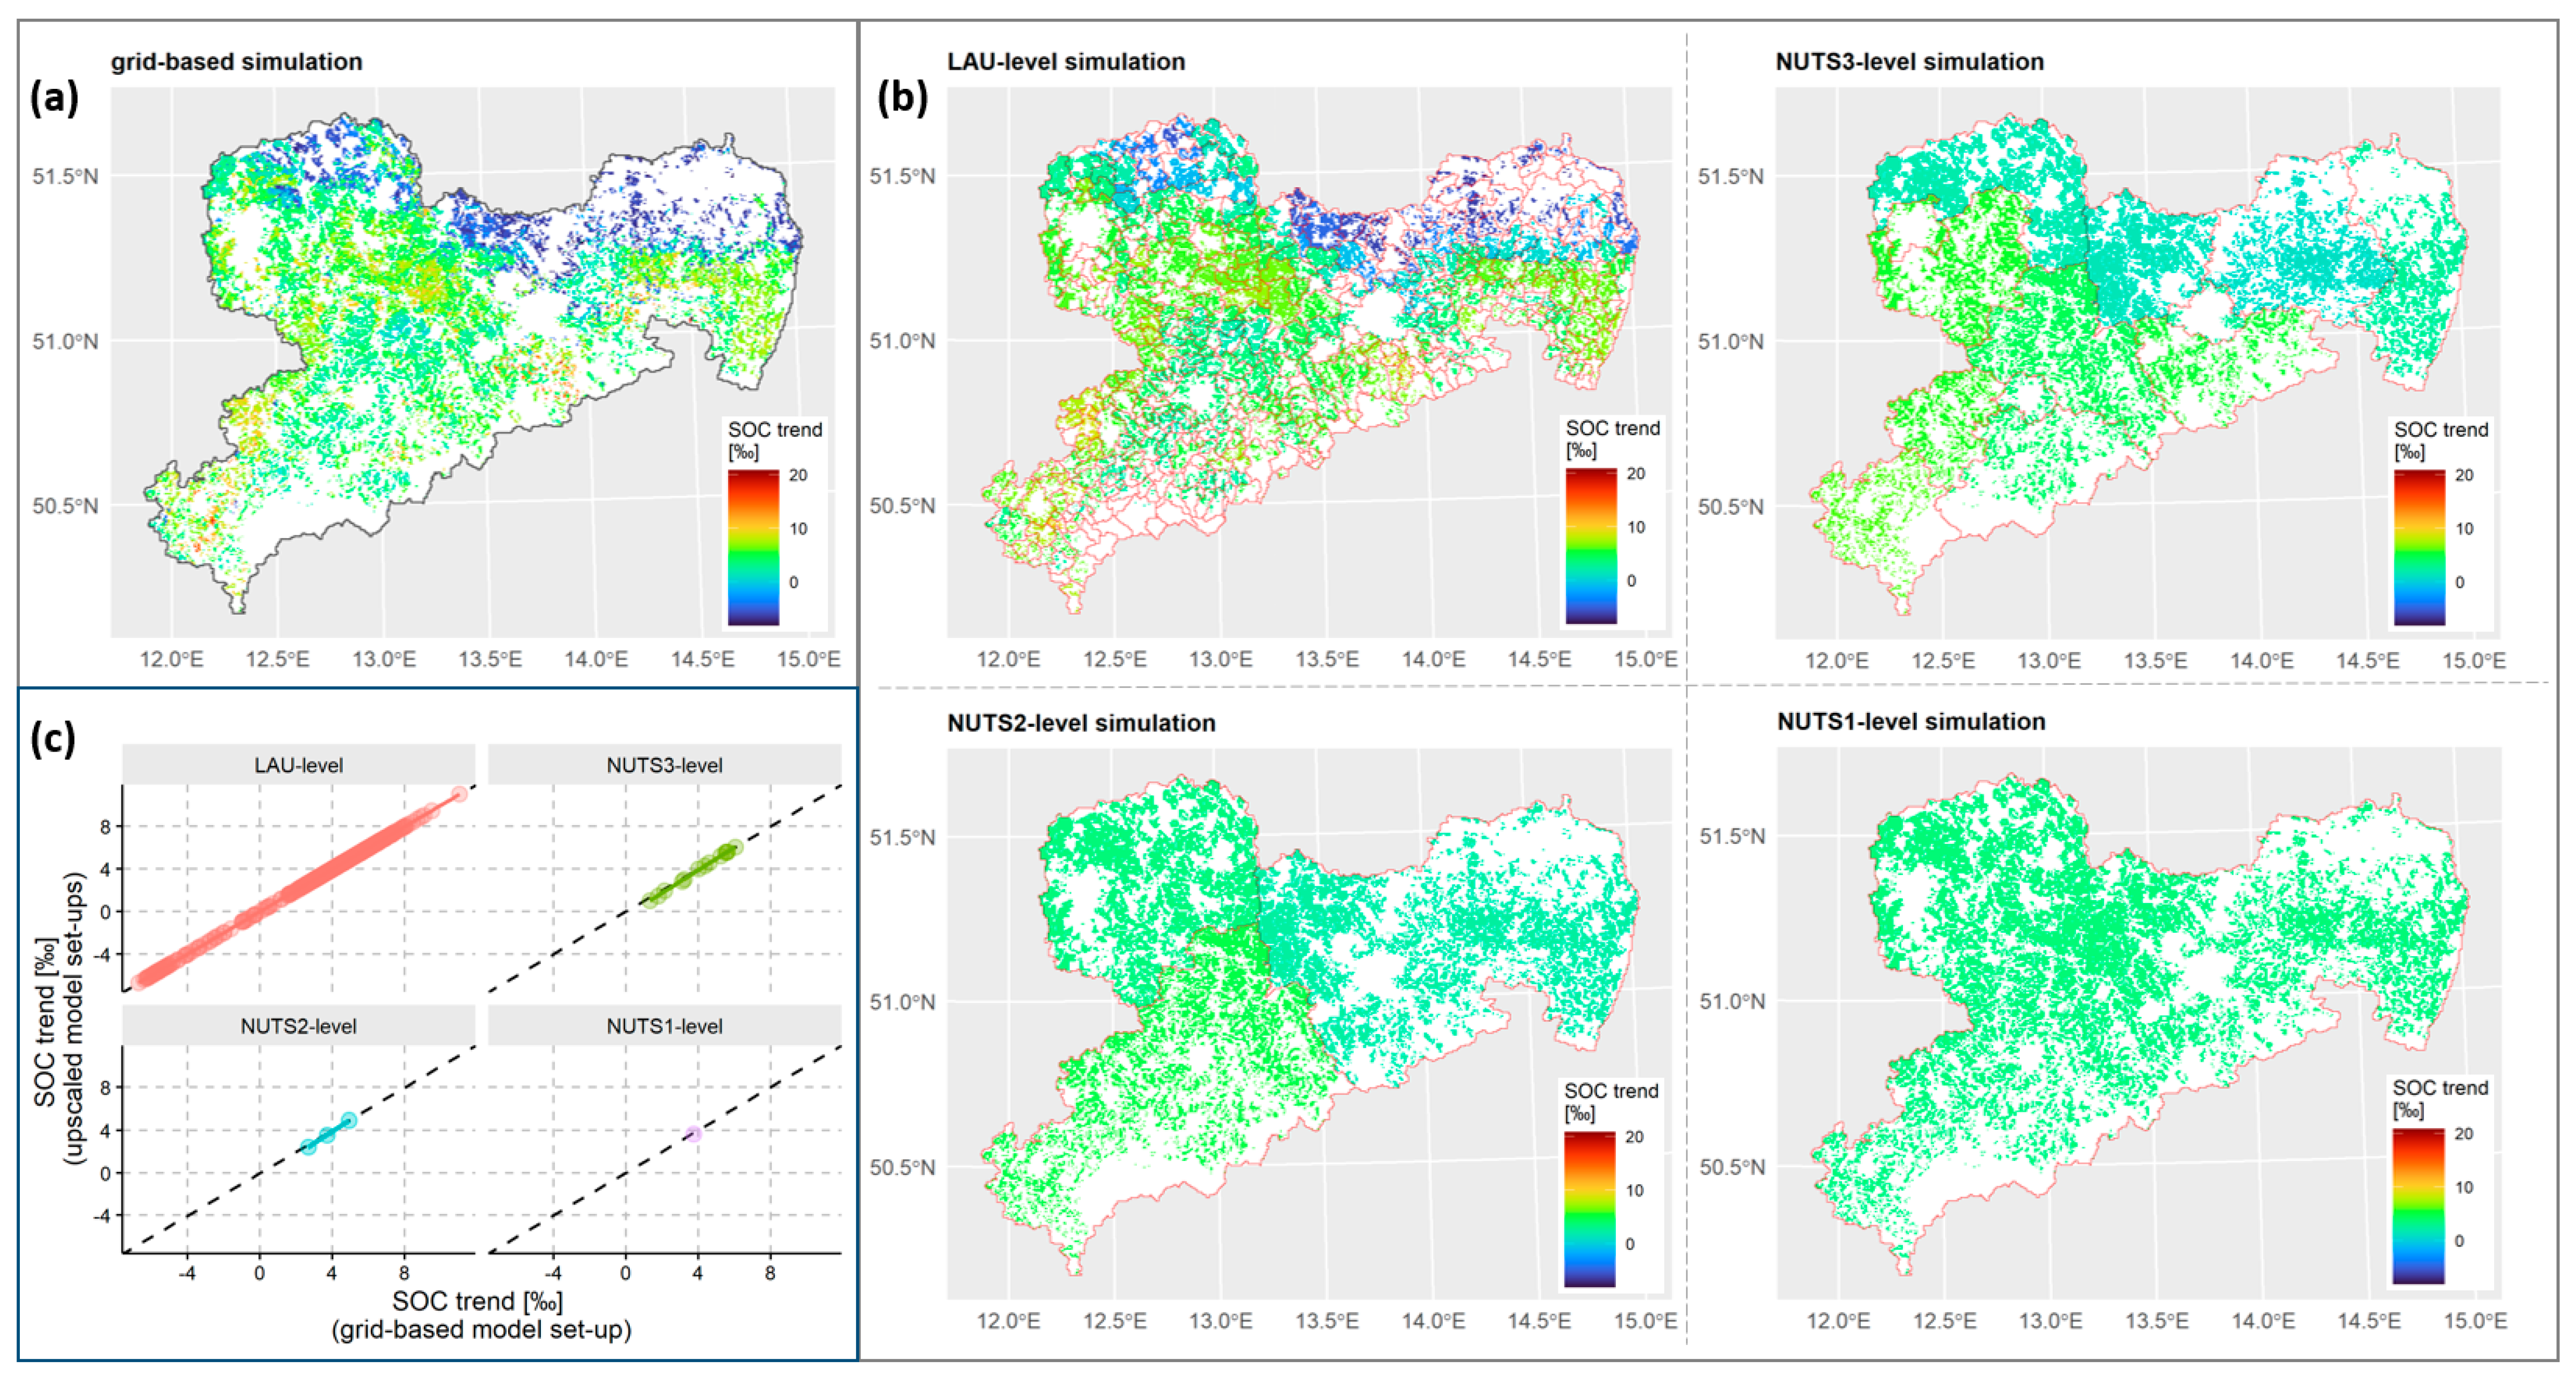
3.2. Spatial Analysis and Scale Transitions

To investigate if the upscaling of the model set-ups to and across administrative levels leads to systematic errors in the simulated SOC dynamics, we compared the individual sub-regions of each aggregation level with the reference simulation. Figure 2 shows maps of the average annual change in SOC stocks simulated with the five different model set-ups. In this section, we show the simulated SOC trends per mille (‰) per year and thus relate the results to the initial SOC stocks of 1998, which allows easy relation to the targets of the four-per-mille initiative [2,3].
Obviously, the upscaled simulations can only assess the overall trends for the simulated spatial units and not their inner heterogeneity. Thus, the total range of simulated SOC trends is considerably smaller, especially when simulated above the scale of LAU. However, when analyzing the regional trends on the level of individual administrative units, all the aggregated model set-ups could reproduce the results of the grid-based reference simulation in a reasonable range (see the scatter plots in Figure 2c). The scatter plots also show that there were no clear outliers where the upscaling did not work for specific administrative units. The root-mean-square error (RMSE) for this trend comparison ranges between 0.06‰ for the LAU regions and 0.18‰ for the NUTS2 regions. Accordingly, the mean absolute error (MAE) varies between 0.04‰ (LAU regions) and 0.14‰ (NUTS2 regions), while having a mean overall trend of 3.7–3.8‰ per year in the upscaled model set-ups. A correlation analysis between the aggregated and grid-based simulation of SOC trends shows an adjusted r2 of 0.999 for all four administrative levels considered. However, the slopes of the linear regression models decrease with the increasing size of the administrative units: 1.001 (LAU), 0.929 (NUTS3), and 0.902 (NUTS2), indicating a systematic underestimation of SOC trends in the highly upscaled set-ups.
Figure 3a shows the distribution of the observed model error when comparing the upscaled model set-ups with the grid-based reference simulation for each administrative unit. For the individual LAU regions, the model error ranges between +0.15‰ and −0.35‰, which equals +10.1 and −17.3 kg C ha−1 y−1. However, this needs to be related to the mean trend of SOC stocks of 212 kg C ha−1 y−1 across all regions in Saxony. With the increasing size of the simulated regions, the range of the observed model errors decreases, but at the same time shifts toward a more distinct underestimation of SOC trends. For the NUTS2 model, set-up the average annual trend in SOC stocks of all three spatial units was underestimated, while for the NUTS3 set-up, 11 out of 13 regions showed an underestimation of SOC trends (Figure 3). The NUTS1 set-up (with only one spatial unit simulated) showed slightly better results than the NUTS2 set-up.
While for the LAU set-up the simulation errors of the individual regions are rather evenly distributed within Saxony, a clear spatial pattern can be observed for the NUTS2 and NUTS3 set-ups (Figure 3b). Here, an underestimation of SOC trends can be observed especially in the northern and western regions of the case study area. These regions are characterized by a variety of different soil types (sandy soils and loamy silt soils) and cultivation systems.

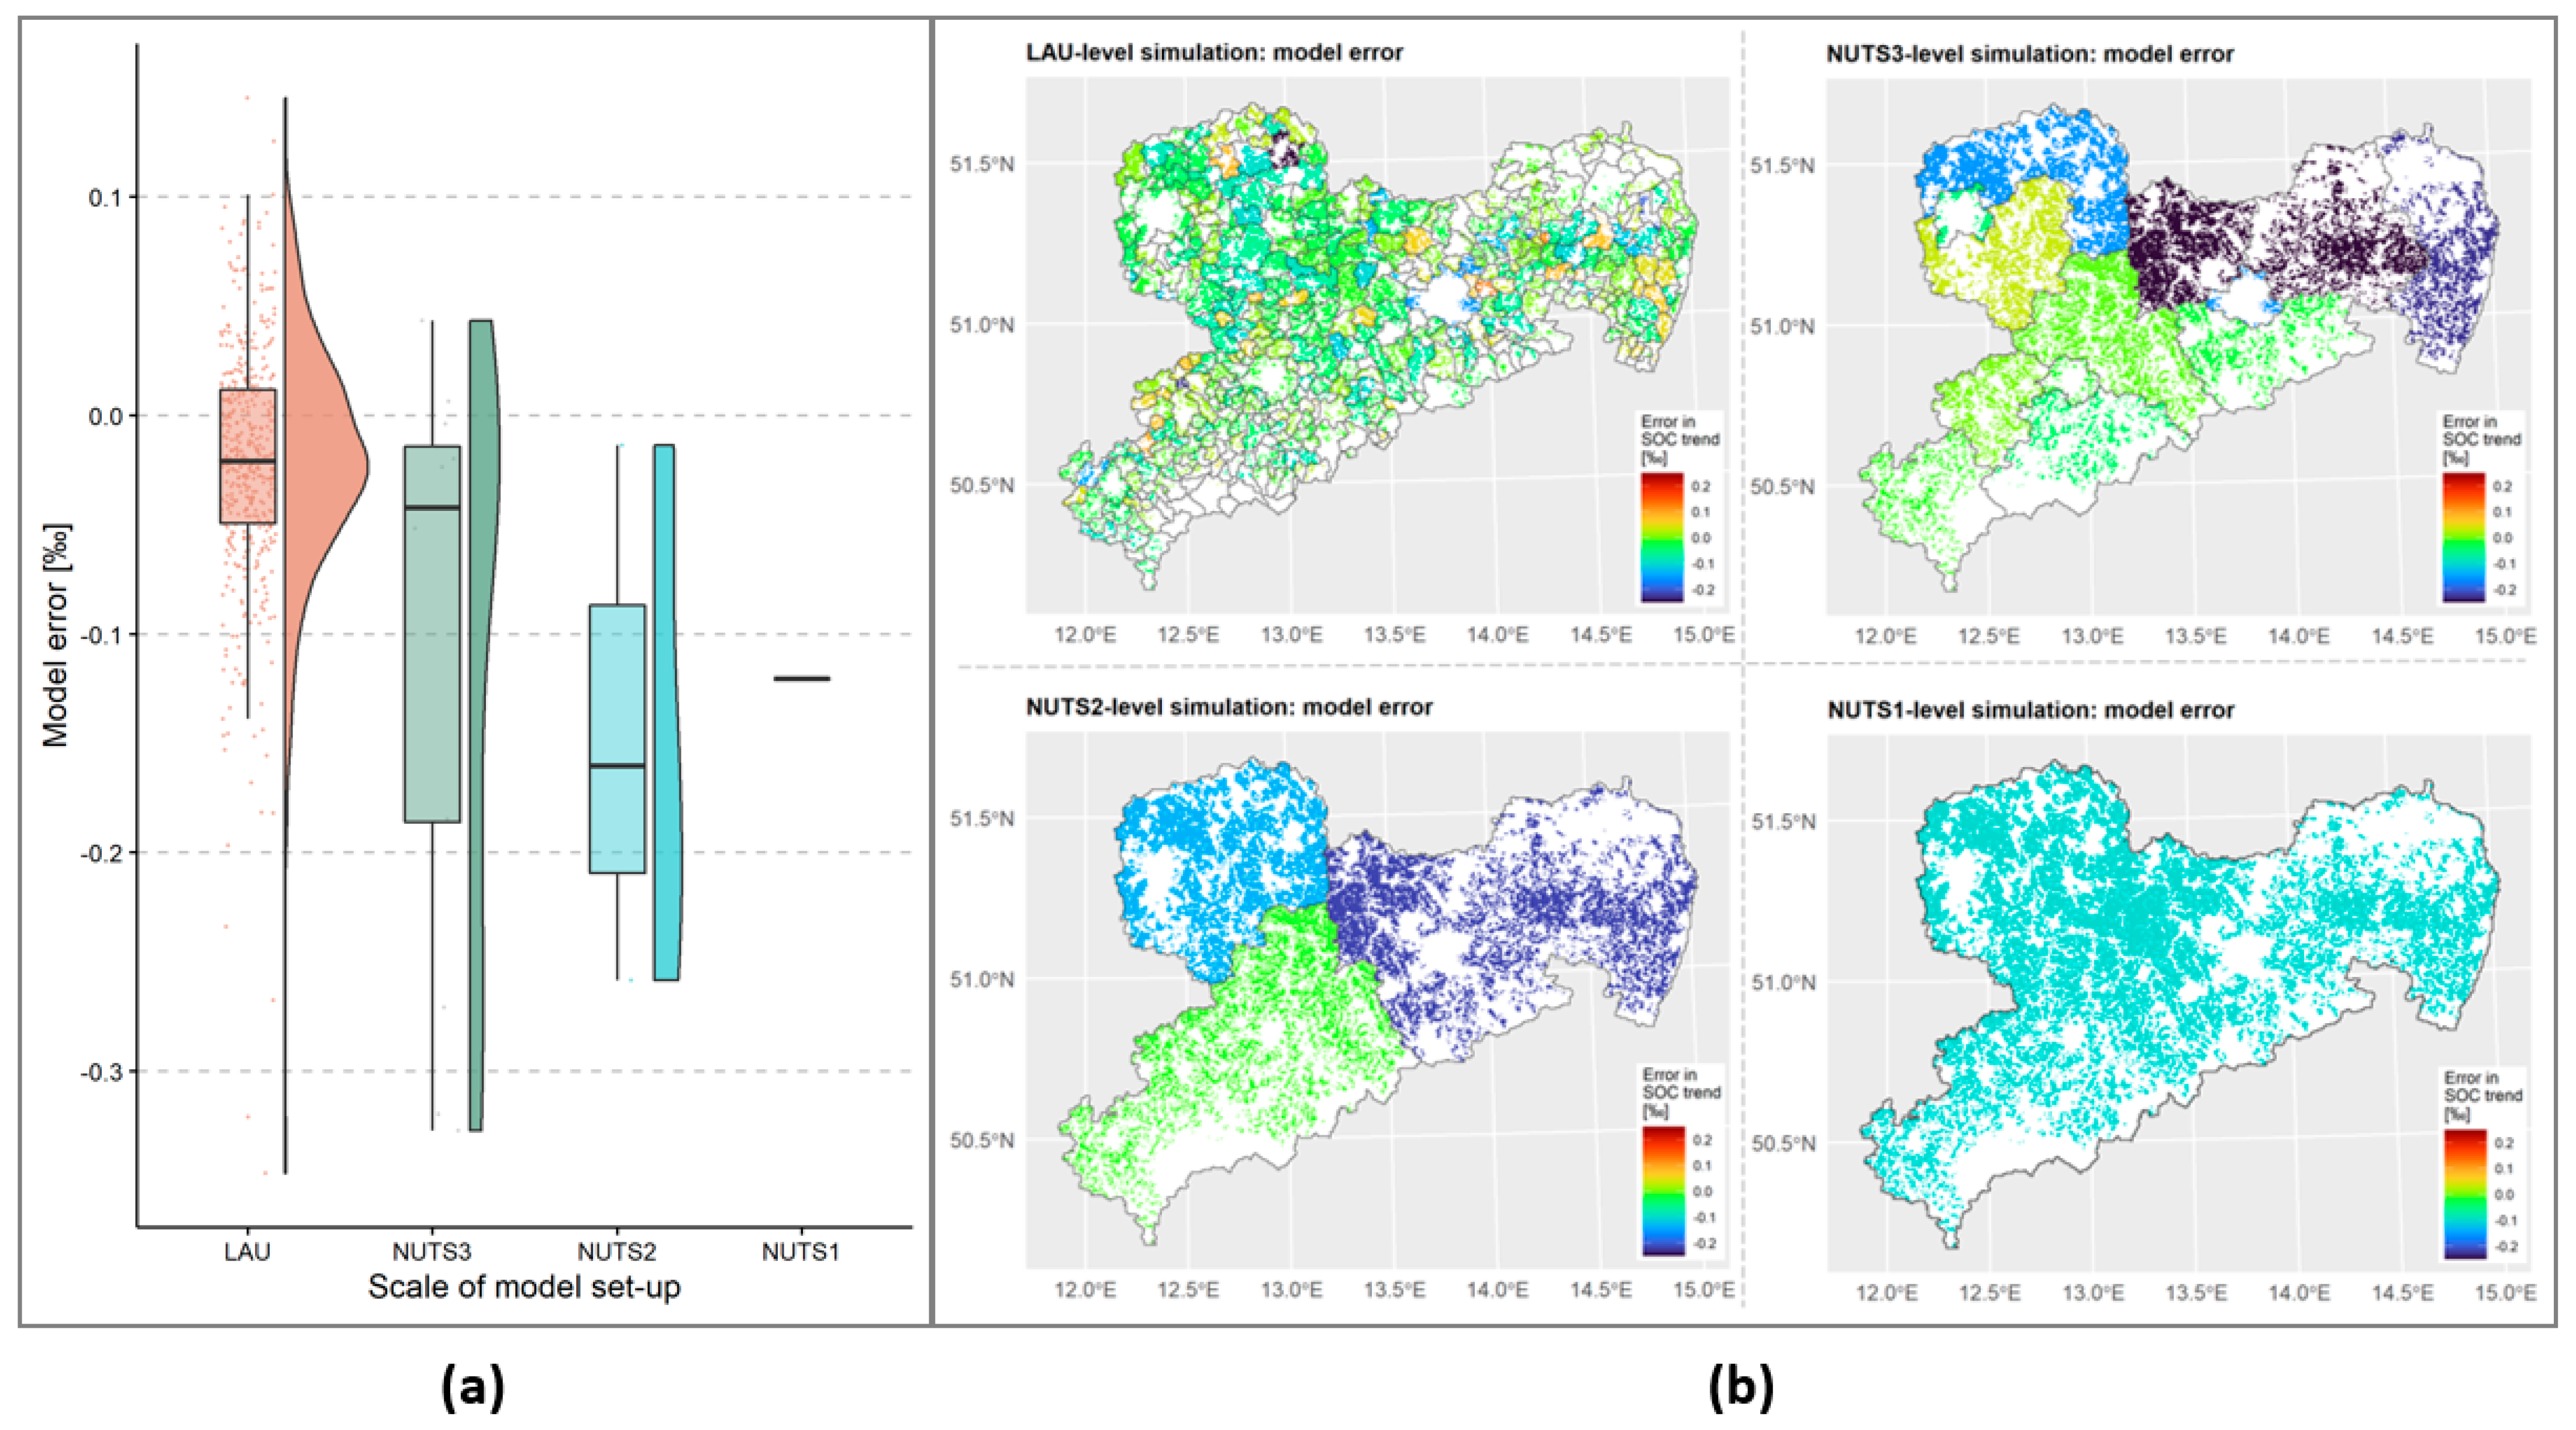
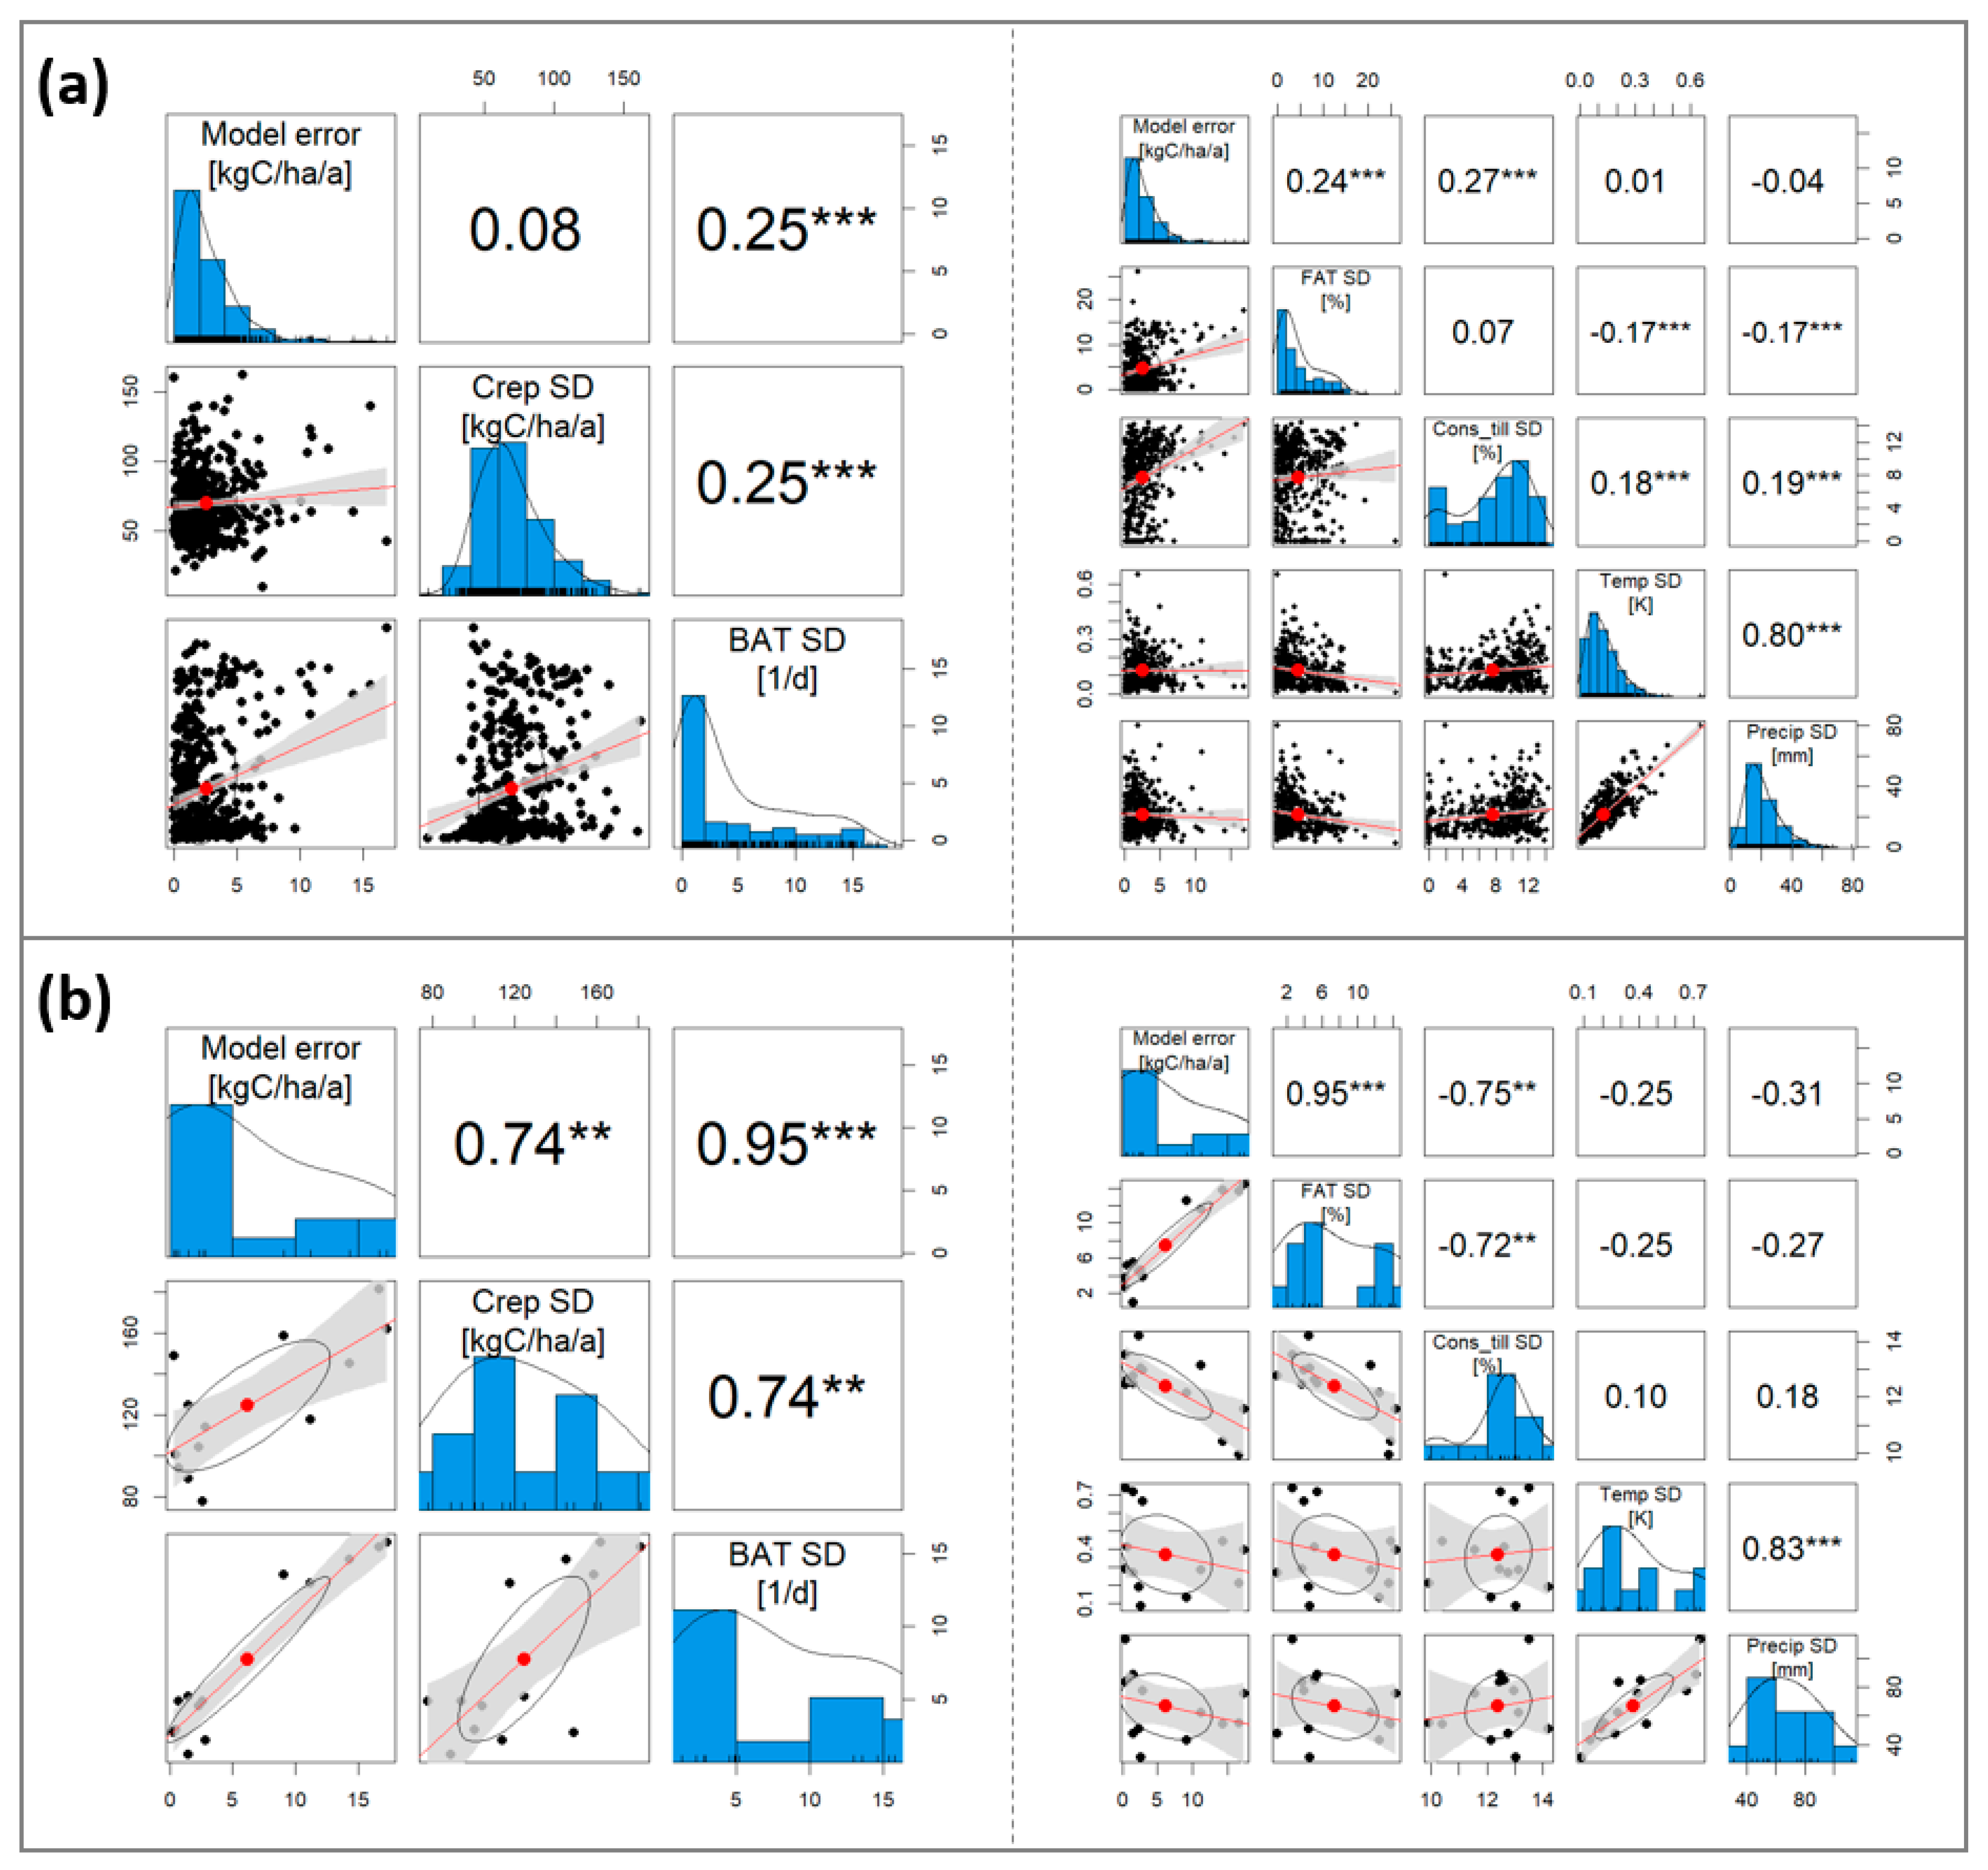
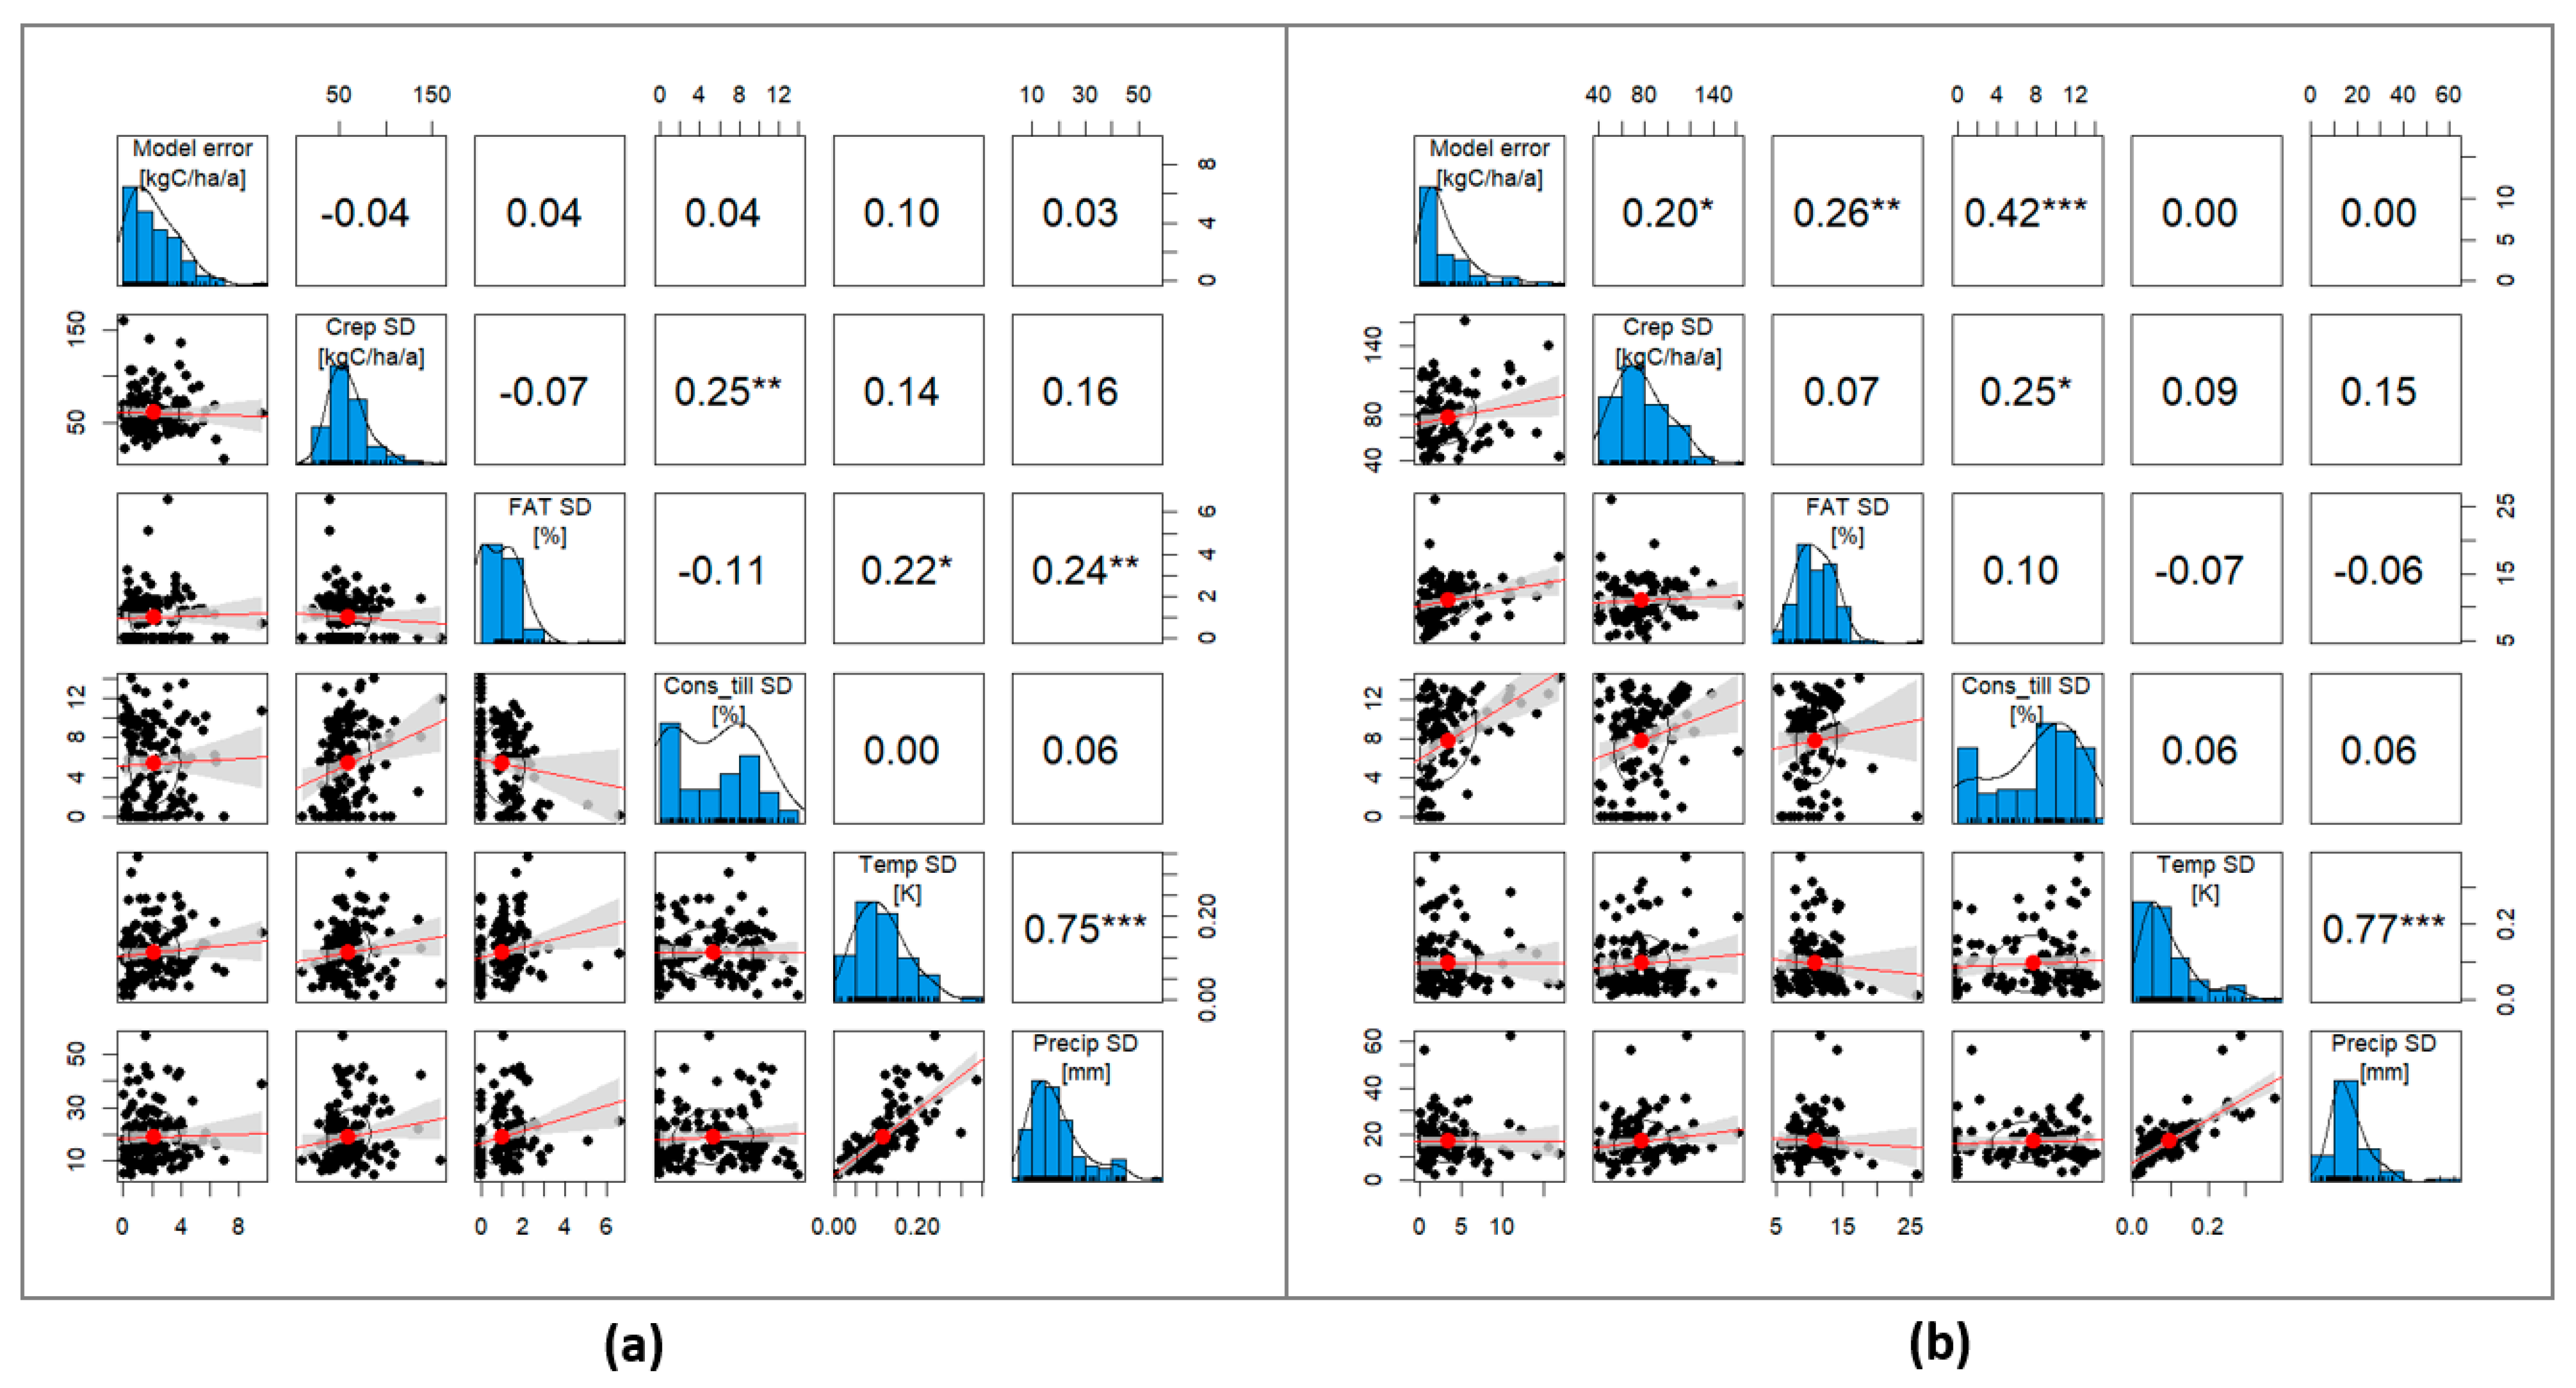
3.3. Analyzing the Drivers behind Errors in Upscaled SOC Simulations

The scaling of SOC simulations goes along with aggregating the input and turnover conditions of soil-related carbon, which both have a strong influence on the simulated dynamics in SOC stocks. Within CCB, the carbon flux from FOM to SOC (Crep) and the turnover variable BAT, that aggregates the environmental conditions, are the two most important indicators for describing the state and development of SOC. Our results show that Crep and BAT were scaled satisfactorily to and across administrative levels.
For all model set-ups, the average annual sum of the carbon reproduction flux Crep of Saxony was 0.93 Mt C y−1 within the simulation period 1998–2014. The upscaled model set-ups showed a slight overestimation of the total Crep flux in a range of +0.06–+0.11%, which equals about 1.3 kg C ha−1 y−1. A somewhat higher range of deviations was observed when considering the individual administrative regions (NUTS2 regions: −0.09–+0.05%; NUTS3 regions: −0.17–+0.34%; LAU regions: −1.3–+0.92%) or the annual development of Crep (e.g., NUTS1: −0.91–+0.93%). However, the analysis did not show a systematical overestimation or underestimation of the Crep flux for the upscaled model set-ups.
Regarding the carbon turnover conditions of Saxony, a minor underestimation of the total BAT was observed for the aggregated model set-ups with a range between −0.07% for the LAU set-up and −0.93% for the NUTS1 set-up. The tendency for the underestimation of BAT was confirmed when analyzing the individual regions on the LAU and NUTS levels (NUTS2 regions: −0.46–+0.09%; NUTS3 regions: −0.92–+0.14%; LAU regions: −1.65–+1.19%). The SOC turnover indicator BAT also showed higher annual deviations, of, e.g., up to −3.02–+1.48% for the NUTS1 set-up.
To analyze if model upscaling and thus a loss of variation in the drivers leads to systematic errors in simulated SOC dynamics, we carried out a series of correlation analyses, starting with the main indicators Crep and BAT, but also considering the original factors that drive carbon turnover conditions (climate parameters, tillage system, and soil properties). Specifically, spatial dispersion parameters of the mentioned predictors were correlated to the observed absolute errors in the simulated trends of SOC. Accordingly, Figure 4 shows a set of correlation matrices for the LAU-level (414 spatial units) and the NUTS3-level (13 spatial units) simulations. Due to the low number of data points, this analysis was not available for the NUTS2 (3 units) and NUTS1 (1 unit) set-ups.
For the LAU-level simulation (Figure 4a), the matrices show a rather low correlation between the predictor variables and the observed model error. Nevertheless, a high spatial dispersion of a region’s turnover conditions (BAT) and specifically its soil fine particle content (FAT) as well as conservation tillage shares (Cons_till) significantly favors higher model errors in simulated SOC trends (p-values < 0.001). For the NUTS3 simulation (Figure 4b), this picture becomes more pronounced and strong correlations between the dispersion of Crep, BAT, FAT and conservation tillage and the model error were found. However, the results are affected by cross-correlations, e.g., between BAT and Crep, as variations in soil properties often go along with variations in yields. The climate-related predictors (regional dispersion in temperature and precipitation) had no statistically significant correlation with the observed errors of the aggregated models.
An individual correlation matrix for LAU regions with high and with low variability in BAT (Figure 5) could be used to further investigate the role of regional carbon turnover conditions in the observed model error. The analysis showed that for administrative units with low standard deviation in regional carbon turnover conditions (Figure 5a), the observed model errors were lower and there was no significant correlation of the model error with any of the predictors. For administrative units with high variability in turnover conditions (Figure 5b), the observed model error could be partially explained by the regional variability in Crep, FAT and conservation tillage. The range in the spatial dispersion of Crep and conservation tillage shares was nearly the same in both matrices, but the variability in soil fine particle content increased. As shown in Figure S2 (Supplementary Materials) the relevance of regional deviations in soil fine particle content (FAT) is higher for regions with high spatial dispersion of Crep. For regions with a high spatial dispersion of both Crep and BAT, Crep was the most significant predictor for the observed error of the LAU-level model set-up (Figure S3).

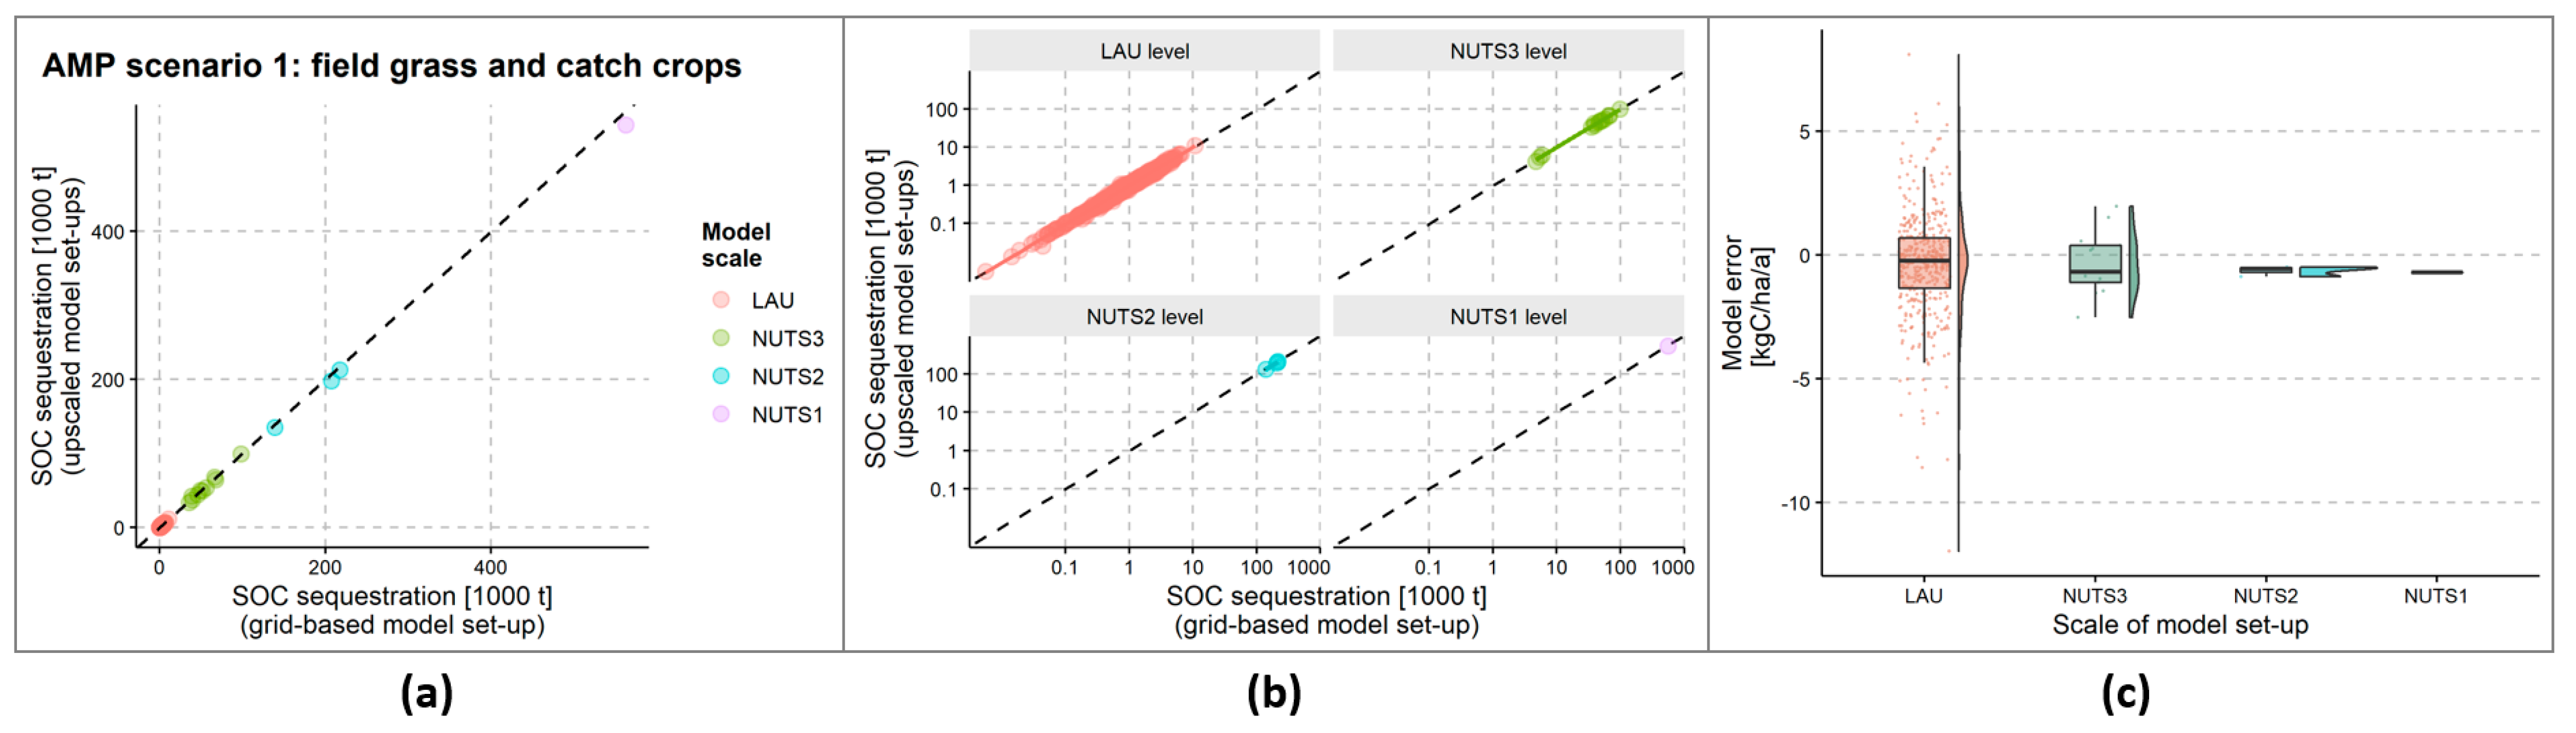
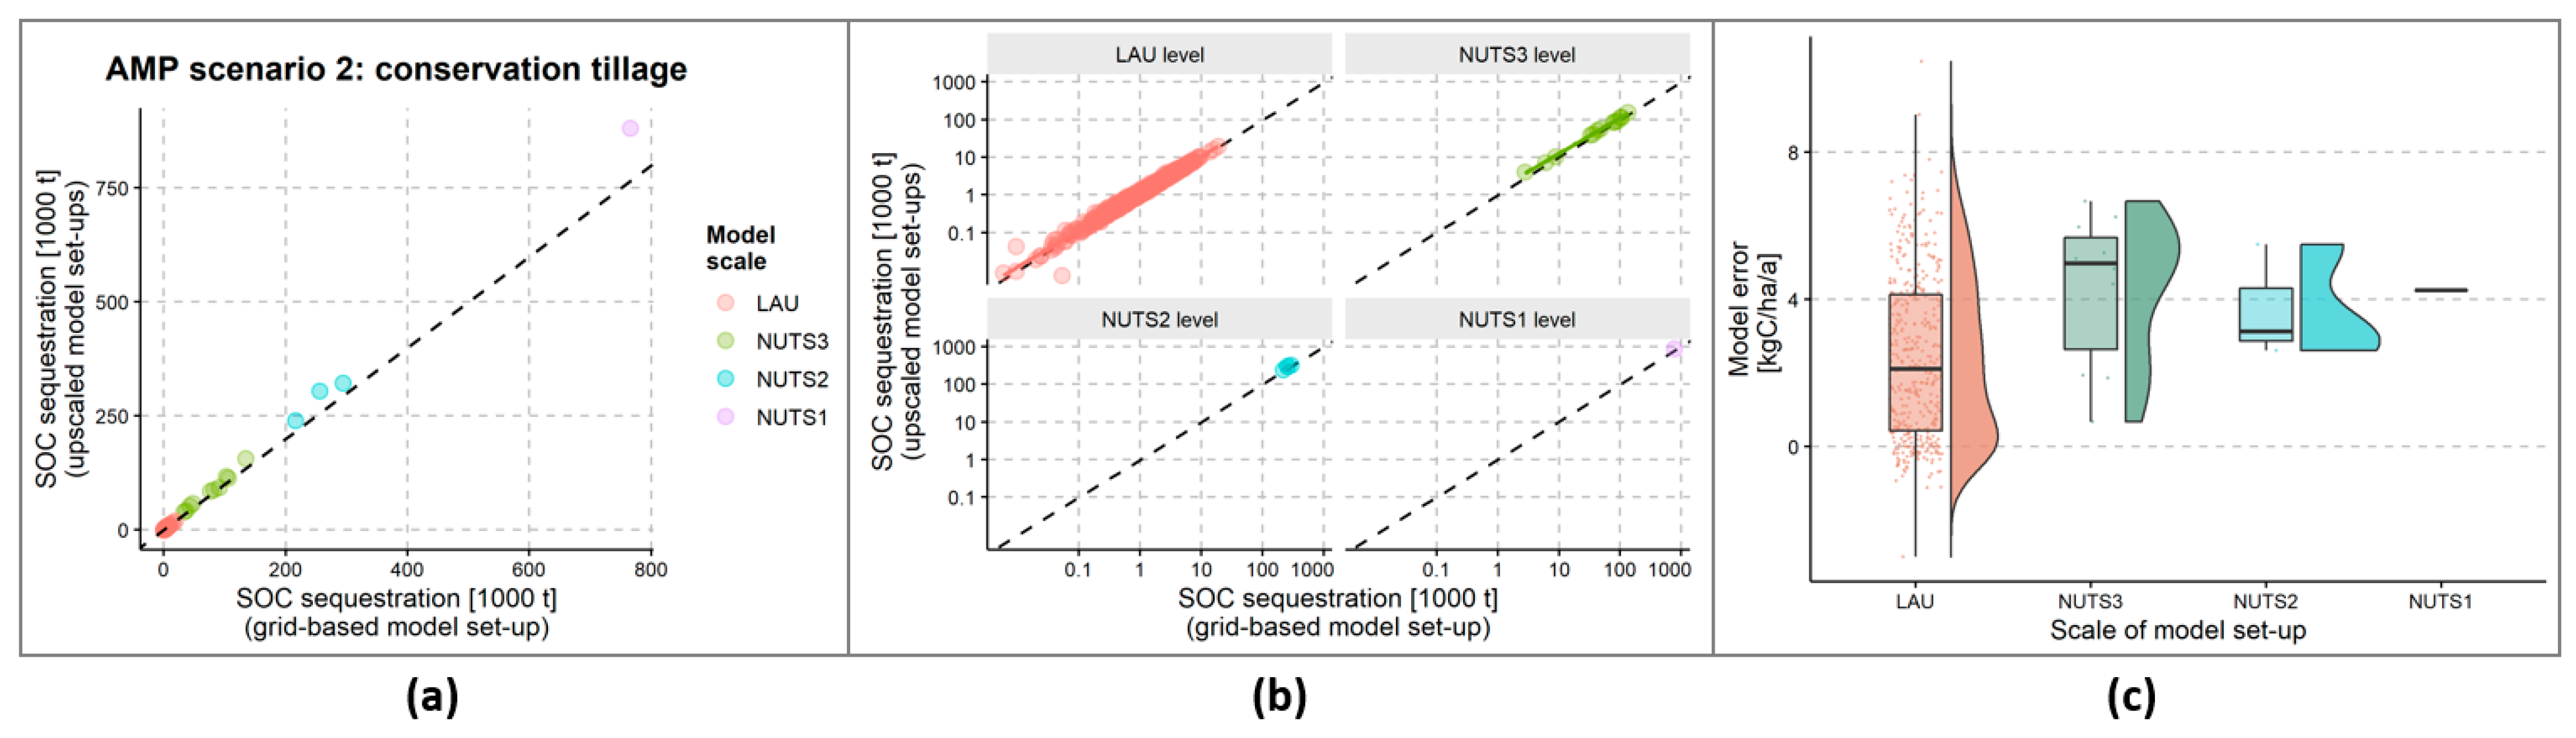
3.4. Assessing Alternative Management Practices across Scales

Two scenarios were used to assess the ability of the upscaled model set-ups for quantifying the carbon sequestration potential of alternative management practices (AMP). Both AMP scenarios were related to a ‘business-as-usual’ scenario to extract the AMP-driven effects from the overall trends in SOC stocks. Our results show that the upscaled model set-ups could reproduce the results of the grid-based reference model for both scenarios in a reasonable range, although some limitations do apply.
For the first AMP, addressing an increase in soil carbon input based on changes in the cultivation of fodder crops and cover crops resulted in a carbon sequestration of 0.56 Mt C within the grid-based reference simulation (2014–2050), which equals 20.7 kg C ha−1 y−1. The upscaled model set-ups underestimated these results to a small extent, ranging between −0.13 kg C ha−1 y−1 (LAU set-up) and −0.71 kg C ha−1 y−1 (NUTS1 set-up), which equals −0.6% and −3.4% of the overall AMP effect, respectively. Figure 5b and Figure 6a show that on the level of individual administrative regions, the simulated carbon sequestration potentials of the first AMP scenario are scattered along the 1:1 line for all model set-ups. For the individual LAU regions, the deviation of the model error was highest and included some relevant outliers (Figure 6c).
The second AMP scenario addressed a different driver of SOC dynamics and reduced carbon turnover conditions by increasing the use of conservation tillage within Saxony. For the reference simulation, this scenario resulted in a SOC sequestration of 0.77 Mt C for the period 2014–2050, which equals to 28.2 kg C ha−1 y−1. The upscaled model set-ups significantly overestimated these results within a range between +2.7 and +4.2 kg C ha−1 y−1, which equal +9.5% and +15.0% of the overall AMP effect, respectively. The absolute model error on the level of Saxony was highest for the NUTS1 set-up, which simulated a total SOC sequestration of the second AMP scenario of 0.88 Mt C. Figure 7c compares the simulated effects of the conservation tillage scenario on the level of individual administrative regions, showing that the deviation of the model error was highest in the LAU-level model set-up. Furthermore, the scatterplots of Figure 7a show that the results of the upscaled simulations are clearly above the 1:1 line and systematically increase for administrative units with high C sequestration potential.
The spatial distribution of the carbon sequestration potential simulated with both AMP scenarios is mapped in Figure S4 (Supplementary Materials). Accordingly, the highest total carbon sequestration can be reached in the loess regions of central Saxony. The NUTS3- and LAU-level model set-ups allowed an acceptable spatial prioritization of AMPs, which was not the case for the set-ups on the scales above.

4. Discussion

Effective management of the SOC stocks of arable land requires an understanding of the scalability of the drivers affecting the SOC dynamics. Furthermore, it is necessary to find appropriate reference scales that simplify the applicability, scalability and communication of SOC assessments. Ideally, a consistent approach could be used for assessing the effects of specific drivers and measures on SOC over different scales and thus enable the local adaptation and prioritization of targets or measures. In this paper, we discuss administrative units as a promising spatial basis for scaling levels, and demonstrate the potential and limitations of such an approach. We also discuss whether or not the use of aggregated statistical data sources may lead to an underestimation of regional SOC trends regardless of the actual process model in use and the scale of its set-up. For each point of discussion, we conclude with recommendations for how to better incorporate scale-related aspects in the assessment and management of SOC.

4.1. Administrative Units as an Adequate Compromise for Scaling SOC Assessments, Communication and Policy-Making

Like many other ecosystem services, soil carbon sequestration tends to be heterogeneously distributed over space. Due to partly existing mismatches on the scale of production, management and benefits the dynamics of carbon sequestration need to be evaluated and assessed across different scales [9]. Ecosystem services are frequently analyzed and mapped in the highest possible resolution and later aggregated to a desired spatial unit, which is often the management level in policy-making [8]. Despite the averaging effect, which results in a loss of information, this approach seems to be adequate for soil carbon-related assessments [9,55], which is not always the case for other ecosystem services (e.g., tourism and maple syrup and timber production [9,55]). However, the availability of some key datasets (e.g., agricultural parameters) of regional SOC assessments is often limited to larger scales—specifically, low-resolution statistics on the level of organizational boundaries or administrative units, which is also equal to the level of policy-making.
The results of our study show that the simulation of SOC dynamics on the scale of administrative units can be feasible and lead to significant benefits for model set-up, application and runtime. The degree of model simplification was substantial, while the simulation error introduced by upscaling the model set-ups was in an acceptable range in our case study set-up. The LAU-level set-up reduced the number of modeling units by a factor of 15 (6.8% of the units of the grid-based reference setup), while the NUTS1-level set-up even resulted in a reduction by a factor of 600 (0.17% of the grid-based reference setup). At the same time, the model scaling error on the level of Saxony was −0.8% and −3.2% for the LAU- and NUTS1-level set-ups, respectively, and was thus in a reasonable range, bearing in mind the uncertainties that come along with large-scale assessments. Obviously, the decision of whether or not such a simplified assessment is acceptable depends on the scale of interest, and higher errors have been observed for individual units on smaller administrative levels.
Upscaling the modeling framework to administrative units led to a simplified application of CCB and easy scenario implementation, and allowed for scalability across administrative levels. By using two contrasting scenarios, we showed that the approach could be used for a scale-adequate quantification of the anticipated effects of alternative management practices (AMPs) on carbon sequestration. Here, the simulation of AMPs addressing changes in soil carbon input (e.g., cultivated crops, residue management, and organic fertilizer) was shown to be more robust on larger scales than AMPs were, influencing carbon turnover conditions (e.g., tillage systems). In the latter case, we observed an overestimation of the carbon sequestration potential in the upscaled model set-ups of up to 15%. As administrative regions are also often the level of policy-making, communication and cross-regional comparisons, the approach shown in this study could promote discussions on the effectiveness of AMPs on a quantitative basis, which could be helpful in various stakeholder processes.
The scaling experiment presented in this study represents an idealized framework of the overall concept. By upscaling the input data of our reference model to the level of administrative units, we ensured that the scaling effects we observed were not caused by different types and qualities of data sources. However, we showed that this type of scaling is reasonable as well as that CCB is a capable tool for this kind of analysis. We expect that other soil carbon models may be suitable for such scaling operations as well, given that these models accept input data in the form of proportional coverages and area averages of different management activities. One example of such a model that could be used to confirm our results is the C-N-P model (carbon-nitrogen-phosphorus model; a further development of CCB) [56,57]. Furthermore, it is essential to consider that at least the distribution of soil types in a region should be included in an upscaled model set-up. An exclusion of soil types, e.g., by using the dominant soil of an administrative unit, will strongly affect the overall scaling error. For very heterogeneous regions, especially in terms of soils and yield potential, the upscaling of input data could lead to systematic errors (see also the following Section 4.2). However, this effect was rather minor for the case study of Saxony despite the diversity of its agricultural systems, landscape characteristics and soils. Regarding the administrative levels of Europe, the LAU regions were shown to be the most suitable compromise between model simplification and observed model errors. However, the model set-ups on the larger NUTS3, NUTS2 and NUTS1 levels also provided scale-adequate results and had the benefit of better data availability and relevance to communication and policies.

4.2. Data-Driven Underestimation of SOC Trends in Regional Assessments

Our results indicate that regional heterogeneity in the carbon input and turnover conditions of a study area may drive systematic errors in regional SOC assessments. Specifically, we observed a slight, but systematic underestimation of SOC trends within our upscaled model set-ups. While in our study this error was introduced by the upscaled modeling approach, it might be relevant for all regional assessments of SOC that make use of regional statistics in their input data. Due to the widespread limitations in data availability, the use of statistical datasets on administrative levels is quite common in regional to large scale estimations of SOC stocks [11,12,13,14,15,16]. We showed that with increasing heterogeneity in turnover conditions (e.g., that driven by different soil types or tillage systems), the use of aggregated input data (especially in agricultural management) leads to an increasing model error.
This effect can be best discussed with the example of a fictional region that has two different soil types: (1) sandy soils with high carbon turnover conditions and low yield potential and (2) silty soils with lower SOC turnover conditions and high yield potential. Obviously, both soil regions have different amounts of biomass available to be returned into the soil, which may lead to vastly different steady-state levels of SOC. The agricultural parameters (e.g., yield) reported in the statistical datasets of this fictional region will only provide an average value across both soil types, which might then be applied as a uniform value to both soils types within a model set-up. Accordingly, an overestimation of the carbon influx into the sandy soils and an underestimation of the carbon influx into the silty soils can be expected. However, as the residence time of carbon in sandy soils is shorter than that in silty soils, the virtual transfer of carbon from silty soils to sandy soils leads to an underestimation of a region’s SOC sequestration. This effect is purely input data-driven and occurs regardless of the model in use or the scale of model set-up.
With a series of correlation analyses, we showed the relevance of this effect and it became clear that regional heterogeneity in soil properties and tillage systems are the most relevant variables that drive the scaling error in our framework. For regions that have high turnover conditions for soil-related carbon, the regional heterogeneity in soil carbon input levels also becomes relevant, which is not the case for regions with low heterogeneity in turnover conditions. The overall effect on our case study results was rather low; however, we recommend that regional SOC assessments consider this effect in their uncertainty analyses [24].

4.3. Supporting SOC Sequestration in the Case Study Region, Saxony

The SOC stocks of Saxon arable land show a positive trend within the reference period due to positive developments in agricultural management practices such as the increased use of conservation tillage [17,58]. Within our study, we quantified a total carbon sequestration in the arable soils of 2.6 Mt C for the period 1998–2014, which equals to a trend of 3.7‰ per year based on the SOC stocks of 1998. This is considerably higher than the results reported by Witing et al. [17]. The updates applied in the initialization of CCB SOC pools in accordance with the approach of Drexler et al. [36] were the main reason for the differences observed and underlined the widespread challenges of model initialization in regional SOC assessments [59,60].
Our results also show that an increased use of conservation tillage as well as increased cultivation of field grass and cover crops could substantially support future SOC sequestration in Saxony. We observed that moderate changes in management (an absolute increase of 8.3% in field grass and 10% in conservation tillage) could potentially store an additional 1.33 Mt C (48.9 kg C ha−1 y−1) in Saxon arable soils until 2050. This is lower than the results of similar scenarios that have been reported for the arable land of Great Britain [61], but is still in a reasonable range. Future studies should investigate other potential management actions as well as effective and reasonable degrees of implementation, which were not the focus of this study. Promising management activities in the local context are, for example, related to the management of crop by-products and residues, self-planted fallow greening, or the adapted management of field margins [18,42]. Additionally, the biogas sector became an important factor for the SOC dynamics in Saxony [62], and together with implications of upcoming changes on climate [63,64] and dietary habits, a re-evaluation of the carbon fluxes of the agricultural system may be required [65].
The use of conservation tillage showed higher carbon sequestration potential in Saxony than the increased cultivation of field grass and cover crops did. However, CCB did only simulate the carbon dynamics of the topsoil (30 cm), and the potential negative impacts of reduced tillage on the SOC levels of deeper soil layers could not be investigated [66,67]. Furthermore, management decisions need to consider that SOC accumulation rates decrease over time and are always accompanied by major changes in nitrogen cycles and stocks [17,68].

5. Conclusions

Regional and quantitative assessments of SOC stocks and trends as well as of the carbon sequestration potential of alternative management practices (AMP) are highly relevant to developing climate change mitigation strategies for the agricultural sector. However, such assessments are still rarely performed due to limitations in the availability of input data and the complexity of model set-ups. This study showed that a simplified, upscaled assessment of AMPs on the level of administrative units can be feasible for several applications. By using the “regional mode” of the CCB model, we could apply a consistent approach for quantifying SOC dynamics over different scales, which enabled the local adaption and prioritization of targets or measures. In general, and not only for upscaled model set-ups, modelers need to be aware that the use of statistical input data (esp. in agricultural management) may lead to a systematic underestimation of SOC trends, regardless of the model in use. However, simplified and scale-adapted assessments of SOC dynamics using commonly available data could be valuable for cross-regional comparisons, communication and policy-making, and could provide a quantitative basis for discussions on the effectiveness of AMPs in various stakeholder processes. Regarding the administrative levels of Europe, the LAU and NUTS3 regions were shown to be the most suitable compromise between model simplification, data availability and observed model errors, and allowed the acceptable spatial prioritization of AMPs.

Supplementary Materials

The following supporting information can be downloaded at https://www.mdpi.com/article/10.3390/agronomy13041159/s1, Table S1: Agro-economic regions of Saxony; Table S2: Descriptive summary of the data aggregation procedure; Explanation S1: Initialization of SOC-levels; Figure S1: Pools and fluxes of the CCB model; Figure S2: Correlation matrices for LAU units with high/low spatial dispersion in the carbon influx into SOC (Crep); Figure S3: Correlation matrix for LAU units with high spatial dispersion in carbon turnover conditions (BAT) as well as in the carbon influx into SOC (Crep); Figure S4: Maps of the simulated carbon sequestration potential of two alternative management practices.

Author Contributions

Conceptualization, F.W., U.F. and M.V.; methodology, F.W.; software, F.W. and U.F.; validation, F.W., U.F. and M.V.; formal analysis, F.W.; investigation, F.W.; data curation, F.W.; writing—original draft preparation, F.W.; writing—review and editing, F.W., U.F. and M.V.; visualization, F.W.; supervision, U.F. and M.V.; project administration, F.W.; funding acquisition, F.W., U.F. and M.V. All authors have read and agreed to the published version of the manuscript.

Funding

This research was partly funded by ‚Sächsisches Landesamt für Umwelt, Landwirtschaft und Geologie (LfULG) within the framework of the research project ‘Dynamische Bilanzierung von Humushaushalt und Nährstoffaustrag im regionalen Maβstab im Kontext von Landnutzungs- und Klimawandel’.

Data Availability Statement

The essential data presented in this study are included within the article and Supplementary Materials or openly available as listed in the References section. Additional data that support the findings of this study are available from the corresponding author upon reasonable request. These additional datasets are not publicly available due to license restrictions on the original datasets.

Acknowledgments

We would like to thank Sebastian Preidl for his input and valuable discussions on potential approaches toward the formal analysis of the case study results.

Conflicts of Interest

The authors declare no conflict of interest.

References

  1. Lefèvre, C.; Rekik, F.; Alcantara, V.; Wiese, L. Soil Organic Carbon: The Hidden Potential; Food and Agriculture Organization of the United Nations (FAO): Rome, Italy, 2017; ISBN 978-92-5-109681-9. [Google Scholar]
  2. Lal, R. Beyond COP 21: Potential and Challenges of the “4 per Thousand” Initiative. J. Soil Water Conserv. 2016, 71, 20A–25A. [Google Scholar] [CrossRef]
  3. Minasny, B.; Malone, B.P.; McBratney, A.B.; Angers, D.A.; Arrouays, D.; Chambers, A.; Chaplot, V.; Chen, Z.-S.; Cheng, K.; Das, B.S.; et al. Soil Carbon 4 per Mille. Geoderma 2017, 292, 59–86. [Google Scholar] [CrossRef]
  4. Amundson, R.; Biardeau, L. Opinion: Soil Carbon Sequestration Is an Elusive Climate Mitigation Tool. Proc. Natl. Acad. Sci. USA 2018, 115, 11652–11656. [Google Scholar] [CrossRef] [PubMed]
  5. Wiesmeier, M.; Mayer, S.; Paul, C.; Helming, K.; Don, A.; Franko, U.; Steffens, M.; Kögel-Knabner, I. CO2 Certificates for Carbon Sequestration in Soils: Methods, Management Practices and Limitations; BonaRes Data Centre (Leibniz Centre for Agricultural Landscape Research (ZALF)): Müncheberg, Germany, 2020. [Google Scholar] [CrossRef]
  6. Franko, U.; Witing, F. Dynamics of Soil Organic Matter in Agricultural Landscapes. In Landscape Modelling and Decision Support; Mirschel, W., Terleev, V.V., Wenkel, K.-O., Eds.; Innovations in Landscape Research; Springer International Publishing: Cham, Switzerland, 2020; pp. 283–298. ISBN 978-3-030-37421-1. [Google Scholar]
  7. Primmer, E.; Furman, E. Operationalising Ecosystem Service Approaches for Governance: Do Measuring, Mapping and Valuing Integrate Sector-Specific Knowledge Systems? Ecosyst. Serv. 2012, 1, 85–92. [Google Scholar] [CrossRef]
  8. Zen, M.; Candiago, S.; Schirpke, U.; Egarter Vigl, L.; Giupponi, C. Upscaling Ecosystem Service Maps to Administrative Levels: Beyond Scale Mismatches. Sci. Total Environ. 2019, 660, 1565–1575. [Google Scholar] [CrossRef]
  9. Raudsepp-Hearne, C.; Peterson, G. Scale and Ecosystem Services: How Do Observation, Management, and Analysis Shift with Scale—Lessons from Québec. Ecol. Soc. 2016, 21, 16. [Google Scholar] [CrossRef]
  10. European Commission. Commission Regulation (EU) 2016/2066 of 21 November 2016 Amending the Annexes to Regulation (EC) No 1059/2003 of the European Parliament and of the Council on the Establishment of a Common Classification of Territorial Units for Statistics (NUTS). Available online: https://eur-lex.europa.eu/eli/reg/2016/2066/oj (accessed on 16 February 2022).
  11. Borrelli, P.; Paustian, K.; Panagos, P.; Jones, A.; Schütt, B.; Lugato, E. Effect of Good Agricultural and Environmental Conditions on Erosion and Soil Organic Carbon Balance: A National Case Study. Land Use Policy 2016, 50, 408–421. [Google Scholar] [CrossRef]
  12. Lugato, E.; Panagos, P.; Bampa, F.; Jones, A.; Montanarella, L. A New Baseline of Organic Carbon Stock in European Agricultural Soils Using a Modelling Approach. Glob. Chang. Biol. 2014, 20, 313–326. [Google Scholar] [CrossRef]
  13. Aguilera, E.; Guzmán, G.I.; Álvaro-Fuentes, J.; Infante-Amate, J.; García-Ruiz, R.; Carranza-Gallego, G.; Soto, D.; González de Molina, M. A Historical Perspective on Soil Organic Carbon in Mediterranean Cropland (Spain, 1900–2008). Sci. Total Environ. 2018, 621, 634–648. [Google Scholar] [CrossRef]
  14. Kaczynski, R.; Siebielec, G.; Hanegraaf, M.C.; Korevaar, H. Modelling Soil Carbon Trends for Agriculture Development Scenarios at Regional Level. Geoderma 2017, 286, 104–115. [Google Scholar] [CrossRef]
  15. Farina, R.; Marchetti, A.; Francaviglia, R.; Napoli, R.; Bene, C.D. Modeling Regional Soil C Stocks and CO2 Emissions under Mediterranean Cropping Systems and Soil Types. Agric. Ecosyst. Environ. 2017, 238, 128–141. [Google Scholar] [CrossRef]
  16. Begum, K.; Kuhnert, M.; Yeluripati, J.; Ogle, S.; Parton, W.; Kader, M.A.; Smith, P. Model Based Regional Estimates of Soil Organic Carbon Sequestration and Greenhouse Gas Mitigation Potentials from Rice Croplands in Bangladesh. Land 2018, 7, 82. [Google Scholar] [CrossRef]
  17. Witing, F.; Gebel, M.; Kurzer, H.-J.; Friese, H.; Franko, U. Large-Scale Integrated Assessment of Soil Carbon and Organic Matter-Related Nitrogen Fluxes in Saxony (Germany). J. Environ. Manag. 2019, 237, 272–280. [Google Scholar] [CrossRef] [PubMed]
  18. Sächsisches Staatsministerium für Energie, Klimaschutz, Umwelt und Landwirtschaft Richtlinie Zur Förderung von Vorhaben Der Umweltgerechten Flächenbewirtschaftung Im Freistaat Sachsen (Förderrichtlinie Agrarumwelt- Und Klimamaßnahmen–FRL AUK/2015). Available online: https://www.revosax.sachsen.de/vorschrift_gesamt/16239/44090.pdf (accessed on 1 February 2023).
  19. LfL. Die landwirtschaftlichen Vergleichsgebiete im Freistaat Sachsen, 1st ed.; Sächsische Landesanstalt für Landwirtschaft: Dresden, Germany, 1999. [Google Scholar]
  20. Franko, U.; Kolbe, H.; Thiel, E.; Ließ, E. Multi-Site Validation of a Soil Organic Matter Model for Arable Fields Based on Generally Available Input Data. Geoderma 2011, 166, 119–134. [Google Scholar] [CrossRef]
  21. Franko, U. Modelling Approaches of Soil Organic Matter Turnover within the CANDY System. In Evaluation of Soil Organic Matter Models; NATO ASI Series/I: Global Environmental Change; Springer: Berlin/Heidelberg, Germany, 1996; pp. 247–254. [Google Scholar]
  22. Franko, U.; Oelschlägel, B.; Schenk, S. Simulation of Temperature-, Water- and Nitrogen Dynamics Using the Model CANDY. Ecol. Model. 1995, 81, 213–222. [Google Scholar] [CrossRef]
  23. Gasser, A.A.; Diel, J.; Nielsen, K.; Mewes, P.; Engels, C.; Franko, U. A Model Ensemble Approach to Determine the Humus Building Efficiency of Organic Amendments in Incubation Experiments. Soil Use Manag. 2022, 38, 179–190. [Google Scholar] [CrossRef]
  24. Diel, J.; Franko, U. Sensitivity Analysis of Agricultural Inputs for Large-Scale Soil Organic Matter Modelling. Geoderma 2020, 363, 114172. [Google Scholar] [CrossRef]
  25. Franko, U.; Spiegel, H. Modeling Soil Organic Carbon Dynamics in an Austrian Long-Term Tillage Field Experiment. Soil Tillage Res. 2016, 156, 83–90. [Google Scholar] [CrossRef]
  26. Franko, U.; Diel, J.; Ruehlmann, J. Applying CCB to Predict Management Change Affected Long-Term SOM Turnover of the Extended Static Fertilization Experiment in Bad Lauchstädt. Eur. J. Soil Sci. 2022, 73, e13148. [Google Scholar] [CrossRef]
  27. Franko, U.; Ruehlmann, J. SOC Sequestration as Affected by Historic and Present Management. Geoderma 2018, 321, 15–21. [Google Scholar] [CrossRef]
  28. Spiegel, H.; Sandén, T.; Dersch, G.; Baumgarten, A.; Gründling, R.; Franko, U. Soil Organic Matter and Nutrient Dynamics Following Different Management of Crop Residues at Two Sites in Austria. In Soil Management and Climate Change; Elsevier: London, UK, 2018; pp. 253–265. ISBN 978-0-12-812128-3. [Google Scholar]
  29. Gasser, S.A.A.; Nielsen, K.; Eichler-Löbermann, B.; Armbruster, M.; Merbach, I.; Franko, U. Simulating the Soil Phosphorus Dynamics of Four Long-term Field Experiments with a Novel Phosphorus Model. Soil Use Manag. 2023, 39, 867–880. [Google Scholar] [CrossRef]
  30. Franko, U.; Merbach, I. Modelling Soil Organic Matter Dynamics on a Bare Fallow Chernozem Soil in Central Germany. Geoderma 2017, 303, 93–98. [Google Scholar] [CrossRef]
  31. Franko, U.; Schulz, E. Carbon Accumulation in a Bare Fallow Chernozem Soil with High Carbon Input Rates. Eur. J. Soil Sci. 2021, 72, 265–273. [Google Scholar] [CrossRef]
  32. Farina, R.; Sándor, R.; Abdalla, M.; Álvaro-Fuentes, J.; Bechini, L.; Bolinder, M.A.; Brilli, L.; Chenu, C.; Clivot, H.; De Antoni Migliorati, M.; et al. Ensemble Modelling, Uncertainty and Robust Predictions of Organic Carbon in Long-Term Bare-Fallow Soils. Glob. Chang. Biol. 2021, 27, 904–928. [Google Scholar] [CrossRef]
  33. Franko, U.; Oelschlägel, B. Einfluss von Klima und Textur auf die Biologische Aktivität Beim Umsatz der Organischen Bodensubstanz. Arch. Agron. Soil Sci. 1995, 39, 155–163. [Google Scholar] [CrossRef]
  34. Franko, U.; Ruehlmann, J. Novel Methodology for the Assessment of Organic Carbon Stocks in German Arable Soils. Agronomy 2022, 12, 1231. [Google Scholar] [CrossRef]
  35. LfULG Bodenkarte Des Freistaates Sachsen Im Maßstab 1: 50,000 (BK 50) 2012. Available online: https://luis.sachsen.de/fachbereich-boden-bodenkarte-bk50.html (accessed on 1 February 2023).
  36. Drexler, S.; Broll, G.; Don, A.; Flessa, H. Standorttypische Humusgehalte Landwirtschaftlich Genutzter Böden Deutschlands; Thünen Report 75; Johann Heinrich von Thünen-Institut: Braunschweig, Germany, 2020; ISBN 978-3-86576-208-5. [Google Scholar]
  37. Eurostat EC Data Browser-Agriculture, Forestry and Fisheries. Available online: https://ec.europa.eu/eurostat/databrowser/explore/all/agric?lang=en&subtheme=agr&display=list&sort=category&extractionId=EF_MP_PRAC (accessed on 1 February 2023).
  38. Eurostat Database-Regional Statistics by NUTS Classification. Available online: https://ec.europa.eu/eurostat/web/regions/data/database (accessed on 1 February 2023).
  39. Statistisches Landesamt Sachsen Statistik-GENESIS-Online. Available online: https://www.statistik.sachsen.de/genonline/online/logon (accessed on 1 February 2023).
  40. Eurostat GISCO: Geographical Information and Maps-Administrative Units/Statistical Units. Available online: https://ec.europa.eu/eurostat/web/gisco/geodata/reference-data/administrative-units-statistical-units (accessed on 1 February 2023).
  41. Wiesmeier, M.; Urbanski, L.; Hobley, E.; Lang, B.; von Lützow, M.; Marin-Spiotta, E.; van Wesemael, B.; Rabot, E.; Ließ, M.; Garcia-Franco, N.; et al. Soil Organic Carbon Storage as a Key Function of Soils-A Review of Drivers and Indicators at Various Scales. Geoderma 2019, 333, 149–162. [Google Scholar] [CrossRef]
  42. Sächsisches Staatsministerium für Energie, Klimaschutz, Umwelt und Landwirtschaft Richtlinie zur Förderung von Maßnahmen der Umweltgerechten Flächenbewirtschaftung im Freistaat Sachsen (Förderrichtlinie Agrarumwelt-Und Klimamaßnahmen-FRL AUK/2023). 2022. Available online: https://www.revosax.sachsen.de/vorschrift/19912 (accessed on 1 February 2023).
  43. Intergovernmental Panel on Climate Change. Global Warming of 1.5 °C: An IPCC Special Report on the Impacts of Global Warming of 1.5 °C above Pre-Industrial Levels and Related Global Greenhouse Gas Emission Pathways, in the Context of Strengthening the Global Response to the Threat of Climate Change, Sustainable Development, and Efforts to Eradicate Poverty; Intergovernmental Panel on Climate Change: Incheon, Republic of Korea, 2018. [Google Scholar]
  44. European Commission. The European Green Deal COM/2019/640 Final; European Commission: Luxembourg, 2019. [Google Scholar]
  45. R Core Team. R: A Language and Environment for Statistical Computing; R Foundation for Statistical Computing: Vienna, Austria, 2022. [Google Scholar]
  46. Wickham, H. Ggplot2: Elegant Graphics for Data Analysis, 2nd ed.; Use R! Springer: Cham, Switzerland, 2016; ISBN 978-3-319-24277-4. [Google Scholar]
  47. Arnold, J.B. Ggthemes: Extra Themes, Scales and Geoms for’ggplot2’. R Package Version 4.2.4. 2021. Available online: https://cran.r-project.org/web/packages/ggthemes/index.html (accessed on 1 February 2023).
  48. Peterson, B.G.; Carl, P. PerformanceAnalytics: Econometric Tools for Performance and Risk Analysis. R Package Version 2.0.4. 2020. Available online: https://cran.r-project.org/web/packages/PerformanceAnalytics/index.html (accessed on 1 February 2023).
  49. Forbes, S. PupillometryR: An R Package for Preparing and Analysing Pupillometry Data. J. Open Source Softw. 2020, 5, 2285. [Google Scholar] [CrossRef]
  50. Hijmans, R.J. Raster: Geographic Data Analysis and Modeling. R Package Version 3.5-21. 2022. Available online: https://cran.r-project.org/web/packages/raster/index.html (accessed on 1 February 2023).
  51. Wickham, H. Reshaping Data with the Reshape Package. J. Stat. Softw. 2007, 21, 1–20. [Google Scholar] [CrossRef]
  52. Ripley, B.; Lapsley, M. RODBC: ODBC Database Access. R Package Version 1.3-19. 2021. Available online: https://cran.r-project.org/web/packages/RODBC/index.html (accessed on 1 February 2023).
  53. Wickham, H.; Seidel, D. Scales: Scale Functions for Visualization. R Package Version 1.1.1. 2020. Available online: https://cran.r-project.org/web/packages/scales/index.html (accessed on 1 February 2023).
  54. Garnier, S.; Ross, N.; Rudis, R.; Camargo, P.A.; Sciaini, M.; Scherer, C. Viridis-Colorblind-Friendly Color Maps for R. R Package Version 0.6.2. 2021. Available online: https://rdrr.io/cran/viridis/ (accessed on 1 February 2023).
  55. Grêt-Regamey, A.; Weibel, B.; Bagstad, K.J.; Ferrari, M.; Geneletti, D.; Klug, H.; Schirpke, U.; Tappeiner, U. On the Effects of Scale for Ecosystem Services Mapping. PLoS ONE 2014, 9, e112601. [Google Scholar] [CrossRef]
  56. Franko, U.; Witing, F.; Thiel, E.; Ließ, E.; Diel, J.; Gasser, A. CNP Manual 2023. Available online: https://cnp.sde.ok.gov/OKNSLP/PrintDocuments.aspx (accessed on 1 February 2023).
  57. Franko, U. C-N-P Software Downloads. Available online: http://www.frug.info/candy_cnp.php (accessed on 10 March 2023).
  58. Lülfs-Baden, F.; Barrett, S.; Schulze Höping, M.; Stahl, H. Situation der Bodenbearbeitung in Sachsen-Eine Analyse zur Verbreitung Verschiedener Bodenbearbeitungsverfahren und der Damit Verbundenen Technischen Ausstattung; Schriftenreihe des LfULG; Sächsisches Landesamt für Umwelt, Landwirtschaft und Geologie (LfULG): Dresden, Germany, 2020; p. 215. [Google Scholar]
  59. Dimassi, B.; Guenet, B.; Saby, N.P.A.; Munoz, F.; Bardy, M.; Millet, F.; Martin, M.P. The Impacts of CENTURY Model Initialization Scenarios on Soil Organic Carbon Dynamics Simulation in French Long-Term Experiments. Geoderma 2018, 311, 25–36. [Google Scholar] [CrossRef]
  60. Foereid, B.; Bellamy, P.H.; Holden, A.; Kirk, G.J.D. On the Initialization of Soil Carbon Models and Its Effects on Model Predictions for England and Wales. Eur. J. Soil Sci. 2012, 63, 32–41. [Google Scholar] [CrossRef]
  61. Jordon, M.W.; Smith, P.; Long, P.R.; Bürkner, P.-C.; Petrokofsky, G.; Willis, K.J. Can Regenerative Agriculture Increase National Soil Carbon Stocks? Simulated Country-Scale Adoption of Reduced Tillage, Cover Cropping, and Ley-Arable Integration Using RothC. Sci. Total Environ. 2022, 825, 153955. [Google Scholar] [CrossRef]
  62. Witing, F.; Prays, N.; O’Keeffe, S.; Gründling, R.; Gebel, M.; Kurzer, H.-J.; Daniel-Gromke, J.; Franko, U. Biogas Production and Changes in Soil Carbon Input-A Regional Analysis. Geoderma 2018, 320, 105–114. [Google Scholar] [CrossRef]
  63. Franko, U.; Witing, F.; Jäckel, G.; Volk, M. Large-Scale Identification of Hot Spots for Soil Carbon Demand under Climate Change and Bioenergy Production. J. Plant Nutr. Soil Sci. 2015, 178, 199–208. [Google Scholar] [CrossRef]
  64. Franko, U.; Witing, F.; Volk, M. Climate Change Induced Carbon Competition: Bioenergy versus Soil Organic Matter Reproduction. In Atlas of Ecosystem Services: Drivers, Risks, and Societal Responses; Schröter, M., Bonn, A., Klotz, S., Seppelt, R., Baessler, C., Eds.; Springer International Publishing: Cham, Switzerland, 2019; pp. 257–262. ISBN 978-3-319-96229-0. [Google Scholar]
  65. Tiefenbacher, A.; Sandén, T.; Haslmayr, H.-P.; Miloczki, J.; Wenzel, W.; Spiegel, H. Optimizing Carbon Sequestration in Croplands: A Synthesis. Agronomy 2021, 11, 882. [Google Scholar] [CrossRef]
  66. Haddaway, N.R.; Hedlund, K.; Jackson, L.E.; Kätterer, T.; Lugato, E.; Thomsen, I.K.; Jørgensen, H.B.; Isberg, P.-E. How Does Tillage Intensity Affect Soil Organic Carbon? A Systematic Review. Environ. Evid. 2017, 6, 30. [Google Scholar] [CrossRef]
  67. Baker, J.M.; Ochsner, T.E.; Venterea, R.T.; Griffis, T.J. Tillage and Soil Carbon Sequestration—What Do We Really Know? Agric. Ecosyst. Environ. 2007, 118, 1–5. [Google Scholar] [CrossRef]
  68. Lugato, E.; Leip, A.; Jones, A. Mitigation Potential of Soil Carbon Management Overestimated by Neglecting N2O Emissions. Nat. Clim. Chang. 2018, 8, 219–223. [Google Scholar] [CrossRef]
Figure 1. Workflow for assessing the SOC dynamics of arable land of Saxony and the carbon sequestration potential of alternative management practices (AMP) across a series of scales. Upscaled model set-ups on four different administrative levels of Europe (NUTS1, NUTS2, NUTS3, and LAU) were evaluated against the simulation results of a 500 m grid-based reference model.
Agronomy 13 01159 g001
Figure 2. SOC trends (‰ per year based on SOC stocks of 1998) of the case study area Saxony (NUTS1 region in Germany) simulated with five different levels of data aggregation for the period 1998–2014. (a) Results of the grid-based reference simulation (29,319 grid cells). White areas represent non-arable land. (b) Results of the simulations using upscaled model set-ups on the level of administrative units (NUTS1, NUTS2, NUTS3, and LAU). (c) Scatter plots comparing results of the upscaled and the (grid-based) reference model set-up on the level of the individual administrative units (NUTS1: n = 1; NUTS2: n = 3; NUTS3: n = 13; LAU: n = 414). ©EuroGeographics for the administrative boundaries.
Agronomy 13 01159 g002
Figure 3. (a) Distribution of model errors observed when comparing SOC trends of the upscaled model set-ups with the grid-based reference simulation on the same administrative levels. (b) Maps of observed errors in the trend of SOC stocks for upscaled model set-ups. White areas represent non-arable land. ©EuroGeographics for the administrative boundaries.
Agronomy 13 01159 g003
Figure 4. Correlation matrices between absolute errors of the upscaled model set-ups (comparing SOC trends of the upscaled model set-ups with the grid-based reference simulation on the level of individual administrative units) and the spatial dispersion (standard deviation) of a set of predictor variables describing the input and turnover conditions of soil-related carbon. (a) Correlation matrices for the LAU-level model set-up; (b) Correlation matrices for the NUTS3-level model set-up. The predictors of the matrices are the soil carbon reproduction flux (Crep), carbon turnover indicator BAT, soil fine particle content (FAT), conservation tillage shares (Cons_till), annual mean temperature (Temp) and annual precipitation (Precip). For each predictor, its regional dispersion (standard deviation—SD) within an administrative unit was calculated from the reference dataset and used for the correlation matrix. The distribution of each variable is shown on the diagonal. Below this diagonal, the bivariate scatter plots with a fitted line are displayed. Above the diagonal, the value of the correlation is shown as well as its significance level (stars), where the p-values of <0.001, <0.01 are associated with the symbols *** and **, respectively.
Agronomy 13 01159 g004
Figure 5. Correlation matrices between the absolute errors of the LAU-level model set-up and the spatial dispersion (standard deviation) of a set of predictor variables. (a) Correlation matrix for a subset of LAU regions that show a low variability in carbon turnover conditions (BAT); (b) correlation matrix for a subset of LAU regions that show a high variability in carbon turnover conditions (BAT). The predictors of the matrices are the soil carbon reproduction flux (Crep), soil fine particle content (FAT), conservation tillage shares (Cons_till), annual mean temperature (Temp) and annual precipitation (Precip). For each predictor, its regional dispersion (standard deviation—SD) within an administrative unit was calculated from the reference dataset and used for the correlation matrices. The distribution of each variable is shown on the diagonal. Below this diagonal, the bivariate scatter plots with a fitted line are displayed. Above the diagonal, the value of the correlation is shown as well as its significance level (stars), where the p-values of <0.001, <0.01, <0.05 are associated with the symbols ***, ** and *, respectively.
Agronomy 13 01159 g005
Figure 6. Carbon sequestration potential of the first alternative management practice (AMP-1; increasing soil carbon influx based on increased cultivation of field grass and cover crops) simulated with five different model set-ups. (a) Results of the grid-based reference simulation compared to the four upscaled model set-ups. (b) Same content as (a), but using a logarithmic scale for better visualization of carbon sequestration in smaller LAU regions. (c) Model errors in the assessment of AMP-1 for individual administrative units.
Agronomy 13 01159 g006
Figure 7. Carbon sequestration potential of the second alternative management practice (AMP-2; reducing carbon turnover conditions by increasing the use of conservation tillage) simulated with five different model set-ups. (a) Results of the grid-based reference simulation compared to the four upscaled model set-ups. (b) Same content as (a), but using a logarithmic scale for better visualization of carbon sequestration in smaller LAU regions. (c) Model errors in the assessment of AMP-2 for individual administrative units.
Agronomy 13 01159 g007
Table 1. Parameterization of the alternative management practice (AMP) scenarios summarized on the level of Saxony (NUTS1).
Crop Shares and Soil Management20142015–2050
AMP-1silage maize11.4%7.4% (−4%) *
winter barley12.2%7.9% (−4.3%) *
field grass3.1%11.4% (+8.3%)
winter cover crops6.6%16.6% (+10%)
AMP-2conservation tillage37.1%56.0% (+18.9%) **
* cultivated areas reduced by 35% (compared to the status of 2014) and transferred to field grass; ** 30% of the areas with conventional soil management were converted into conservation tillage areas.
Table 2. Overview of model complexities and general trends in SOC dynamics of the Saxon arable land (NUTS1 region) simulated for the reference period (1998–2014). A grid-based reference set-up is compared with four upscaled model set-ups simulating SOC dynamics at the level of administrative units.
Simulation LevelNumber of Spatial UnitsNumber of Modeling UnitsSOC Initialization [Mt]Soil Carbon Sequestration within the Simulation Period 1998–2014
[Mt C][kg C ha−1 y−1][‰ y−1] *
GRID29,31929,31941.402.65212.563.76
LAU414198041.402.63210.923.73
NUTS31325341.402.56205.813.64
NUTS2310041.412.55204.483.62
NUTS114941.402.56205.753.64
* based on SOC stocks of 1998.
Disclaimer/Publisher’s Note: The statements, opinions and data contained in all publications are solely those of the individual author(s) and contributor(s) and not of MDPI and/or the editor(s). MDPI and/or the editor(s) disclaim responsibility for any injury to people or property resulting from any ideas, methods, instructions or products referred to in the content.

