Article

Peanut Defect Identification Based on Multispectral Image and Deep Learning

1
Semiconductor Power Device Reliability Engineering Research Center, Ministry of Education, College of Big Data and Information Engineering, Guizhou University, Guiyang 550025, China
2
Frontier Institute of Chip and System, Fudan University, Shanghai 200433, China
3
State Key Laboratory of Public Big Data, Guizhou University, Guiyang 550025, China
*
Author to whom correspondence should be addressed.
Agronomy 2023, 13(4), 1158; https://doi.org/10.3390/agronomy13041158
Submission received: 6 March 2023 / Revised: 11 April 2023 / Accepted: 14 April 2023 / Published: 19 April 2023
(This article belongs to the Section Precision and Digital Agriculture)

Abstract

:
To achieve the non-destructive detection of peanut defects, a multi-target identification method based on the multispectral system and improved Faster RCNN is proposed in this paper. In terms of the system, the root-mean-square contrast method was employed to select the characteristic wavelengths for defects, such as mildew spots, mechanical damage, and the germ of peanuts. Then, a multispectral light source system based on a symmetric integrating sphere was designed with 2% nonuniformity illumination. In terms of Faster RCNN improvement, a texture-based attention and a feature enhancement module were designed to enhance the performance of its backbone. In the experiments, a peanut-deficient multispectral dataset with 1300 sets was collected to verify the detection performance. The results show that the evaluation metrics of all improved compared with the original network, especially in the VGG16 backbone network, where the mean average precision (mAP) reached 99.97%. In addition, the ablation experiments also verify the effectiveness of the proposed texture module and texture enhancement module in peanut defects detection. In conclusion, texture imaging enhancement and efficient extraction are effective methods to improve the network performance for multi-target peanut defect detection.

1. Introduction

Due to their high nutritional value and usage as the main raw material for oil, peanuts are widely grown around the world [1,2]. However, mechanical damage and the germination of peanuts are common defects in the process of harvesting and storage [3,4]. In addition, peanuts with these defects are more likely to be infected with mold and to produce toxins, which in turn poses a potential threat to consumers [5]. Therefore, fast and non-destructive defect inspection of peanuts is essential before processing and selling them.
In past years, computer vision technologies have been widely studied as efficient agricultural product detection approaches for defects, such as mold, mechanical damage, and germs [6,7,8]. On the one hand, researchers have tried to explore new photoelectric detection solutions from hardware setups to highlight defective image features and improve image quality [9]. On the other hand, new image processing algorithms have been developed to improve the speed and accuracy of automatic defect detection [10].
To highlight defects of agricultural products, researchers have extensively investigated multispectral approaches in terms of optoelectronic detection systems [11,12,13]. Based on the differences in the reflection spectra of agricultural products, multispectral techniques use specific spectra to enhance the visibility of defects. Huang et al. designed a multispectral system to detect mechanical damage in apples using characteristic wavelengths (CWs), such as 780 nm, 850 nm and 960 nm [14]. The experimental results showed that the apple defect image features were significantly enhanced, and the defect detection accuracy was improved at the CW. Yang et al. designed a detection system for the potato germ, and 25 CWs in the range of 696 to 952 nm were selected for image acquisition [15]. The contrast between the region of interest (ROI) and the background was enhanced by the proposed multispectral technique, thereby improving the correct rate of potato germ detection. Bartolić et al. designed a grain defect detection system, and the experiment results showed that the differences of grains in the spectral reflectance between healthy and mold-infected were 7.9–9.6 times clearer when illuminated by the CW [16]. The above studies show that multispectral technology can significantly enhance the appearance of defect features, which is of great benefit to improve the accuracy of subsequent feature recognition.
Furthermore, in the passive multispectral image acquisition system, light spots and shadows on the target object can cause image contamination and affect the image recognition. Therefore, Bandara et al. designed a curcuma longa foreign detection system based on the integral hemisphere structure, which effectively reduced the spot pollution in the image [17]. In addition, the researchers also tried to design the image acquisition system using a symmetric light source structure to reduce the shadows on 3-dimensional objects [18,19]. These studies show that the uniform light source structure and the symmetrical light source structure in the image acquisition system are effective approaches for improving imaging quality.
To automate the detection of defects in agricultural products, researchers have developed a series of computer vision algorithms. In the field of peanut defect detection, studies have commonly focused on the classification and segmentation of defects. On the one hand, researchers mainly used BP neural networks, support vector machines, and VGG16 algorithms to achieve the classification of defective images for peanut mold and other defective features [20,21,22]. On the other hand, researchers used Otsu, DeepLabv3+, SegNet, and U-Net algorithms to segment defective peanuts, such as peanut mold, foreign objects, and mechanical damage [23,24]. The above studies have made an important contribution to accelerating the automated detection of peanut defects. Compared to the data acquisition system of the white light source, the introduction of multispectral lighting technology is more advantageous in highlighting the features of peanut defects. Despite these advantages, care needs to be taken during the design of multispectral systems to avoid the negative effects of illumination nonuniformity and shadows. Therefore, designing a uniform light source based on multispectral technology and symmetrical structure is beneficial for improving the quality of peanut defect data. Furthermore, the design of automatic inspection and sorting equipment puts forward requirements for computer vision algorithms to achieve both multi-target classification and related location information. Therefore, in addition to the hot research topics of classification and segmentation, an automatic identification algorithm that can provide guidance information on defect types and location information for peanut sorting equipment is of practical interest.
With advantages in terms of classification and localization, Faster RCNN has been researched as a good candidate for the detection of defects in many agricultural products [25]. Basri et al. constructed a dataset of defects in fruit, such as mango, lime, and dragon fruit, and Faster RCNN was employed to identify and locate the defects [26]. Xi et al. designed a system based on an improved Faster RCNN for detection in a potato germ dataset [27]. In this research, the anchor points of Faster RCNN were improved by a chaotic optimized K-Means algorithm, resulting in the 97.71% accuracy of potato germ detection. Bari et al. designed a rice leaf defect detection system based on an improved Faster RCNN [28]. In this study, a dataset of rice leaf diseases and pests was first constructed, and then the region proposal network of Faster RCNN was optimized to achieve 99.25% accuracy. The above studies show that Faster RCNN is widely used in the target identification tasks for agricultural products and achieves good accuracy in localization and classification.
Attention mechanism and feature enhancement are reliable strategies to improve the feature extraction ability of convolutional networks, both of which have outstanding performance in Faster RCNN. On the one hand, researchers have improved the backbone network feature extraction efficiency by channels or spatial attention mechanisms [29,30,31]. On the other hand, researchers have also tried to enrich the network feature map with the help of feature enhancement, such as for colors, oriented gradients, RGB, and ROI [32,33,34].
In summary, a high-quality dataset and an accurate algorithm are essential to achieve the multi-objective identification of peanut kernel defects. To the best of our knowledge, this study is the first to apply a target recognition algorithm to the detection of peanut defects. In terms of the dataset, a target identification dataset is generated, the objects including healthy peanuts (HPs), moldy peanuts (MPs), mechanically damaged peanuts (MDPs), and germinated peanuts (GPs). In this process, the root-mean-square contrast (RMSC) algorithm and the symmetrical integrating sphere structure are employed. The former is used to select the characteristic wavelengths, while the latter is employed to reduce contamination, such as light spots and shadows, during the image acquisition process. In terms of the target identification algorithm, based on the characteristics of the texture differences in defective peanuts, a texture-based attention module and a feature enhancement module are proposed to optimize the performance of the classical Faster RCNN. Finally, the improved network is trained and tested on the collected peanut-defective multispectral dataset.

2. Materials and Methods

In order to achieve the purpose of peanut defect detection, a dataset was prepared, and then the dataset was used for the neural network training to achieve the target identification task.

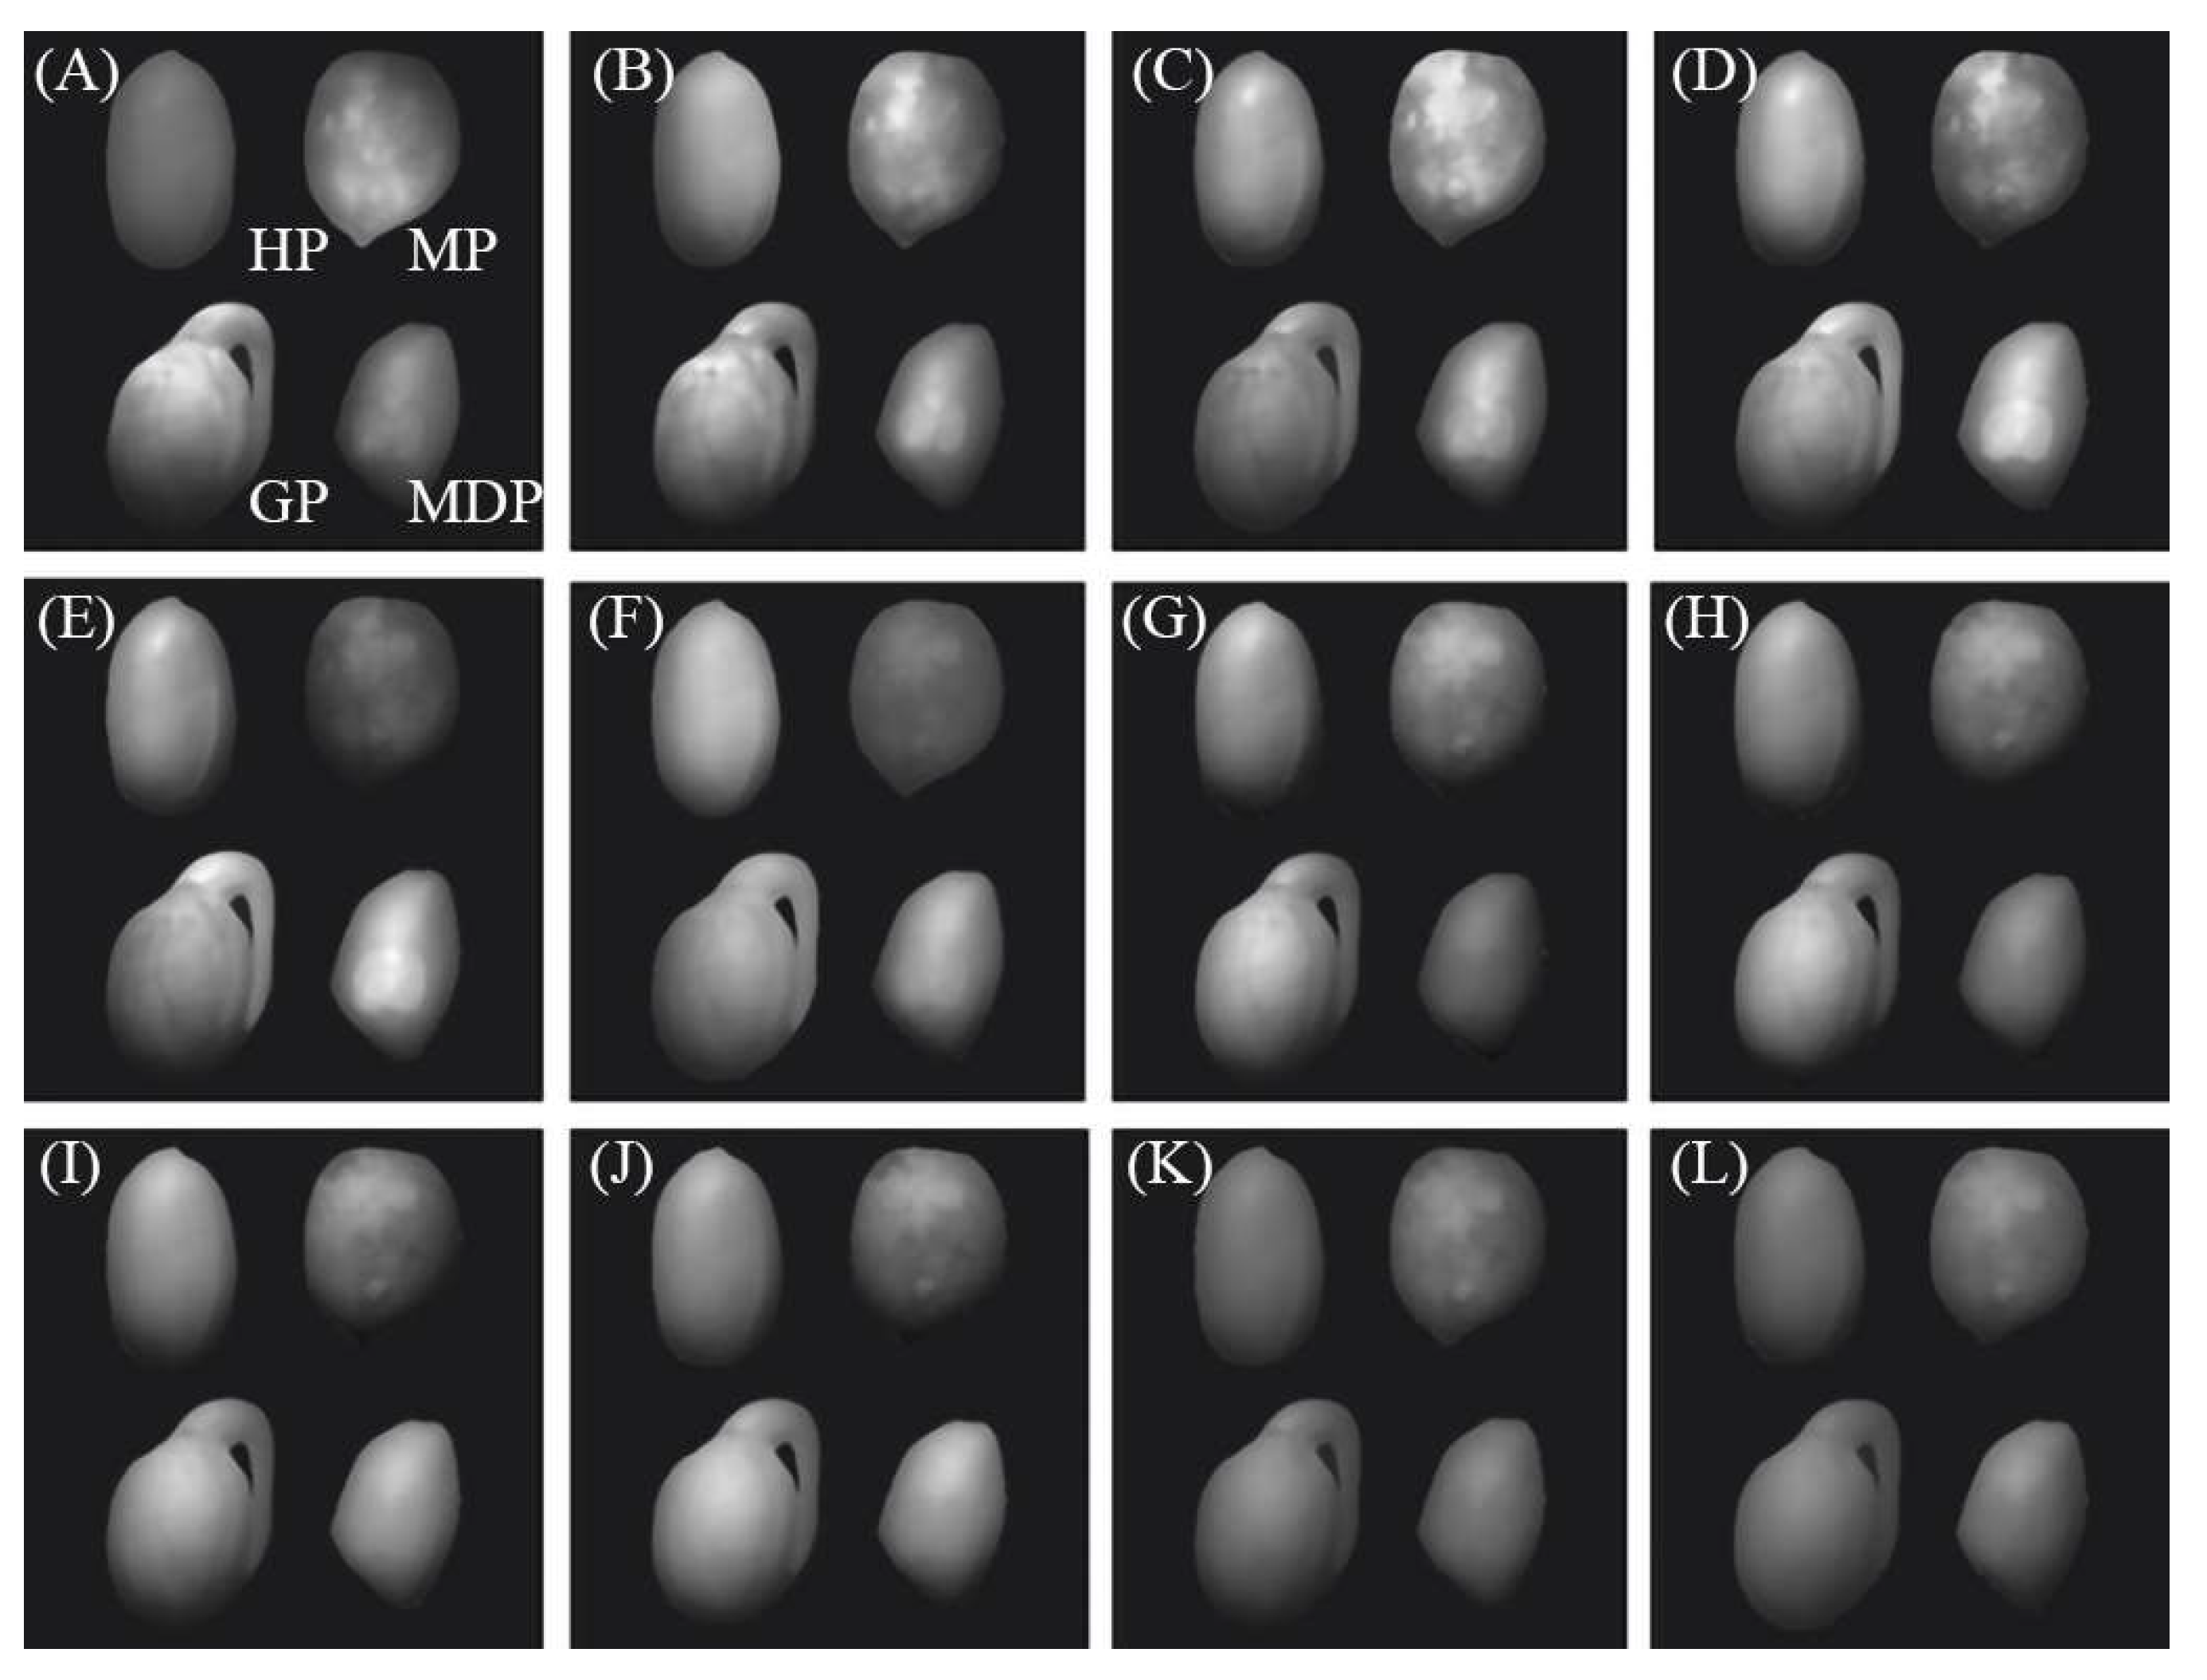
2.1. Peanut Defects Dataset Preparation

The dataset was prepared in the following three steps. First, the CWs of peanut defects were determined experimentally. Second, a MSI acquisition system was designed based on the light source of CW, and peanut defect image acquisition was performed. Finally, the ground truth (GT) labels of the MSIs were manually annotated for the dataset.

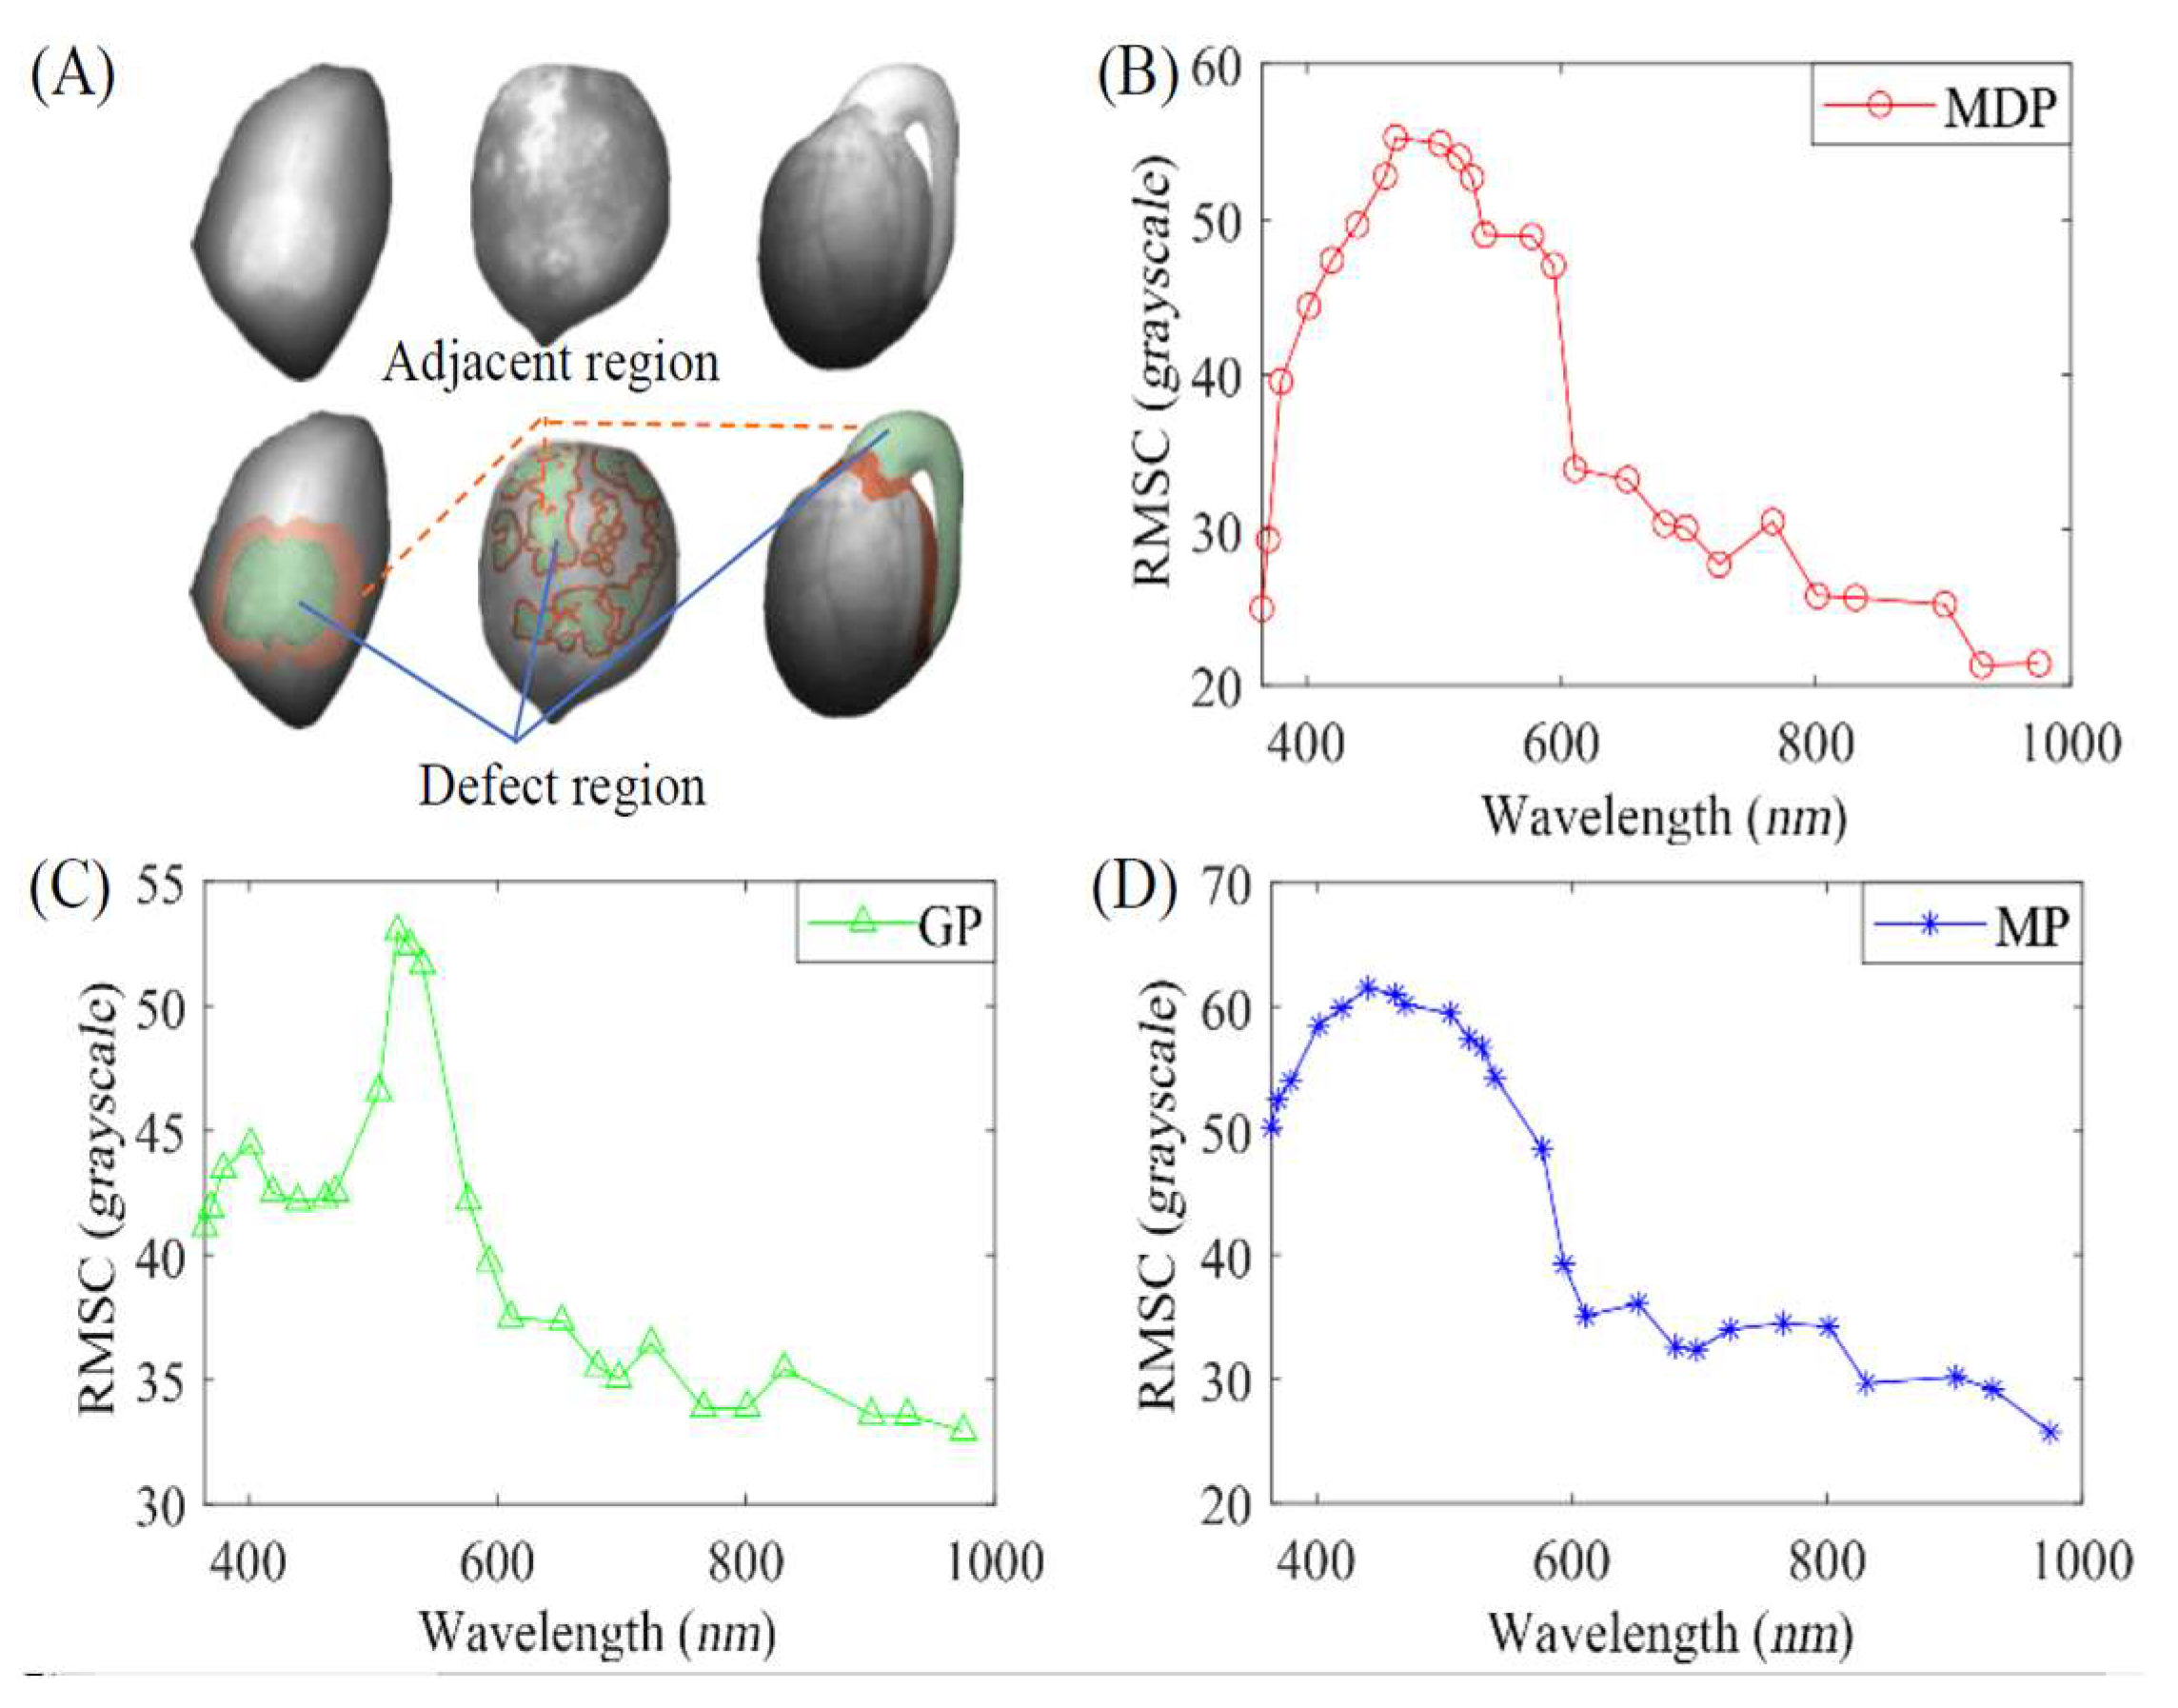
2.1.1. Multispectral Characteristic Wavelength

Since regions, such as mold spot, mechanical damage, and the germ in peanuts, have a different spectral absorption or reflectance, the defective regions will show certain bright and dark differences under the illumination of CWs [35]. To determine the CWs of peanut defects, 25 light emitting diodes (LEDs) with different wavelengths in the range of 365–975 nm were selected as light sources for the defective peanut samples, and some representative ones are shown in Figure 1.
From Figure 1, it can be observed that there are obvious bright and dark differences of the defective regions under the illumination of different lights. The mold spot region appears as brighter irregular patches in the range of 365 to 470 nm and forms a large contrast with the neighborhood, as shown in Figure 1A–D. The mechanically damaged region exhibits a brighter feature than the neighborhood under illumination in the range of 377 to 520 nm, as shown in Figure 1B–E. The region of the germ exhibits a brighter feature than the other regions in the 470–698 nm band, also shown in Figure 1B–E.
Combining the analysis above, it can be concluded that the selection of CW as the light source helps to highlight the defective regions, such as mold spot, mechanical damage, and the germ. The difference in the bright and dark contrast between the sample defects and their neighborhood regions can be adopted as the basis to determine the CWs of sampling the system.
To achieve the above purpose, the algorithm, followed by three steps, is proposed: Firstly, the defect is taken as the ROI and segmented manually to analyze the grayscale characteristics. The segmentation results of the defect regions are shown in Figure 2. Secondly, as the bright and dark contrast between defects and the neighborhood region tends to be higher under CW illumination, the contrast ratio between the defect and its adjacent region (AR) is introduced to quantitatively evaluate the visibility of defects.
To extract adjacent regions, computer morphological dilation operations are performed on the defective regions and further intersected with non-defective regions by logical “And” operations. Therefore, the intersected set is the neighborhood of the defective region. The above process can be expressed by Equation (1).
A R = { D } H ,
where AR is the pixel set of the adjacent region of defect; H is the pixel set of the non-defective region. D represents the pixel set of the defect area after dilation treatment and is defined as Equation (2).
D = D S = z | ( S ^ ) z D ,
where S is the structuring elements of the expansion operation, and z is the element belonging to S; D is the pixel sets of the defect. The boundary regions extracted by this method are shown in Figure 2.
Finally, the RMSC is used to evaluate the difference between the defect and the region defined by Equation (2) [36], which is further applied to quantitatively determine the CW. The RMSC is defined by Equation (3).
C = ( d = 1 D ( I d μ ) 2 ) / D ,
where C is the value of RMSC; Id is the gray value corresponding to each pixel in the defective region; and D is the total number of pixels in the defective region. The average gray value of the region is defined by Equation (4), which is as follows.
μ = ( a = 1 A R I a ) / A R ,
where Ia is the grayscale value of each pixel in the AR.
The RMSC of the mold spot, mechanical damage, and germ regions at wavelengths from 365 to 975 nm is calculated based on the experimental data and is shown in Figure 2. In Figure 2, a higher RMSC means that the defect area has a more pronounced contrast between bright and dark within its domain, which indicates the defect and its adjacent region are easier to distinguish. Accordingly, the CWs for peanut defects of the mold, mechanical damage, and germ are 440 nm, 470 nm, and 520 nm, respectively. Therefore, the above CWs are selected as illumination sources for the image acquisition system.

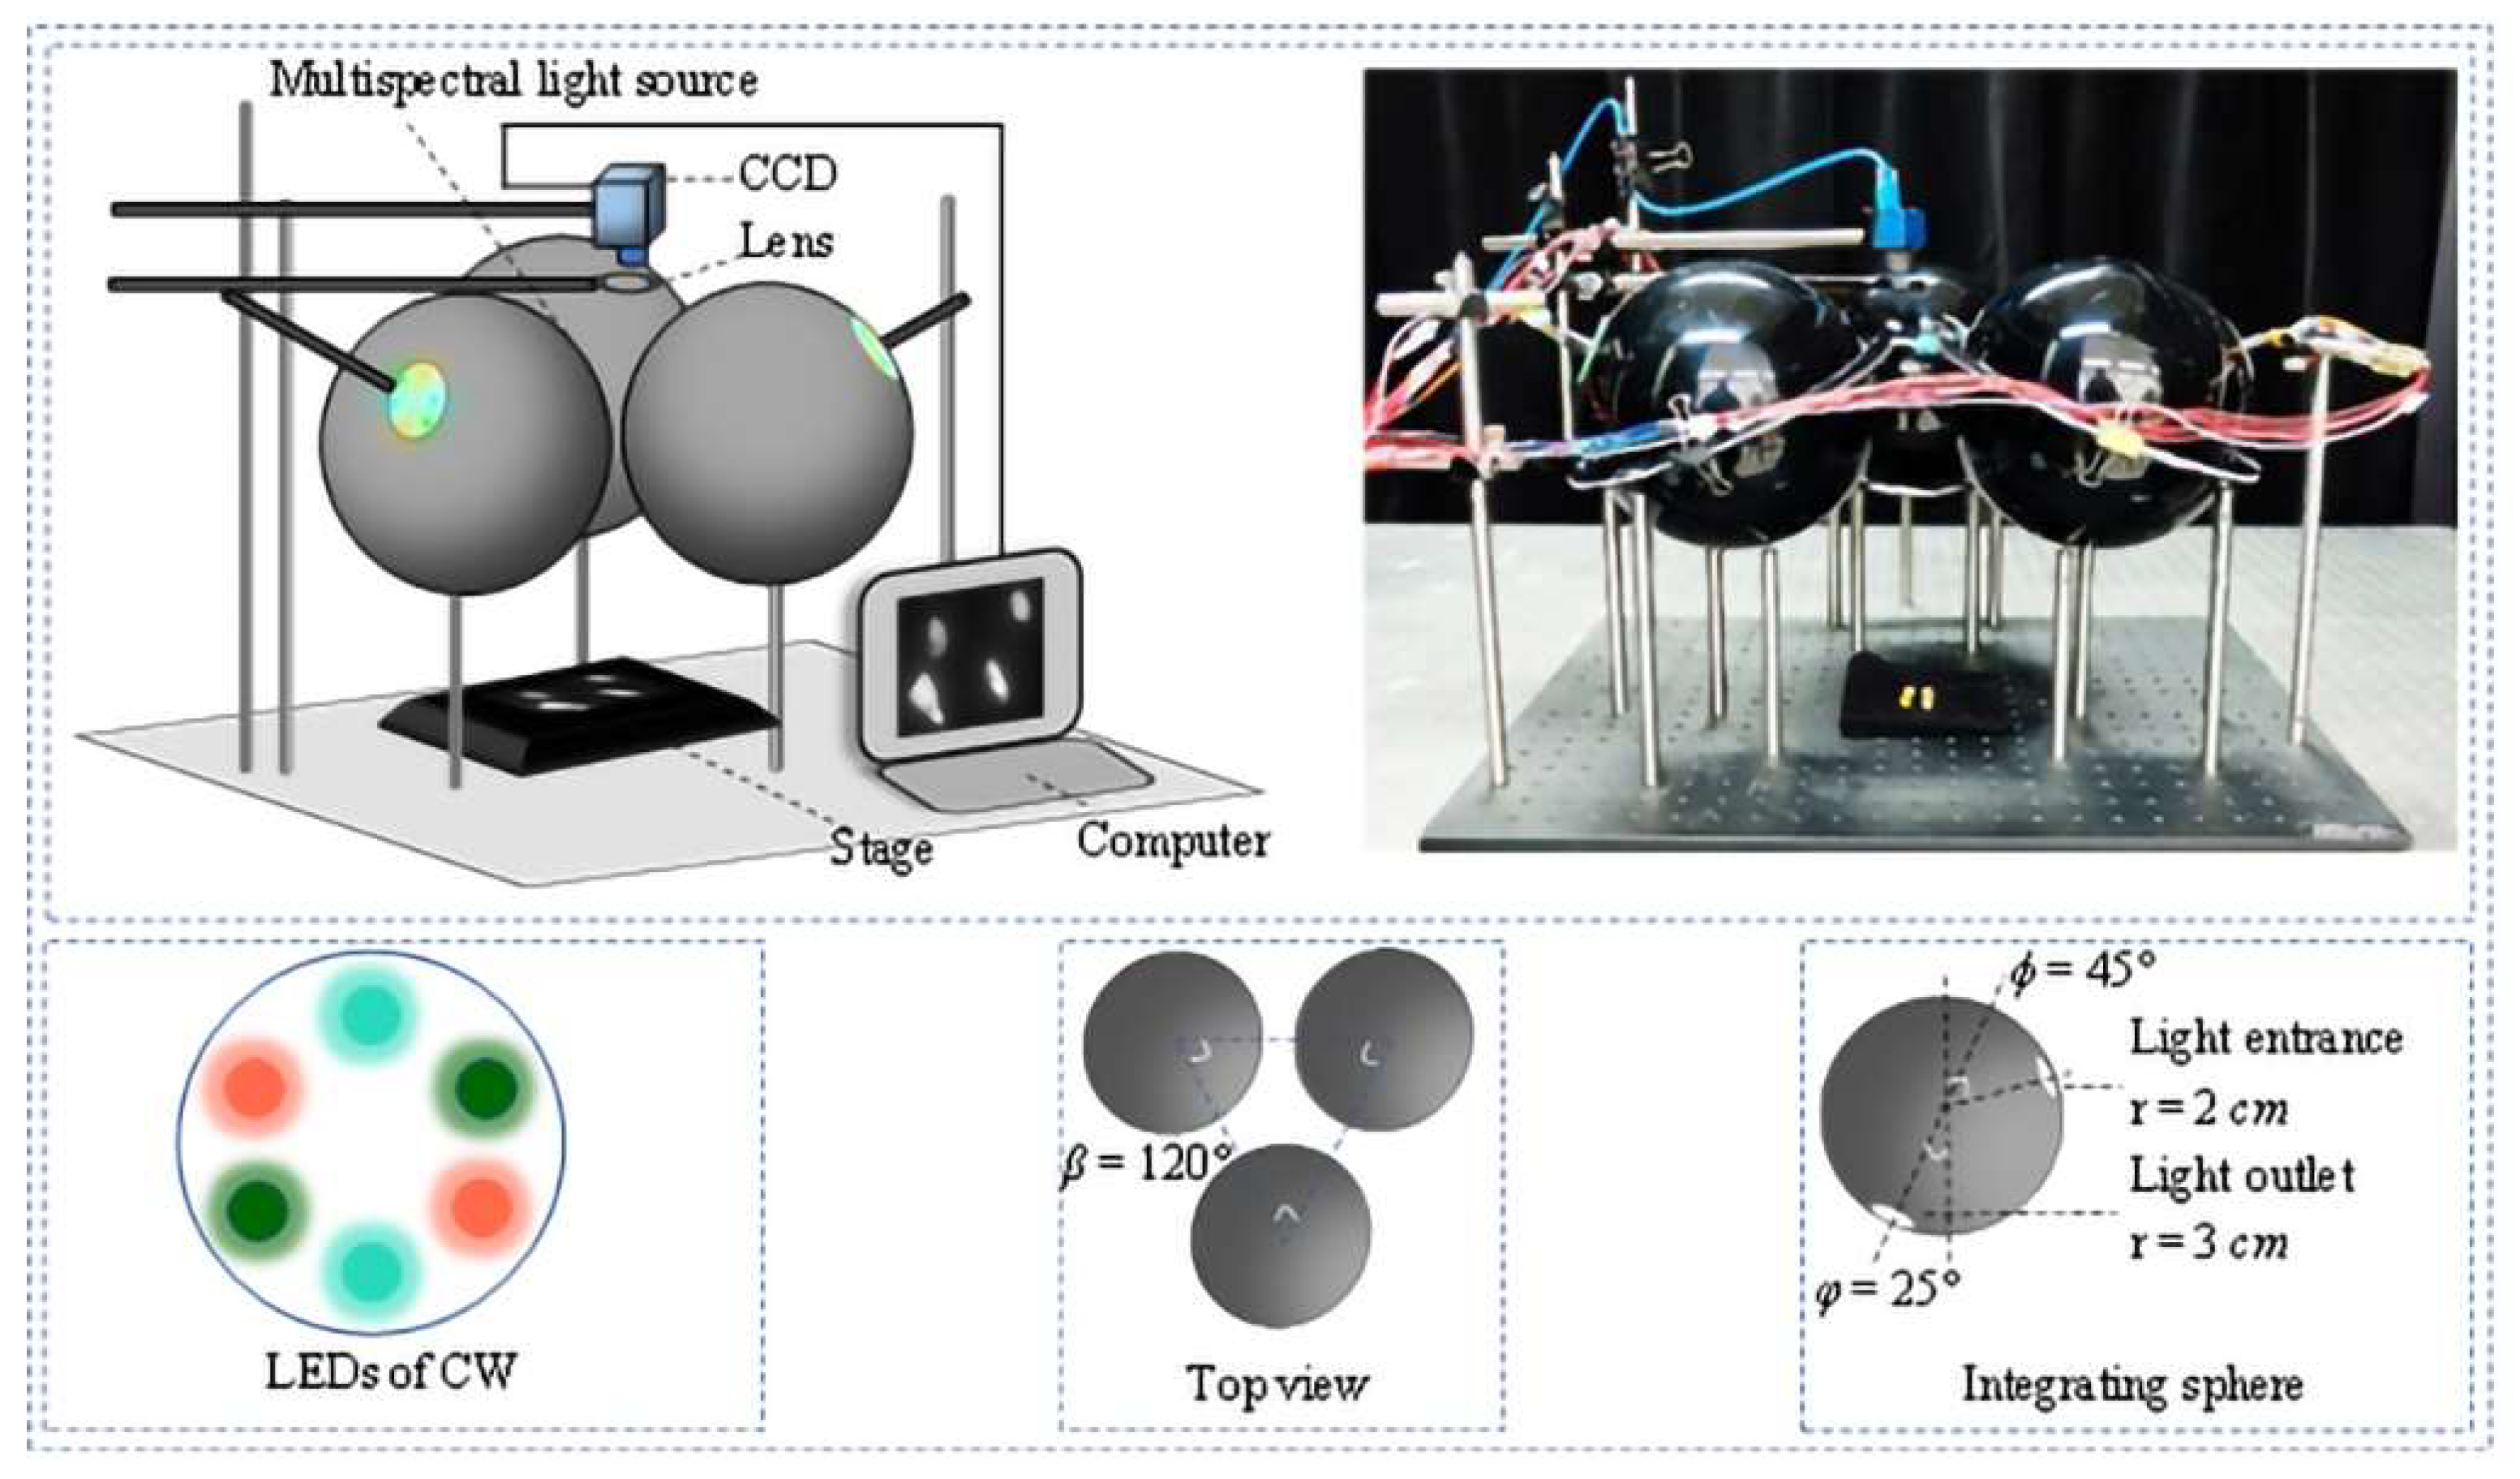
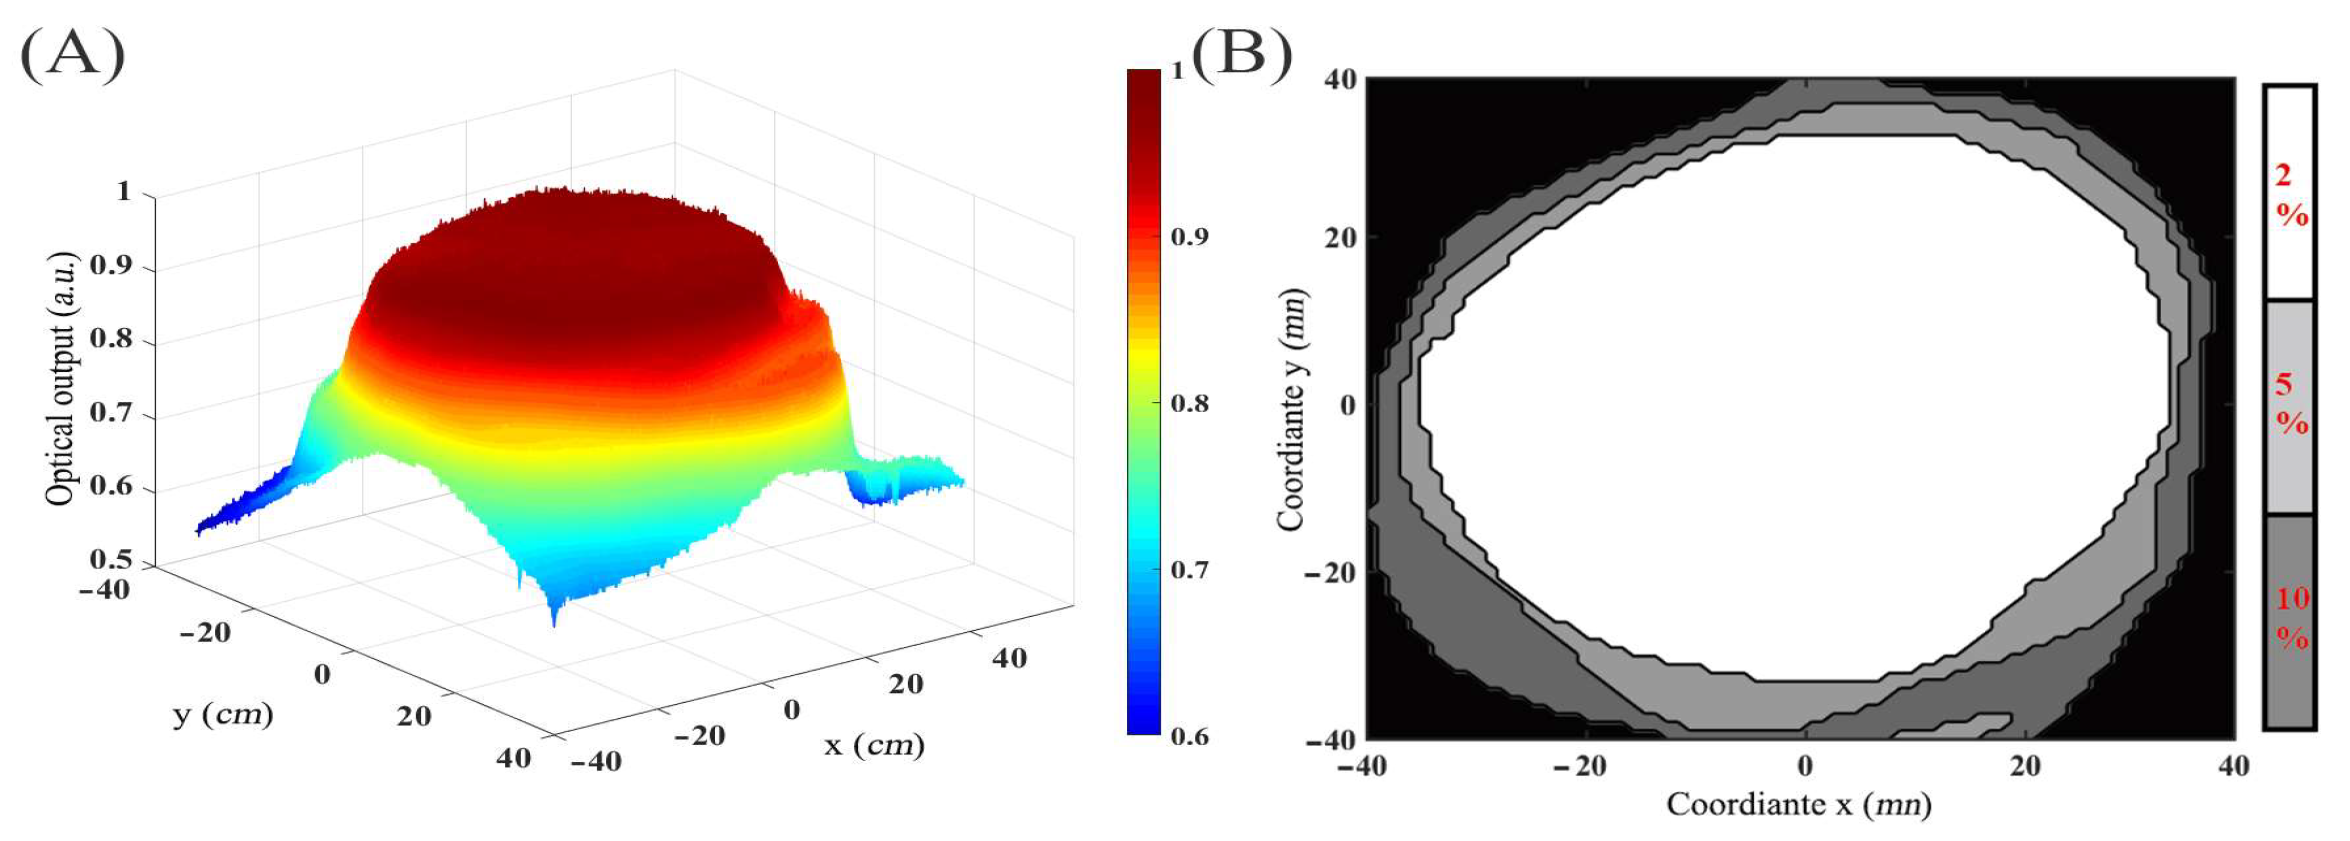
2.1.2. Acquisition System

Furthermore, a multispectral image acquisition system is designed. The system is based on a symmetric integrating sphere structure, implemented with the aim of reducing light spots and shadow contamination during image acquisition. As shown in Figure 3, the image acquisition system consists of a carrier table, charge coupled device (CCD) camera (MER-132-43U3M-L, Da Heng Image Inc., Beijing, China), computer (Z40, Lenovo, Beijing, China), and multispectral light source devices.
A carrier table of 8 × 8 cm acts as the sample stage for the peanuts, and a monochrome CCD camera with a resolution of 1292 × 964 pixels is used for image acquisition and storage, together with a computer. The integral sphere chamber is introduced as a light mixture structure to provide uniform illumination and reduce local bright spots. Meanwhile, the integrating spheres are distributed in an axisymmetric manner to provide multiple angles of incident light to reduce shadows. Each integrating sphere is composed of a hollow spherical body made of black acrylic material with a radius of 12.5 cm. During the manufacturing process, a laser engraving machine (WER-1080, Vollerun Inc., Shandong, China) is first used to etch the entrance and exit apertures with radii of 2 cm and 3 cm, at points (12.5, 0, π / 4 ) and (12.5, 0, π ) on the sphere’s surface, respectively. Next, a layer of BaSO4, approximately 0.1 cm in thickness, is coated on the inner surface of the sphere to form a complete integrating device. Three types of LED chips with different CWs are soldered onto a circular Printed Circuit Board (PCB) with a diameter of 2 cm and tightly attached to the entrance of an integrating sphere, directly coupling the emitting rays into the chamber. Furthermore, a corresponding driving circuit and system is developed to control each color channel independently.
In order to better evaluate the quality of the system illumination uniformity, the metrics of Bias parameter is employed [37], as defined by Equation (5).
B i a s = ± ( ( E max E min ) / ( E max + E min ) )
where E max and E min are the maximum and minimum light intensity on the test area, respectively. The experimental results of the system Bias are shown in Figure 4.
As can be seen in Figure 4, an area of approximately 28 cm2 of light uniformity is achieved in the center of the test area, which has a light inhomogeneity of 2%.

2.1.3. Dataset Acquisition and Labeling

The dataset is prepared in the following steps. First, the HP, MP, MDP, and GP samples are randomly placed on the carrier table. Then, turn on the monochrome LED with a peak wavelength of CW and capture images of peanuts under LED illumination using a monochromic CCD camera. In the process of dataset collection, the LEDs are sequentially turned on to cover all characteristic wavelengths. Therefore, each sample image in the set consists of three monochromatic channels. Second, the dataset is enlarged by continuously updating the peanut kernel samples and adjusting the position and pose. Finally, a total of 1300 set MSIs of peanut defects are acquired for training, validating, and testing the algorithm. Further, to obtain the dataset for Faster RCNN training, validation, and testing, the peanuts in the images are labeled and classified using rectangular boxes, and label files supporting the Pascal VOC 2012 format are output.

2.2. Target Identification Model

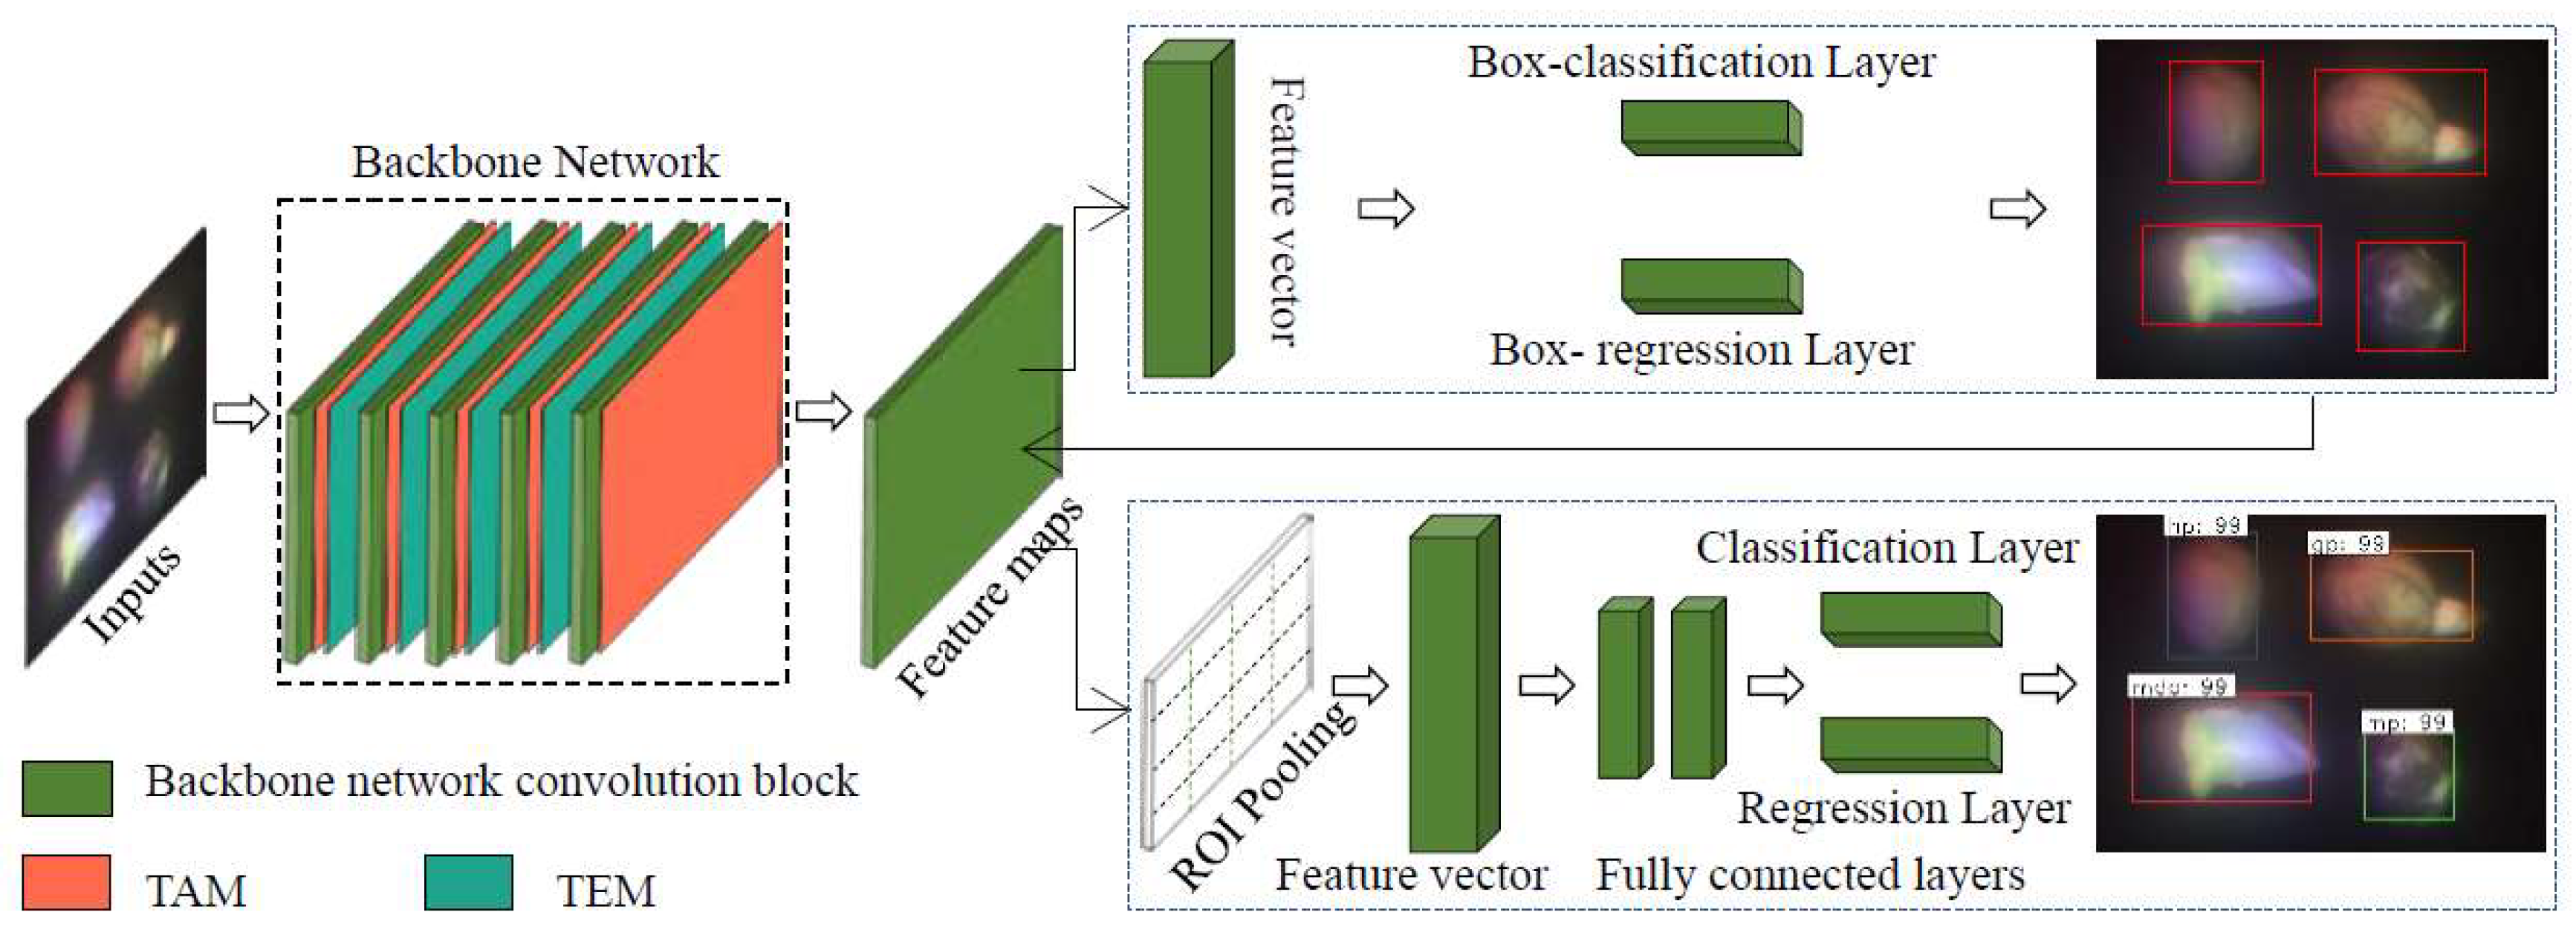
2.2.1. Network Structure

Faster RCNN mainly contains three parts: the backbone network, region proposal network, and classification network, as shown in Figure 5. The backbone network can be composed of convolutional networks, such as VGG and ResNet [38,39], which are used for image feature extraction and provide feature maps for the subsequent region proposal network; thus, the backbone network performance is a key factor affecting the target identification accuracy of Faster RCNN [40].
In addition, the texture distribution and strength of defective peanuts are important features for distinguishing defect types. Therefore, we propose a texture attention module (TAM) and a texture enhancement module (TEM), which are based on the texture feature extraction mechanism. The two modules are used to optimize the convolutional and pooling layers of the backbone network.

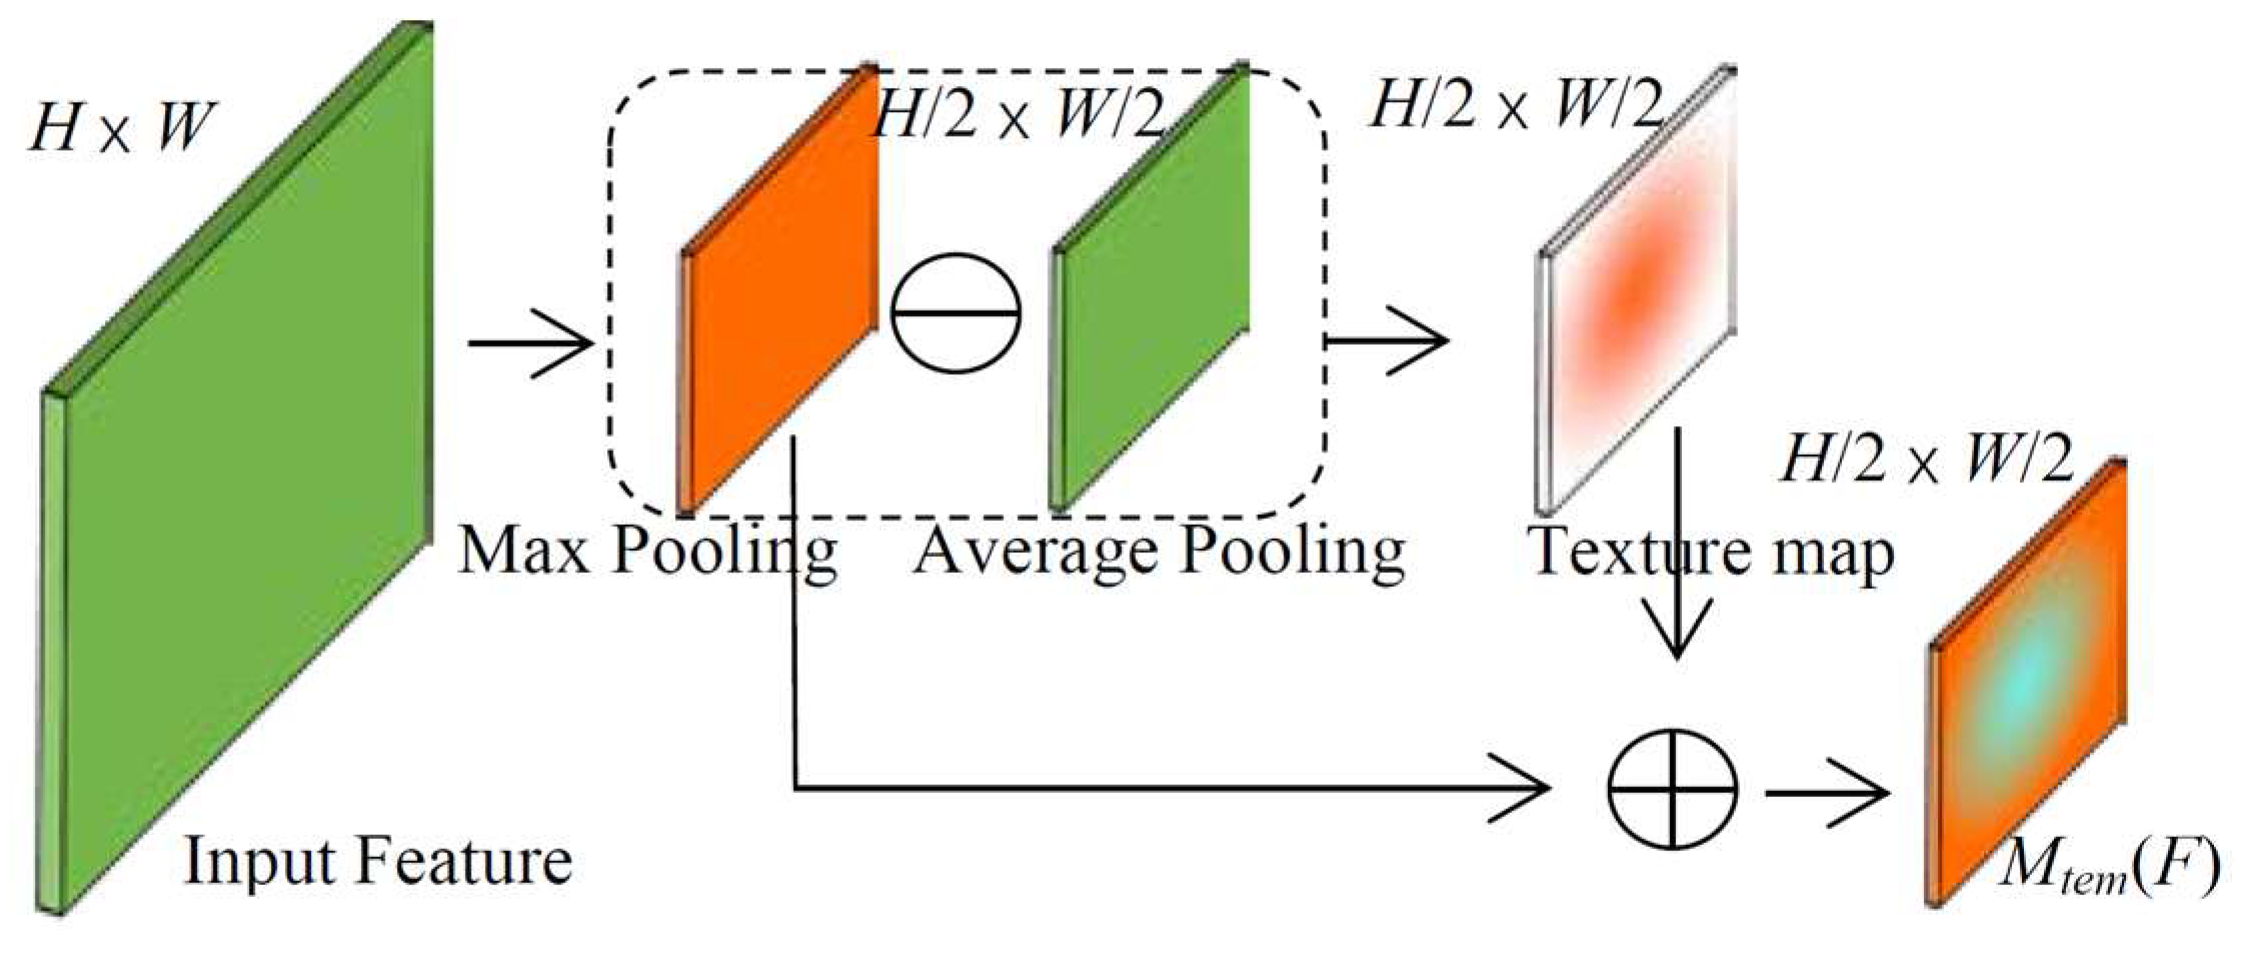
2.2.2. The Texture Extraction Mechanism Based on Pooling Operation

The pixel brightness intensity of texture regions in digital images varies largely, so the grayscale gradient between neighbors is used to describe the spatial location and intensity of the texture [41]. Thus, we designed a texture feature extraction mechanism by pooling operations in convolutional neural networks.
For a pooling filter of size m  ×  n, the max pooling and average pooling operations are defined as follows:
M a x P o o l f i l t e r = max ( x ( i , j ) ) A v e P o o l f i l t e r = ( i = 1 m j = 1 n x ( i , j ) ) / m n ,
where x(i, j) is the gray value of any pixel in the pooling filter, MaxPoolfilter and AvePoolfilter denote the max pooling and average pooling results, respectively, of the filter. The difference of the max pooling minus the average pooling is defined as Equation (7).
Δ P o o l f i l t e r = M a x P o o l f i l t e r A v e P o o l f i l t e r ,
As the grayscale of the pixels in the filters changes, the value of Δ P o o l f i l t e r is as follows:
Δ P o o l f i l t e r = 0 ,   for   x = y   in   the   filter Δ P o o l f i l t e r > 0 ,   if x y   in   the   filter ,
where x and y are the grayscale values of any two pixels in the filter. Equation (8) shows that when there is no variation in the grayscale values of the pixels within the filter, the value of Δ P o o l f i l t e r is 0. Otherwise, it indicates there is variation in the grayscale values within the filter. Thus, the Δ P o o l f i l t e r of 0 represents that there is no texture inside the filter. Yet, when its value is greater than 0, texture information exists within the filter. With increasing values of Δ P o o l f i l t e r , the texture features become more obvious. For a given image F, the spatial distribution and strength of the texture can be described by a series of ordered Δ P o o l f i l t e r . Based on the above theory, the texture map of any image can be defined as follows:
M t m ( F ) = M a x P o o l ( F ) A v e P o o l ( F ) ,
where the Mtm(F) is the texture map of F; the MaxPool(F) and AvePool(F) are the max pooling layer and the average pooling layer in the convolutional network, respectively. Figure 6 shows the calculation process and visual results of the peanut texture map based on Equations (6)–(9). Since there is no obvious texture in the background, the difference between the 2 kinds of pooling operations tends to 0. The gray scale of regions, such as peanut kernel boundaries and defects, varies greatly; the texture features are effectively extracted after the above operation. In summary, the texture extraction mechanism based on the pooling operation can effectively extract the texture features of the image. Therefore, the mechanism is considered as a basic block and used for the design of the attention module and feature enhancement module.

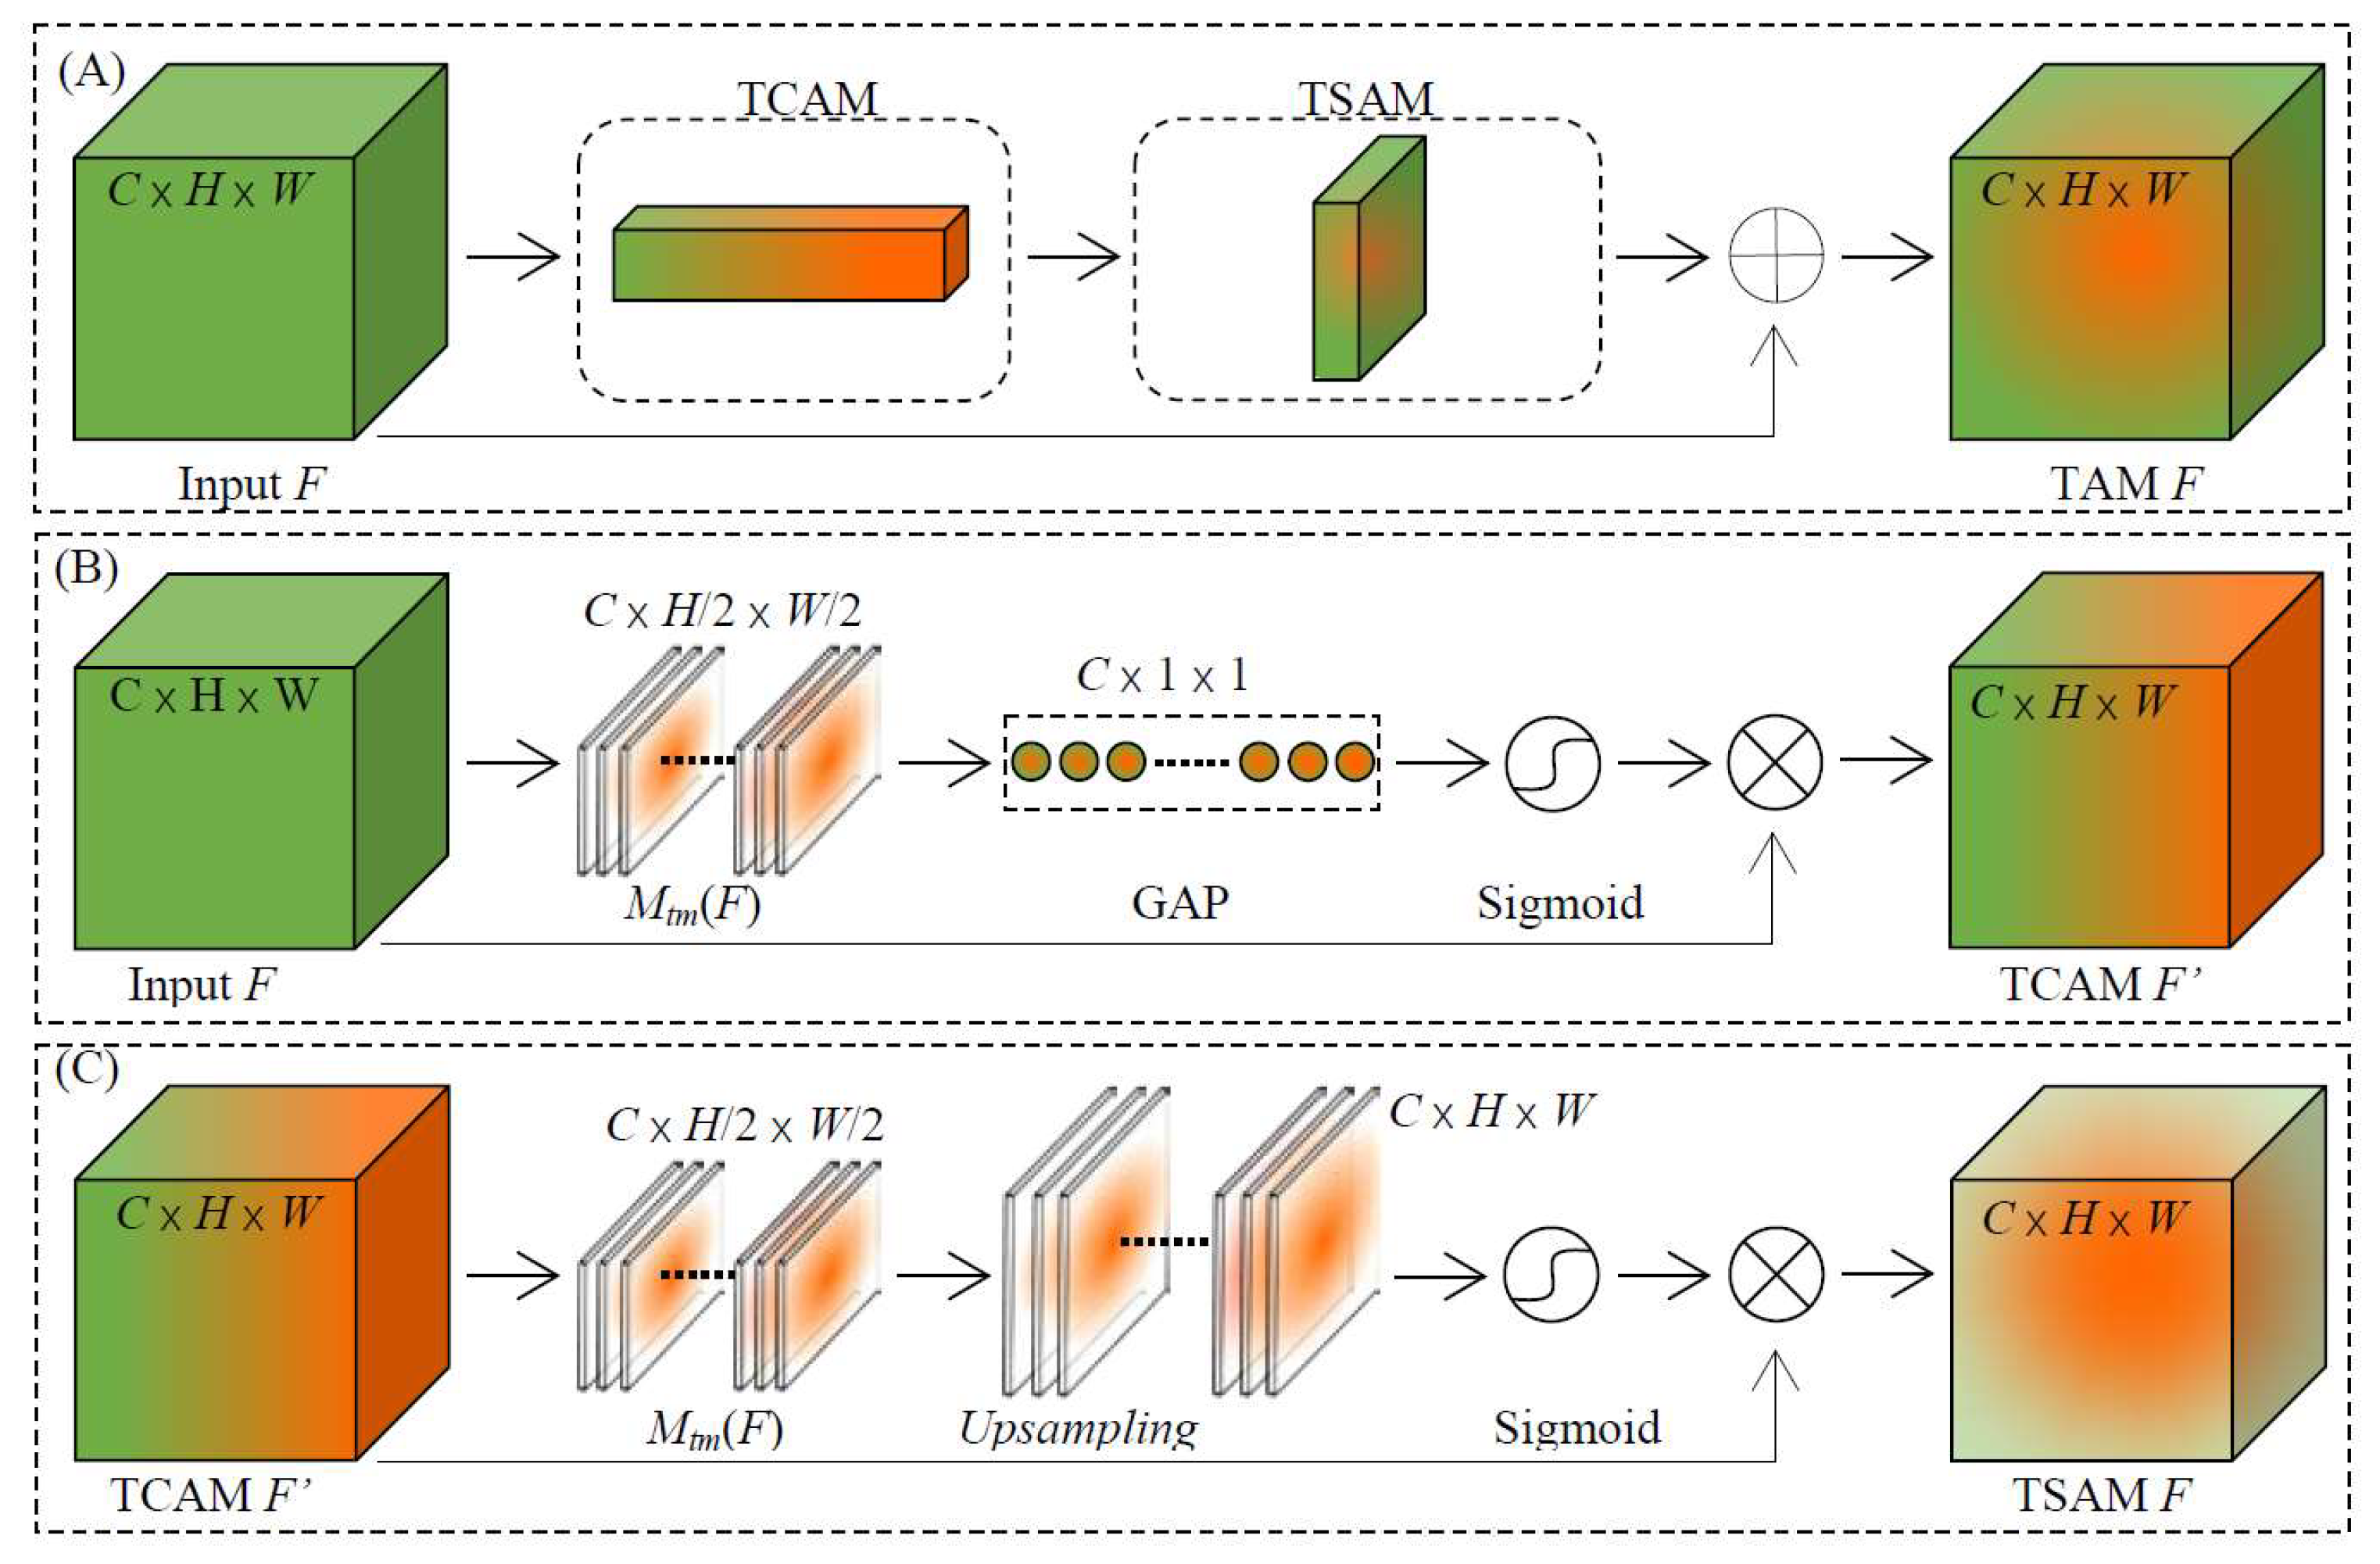
2.2.3. Texture Attention Module

Based on the texture extraction mechanism described in Section 2.2.2, we designed a texture attention module, as shown in Figure 7.
Referring to the architecture of the convolutional block attention mechanism [42], the TAM is composed of a texture-based channel attention module (TCAM) in series with a spatial attention module (TSAM). The overall process can be summarized as Equation (10).
M t a m ( F ) = F [ M t s a m ( M t c a m ( F ) ) ] ,
where the F R C × H × W is the input feature map; the M t a m ( F ) R C × H × W is the feature map of TAM; the Mtcam(F), Mtsam(F) are the feature maps of TCAM and TSAM.
In the attention transformation process, TCAM is used to extract the texture intensity information in F and enable the weights of the texture-rich channels to be adjusted. Then, TSAM is used to extract the texture coordinate information in Mtcam(F). Thus, the weights of the spatial regions where texture exists are increased. Thus, TAM achieves the enhancement of network attention in the channel and space based on texture intensity and coordinate information, respectively. In addition, the input and output of TAM always keep the same size, so it can be nested between any two convolutional layers.
  • Texture-based channel attention module
The structure of TCAM is shown in Figure 7B, and the channel attention is computed as Equation (11).
M t c a m ( F ) = F σ [ G A P ( M t m ( F ) ) ] ,
where F R C × H × W is the input feature map; M t c a m ( F ) R C × H × W is the feature map of TCAM; The σ is the activation function; and GAP is the global average pooling layer. In the channel attention enhancement process, the texture extraction mechanism based on Equation (9) is used to compute the texture map of F channel-by-channel, thus the M t m ( F ) R C × H / 2 × W / 2 . In addition, the global average pooling layer is used to vectorize the 3D feature map Mtm(F) into a 1D vector with a dimension of R C × 1 × 1 . For each channel, the value of this vector reflects the average intensity of the textures inside the channel. Channels with rich texture are more likely to carry more feature information. Therefore, the texture intensity feature values can be used to adjust the channel weights of the feature maps to enhance the network’s attention to channels with rich textures.
  • Spatial attention module based on texture
The structure of the TCAM is shown in Figure 7C, and the channel attention is computed as Equation (12).
M t s a m ( F ) = F σ [ U p ( M t m ( F ) ) ] ,
where F = M t c a m ( F ) is the feature map output from TCAM; M t s a m ( F ) R C × H × W is the feature map of TSAM, Up is the upsampling layer, and σ is the activation function.
For spatial attention, the texture extraction mechanism is first used to extract the texture map of the feature map of TCAM (where the M t m ( F ) = R C × H / 2 × W / 2 ). After that, the texture map is upsampled to restore the size of the input (where the M t m ( F ) = R C × H × W ). For each channel, according to Equation (8), the pixels of the non-textured regions on the feature map are suppressed to 0, while the spatial regions rich in texture have higher grayscale values. It results in a mask of the texture regions corresponding to the feature map, as in Figure 6. Thus, the spatial weight of the feature map can be adjusted by the coordinate information of the texture to enhance the network’s attention to texture-rich spatial regions.

2.2.4. Texture Enhancement Module

In addition to the attention module designed for the convolutional layer, the mechanism shown in Equation (9) is also applied to the downsampling layer for feature enhancement. The structure of the TEM is shown in Figure 8, which contains a max pooling layer, an average pooling layer, and a TEM layer. The process of texture enhancement is defined as Equation (13).
M t e m ( F ) = M a x P o o l ( F ) + M t m ( F ) ,
where F is the input feature map and Mtem(F) is the feature map of TEM. Firstly, the texture extraction mechanism is used to obtain the texture map. Secondly, the texture map is summed with the max pooling layer. Generally, max pooling or average pooling is used for data downsampling in convolutional neural networks to obtain a larger receptive field.
The proposed TEM is embedded in the downsampling process and the texture information is superimposed on the pooling result, which makes the texture features in the feature map more prominent.

2.2.5. Model Evaluation

We use intersection of union (IoU), precision (P), recall (R), and average precision (AP) as metrics to evaluate the effectiveness of the model. Among them, the IoU is the average of the intersection and concatenation ratios of the prediction box and GT. The P represents the proportion of area correctly detected in the prediction box. R indicates the proportion of the correctly detected area in the GT. The AP expresses the area of the PR curve used to reflect the accuracy rate under different recall rates. Based on the difference between the prediction box and GT, the prediction results can be classified as true positive (TP), false positive (FP), and false negative (FN). The above metrics are defined as Equations (14)–(17):
I o U = T P / ( T P + F P + F N ) ,
P = T P / ( T P + F P ) ,
R = T P / ( T P + F N ) ,
A P = 0 1 P · d R

3. Results

3.1. Training Platform and Parameter Settings

The experiments were conducted on hardware platforms, such as the Intel(R) Core (TM) i5 CPU and Tesla K40c GPU. The software environment included Python 3.6 and Keras 2.3. The datasets for training, validating, and testing in the experiments contained 728, 312, and 260 MSIs, respectively. In addition, the anchor box scale was set to [64, 128, 256] pixels according to the size of the peanut core in the image. The pixel reduction index of each image channel was set to 64.

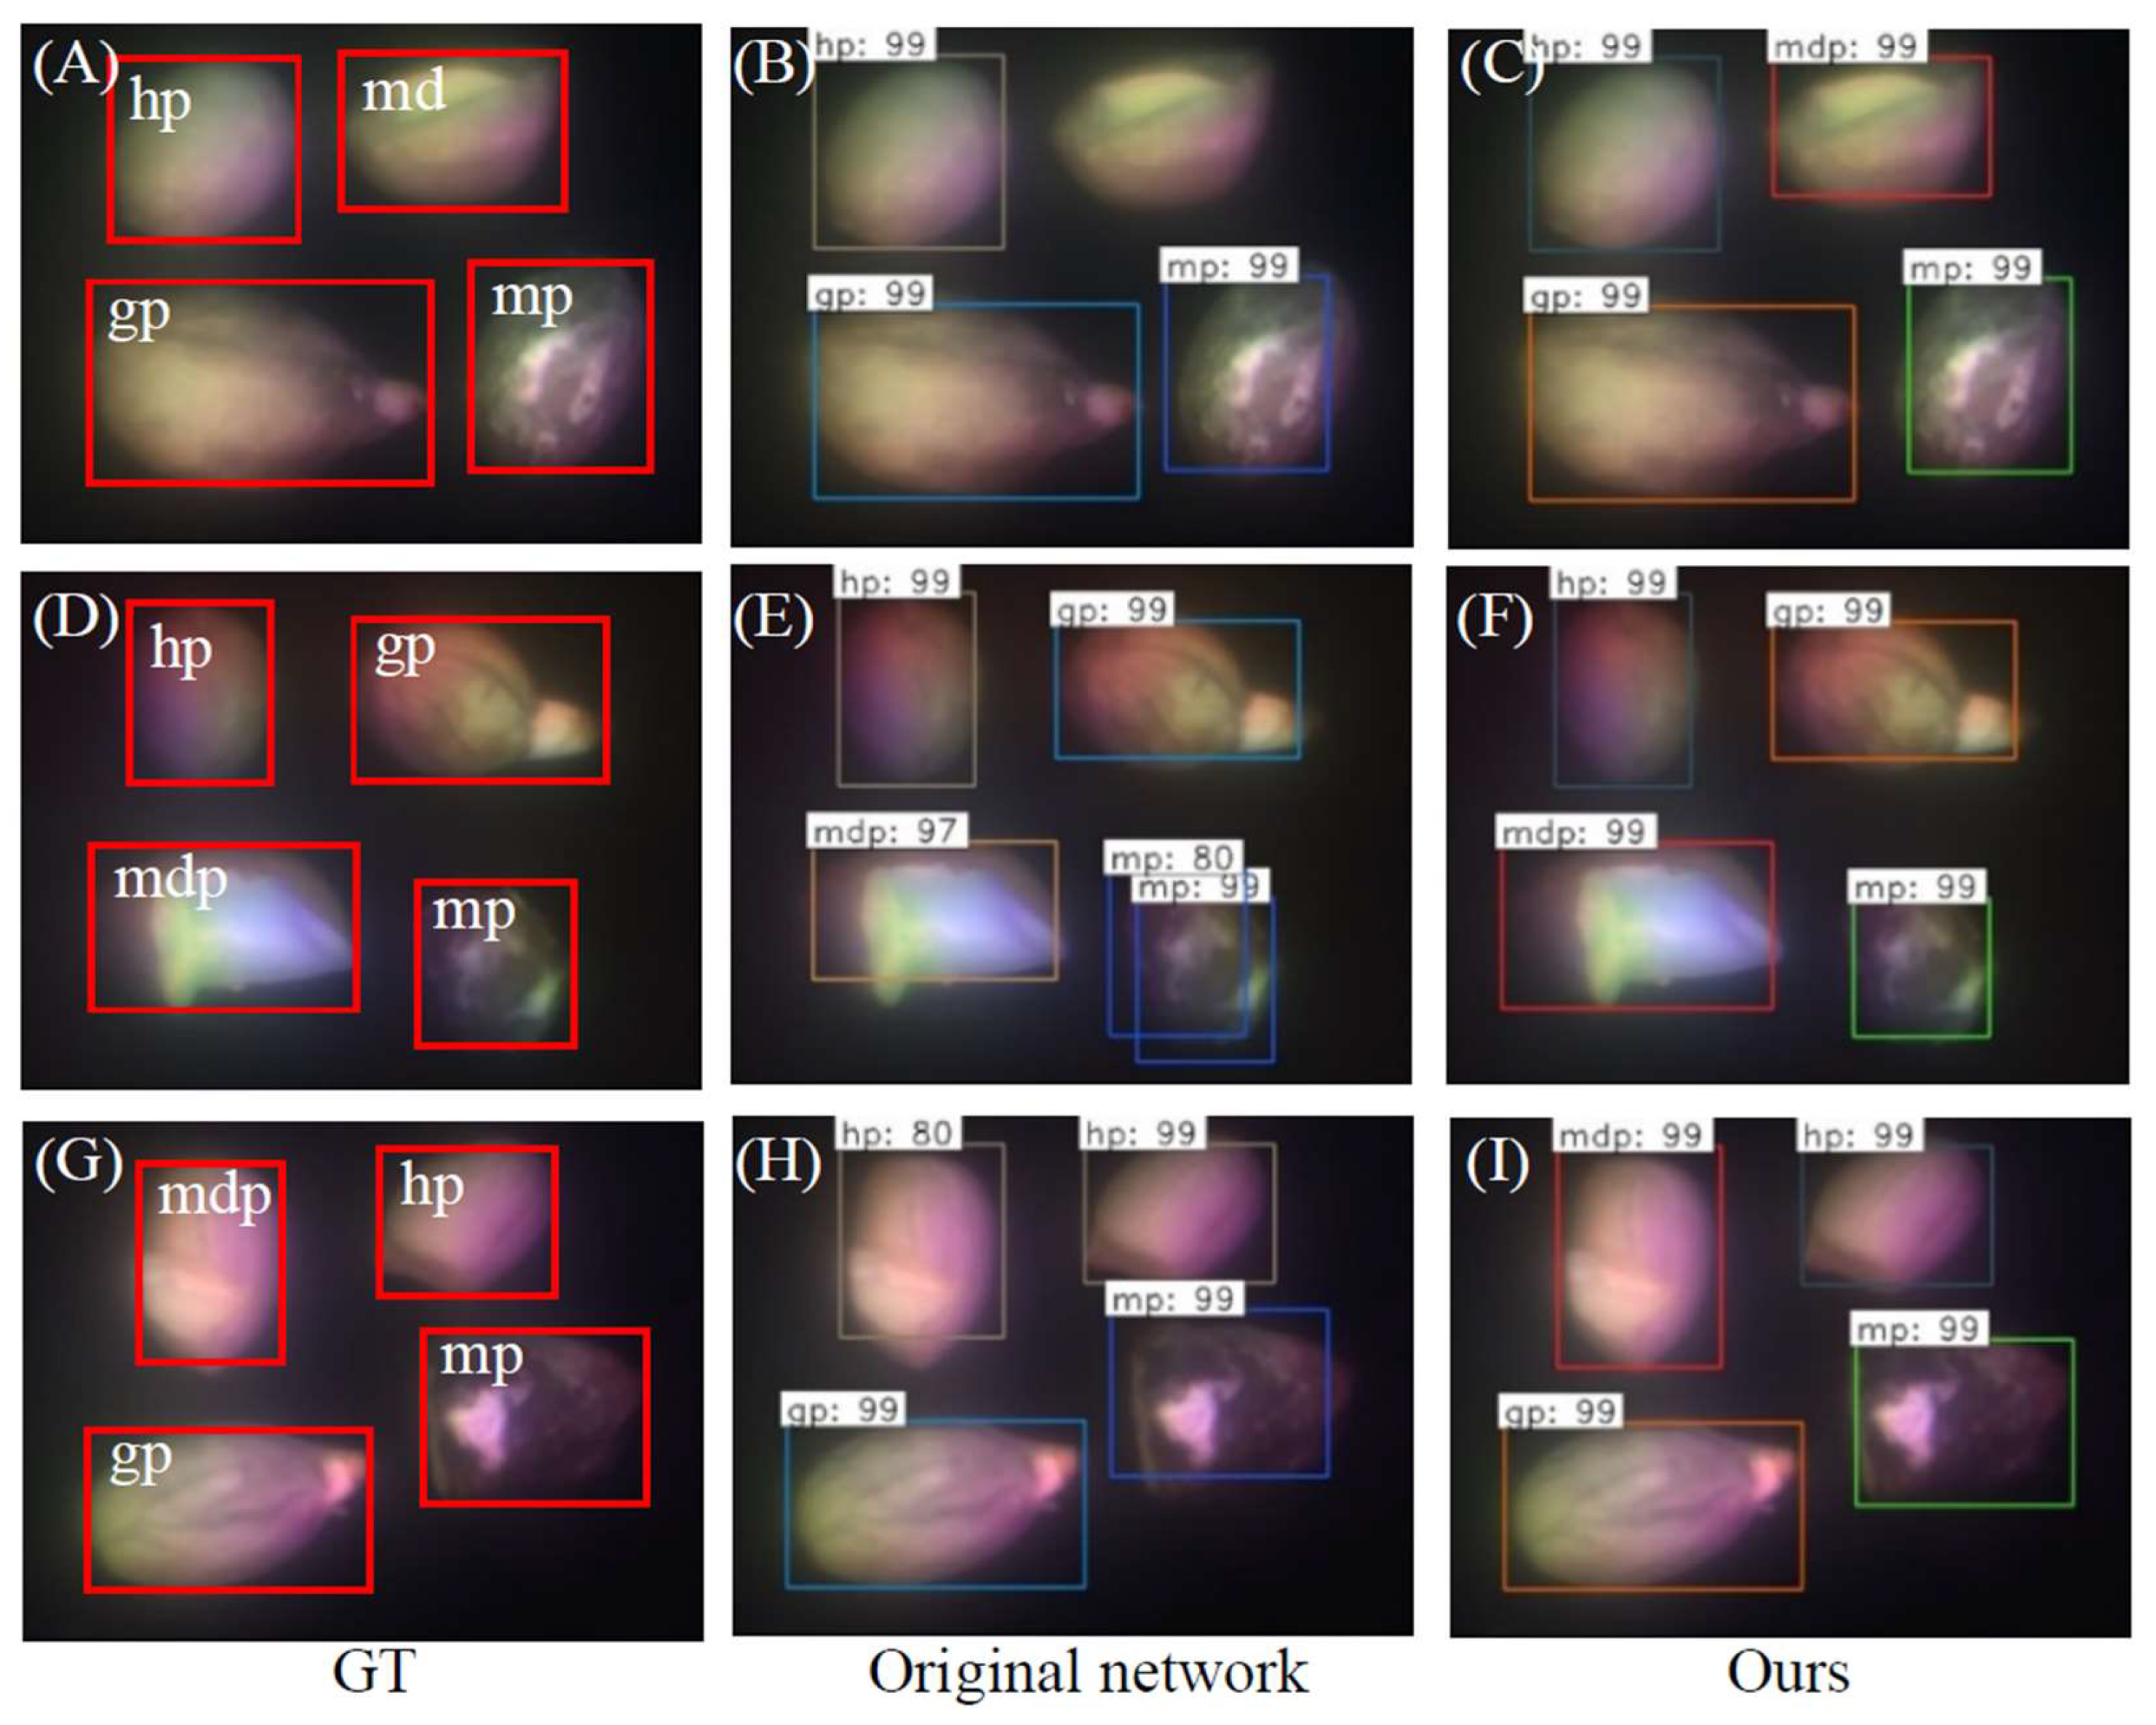
3.2. Model Training and Testing

The Faster RCNN based on VGG16 was trained with the parameters described in Section 3.1, and the training weights were saved with the minimum loss criterion after 25 epochs. The images of the test dataset were predicted by these weights, whose results are visualized in Figure 9. By comparing the GT and prediction results, our method successfully identified the peanut targets in the test images and achieved high localization and classification accuracy. Moreover, comparing the prediction results of the original network, our method obviously improved the accuracy of peanut defects identification. On the one hand, the proposed method did not show any missed or repeated detections in identifying mechanically damaged and moldy samples. On the other hand, our method achieved higher confidence scores, especially in classifying mechanically damaged peanuts, which indicates a bounding box of moldy peanuts closer to the GT.
Equations (14)–(17) were used to evaluate the proposed algorithm, and the results of the fivefold cross-validation are shown in Table 1.
Overall, the proposed classification method achieves improvements of most of the classification metrics, according to Table 1. Specifically, R was obviously improved compared with the classical Faster RCNN, which means that our method could produce true positive bounding boxes that were closer to the GT. In particular, among the two types of defects with distinct contour features, namely, MDP and GP, all indicators were improved, indicating the effectiveness of the proposed TAM and TEM. Especially, the identification accuracy of GP improved the most, with an increase of 5.74%, 5.15%, and 7.45% in terms of IoU, P, and R, respectively. On the other hand, for the detection of HP and MP, the introduction of the texture attention mechanism and texture enhancement mechanism showed competitive results or a slight improvement, which may be due to the similarity of the contour features of the two types of peanuts. Overall, our method has achieved higher average scores in detecting all types of peanuts, with a mAP of 99.97%. This indicates that our method is comprehensively more reliable for peanut defect detection tasks, which will be more beneficial in guiding sorting equipment to locate defective peanuts.

3.3. Ablation Experiments

To analyze the effectiveness of TAM and TEM, ablation experiments were performed based on Faster RCNN with different backbone networks, and the results of the fivefold cross-validation are shown in Table 2. Firstly, it can be seen from Table 2 that the mean IoU (mIoU) and mAP scores of all three networks improved significantly under TAM. In addition, the mean P (mP) and mean R (mR) scores of VGG16 and ResNet101 improved more obviously. This indicates that the module has a significant effect on enhancing the feature extraction ability of the above three backbone networks.
Secondly, the mIoU, R, and mAP scores of the three networks improved more significantly under the effect of TEM, and the most prominent contribution was that of ResNet101, which achieved an R improvement of 8.5%. This demonstrates the significant contribution of TEM in enhancing the network texture features in the above networks.
Thirdly, all the scores of the three networks increased to different degrees with the combined contribution of TAM and TEM. The best score is for VGG16, which achieved 82.34%, 89.67%, and 99.97% for mIoU, R, and mAP, respectively. This indicates the effectiveness of the two modules in improving the performance of the Faster RCNN backbone network. In addition, there was no effect of improvement in the P score when the two modules worked independently on ResNet50. However, when the modules worked together, the P score of ResNet50 improved effectively. This implies that the two modules can only achieve the best results on some networks when used in combination.
In summary, the designed texture-based attention module and feature enhancement module are not only useful for improving the Faster RCNN backbone network under independent working conditions, but they also achieve excellent results when working in collaboration. Therefore, they contribute significantly to the improvement of the target recognition accuracy for peanut defects.

4. Conclusions

Automated detection of peanut defects is of great importance for ensuring product quality. To achieve defect classification and localization, this paper proposes a multi-object recognition scheme for peanut defects based on multispectral imaging and an improved Faster RCNN algorithm. The main conclusions of this paper are as follows:
(1)
To improve the identification of peanut defects in images, we determined the spectral features of various peanut defects, such as mold, mechanical damage, and embryo, using experimental methods. We used these spectral features as the light source to enhance the identification of peanut defects in images. Furthermore, we designed a uniform light source system based on a symmetrical integral sphere structure to reduce the impact of light source pollution, such as light spots and shadows.
(2)
At the algorithm level, we introduced object recognition algorithms to automate the classification and localization of peanut defects, providing necessary guidance information for subsequent sorting equipment. As traditional convolutional networks have weak feature recognition abilities for distinguishing healthy peanuts from those with mold and mechanical damage, we specifically designed a texture attention mechanism and a texture enhancement module. The experimental results show that the proposed scheme achieves a maximum mAP of 99.97% (the code and dataset are available at https://github.com/HyperSystemAndImageProc/Multi-target-Identification-of-Peanut-Defects. Accessed on 29 July 2022).
In summary, we explored reliable methods to improve the identification accuracy of peanut defects through texture enhancement at both the hardware and software levels, providing reliable classification and localization information for mechanical equipment, such as peanut sorters. This indicates that our method has higher reliability for peanut defect detection tasks, which will be more beneficial for guiding sorting devices in locating peanuts. Therefore, we believe that the above defect detection scheme based on hardware and software cooperation can be extended to other agricultural target recognition fields. However, there are still several limitations to this study, for example, the research is represented by three types of peanuts detects to demonstrate it classification capability. To distinguish multiple defects of more agricultural products would be more adoptable in practical applications, which requires extending our system in terms of channel numbers and characteristic wavelengths. Additionally, the field of view of the proposed work is 2D, which may cause blind spots for defect detection. In future work, the design and introduction of a collaborative rotating sample stage can potentially assist the proposed method to observe defects in 3D space.

Author Contributions

Conceptualization, Z.D. (Zhao Ding) and C.Y.; methodology, Y.W.; investigation, J.S., Z.G., Z.D. (Ziqing Deng), Z.L. and J.W.; resources, L.B. All authors have read and agreed to the published version of the manuscript.

Funding

The work was supported in part by the National Natural Science Foundation of China with Grant 62065003; in part by Guizhou Provincial Science and Technology Projects with Grants ZK [2022] Key-020 and General-105; in part by Renjihe of Guizhou University(2012). The authors give thanks for the computing support of the State Key Laboratory of Public Big Data, Guizhou University.

Data Availability Statement

The accompanying dataset and the code can be downloaded from: https://github.com/HyperSystemAndImageProc/Multi-target-Identification-of-Peanut-Defects. Accessed on 29 July 2022.

Conflicts of Interest

The authors declare that they have no known competing financial interest or personal relationships that could have appeared to influence the work reported in this paper.

References

  1. Balasubramanian, P.; Mariappan, V.; Lourdusamy, D.K.; Chinnamuthu, C.; Swetha, S. Peanut as a smart food and their nutrients aspects in planet: A review. Agric. Rev. 2020, 41, 403–407. [Google Scholar] [CrossRef]
  2. Syed, F.; Arif, S.; Ahmed, I.; Khalid, N. Groundnut (peanut) (Arachis hypogaea). In Oilseeds: Health Attributes and Food Applications; Springer: Singapore, 2021; pp. 93–122. [Google Scholar] [CrossRef]
  3. Zhao, X.; Chen, J.; Du, F. Potential use of peanut by-products in food processing: A review. J. Food Sci. Technol. 2012, 49, 521–529. [Google Scholar] [CrossRef]
  4. Diao, E.; Dong, H.; Hou, H.; Zhang, Z.; Ji, N.; Ma, W. Factors influencing aflatoxin contamination in before and after harvest peanuts: A review. J. Food Res. 2015, 4, 148. [Google Scholar] [CrossRef]
  5. Darko, C.; Kumar Mallikarjunan, P.; Kaya-Celiker, H.; Frimpong, E.A.; Dizisi, K. Effects of packaging and pre-storage treatments on aflatoxin production in peanut storage under controlled conditions. J. Food Sci. Technol. 2018, 55, 1366–1375. [Google Scholar] [CrossRef]
  6. Sun, K.; Zhang, Y.J.; Tong, S.Y.; Wang, C.B. Study on rice grain mildewed region recognition based on microscopic computer vision and YOLO-v5 model. Res. Sq. 2022, 11, 4031. [Google Scholar] [CrossRef] [PubMed]
  7. Osipov, A.; Shumaev, V.; Ekielski, A.; Gataullin, T.; Suvorov, S.; Mishurov, S.; Gataullin, S. Identification and classification of mechanical damage during continuous harvesting of root crops using computer vision methods. IEEE Access 2022, 10, 28885–28894. [Google Scholar] [CrossRef]
  8. Wang, C.; Xiao, Z. Potato surface defect detection based on deep transfer learning. Agriculture 2021, 11, 863. [Google Scholar] [CrossRef]
  9. ElMasry, G.; Mandour, N.; Al-Rejaie, S.; Belin, E.; Rousseau, D. Recent applications of multispectral imaging in seed phenotyping and quality monitoring: An overview. Sensors 2019, 19, 1090. [Google Scholar] [CrossRef] [PubMed]
  10. Tian, H.; Wang, T.; Liu, Y.; Qiao, X.; Li, Y. Computer vision technology in agricultural automation: A review. Inf. Process. Agric. 2020, 7, 1–19. [Google Scholar] [CrossRef]
  11. Wu, Q.; Xie, L.; Xu, H. Determination of toxigenic fungi and aflatoxins in nuts and dried fruits using imaging and spectroscopic techniques. Food Chem. 2018, 252, 228–242. [Google Scholar] [CrossRef]
  12. Wu, Q.; Xu, H. Design and development of an on-line fluorescence spectroscopy system for detection of aflatoxin in pistachio nuts. Postharvest Biol. Technol. 2020, 159, 111016. [Google Scholar] [CrossRef]
  13. Noguera, M.; Millan, B.; Aquino, A.; Andújar, J.M. Methodology for Olive Fruit Quality Assessment by Means of a Low-Cost Multispectral Device. Agronomy 2022, 12, 979. [Google Scholar] [CrossRef]
  14. Huang, W.; Li, J.; Wang, Q.; Chen, L. Development of a multispectral imaging system for online detection of bruises on apples. J. Food Eng. 2015, 146, 62–71. [Google Scholar] [CrossRef]
  15. Yang, Y.; Zhao, X.; Huang, M.; Wang, X.; Zhu, Q. Multispectral image based germination detection of potato by using supervised multiple threshold segmentation model and canny edge detector. Comput. Electron. Agric. 2021, 182, 106041. [Google Scholar] [CrossRef]
  16. Bartolić, D.; Mutavdžić, D.; Carstensen, J.M.; Stanković, S.; Nikolić, M.; Krstović, S.; Radotić, K. Fluorescence spectroscopy and multispectral imaging for fingerprinting of aflatoxin-B1 contaminated (Zea mays L.) seeds: A preliminary study. Sci. Rep. 2022, 12, 4849. [Google Scholar] [CrossRef]
  17. Bandara, W.G.C.; Prabhath, G.W.K.; Dissanayake, D.W.S.C.B.; Herath, V.R.; Godaliyadda, G.M.R.I.; Ekanayake, M.P.B.; Demini, D.; Madhujith, T. Validation of multispectral imaging for the detection of selected adulterants in turmeric samples. J. Food Eng. 2020, 266, 109700. [Google Scholar] [CrossRef]
  18. Stuart, M.B.; Stanger, L.R.; Hobbs, M.J.; Pering, T.D.; Thio, D.; McGonigle, A.J.; Willmott, J.R. Low-cost hyperspectral imaging system: Design and testing for laboratory-based environmental applications. Sensors 2020, 20, 3293. [Google Scholar] [CrossRef]
  19. Yu, P.; Huang, M.; Zhang, M.; Zhu, Q.; Qin, J. Rapid detection of moisture content and shrinkage ratio of dried carrot slices by using a multispectral imaging system. Infrared Phys. Technol. 2020, 108, 103361. [Google Scholar] [CrossRef]
  20. Zhong-zhi, H.; Yan-zhao, L.; Jing, L.; You-gang, Z. Quality grade-testing of peanut based on image processing. In Proceedings of the 2010 Third International Conference on Information and Computing 2020, Wuxi, China, 4–6 June 2010. [Google Scholar] [CrossRef]
  21. Li, Z.; Niu, B.; Peng, F.; Li, G.; Yang, Z.; Wu, J. Classification of peanut images based on multi-features and SVM. IFAC-PapersOnLine 2018, 51, 726–731. [Google Scholar] [CrossRef]
  22. Yang, H.; Ni, J.; Gao, J.; Han, Z.; Luan, T. A novel method for peanut variety identification and classification by improved VGG16. Sci. Rep. 2021, 11, 1–17. [Google Scholar] [CrossRef]
  23. Jiang, J.; Qiao, X.; He, R. Use of Near-Infrared hyperspectral images to identify moldy peanuts. J. Food Eng. 2016, 169, 284–290. [Google Scholar] [CrossRef]
  24. Liu, Z.; Jiang, J.; Qiao, X.; Qi, X.; Pan, Y.; Pan, X. Using convolution neural network and hyperspectral image to identify moldy peanut kernels. LWT 2020, 132, 109815. [Google Scholar] [CrossRef]
  25. Ren, S.; He, K.; Girshick, R.; Sun, J. Faster r-cnn: Towards real-time object detection with region proposal networks. In Proceedings of the Advances in Neural Information Processing Systems 28: Annual Conference on Neural Information Processing Systems 2015, Montreal, QC, Canada, 7–12 December 2015; Volume 28. [Google Scholar] [CrossRef]
  26. Basri, H.; Syarif, I.; Sukaridhoto, S.; Falah, M.F. Intelligent system for automatic classification of fruit defect using faster region-based convolutional neural network (Faster RCNN). Jurnal Ilmiah Kursor 2019, 10, 1–12. [Google Scholar] [CrossRef]
  27. Xi, R.; Hou, J.; Lou, W. Potato bud detection with improved Faster RCNN. Trans. ASABE 2020, 63, 557–569. [Google Scholar] [CrossRef]
  28. Bari, B.S.; Islam, M.N.; Rashid, M.; Hasan, M.J.; Razman, M.A.M.; Musa, R.M.; Nasir, A.F.A.; Majeed, A.P.A. A real-time approach of diagnosing rice leaf disease using deep learning-based Faster RCNN framework. PeerJ Comput. Sci. 2021, 7, e432. [Google Scholar] [CrossRef] [PubMed]
  29. Wang, P.; Niu, T.; He, D. Tomato young fruits detection method under near color background based on improved Faster RCNN with attention mechanism. Agriculture 2021, 11, 1059. [Google Scholar] [CrossRef]
  30. Dwivedi, R.; Dey, S.; Chakraborty, C.; Tiwari, S. Grape disease detection network based on multi-task learning and attention features. IEEE Sens. J. 2021, 21, 17573–17580. [Google Scholar] [CrossRef]
  31. Du, L.; Sun, Y.; Chen, S.; Feng, J.; Zhao, Y.; Yan, Z.; Zhang, X.; Bian, Y. A novel object detection model based on Faster R-CNN for spodoptera frugiperda according to feeding trace of Corn leaves. Agriculture 2022, 12, 248. [Google Scholar] [CrossRef]
  32. Qu, H.; Wang, M.; Zhang, C.; Wei, Y. A study on Faster RCNN-based subway pedestrian detection with ACE enhancement. Algorithms 2018, 11, 192. [Google Scholar] [CrossRef]
  33. Zheng, H.; Chen, J.; Chen, L.; Li, Y.; Yan, Z. Feature enhancement for multi-scale object detection. Neural Process. Lett. 2020, 51, 1907–1919. [Google Scholar] [CrossRef]
  34. Zheng, Q.; Wang, L.; Wang, F. Object detection algorithm based on feature enhancement. Meas. Sci. Technol. 2021, 32, 085401. [Google Scholar] [CrossRef]
  35. Su, W.H.; Sun, D.W. Multispectral imaging for plant food quality analysis and visualization. Compr. Rev. Food Sci. Food Saf. 2018, 17, 220–239. [Google Scholar] [CrossRef]
  36. Peli, E. Contrast in complex images. JOSA A 1990, 7, 2032–2040. [Google Scholar] [CrossRef] [PubMed]
  37. Sawyer, T.W.; Luthman, A.S.; Bohndiek, S.E. Evaluation of illumination system uniformity for wide-field biomedical hyperspectral imaging. J. Opt. 2017, 19, 045301. [Google Scholar] [CrossRef]
  38. Simonyan, K.; Zisserman, A. Very deep convolutional networks for large-scale image recognition. arXiv 2014, arXiv:1409.1556. [Google Scholar]
  39. He, K.; Zhang, X.; Ren, S.; Sun, J. Deep residual learning for image recognition. In Proceedings of the IEEE Conference on Computer Vision and Pattern Recognition 2016, Las Vegas, NV, USA, 26 June–1 July 2016. [Google Scholar] [CrossRef]
  40. Li, Z.; Li, Y.; Yang, Y.; Guo, R.; Yang, J.; Yue, J.; Wang, Y. A high-precision detection method of hydroponic lettuce seedlings status based on improved Faster RCNN. Comput. Electron. Agric. 2021, 182, 106054. [Google Scholar] [CrossRef]
  41. Armi, L.; Fekri-Ershad, S. Texture image analysis and texture classification methods: A review. arXiv 2019, arXiv:1904.06554. [Google Scholar]
  42. Woo, S.; Park, J.; Lee, J.-Y.; Kweon, I.S. Cbam: Convolutional block attention module. In Proceedings of the European Conference on Computer Vision (ECCV), Munich, Germany, 8–14 September 2018. [Google Scholar] [CrossRef]
Figure 1. Grayscale images of peanuts under illumination of different wavelengths: (A) 365 nm, (B) 377 nm, (C) 440 nm, (D) 470 nm, (E) 520 nm, (F) 594 nm, (G) 652 nm, (H) 698 nm, (I) 766 nm, (J) 801 nm, (K) 901 nm, (L) 975 nm.
Agronomy 13 01158 g001
Figure 2. Calculation procedure and results of RMSC: (A) schematic diagram of peanut defects segmentation and their neighborhoods (The area indicated by the yellow dashed line is adjacent region, and the area indicated by the blue solid line is defect region); (BD) calculated results of root-mean-square contrast at defect wavelengths.
Agronomy 13 01158 g002
Figure 3. Structure of multispectral image acquisition system.
Agronomy 13 01158 g003
Figure 4. Light uniformity analysis results of the test area: (A) normalized light source irradiance distribution; (B) contour distribution of light source irradiance.
Agronomy 13 01158 g004
Figure 5. Structure of improved Faster R-CNN.
Agronomy 13 01158 g005
Figure 6. Example of image texture feature extraction based on pooling operation: (A) Peanut gray-scale image; (B) Texture map; (C) Peanut contour area grayscale matrix; (D) Background grayscale matrix; (E) Result of MaxPool; (F) Result of AvePool; (G) Result of MaxPool minus AvePool; The arrows in the figure indicate the direction of data flow.
Agronomy 13 01158 g006
Figure 7. Structure of texture attention module: (A) TAM; (B) TCAM; (C) TSAM.
Agronomy 13 01158 g007
Figure 8. Structure of texture feature enhancement module.
Agronomy 13 01158 g008
Figure 9. Peanut defect detection results (pictures are pseudo-color image based on CWs: 440 nm, 470 nm, 520 nm; numbers in the prediction box are confidence scores): (A,D,G) are the labels of manual classification and localization; (B,E,H) are the results of Faster RCNN based on the VGG16 backbone network; (C,F,I) are the results of Faster RCNN improved with TAM and TEM (the rectangular boxes represent the localization information. The text above the boxes indicate the predicted defect types and its confidence level of the algorithm).
Agronomy 13 01158 g009
Table 1. Peanut defect identification results based on VGG16 and improved algorithm.
NetworkClassIoU (%)P (%)R (%)AP (%)
OriginalHP84.03 ± 0.0592.25 ± 0.2090.20 ± 0.3299.73 ± 0.11
MP84.06 ± 0.0792.25 ± 0.1090.23 ± 0.2499.84 ± 0.16
MDP82.05 ± 0.1490.06 ± 0.4089.05 ± 0.1499.78 ± 0.09
GP74.49 ± 0.2182.58 ± 0.1680.58 ± 0.1799.80 ± 0.12
OursHP84.82 ± 0.4191.06 ± 0.3592.27 ± 0.1599.95 ± 0.14
MP83.49 ± 0.1190.75 ± 0.1991.05 ± 0.1899.95 ± 0.04
MDP83.60 ± 0.0991.40 ± 0.0490.52 ± 0.0899.97 ± 0.07
GP80.23 ± 0.1387.73 ± 0.0988.03 ± 0.0899.99 ± 0.09
Table 2. Results of texture attention module and texture enhancement module ablation experiments.
Backbone NetworkmIoU (%)mP (%)mR (%)mAP (%)
VGG1678.88 ± 0.1486.82 ± 0.3585.03 ± 0.1799.50 ± 0.14
ResNet5080.23 ± 0.5189.56 ± 0.7185.56 ± 0.2199.81 ± 0.20
ResNet10173.61 ± 0.2881.81 ± 0.2479.54 ± 0.1499.44 ± 0.09
VGG16 + TAM80.31 ± 0.6788.64 ± 0.3786.47 ± 0.8299.84 ± 0.17
ResNet50 + TAM80.89 ± 0.3189.15 ± 0.3586.97 ± 0.1999.93 ± 0.15
ResNet101 + TAM76.84 ± 0.1886.81 ± 0.1781.95 ± 0.2399.53 ± 0.11
VGG16 + TEM81.89 ± 0.3489.35 ± 0.1588.77 ± 0.2799.96 ± 0.09
ResNet50 + TEM80.07 ± 0.4188.08 ± 0.2986.37 ± 0.2999.85 ± 0.12
ResNet101 + TEM81.39 ± 0.3788.89 ± 0.2688.01 ± 0.4199.89 ± 0.23
VGG16 + TAM + TEM82.34 ± 0.4989.45 ± 0.2089.67 ± 0.5399.97 ± 0.12
ResNet50 + TAM + TEM82.10 ± 0.2889.79 ± 0.4388.56 ± 0.4799.95 ± 0.23
ResNet101+ TAM + TEM80.66 ± 0.2790.00 ± 0.4786.11 ± 0.4199.67 ± 0.16
Disclaimer/Publisher’s Note: The statements, opinions and data contained in all publications are solely those of the individual author(s) and contributor(s) and not of MDPI and/or the editor(s). MDPI and/or the editor(s) disclaim responsibility for any injury to people or property resulting from any ideas, methods, instructions or products referred to in the content.

