Article

Quantitative Analysis of Source-Sink Relationships in Two Potato Varieties under Different Nitrogen Application Rates

1
Department of Agriculture, Inner Mongolia Agricultural University, Hohhot 010018, China
2
Maize Research Institute, Inner Mongolia Academy of Agriculture and Animal Husbandry Sciences, Hohhot 010031, China
3
Institute of Resources, Environment and Sustainable Development, Inner Mongolia Academy of Agriculture and Animal Husbandry Sciences, Hohhot 010031, China
4
Department of Bioscience, Inner Mongolia Agricultural University, Hohhot 010018, China
*
Author to whom correspondence should be addressed.
Agronomy 2023, 13(4), 1083; https://doi.org/10.3390/agronomy13041083
Submission received: 13 March 2023 / Revised: 4 April 2023 / Accepted: 7 April 2023 / Published: 9 April 2023
(This article belongs to the Topic Plants Nutrients)

Abstract

:
Nitrogen is an essential nutrient for plant growth. However, the excessive use of nitrogen fertilizers not only increases production cost, but also has negative a impact on the environment. The purpose of this study was to quantify the source-sink characteristics and length of each growth stage in two potato varieties under different nitrogen application rates. This clarifies the source-sink coordination characteristics of the nitrogen-efficient variety and the source-sink coordination mechanisms of high nitrogen use efficiency (NUE). Field experiments were conducted in 2019, 2020, and 2021 using a split-plot design, with a nitrogen application rate of (0; 150 kg·ha−1; 300 kg·ha−1) as the main plot and variety (J, nitrogen-efficient variety Jizhang 12; Y, nitrogen-inefficient variety Youjia 70) as the subplot. The results showed that the yield and NUE of Jizhang 12 at 300 kg·ha−1 were, on average, 90.73% and 75.15% higher than those of Youjia 70, respectively. The NUE and nitrogen utilization efficiency of Jizhang 12 increased on average, with decreasing N application at 68.66% and 24.53%, which were higher than those of Youjia 70 at 62.89% and 10.86%. Quantitative analysis of the source and sink showed that the Jizhang 12 had a higher source and sink capacity of 23.45 g and 51.85 g, respectively, and the maximum source and sink activity was on average 0.28 g·plant−1·d−1 and 1.47 g·plant−1·d−1 higher, and the growth period of the source and sink was on average 24 days and 7 days longer, respectively. On the basis of these results, the nitrogen-efficient varieties had a higher yield base and a smaller reduction in NUE with reduced N application. In terms of source-sink growth, N-efficient varieties lasted longer at the seedling and tuber initiation stages, when potatoes grew above ground and source organs grew for longer periods, providing a solid foundation for later sink growth, as evidenced by their higher source-sink activity, capacity, and growth time than N-inefficient varieties.

1. Introduction

Nitrogen (N) is the most essential nutrient element for plants and is one of the major limiting factors for agricultural productivity. For over a century, since the Haber-Bosch process utilized atmospheric nitrogen to produce ammonia, it has paved the way for the large-scale production of nitrogen fertilizers. Supplying crops and planting systems with nitrogen through fertilizers is one of the key measures for producing sufficient food to meet the growing demand of the population [1,2]. Over the past 60 years, with crop yields quadrupling, nitrogen fertilizer application has increased by 10 times [3]. However, the use of nitrogen fertilizers not only consumes a significant amount of energy but also causes severe environmental damage, such as the eutrophication of freshwater and marine ecosystems and the emission of nitrogen oxides and ammonia into the atmosphere, among others [4,5,6]. The relatively high price ratio of food/fertilizer encourages farmers to apply excessive amounts of nitrogen to obtain higher yields and profits, leading to the gradual accumulation of nitrogen in the soil and the risk of nitrogen leaching [7]. However, simply reducing the amount of nitrogen fertilizer applied would cause crops to experience a temporary nitrogen deficiency. Therefore, optimizing cultivation practices and applying nitrogen-efficient varieties have become increasingly important under conditions favorable to excessive fertilization (such as subsidy economies, low fertilizer prices, and high grain prices), long-term nitrogen deficiency or other soil, and climate limitations.
Potatoes (Solanum tuberosum L.) are a dicotyledonous plant belonging to the family Solanaceae. Over the past 60 years (1961–2021), China’s total potato production has increased by six times (from 12.9 million tons in 1961 to 94.36 million tons in 2021), while the planting area has thrice (from 1.3 million hectares in 1961 to 5.78 million hectares in 2021). Both the planting area and production rank first in the world, accounting for about one-fourth of the world’s total [3]. The Inner Mongolia Autonomous Region is one of the main potato-producing regions in China, with a total potato planting area of 277.4 thousand hectares in 2021, accounting for 5.95% of the national potato planting area; the total output accounts for 6.91% of the national potato output, with a yield of only 22.39 tons per hectare [8]. However, the input for potato production is not low. The input for potato production in Inner Mongolia is 14,280 yuan per hectare, with nitrogen fertilizer accounting for 3.0% of the input [9]. The nitrogen fertilizer input cannot be fully utilized, and the nitrogen use efficiency of potatoes has been between 30% and 35% for a long time.I In some areas, the nitrogen use efficiency is as low as approximately 20% [10]. With the increasing demand for potatoes and the continuous increase in potato production, the application of nitrogen fertilizer will gradually increase, while the productivity that can be provided by nitrogen fertilizer is decreasing.
Crop yield, quality, and resource use efficiency are also influenced by crop-source and sink relationships [11]. Many studies have elucidated the theory and technology for achieving high yields by regulating source-sink relationships [12,13,14,15,16,17]. The Sigmoid curve, which is a mathematical function with an S-shape, is commonly used to describe the functional relationship between plant height, weight, leaf area index, or seed germination and time, nitrogen application, and herbicide dosage, etc. [18]. The Logistic equation describes a symmetric growth curve with an asymptotic maximum value. The Richards function can describe an asymmetric curve with an asymptotic maximum value, but it has more parameters than the logistic function. The β-sigmoid function, proposed by Yin et al. [19], is a relatively simple and robust function that can handle the asymmetric growth of plants. Using this asymmetric growth function, source-sink relationships were quantified under different crops and experimental conditions. Yin et al. [20] characterized the source-sink relationship during the wheat grain filling stage using the β-sigmoid function. Shi et al. [21] quantified the source-sink relationship during the rice grain filling stage using the β-sigmoid function. Mao et al. [22] quantified cotton biomass allocation under different densities using the β-growth model. Potatoes and cereals have different source-sink relationships; a potato harvesting organ is not a reproductive organ. Therefore, tubers can be formed earlier so that higher yields can be obtained in a shorter time [23]. Zhang et al. [11] constructed the quantitative relationship between source and sink during potato growth under different water and potassium conditions based on the β-sigmoid function.
This study applied the β-sigmoid growth function to analyze the effects of nitrogen application on the growth characteristics of the source and sink throughout the entire growth period of potato varieties with different nitrogen use efficiencies, as well as the duration of each growth stage, to reveal the coordination mechanism of the source and sink in nitrogen-efficient potatoes. These findings have important theoretical implications for optimizing nitrogen fertilizer application techniques and promoting the use of nitrogen-efficient varieties to improve nitrogen use efficiency.

2. Materials and Methods
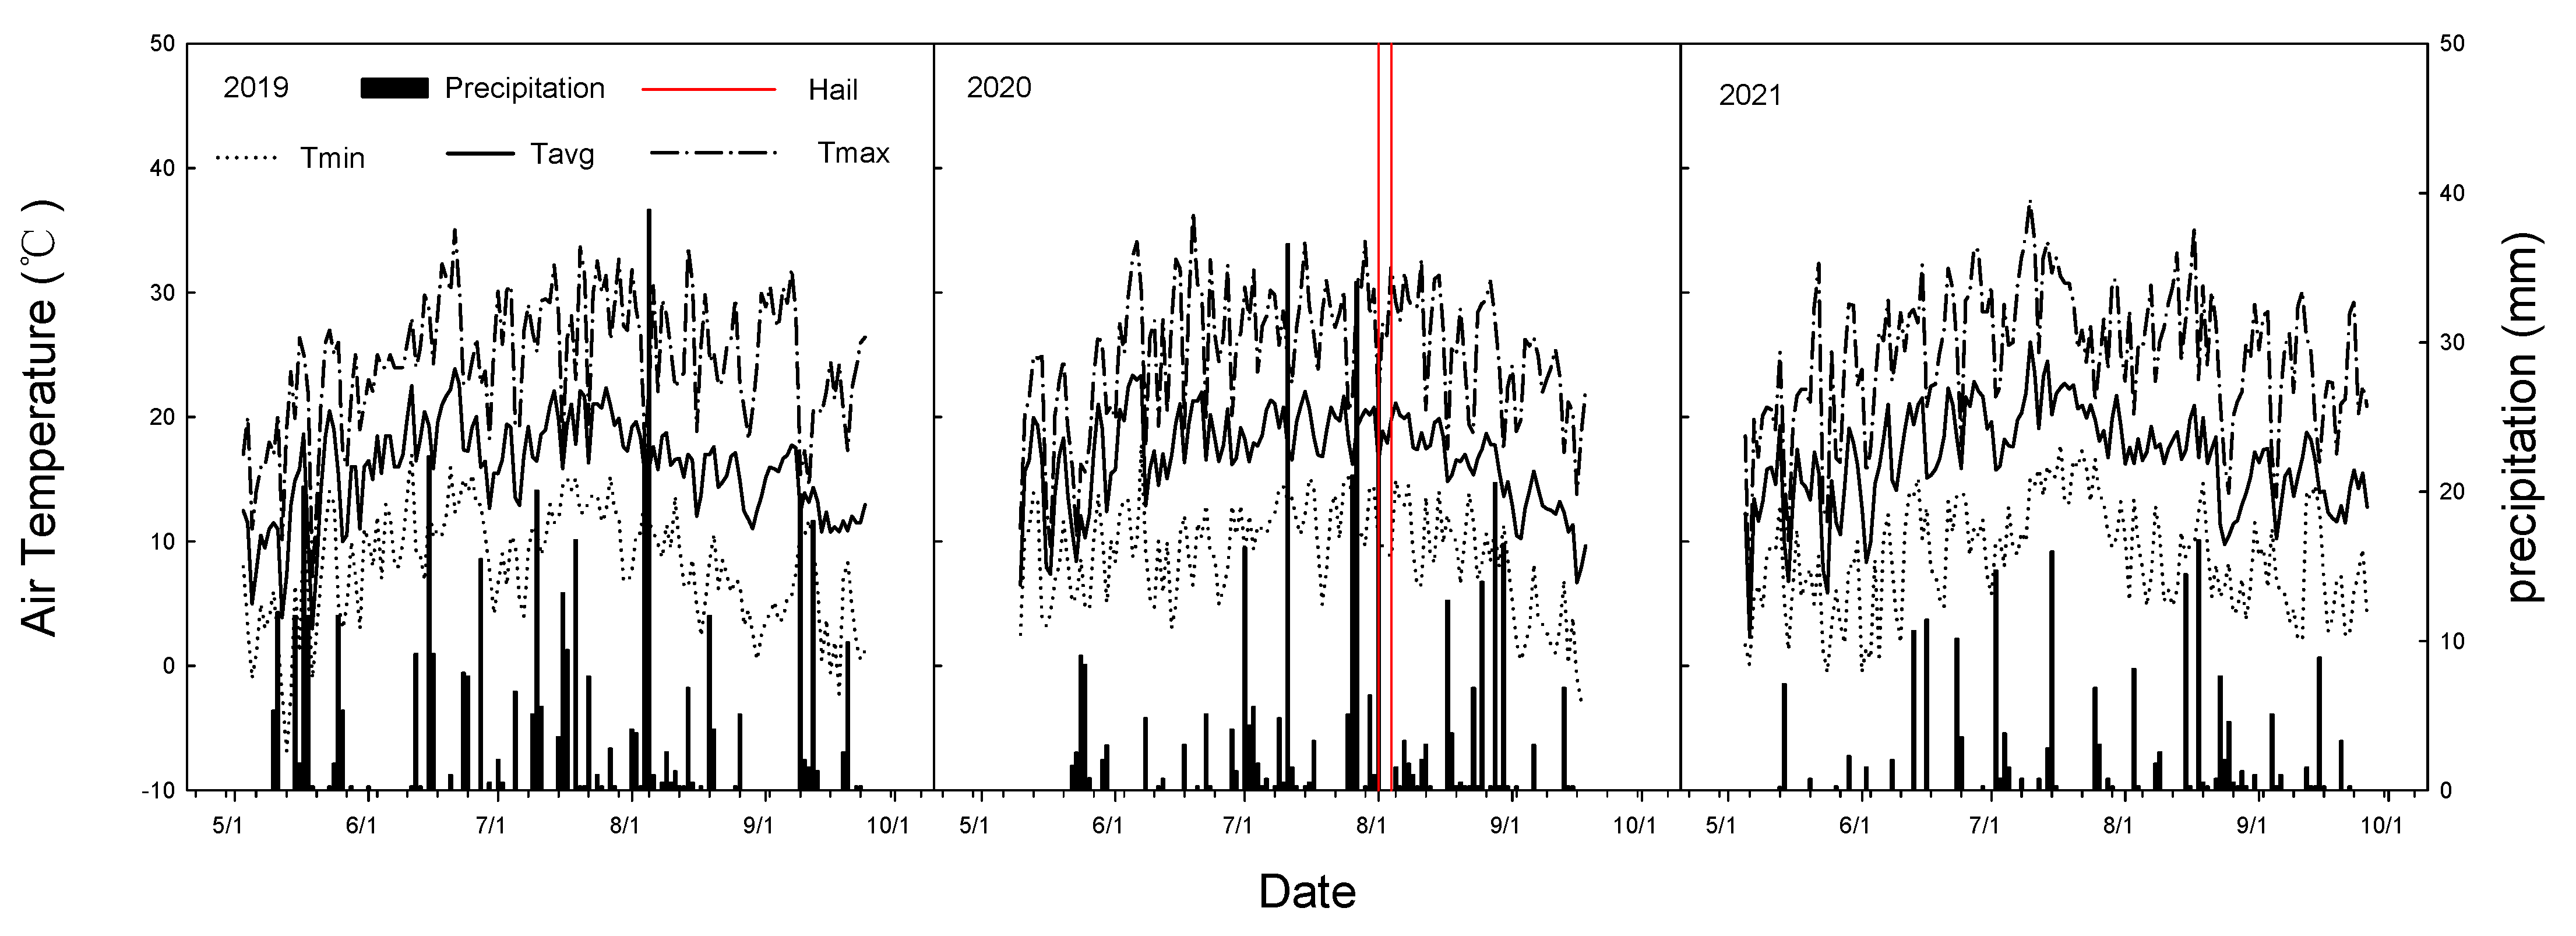
2.1. Site Overview

Field experiments were conducted from May to October in 2019, 2020, and 2021 at the Potato Experimental Research Base in Da Lupu Village, Haolai Mountain Town, Wuchuan County, Hohhot City, Inner Mongolia Autonomous Region, China (41°17′ N, 111°61′ E, 1591 m a.s.l). The site is located on the northern foot of the Yin Mountains, and has a temperate continental monsoon climate. The area has an annual average rainfall of 354 mm, and a frost-free period of 124 days in the last five years. The temperature and rainfall during the three-year growth period are shown in Figure 1. The soil type was chestnut calcareous soil, and the basic nutrients in the 0–20 cm soil layer are shown in Table 1.

2.2. Experiment Design

A split-plot design was used, in which the main plots were nitrogen application rates, including three levels of pure nitrogen (0, 150, and 300 kg·ha−1). The subplots were potato varieties, including two varieties: Jizhang 12 (nitrogen-efficient variety, J) and Youjia 70 (nitrogen-inefficient variety, Y). There were a total of six treatments with four replicates each, and each subplot had an area of 30 m2. The nitrogen fertilizer used in the experiment was urea (containing 46% N), the phosphorus fertilizer was calcium superphosphate (containing 18% P2O5), and the potassium fertilizer was potassium sulfate (containing 51% K2O). The P2O5 and K2O application rates in all subplots were 225 kg·ha−1, and basal fertilizer was applied once. Two-thirds of the urea basal fertilizer was applied, and the remaining one-third was top-dressed during hilling.

2.3. Crop Management

The variety used in the experiment, “Jizhang 12”, was bred from Atlantic and 99-6-36 by the Hebei Academy of Cold Region Crop Research, Shijiazhuang, China, while “Youjia 70” was bred from Summer Beauty and Ben 420 by Inner Mongolia Kunyuan Taihe Agricultural Technology Co., Ltd, Xilingol, China. Planting was conducted on 1 May, 9 May, and 6 May in 2019, 2020, and 2021, respectively, using manual furrow planting with a row spacing of 60 cm and plant spacing of 28 cm, resulting in a planting density of 60,000 plants per hectare. Basal fertilizer was applied directly to the soil before sowing, and nitrogen topdressing was applied around plants before intertillage on 10 July, 15 July, 13 July in three years, respectively, and the yield was measured and harvested on 24 September, 20 September, and 25 September, respectively. Other field management practices were consistent with general field management.

2.4. Yield Measurement and Calculation of Nitrogen Use Efficiency

The yield measurement was conducted by taking two rows of plants in each plot, with an area of 5 m × 1.2 m = 6 m2. During the yield measurement, all the tubers were dug up, sorted by size, counted, and weighed.
The calculation method for the yield and its components is as follows:
Yield (t·ha−1): The weight of all tubers per unit area at harvest is converted to t·ha−1.
Tuber count (unit·plant−1): The number of tubers per unit area is converted to unit·plant−1 at harvest.
Average tuber weight (g): The yield per plant divided by the number of tubers per plant is calculated as the average tuber weight.
Commercial tuber rate (%): The weight of tubers larger than 150 g divided by the total weight of tubers is multiplied by 100.
The calculation methods for nitrogen use efficiency (NUE), nitrogen uptake efficiency (NUpE), and nitrogen utilization efficiency (NUtE) are as follows [24]:
N U E = T u b e r   w e i g h t   a t   m a t u r i t y N   a p p l i c a t i o n   r a t e = N U p E × N U t E
N U p E = t o t a l   N   i n   p l a n t   a t   m a t u r i t y N   a p p l i c a t i o n   r a t e
N U t E = T u b e r   w e i g h t   a t   m a t u r i t y t o t a l   N   i n   p l a n t   a t   m a t u r i t y
The data for the total N in plant at maturity were obtained from the last sampling before yield measurement. Total nitrogen content was determined by the Kjeldahl method after digestion with H2SO4-H2O2.

2.5. Quantification of Source-Sink Relationship

Samples were taken 10 days after emergence, and subsequently every 10 days, for a total of seven times during the growth period. The stem, leaf, and tuber were separated and weighed fresh, then dried at 105 °C for 30 min and further dried at 75 °C to a constant weight to determine the dry matter content of each organ. The dry weight per plant of the source organs (stem and leaf) and the sink organ (tuber) were calculated. The β-Sigmoid growth function described by Yin et al. [19] was used to quantify the source-sink relationship and fit the dynamic relationship between the above-ground (source) and tuber (sink) after potato emergence [11]:
C a p a c i t y = C m a x 1 + t e t t e t m t t e t e t e t m t t e C m a x t > t e ,
where t is the number of days after emergence, Cmax is the maximum weight of the above-ground or tuber at te, and tm is the time of maximum growth rate. The first derivative of Equation (4) reveals the changing trend of source and sink activities over time:
A c t i v i t y = A m a x t e t t e t m t t m t m t e t m ,
where Amax is the maximum activity obtained at tm and is calculated by:
A m a x = C m a x 2 t e t m t e t e t m t m t e t m t e t m ,
The above-grounds were fitted using data from seven samples and the tubers were fitted using data from seven samples and yield measurements. The fresh and dry weights of the above-ground and tuber were fitted using Equation (4), and the corresponding results were used to determine the growth stages in Section 2.6. The dry weights of the above-ground portions and tubers were used to represent the changing capacity (Equation (4)) and activity (Equation (5)) of the source and sink, respectively.

2.6. Determination of Growth Stages

Seedling stage: The potato enters the seedling stage when 75% of the plants have emerged.
Tuber initiation stage: In previous studies on potato tuber formation, it was indicated that tubers form when the top of the stolon swells. A diameter greater than 3.0 mm is the sign of a potato entering into the tuber initiation stage [25]. Under the conditions of this experiment, it was not possible to determine the time of entry into the tuber initiation stage by measuring the diameter of the tuber. Therefore, following Meng’s study [25], the sign of a potato entering the tuber initiation stage was determined by reaching a fresh weight of 1.5 g per tuber.
Tuber bulking stage: The equilibrium of dry weight between the aboveground and tuber parts is recognized as the sign of entry into the tuber bulking stage [26].
Starch accumulation stage: The equilibrium of fresh weight between the aboveground and tuber parts is recognized as the sign of entry into the starch accumulation stage [26]. The potato starch accumulation stage continues until the end of the dry weight growth of the tuber.
The determination method is shown in Figure 2.

2.7. Statistical Analysis

To compare the differences in the yield and its components, nitrogen use efficiency (NUE) and its influencing factors among different treatments, analysis of variance (ANOVA), multiple comparisons, and correlation analysis were performed using IBM SPSS 22 (IBM Corp, Armonk, NY, USA). Duncan’s new multiple range test was used for ANOVA, the least significant difference (LSD) method was used for multiple comparisons, and Pearson’s correlation analysis was used. The β-Sigmoid growth function was fitted using the Gaussian method from iterative nonlinear least squares regression using the SAS software (SAS Institute Inc., Cary, NC, USA) package PROC NLIN [20].

3. Results

3.1. Yield and Its Components

Table 2 shows the yield and its components in the two potato varieties with different nitrogen use efficiencies at different nitrogen application rates. The results of the three-year experiment were similar, showing significant effects of variety and nitrogen application rate on yield and an interactive effect. The number of tubers was mainly affected by the variety, while the weight of a single tuber was influenced by the nitrogen application rate, as well as the variety in 2019 and 2020. Except for 2021, both variety and nitrogen application rates had significant effects on the marketable tuber rate. The yield, weight of a single tuber, and commercial tuber rate of the same potato variety decreased with a reduction in nitrogen application rate.
For the same potato varieties, the yield, weight per tuber, and commercial tuber rate all showed a decreasing trend with the decrease of nitrogen application rate. In 2019 and 2021, the two-year average yield, weight per tuber, and commercial potato rate significantly decreased in the 0 and 150 nitrogen treatment groups by 59.46% and 21.86%, 54.90% and 21.50%, and 59.88% and 21.14%, respectively, for Jizhang 12 compared to the treatment to a nitrogen application rate of 300. Youjia 70 decreased by 60.64% and 17.49%, 50.96% and 18.48%, and 77.09% and 15.35%, respectively. Comparing different potato varieties under the same nitrogen application rate, Jizhang 12 had a higher yield, number of tubers, weight of a single tuber, and marketable tuber rate than Youjia 70 did. Under the 0, 150, and 300 kg·ha−1 nitrogen application rates, the average yields of Jizhang 12 in 2019 and 2021 increased significantly by 99.37%, 83.35%, and 93.61%, respectively, compared to Youjia 70. The number of tubers per plant increased significantly by 79.59%, 57.78%, and 59.00%, whereas the weight of a single tuber increased by 11.74%, 16.99%, and 21.49%, and the marketable tuber rate was 112.92%, 13.25%, and 21.57% higher, respectively.
In 2020, due to hail during the tuber bulking stage, the yield, weight of a single tuber, and marketable tuber rate were severely affected. Compared with the average values of 2019 and 2020, the yield of all treatments decreased by an average of 14.14 t·ha−1, the weight of a single tuber decreased by an average of 48.37 g, and the marketable tuber rate decreased by an average of 26.81%.

3.2. Nitrogen Use Efficiency, Nitrogen Uptake Efficiency, and Nitrogen Utilization Efficiency

Table 3 shows the nitrogen use efficiency (NUE), nitrogen uptake efficiency (NUpE), and nitrogen utilization efficiency (NUtE) of the two potato varieties under the different nitrogen application rates. As shown in Table 3, the NUE of potatoes was significantly affected by nitrogen application rates and varieties, whereas NUpE was also affected by nitrogen application rates and varieties, with the exception of 2021. In terms of nitrogen application rates, NUE and NUpE increased with a decreasing nitrogen application rates. In the two-year average of 2019 and 2021, for the 150 kg·ha−1 nitrogen application rate, compared to the 300 kg·ha−1 nitrogen application rate, the NUE of Jizhang 12 increased significantly by 59.15% and that of Youjia 70 increased by 58.53%. The NUpE of Jizhang 12 increased by 33.86%, whereas that of Youjia 70 increased by 48.42%. In terms of variety comparison, the NUE and NUpE of Jizhang 12 were significantly higher than those of Youjia 70. In the two-year averages of 2019 and 2021, for both nitrogen use efficiency and NUpE, at the 150 kg·ha−1 and 300 kg·ha−1 nitrogen application rates the NUE of Jizhang 12 increased by 40.33% and 40.02%, respectively, and the NUpE increased by 30.79% and 45.73%, respectively, compared to Youjia 70. The NUtE showed inconsistent results over the three years, with significant effects of nitrogen application rates in 2019 and significant effects of varieties in 2020.
In 2020, due to hail damage, NUE, NUpE, and NUtE were lower than in the other two years. Compared to the average values of 2019 and 2021, at 150 and 300 N application rates, NUE of Jizhang 12 decreased by 5.91 g·g N−1 and 4.66 g·g N−1, respectively, and that of Youjia 70 decreased by 7.43 g·g N−1 and 4.91 g·g N−1, respectively. NUpE of Jizhang 12 decreased by 1.19 g N·g N−1 and 1.00 g N·g N−1, respectively, and that of Youjia 70 decreased by 1.72 g N·g N−1 and 1.07 g N·g N−1, respectively. NUtE of Jizhang 12 decreased by 85.53 g·g N−1 and 102.10 g·g N−1, respectively, and that of Youjia 70 decreased by 123.53 g·g N−1 and 130.89 g·g N−1, respectively.

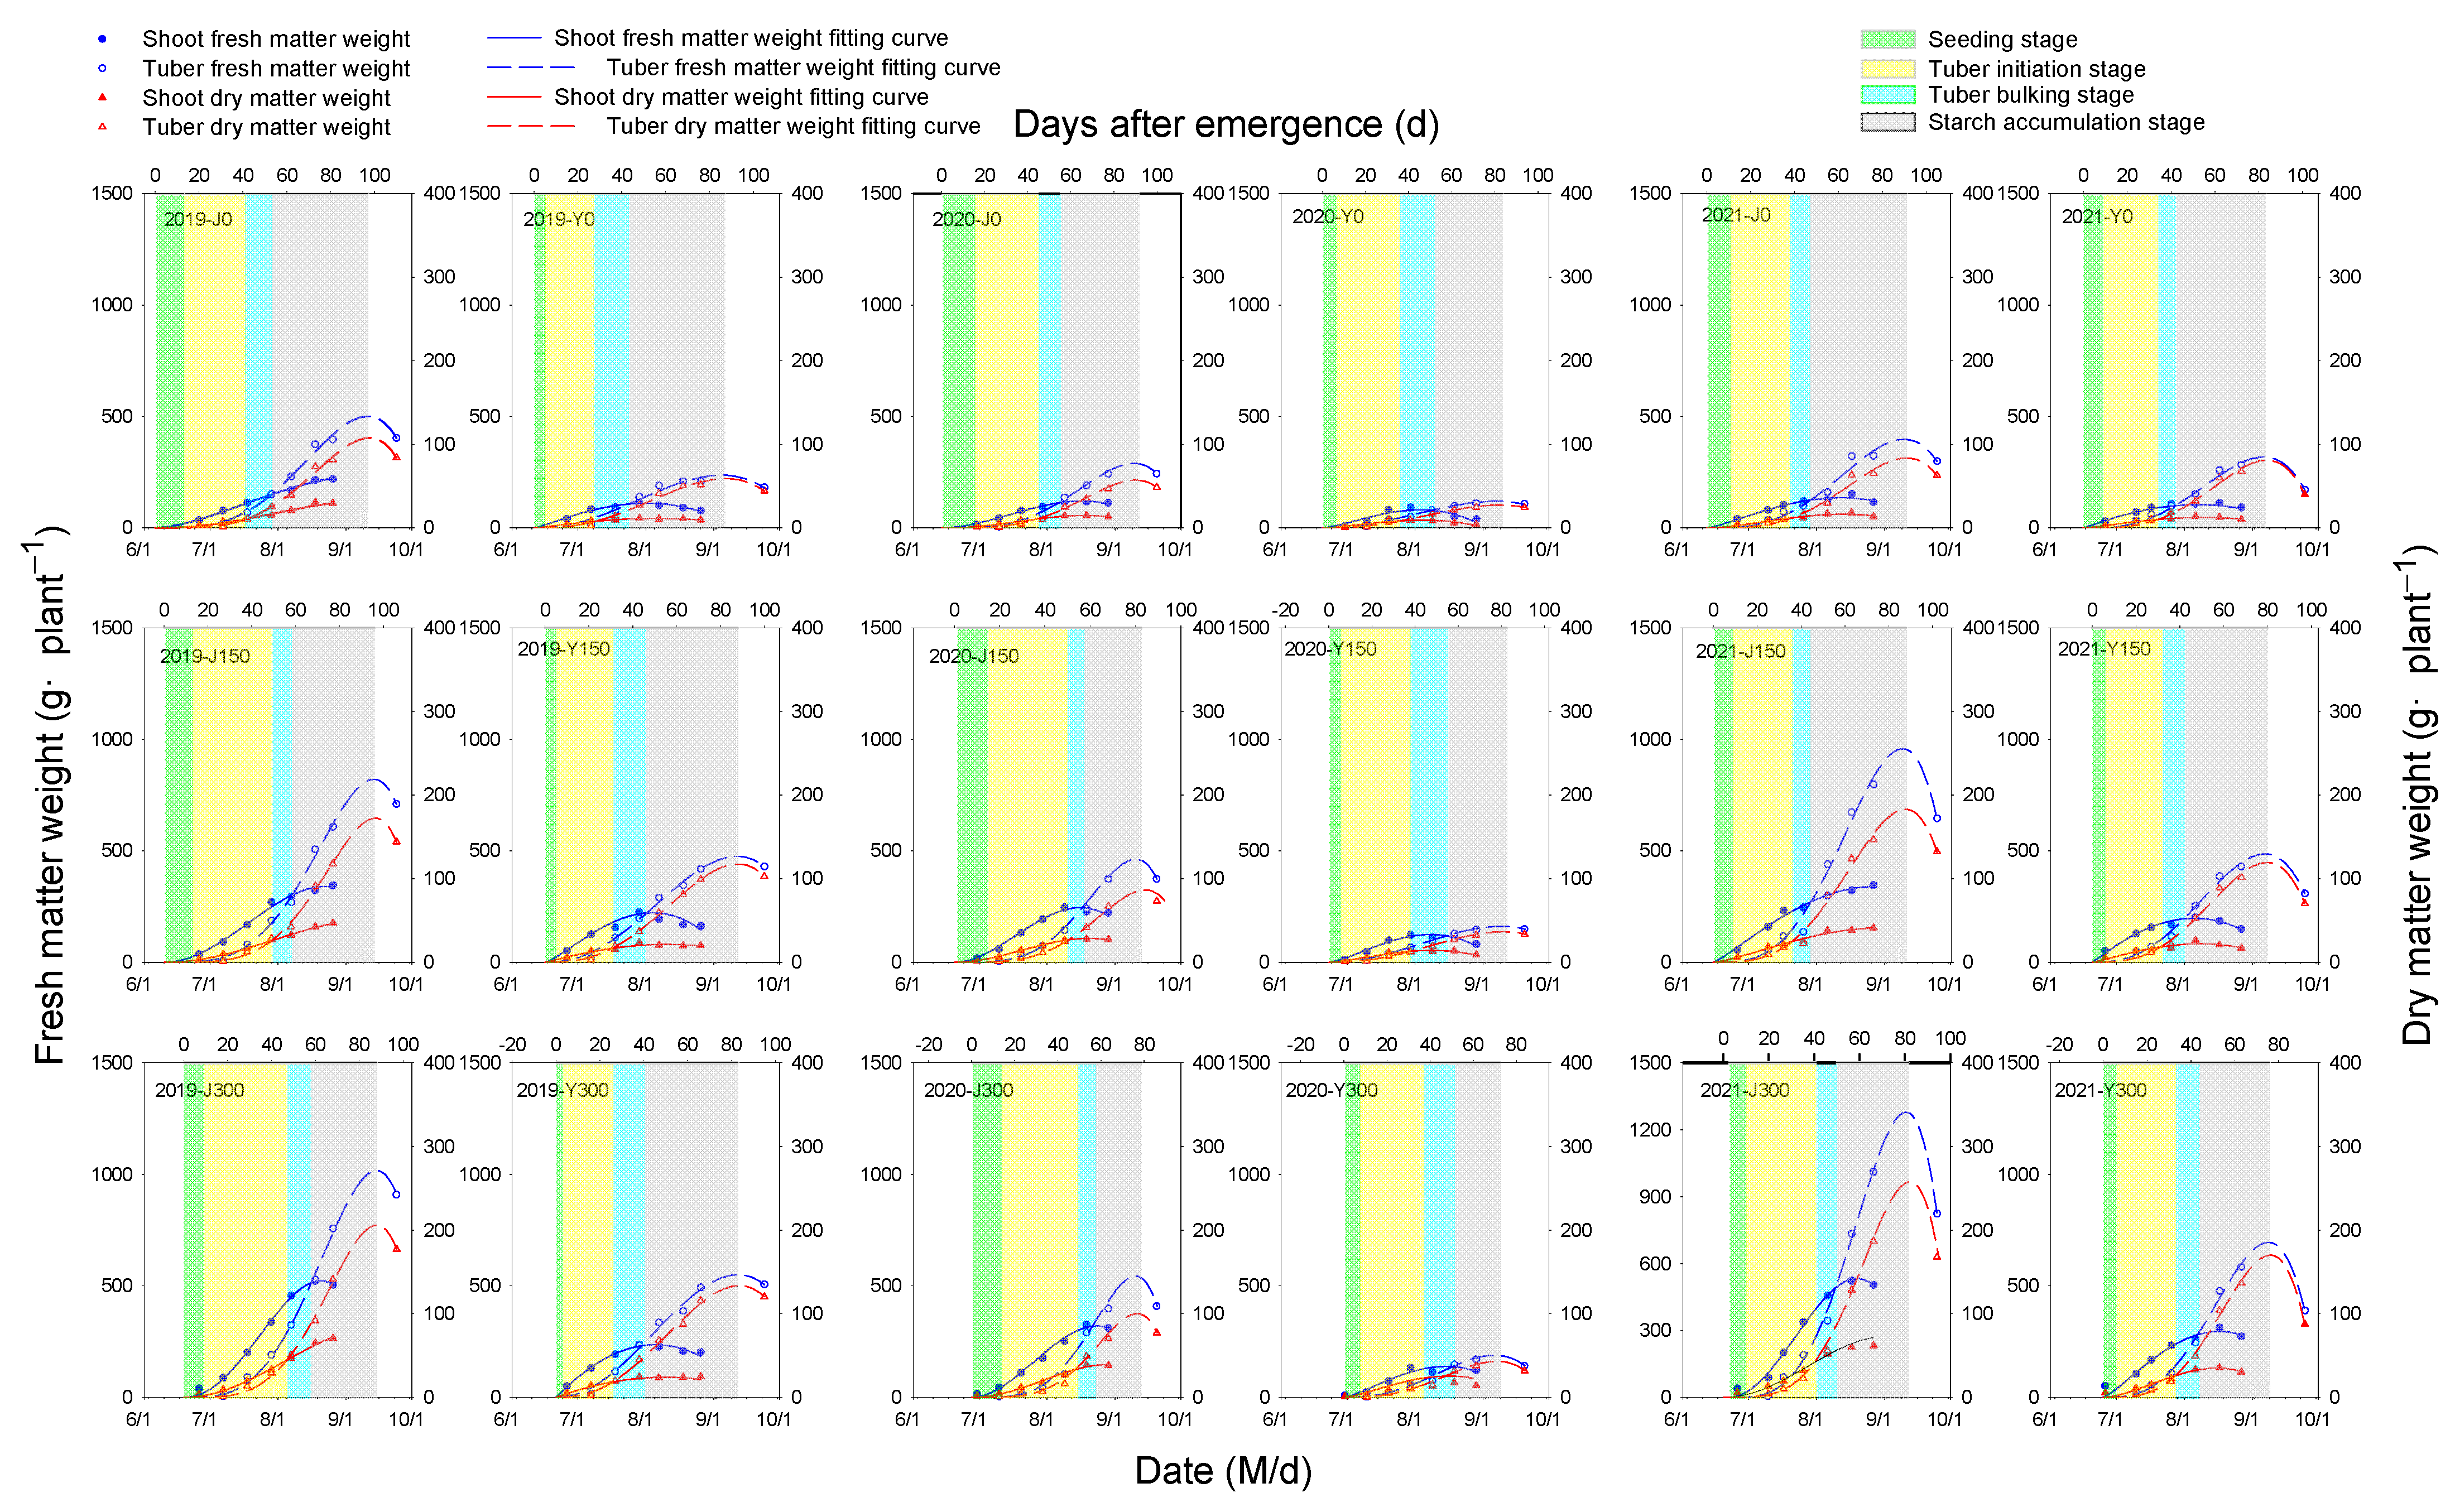
3.3. Source and Sink Growth

Table 4 shows the dry weight fitting parameters for the different treatments, where the maximum value of source and sink reflecting its capacity; the time at which the maximum source and sink capacity reflecting its growth time. Figure 3 shows the measured dry weight and fitting curves of source organs (stems and leaves) and sink organs (tubers) during the growth of potatoes. The fitting of both equations is good, with R2 greater than 0.92.
Figure 3. Actual dry and fresh weight and their corresponding fitting curves of two potato varieties at different nitrogen application rates. The year and treatment are noted in the upper left corner of the figure. Points are measured value; lines are fitting curve; shaded areas are growth stage. The fitting curve parameters are recorded in Table 4 and Table 5.
Agronomy 13 01083 g003
Table 4. Fitting parameter values for source and sink capacity and activity of two potato varieties at different nitrogen application rates.
YearN Rate
(kg·ha−1)
VarietiesEstimated Parameter of SourceEstimated Parameter of SinkCb/Ca
CateatmaAmaxaR2CbtebtmbAmaxbR2
20190J31.594 (9/8)54 (7/30)0.530.95107.797 (9/11)74 (8/19)2.370.953.42
Y11.456 (7/27)10 (6/21)0.310.9759.087 (8/27)54 (7/25)1.130.945.16
150J50.392 (9/10)50 (7/30)0.840.99172.296 (9/14)75 (8/24)4.120.983.42
Y21.455 (8/10)6 (6/22)0.630.97117.488 (9/12)57 (8/12)2.320.985.49
300J82.386 (9/13)46 (8/4)1.460.96206.088 (9/15)67 (8/25)5.070.982.50
Y24.050 (8/10)2 (6/23)0.880.97133.583 (9/12)51 (8/11)2.630.995.56
20200J14.866 (8/19)37 (7/21)0.350.9857.190 (9/12)67 (8/20)1.330.973.85
Y9.346 (8/5)17 (7/7)0.290.9527.482 (9/10)49 (8/8)0.540.952.96
150J28.561 (8/21)30 (7/21)0.700.9786.384 (9/13)64 (8/24)2.240.973.03
Y14.148 (8/10)17 (7/10)0.420.9536.481 (9/12)48 (8/10)0.730.962.58
300J39.163 (8/30)33 (7/31)0.950.98100.077 (9/12)59 (8/26)2.940.972.56
Y15.949 (8/18)15 (7/15)0.470.9443.071 (9/9)47 (8/16)1.080.962.71
20210J16.462 (8/13)26 (7/8)0.380.9683.691 (9/11)65 (8/16)1.800.975.10
Y12.555 (8/10)13 (6/29)0.340.9380.983 (9/7)60 (8/15)1.910.926.47
150J41.378 (9/1)22 (7/7)0.770.96182.988 (9/11)62 (8/16)4.050.964.43
Y22.049 (8/8)9 (6/29)0.680.94119.180 (9/8)54 (8/13)2.720.975.42
300J72.371 (9/1)38 (7/30)1.570.96257.682 (9/12)62 (8/23)6.740.983.56
Y34.952 (8/13)22 (7/17)0.980.97170.176 (9/6)55 (8/16)4.380.964.87
The value in parentheses indicates the date corresponding to the days after emergence (M/d). For the source part: Ca, the maximum value of source capacity (g·plant−1); Amaxa, the maximum value of source activity (g·plant−1·d−1); tma, the time at which the maximum source activity is reached (DAE); tea, the time at which the maximum source capacity is reached (DAE). For the sink part: Cb, the maximum value of sink capacity (g·plant−1); Amaxb, the maximum value of sink activity (g·plant−1·d−1); tmb, the time at which the maximum sink activity is reached (DAE); teb, the time at which the maximum sink capacity is reached (DAE).
Table 5. Fitting parameter values for shoot and tuber fresh weight of two potato varieties at different nitrogen application rates.
YearN Rate
(kg·ha−1)
VarietiesEstimated Parameter of ShootEstimated Parameter of Tuber
CateatmaAmaxaR2CbtebtmbAmaxbR2
20190J235.296 (9/10)40 (7/16)3.540.96500.997 (9/11)70 (8/15)10.230.95
Y110.751 (7/22)9 (6/20)3.300.98236.885 (8/25)48 (7/19)4.350.93
150J339.973 (8/22)38 (7/20)7.050.98821.596 (9/14)71 (8/20)17.850.98
Y222.149 (8/1)13 (6/29)6.650.97474.487 (9/11)51 (8/6)8.660.98
300J522.663 (8/21)35 (7/28)13.030.961016.988 (9/15)63 (8/21)22.720.98
Y235.845 (8/5)1 (6/22)9.480.98549.783 (9/12)45 (8/5)10.190.98
20200J120.565 (8/18)32 (7/16)2.760.98289.589 (9/11)65 (8/18)6.530.97
Y80.846 (8/5)15 (7/5)2.560.94119.681 (9/9)44 (8/3)2.290.95
150J245.158 (8/18)27 (7/18)6.300.97461.983 (9/12)63 (8/23)11.860.98
Y124.347 (8/9)15 (7/8)3.800.94160.580 (9/11)43 (8/5)3.100.96
300J320.158 (8/25)29 (7/27)8.230.98543.476 (9/11)58 (8/25)15.560.97
Y138.247 (8/16)14 (7/14)4.230.95188.270 (9/8)44 (8/13)4.530.96
20210J135.161 (8/12)16 (6/28)3.240.96397.690 (9/10)62 (8/13)8.230.97
Y104.152 (8/7)4 (6/20)3.330.95318.382 (9/6)55 (8/10)7.020.92
150J340.174 (8/28)13 (6/28)6.980.96958.886 (9/9)61 (8/15)21.180.95
Y196.946 (8/5)4 (6/24)7.090.96485.679 (9/7)50 (8/9)10.520.97
300J533.258 (8/19)31 (7/23)13.890.961278.681 (9/11)59 (8/20)31.610.98
Y295.653 (8/14)12(7/7)8.280.97694.675 (9/5)52(8/13)16.900.96
The value in parentheses indicates the date corresponding to the days after emergence (M/d). For the shoot part: Ca, the maximum value of shoot fresh weight (g·plant−1); Amaxa, the maximum value of fresh shoot growth rate (g·plant−1·d−1); tma, the time at which the maximum fresh shoot growth rate is reached (DAE); tea, the time at which the maximum shoot fresh weight is reached (DAE). For the tuber part: Cb, the maximum value of tuber fresh weight (g·plant−1); Amaxb, the maximum value of fresh tuber growth rate (g·plant−1·d−1); tmb, the time at which the maximum fresh tuber growth rate is reached (DAE); teb, the time at which the maximum tuber fresh weight is reached (DAE).
The three-year average source capacity (Ca) was lower for the 0 and 150 kg N ha−1 treatments compared to the 300 kg N ha−1 treatment, with decreases of 67.03% and 36.30%, respectively, for Jizhang 12 and decreases of 52.71% and 19.72%, respectively, for Youjia 70. Under the 0, 150, and 300 kg N ha−1 treatments, the three-year average Ca of Jizhang 12 was higher than that of Youjia 70 by 88.82%, 108.43%, and 165.40%, respectively (Table 4). The three-year average sink capacity (Cb) was lower for the 0 and 150 kg N ha−1 treatments compared to the 300 kg N ha−1 treatment, with decreases of 52.70% and 19.69%, respectively, for Jizhang 12 and decreases of 48.21% and 19.17%, respectively, for Youjia 70. Comparing the two varieties, under the 0, 150, and 300 kg N ha−1 treatments, the three-year average Cb of Jizhang 12 was higher than that of Youjia 70 by 64.89%, 79.15%, and 79.34%, respectively (Table 4). It can be seen that both source and sink capacity decreased with a decreasing nitrogen application rate, and Jizhang 12, a high nitrogen use efficiency variety, had higher capacities than Youjia 70, a low nitrogen use efficiency variety.
According to Table 4, except for the no nitrogen treatment of Jizhang 12 in 2021 and all treatments of Youjia 70 in 2020, the time to reach the maximum source capacity (tea) of potatoes increased with a decrease in nitrogen application. In 2019, the increase in tea for Jizhang 12 in the 0 and 150 nitrogen application treatments compared to the 300 nitrogen application treatment was 8 and 6 days, respectively, whereas for Youjia 70, it was 6 and 5 days, respectively. Comparing the two varieties, the three-year average tea of Jizhang 12 was longer than that of Youjia 70 by 22, 26, and 23 days under the 0, 150, and 300 nitrogen application treatments, respectively. The time to reach maximum sink capacity (teb) averaged over three years was 10 and 7 days longer in the 0 and 150 nitrogen application treatments for Jizhang 12 compared to the 300 nitrogen application treatment, and 6 days longer for Youjia 70 in both the 0 and 150 nitrogen application treatments. Comparing the two varieties, the three-year average teb of Jizhang 12 was longer than that of Youjia 70 by 9, 7, and 6 days under the 0, 150, and 300 nitrogen application treatments, respectively. Therefore, reducing nitrogen application can increase the growth time of the potato source and sink capacity organs. The nitrogen use efficient variety Jizhang 12 had longer growth times for both source and sink organs compared to the nitrogen use inefficient variety Youjia 70, and the increase in growth time was greater with decreasing nitrogen application.
Table 4 shows that the date on which the source capacity reached its maximum was advanced as the nitrogen application rate decreased, and in all nitrogen treatments, it occurred earlier in Youjia 70 than in Jizhang 12. The date when the sink capacity reached its maximum varied between the two varieties with changes in the nitrogen application rate. Jizhang 12 showed a trend of advancing the date as nitrogen application rate decreased, except for the year 2020, while Youjia 70 showed the latest date in the 150 kg N/ha treatment, with both the reduction and increase of nitrogen application rate leading to an earlier date of maximum sink capacity. Additionally, the date on which the sink capacity reaches its maximum is later in Jizhang 12 than in Youjia 70.

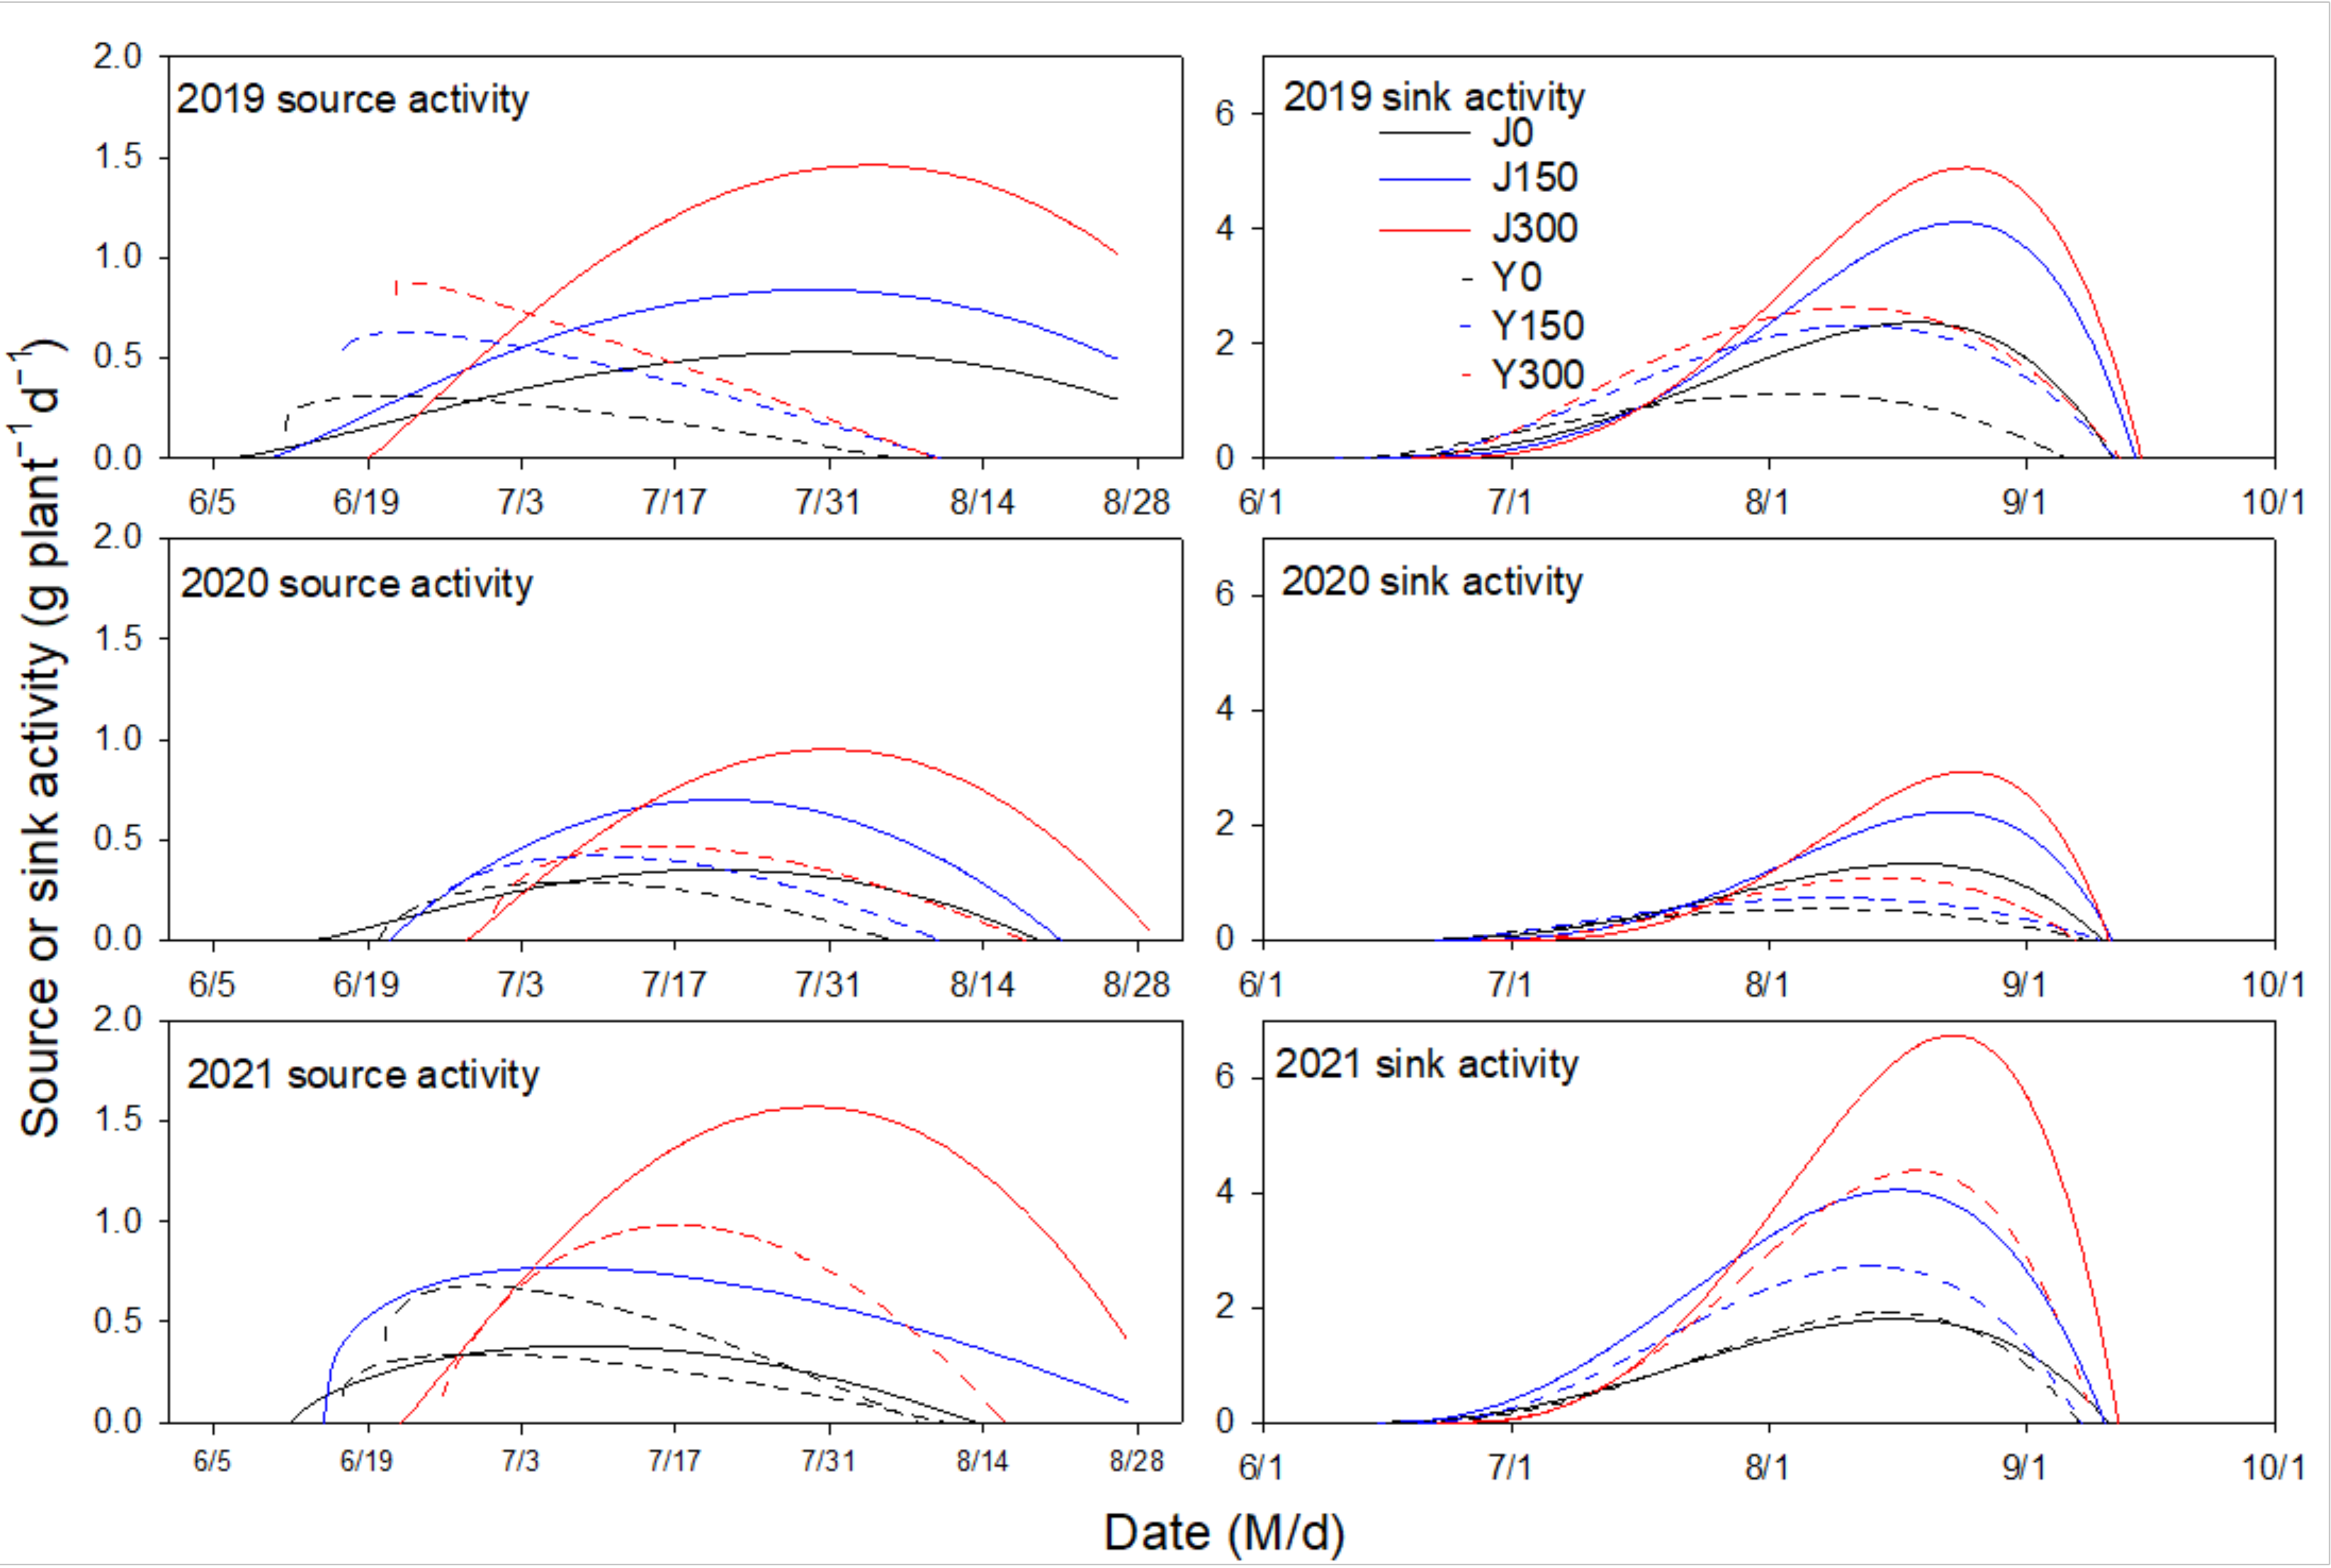
3.4. Source and Sink Activity

As shown in Table 4 and Figure 4, the activity of both source and sink exhibits a trend of initially increasing and then decreasing over time. The time when the source activity reaches its maximum (tma) is earlier than the time when the sink activity reaches its maximum (tmb), and the decrease in sink activity is faster after reaching the maximum value. The time for both source and sink activities to reach their maximum values is earlier with a decrease in nitrogen application rate, and Youjia 70 reaches its maximum earlier than Jizhang 12. The J300 treatment had the highest maximum source activity (Amaxa) and maximum sink activity (Amaxb) in 2019, 2020, and 2021, with Amaxa being 1.46 g·plant−1·d−1, 0.95 g·plant−1·d−1, and 1.52 g·plant−1·d−1, and Amaxb being 2.34 g·plant−1·d−1, 1.30 g·plant−1·d−1, and 3.13 g·plant−1·d−1, respectively. In the three-year period, Amaxa and Amaxb both decreased with a decrease in nitrogen application rate, and Youjia 70 was lower than Jizhang 12. Compared to the 300 nitrogen application rate, the average Amaxa of Jizhang 12 was 67.35% and 39.83% lower at the 0 and 150 nitrogen application rates, respectively, while the average Amaxa of Youjia 70 was 56.26% and 22.95% lower, respectively. The average Amaxb of Jizhang 12 was 60.45% and 27.46% lower at the 0 and 150 nitrogen application rates, respectively, while the average Amaxb of Youjia 70 was 54.37% and 27.27% lower, respectively. In comparison between the two varieties, at the 0, 150, and 300 nitrogen application rates, the average Amaxa of Jizhang 12 was 35.39%, 37.34%, and 75.95% higher than that of Youjia 70, respectively, while the average Amaxb was 82.74%, 110.83%, and 106.25% higher, respectively.

3.5. Source-Sink Relationships

Figure 3 shows the changes in growth trends of source and sink organs, which represent the transition time from the growth center of aboveground source organs to that of underground sink organs (growth center transition time). As shown in Figure 3, with decreasing nitrogen application rates, the growth center transition time of potato plants was advanced, and the effect was more pronounced in the Jizhang 12 variety. On average over three years (2019–2021), compared with the 300 kg·ha−1 nitrogen treatment, the growth center transition time of Jizhang 12 was advanced by 17 days and 8 days under the 0 kg·ha−1 and 150 kg·ha−1 nitrogen treatments, respectively, while that of Youjia 70 was advanced by 9 days and 4 days, respectively. Comparing the two varieties, except for 2021, the growth center transition time of Jizhang 12 was later than that of Youjia 70 under each nitrogen application rate. For the two years average of 2019 and 2020, the growth center transition time of Jizhang 12 was later than that of Youjia 70 by 6 days, 12 days, and 15 days under the 0 kg·ha−1, 150 kg·ha−1, and 300 kg·ha−1 nitrogen treatments, respectively. Furthermore, analysis of the sink/source ratio (Cb/Ca) in Table 4 shows that, except for the Youjia 70 treatment in 2019, the Cb/Ca ratio increased with decreasing nitrogen application rates, and in 2019 and 2021 the Cb/Ca ratio was higher in Youjia 70 than in Jizhang 12.

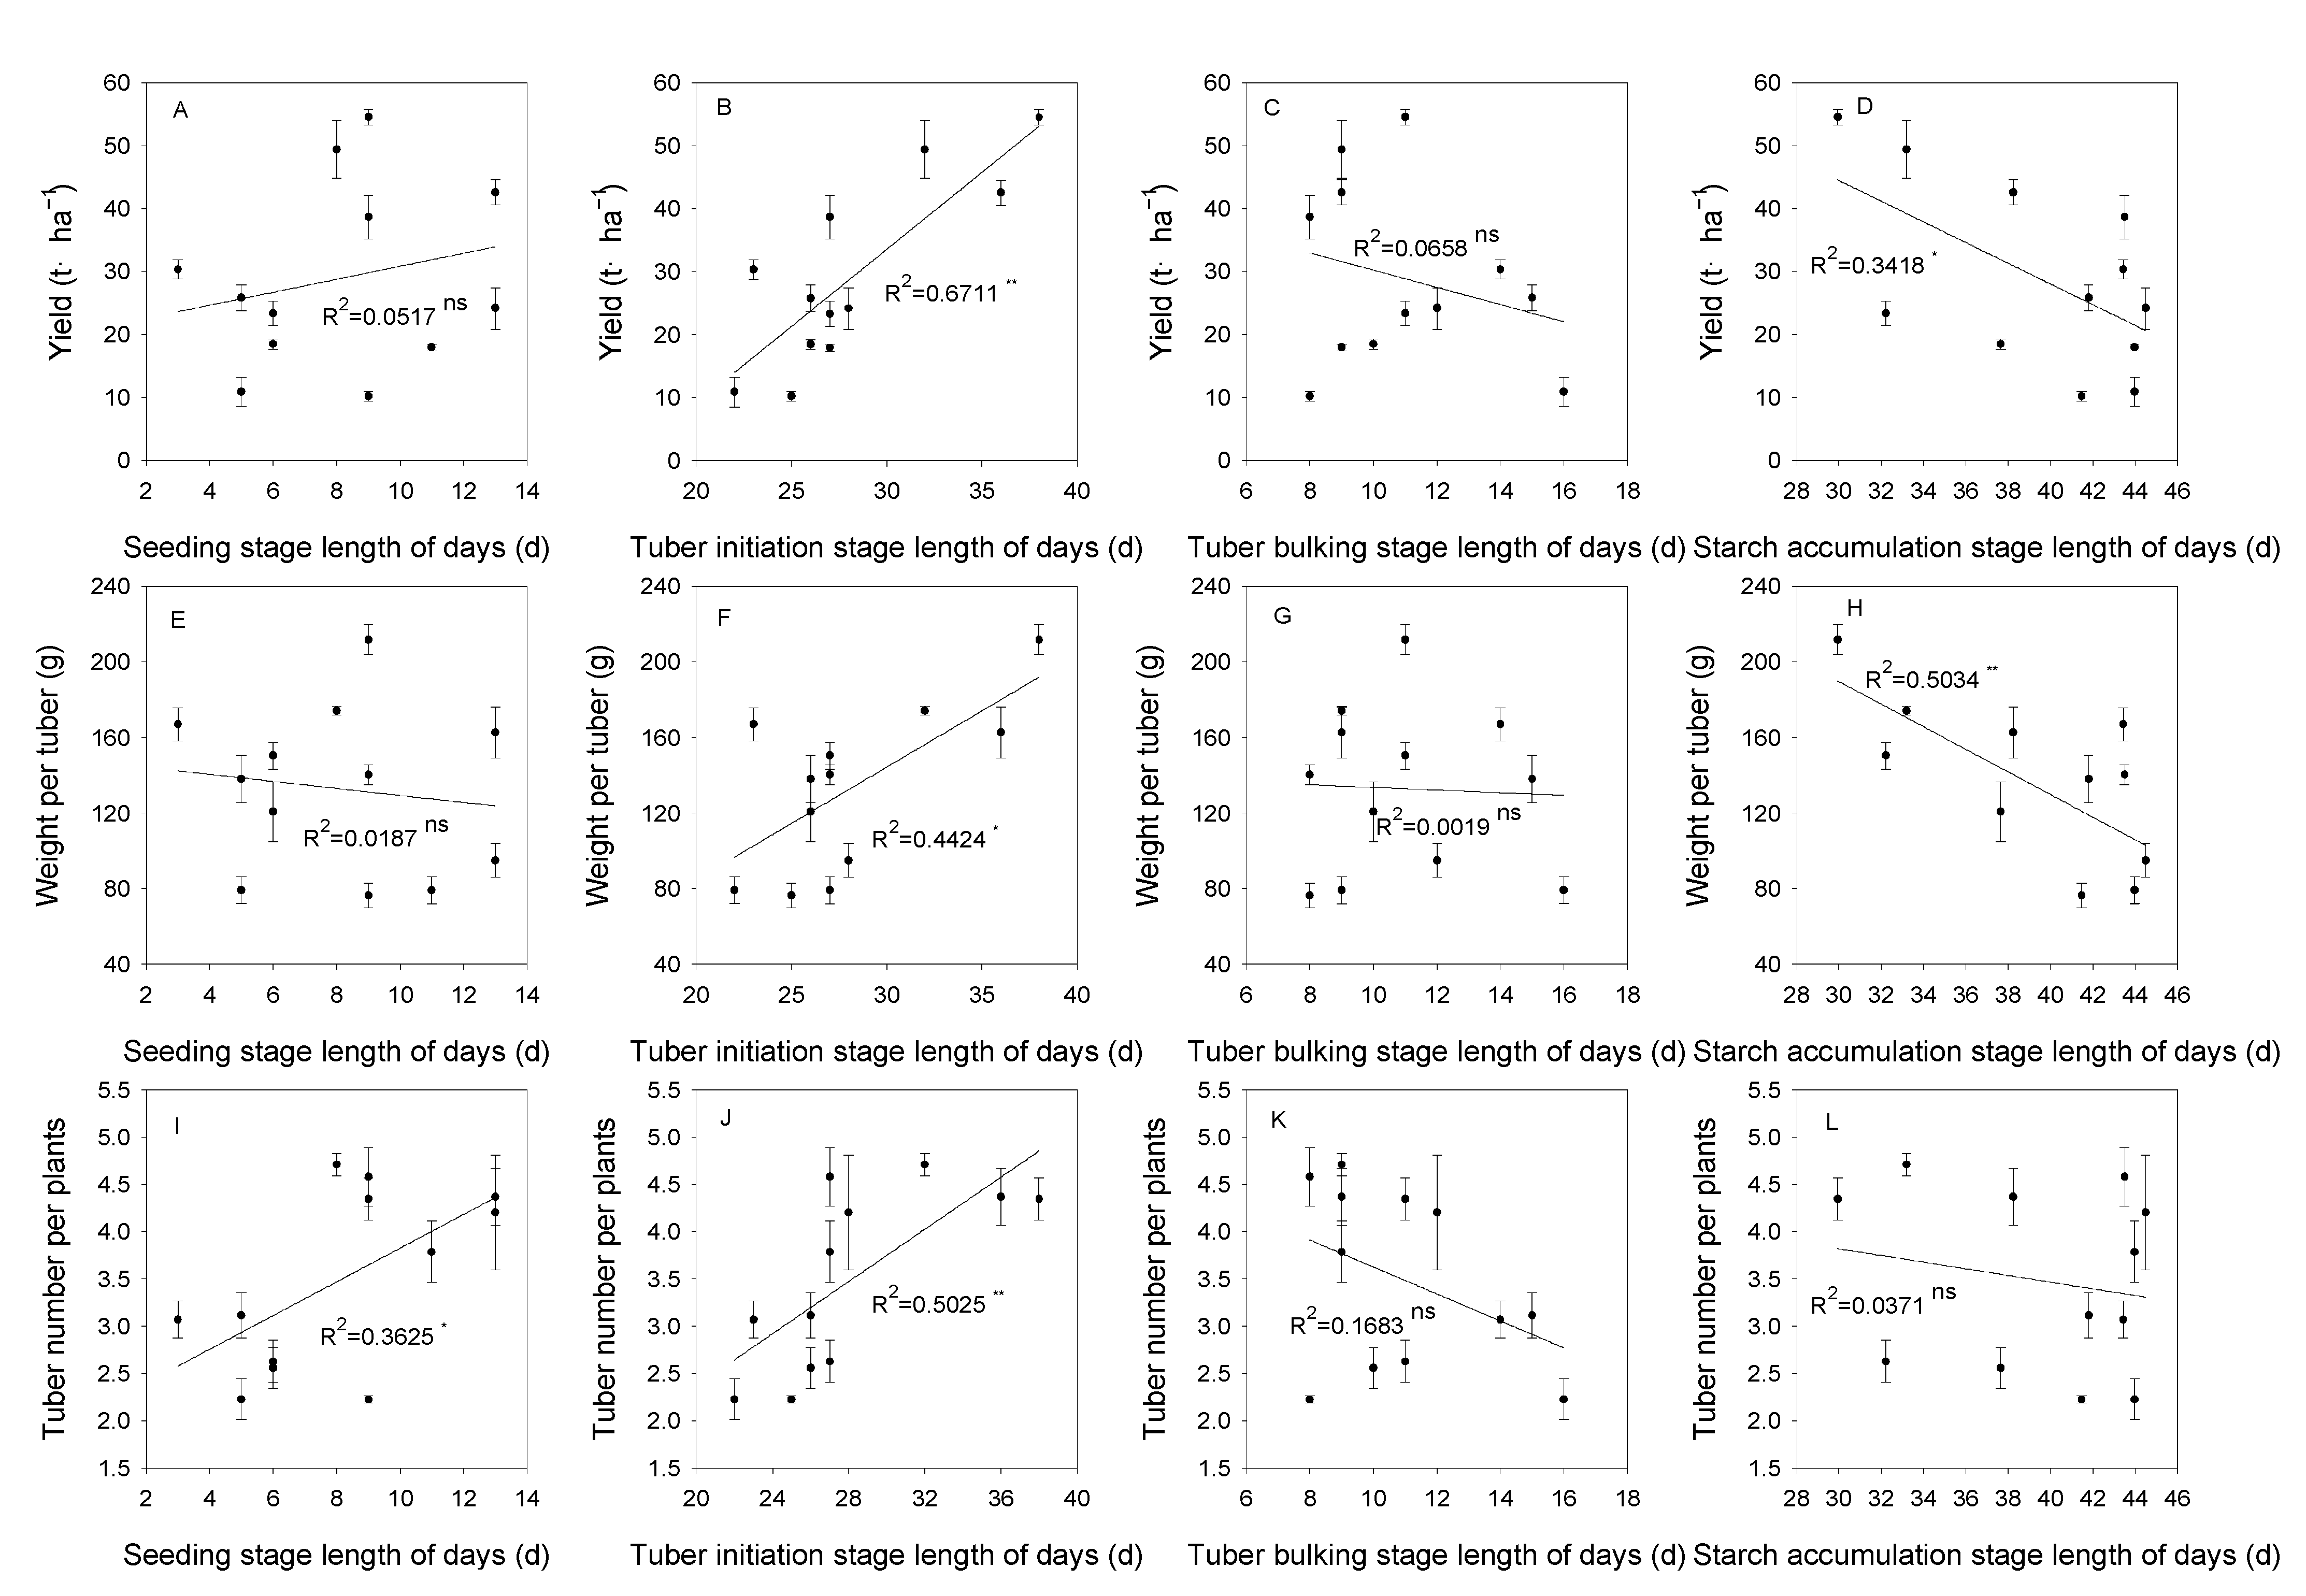
3.6. Growth Stages and Its Relationship to Yield

Table 6 shows the emergence dates of potato seedlings in the three-year experiment. The potatoes were sown on 1 May, 9 May, and 6 May in 2019, 2020, and 2021, respectively. Under different nitrogen application rates and varieties, differences in emergence dates were observed, indicating that the nitrogen application rate and variety affect potato sprouting and emergence time. Increasing nitrogen application rate delayed the emergence date of potatoes. In the treatment with 300 kg·ha−1 of nitrogen application rate, the emergence dates of Jizhang 12 and Youjia 70 were 47–50 days and 50–52 days after sowing, respectively. The average emergence dates of Jizhang 12 were earlier by 8 and 13 days under 0 and 150 kg·ha−1 of nitrogen application rate, respectively, and those of Youjia 70 were earlier by 6 and 10 days, respectively. The emergence date of the nitrogen use efficient variety Jizhang 12 was earlier than that of the nitrogen use inefficient variety Youjia 70, and the number of days of advancement increased as the nitrogen application rate decreased.
Table 7 shows the start, end time, and duration of each phenological stage of potato growth. According to Table 7, except for Youjia 70 in 2020, the duration (LD) of the potato seedling stage in all treatments showed an increasing trend with decreasing nitrogen application rate. In 2019 and 2021, compared with the treatment with 300 kg·ha−1 of nitrogen application rate, Jizhang 12 had a longer LD by 4 days and 3 days, respectively, under 0 and 150 kg·ha−1 of nitrogen application rate, while Youjia 70 had a longer LD by 3 days and 1 day, respectively. At the same nitrogen application rate, the LD of the seedling stage in Jizhang 12 was longer than that in Youjia 70. The average LD of the seedling stage in Jizhang 12 was longer by 6, 7, and 5 days than that in Youjia 70 under 0, 150, and 300 kg·ha−1 of nitrogen application rate, respectively. In addition, there was a significant positive correlation between the LD of the seedling stage and the number of tubers per plant (Figure 5I).
The length of the tuber initiation stage determines the number of tubers. Jizhang 12 showed a decreasing trend in LD of tuber initiation stage with decreasing nitrogen application in both 2019 and 2021, whereas Youjia 70 exhibited the longest LD of tuber initiation stage at 150 kg·ha−1 nitrogen application in 2019 and 2020. In 2021, the LD of the 300 kg·ha−1 nitrogen application treatment was only 1 day longer than that of the 150 kg·ha−1 nitrogen application treatment. The three-year average LD of tuber initiation stage was longer for Jizhang 12 than for Youjia 70 under the same nitrogen application treatment. The average LD of the tuber initiation stage over three years was 3 days, 5 days, and 9 days longer for Jizhang 12 than for Youjia 70 at the 0, 150, and 300 kg·ha−1 nitrogen application treatments, respectively. In addition, there was a significant positive correlation between LD of tuber initiation stage and yield, single tuber weight, and number of tubers per plant (Figure 5B,F,J).
The difference in LD in the tuber bulking stage between different nitrogen application treatments did not exceed 3 days, and there was no consistent pattern of change with the nitrogen application over three years. However, under the same nitrogen application treatment, except for the no nitrogen treatment in 2021, Youjia 70 had a longer LD of tuber bulking stage than Jizhang 12. Over three years, the average LD of tuber bulking stage was 3 days, 6 days, and 4 days longer for Youjia 70 than for Jizhang 12 at the 0, 150, and 300 kg·ha−1 nitrogen application treatments, respectively. There was no correlation between the LD of the tuber bulking stage, the yield, and its components.
The LD of starch accumulation stage showed an increasing trend with decreasing nitrogen application, except for Youjia 70 in 2019. Over three years, compared with the 300 kg·ha−1 nitrogen application treatment, the average LD of starch accumulation stage was 13 days and 8 days longer for Jizhang 12 at the 0 and 150 kg·ha−1 nitrogen application treatments, respectively, and 7 days and 3 days longer for Youjia 70, respectively. However, the length of LD of starch accumulation stage for the two varieties did not exhibit a consistent pattern over three years. There was a significant negative correlation between LD of starch accumulation stage and yield and single tuber weight (Figure 5B,H).

4. Discussion

4.1. Yield and Its Component Factors

Nitrogen nutrition is one of the important limiting factors in potato yield formation [23,27,28]. Nitrogen application has a significant impact on all growth parameters that show positive growth [29]. The nitrogen supply mainly affects the size of potato tubers [30]. However, different scholars have obtained different results regarding whether the application of nitrogen fertilizer affects the number of tubers per unit area. For example, Sharma and Arora [31] indicated that the application of nitrogen fertilizer does not affect the number of tubers per unit area. On the other hand, Lynch and Rowberry [32] argued that nitrogen application affects the number of tubers per plant, average tuber weight, plant growth, and leaf area duration, thereby affecting yield. In this study, reducing the amount of applied nitrogen significantly decreased the potato tuber yield, average tuber weight, and commercial tuber rate. When the nitrogen application rate was reduced from 300 kg·ha−1 to 0 kg·ha−1, the average tuber weight and commercial tuber rate decreased by 54.90% and 59.88%, respectively, indicating that nitrogen application affects yield mainly through its effects on the average tuber weight and commercial tuber rate. Different scholars have found that different varieties have different optimal responses to nitrogen fertilizer application [11,33]. In this study, the results showed that under the same nitrogen application rate, the high nitrogen use efficiency variety Jizhang 12 had significantly higher yields, number of tubers per plant, average tuber weight, and commercial tuber rate than Youjia 70, with an increase in the number of tubers per plant by up to 79.59%.

4.2. Nitrogen Use Efficiency

Zebarth et al. found that NUE decreased when nitrogen input increased [34], but Ospina et al. found that the magnitude of the decline in NUE began to decrease with increasing nitrogen fertilizer application in a study of more potato varieties and higher N fertilizer gradients [35]. In this experiment, at a nitrogen application rate of 150 kg·ha−1, the NUE of Jizhang 12 was 15.87 g·g N−1, and 4.55 g·g N−1 higher than Youjia 70. When the nitrogen application rate increased from 150 kg·ha−1 to 300 kg·ha−1, the NUE of both varieties decreased, with Jizhang 12 and Youjia 70 at 9.97 g·g N−1 and 7.18 g·g N−1, respectively, and the former had a higher NUE by 2.79 g·g N−1. These results suggest that Jizhang 12 is more efficient at reducing nitrogen fertilizer application.
Moll et al. [24] defined nitrogen efficiency as the yield (or biomass) of plants formed per unit of nitrogen supply, and further divided it into two parts: nitrogen uptake efficiency (NUpE) and nitrogen utilization efficiency (NUtE). The results of studying nitrogen use efficiency and its components in potatoes showed that both nitrogen application rate and variety significantly affected nitrogen use efficiency and its components [36,37]. In this experiment, nitrogen use efficiency and nitrogen uptake efficiency increased as the nitrogen application rate decreased, with Jizhang 12 showing a greater increase than Youjia 70. There was no consistent pattern for nitrogen utilization efficiency between varieties and nitrogen application rates, with significant effects of nitrogen application rate observed in 2019, significant effects by variety observed in 2020, and no significant differences observed in 2021. This is because the nitrogen utilization efficiency of crops depends not only on the productivity of crops per unit of nitrogen but also on the amount of mature material transferred from source organs to sink organs [38]. By comparing the source-sink capacities of the two varieties (Table 4), it was found that Youjia 70 had a higher sink/source ratio. There are also unpublished data from this experiment indicating that Jizhang 12 has higher photosynthetic enzyme activity and higher photosynthetic nitrogen use efficiency (PNUE). This trade-off relationship between nitrogen utilization efficiency and photosynthetic efficiency makes the difference in nitrogen utilization efficiency between the two varieties insignificant.

4.3. Sources, Sink Capacity, and Activity

During the nutritional stage of plant growth, the primary nitrogen sink organs are the developing roots and leaves, whereas during the reproductive stage, the flowers, fruits, and seeds become the main N sink organs [39]. Shi et al. [21] quantified the source-sink relationship in rice during the grain-filling stage using a reverse β-sigmoid growth function, showing that the source activity decreased from its maximum value to zero during this stage. Unlike cereal crops, the harvesting organs of potatoes are not traditional reproductive organs, but rather modified stems. Potatoes begin to form tubers at the top of their creeping stems shortly after emergence, which enables them to produce a yield earlier and in a shorter time than cereals and other crops [23]. Zhang et al. [11] used a non-reverse β-sigmoid growth function to simulate the changes in the capacity and activity of potato sources and sinks. The results showed that sink activity increased from zero to its maximum value, then decreased to zero, and sink capacity increased sharply around 50 days after emergence and reached its maximum at approximately 90 days after emergence. The test also achieved a good fit for the growth of source and sink with R2 values greater than 0.92. Source and sink activities increased and then decreased over time, with source activity reaching its maximum earlier than sink activity, and sink activity decreasing more rapidly after reaching its maximum value. The nitrogen application rate and variety had significant effects on the time when the source and sink activities reached their maximum values. When 300 kg·ha−1 of nitrogen was applied, the date when the source activity of Jizhang 12 reached its maximum was approximately 39 days after emergence, and the date when sink activity reached its maximum was approximately 63 days after emergence. Reducing the nitrogen application rate and selecting cultivars with low nitrogen efficiency can advance the time the source and sink activities reach their maximum values.
The positive effect of N on plant growth has been well established, and the source capacity is significantly affected by the nitrogen application rate. As the nitrogen application rate decreases, the leaf area index and photosynthetic activity of leaves decrease, and the assimilates provided by leaves as sources are not sufficient to meet the demand of sinks [40]. Similar results were obtained in this study. When the nitrogen application rate was decreased from the conventional rate of 300 kg·ha−1, both the source and sink capacity and activity of potatoes decreased, but decreasing the nitrogen application rate increased the growth duration of both sources and sinks. The high nitrogen use efficiency cultivar Jizhang 12 had higher source and sink capacity and activity, as well as longer growth duration, and the growth duration of both source and sink increased more with decreasing nitrogen application rate. However, due to the impact of nitrogen application on emergence time, the date when the source and sink reach their maximum capacity appears to advance as the nitrogen application rate decreases.

4.4. Source-Sink Relationship

The accumulation of dry matter and its distribution among various organs is an important characteristic that determines crop productivity. Insufficient biomass allocation to source organs may lead to yield reduction, whereas higher input to source organs may result in higher total biomass, but at the expense of lower allocation to sink organs [41]. Li et al. showed that a more rational distribution of dry matter and nitrogen in the organ could increase the stability of rice yield under low N conditions [42]. The results of this experiment showed that reducing nitrogen fertilizer application advanced the growth center transition time in both potato varieties, shifting the center of growth from source organs to underground tubers earlier, leading to an increase in the potato sink/source ratio. High yields and high nitrogen use efficiency often require a higher proportion of sink organs, and the selection of new cultivars has greatly improved the harvest index (HI) of crops. However, the potential for improving HI through cultivar selection is currently very limited [43] and require the combination of cultivation measures and cultivar selection. The differences among the different varieties in this experiment showed that the center of growth transfer in high nitrogen use efficiency potato varieties occurred later, but the growth center transition time was significantly advanced with a decrease in nitrogen application, the source organs had longer growth times, and the tuber/source ratio was lower than that of low nitrogen use efficiency varieties. Therefore, it can be inferred that the source organs of high nitrogen use efficiency varieties are more vigorous, and have longer growth times, and under the same sink/source ratio, have higher production potential. As reducing nitrogen application directly affects the potato sink/source ratio, this provides a possible way to maintain yield while reducing nitrogen application. The center of growth transfer in high nitrogen use efficiency varieties is more conducive to increasing the sink/source ratio by reducing nitrogen application.

4.5. Growth Stage

Oliveira et al. have shown that differences in tuber yield are related to the phenological stage and the time of the first flowering on the crop main stem, which determines the final tuber yield distribution [44]. The β-Sigmoid function provides the maximum weight, growth termination time, and maximum growth rate time points, and all parameters have direct biological significance [11]. Therefore, it is suitable to determine changes in potato phenology by accurately estimating its growth time. In potato production, relevant environmental conditions greatly influence the crop’s phenology, which in turn affects the maturity of tubers, resulting in reduced yield and quality [45]. This study showed that reducing nitrogen fertilizer application advances the emergence date of potatoes, prolongs the seedling and starch accumulation stages, and reduces the duration of the tuber initiation stage, but has little effect on the duration of the tuber bulking stage. Under different nitrogen application rates, the nitrogen use efficient variety Jizhang 12 an had earlier emergence time, longer seedling and tuber initiation stages, and a greater increase in emergence time and extension of the seedling stage with decreasing nitrogen application. The nitrogen use inefficient variety Youjia 70 had a longer tuber bulking stage. The starch accumulation stage, determined as the final stage in this study, ended when the sink capacity reached its maximum, which occurred around 10 September for both varieties in different years, indicating that the two varieties have the same maturity period. Additionally, this study found through correlation analysis between potato phenology, yield, and its components that the length of the tuber initiation stage is positively correlated with the number of tubers per plant, which is consistent with the findings of Men and Liu [26]. The length of the starch accumulation stage is negatively correlated with yield, single tuber weight, and commercial tuber rate, which may be related to the time when the source organ for starch accumulation begins to age. Reducing nitrogen application leads to earlier aging of the source organ, which cannot provide a sufficient material basis for tuber growth.

5. Conclusions

Quantitative analysis of the source and sink of potato varieties with different nitrogen use efficiencies under different nitrogen application rates. Overall, increasing the growth duration of the source and sink, advances the transfer of the growth center, and increases the ratio of sink to source which makes it possible to ensure yield through source-sink coordination under nitrogen shortage. However, reducing the nitrogen application rate can lower the capacity and activity of the source and sink of potatoes and shorten the duration of the tuber initiation stage, leading to lower yields. Among potato varieties with different nitrogen use efficiency, nitrogen-efficient varieties have higher source and sink capacity and activity, longer growth duration, later transfer of the growth center, earlier emergence, and longer duration of the seedling and tuber initiation stages, which results in sufficiently vigorous above-ground growth and more photosynthetic products. In addition, the source and sink growth time, growth center transition time, and seedling stage time in nitrogen use efficient varieties increased and advanced to a greater extent with a decrease in nitrogen application rate, which is more conducive to increasing the sink/source ratio by reducing nitrogen application. However, this study has several limitations. The choice of the N source and the fertilizer application method made the nitrogen use efficiency level of this experiment low; the number of samples taken was too large, which made it difficult to extend it further. We believe that in future research and practical production, we can improve the N efficiency of the crop in two ways: first, we could optimize the N sources and application methods to improve the nitrogen use efficiency, such as the application of slow-release fertilizers and fertilizer techniques. Second, we could identify the key time points of potato growth and take samples at the key time points to reduce the number of samples taken, which will save time for subsequent research on the coordination mechanism of source and sink under other constraints.

Author Contributions

Conceptualization, methodology, investigation, data curation, project administration, formal analysis, writing—original draft preparation, K.L., M.M., T.Z.; resources, software, validation, H.Y., Y.C., T.S.; supervision, funding acquisition, writing—review and editing, M.M. All authors have read and agreed to the published version of the manuscript.

Funding

This research was funded by China Agriculture Research System-Potato, grant number CARS-09-P10. The APC was funded by the earmarked fund for CARS.

Data Availability Statement

The data that support the findings of this study are available from the corresponding author, [K.L.], upon reasonable request.

Acknowledgments

This work was supported by the earmarked fund for CARS. We gratefully acknowledgment the other students of Inner Mongolia Agricultural University during the experiment.

Conflicts of Interest

The authors declare no conflict of interest.

References

  1. Angus, J. Nitrogen supply and demand in Australian agriculture. Aust. J. Exp. Agric. 2001, 41, 277–288. [Google Scholar] [CrossRef]
  2. Eickhout, B.; Bouwman, A.V.; Van Zeijts, H. The role of nitrogen in world food production and environmental sustainability. Agric. Ecosyst. Environ. 2006, 116, 4–14. [Google Scholar] [CrossRef]
  3. FAOSTAT. FAO Statistical Database. 2023. Available online: https://www.fao.org/faostat/zh/#data/QCL (accessed on 29 March 2023).
  4. Ramos, C. Effect of agricultural practices on the nitrogen losses to the environment. In Fertilizers and Environment, Proceedings of the International Symposium “Fertilizers and Environment”; Salamanca, Spain, 26–29 September 1994, Springer: Berlin/Heidelberg, Germany, 1996; pp. 355–361. [Google Scholar]
  5. Stulen, I.; Perez-Soba, M.; De Kok, L.; Van der Eerden, L. Impact of gaseous nitrogen deposition on plant functioning. New Phytol. 1998, 139, 61–70. [Google Scholar] [CrossRef]
  6. Giles, J. Nitrogen study fertilizes fears of pollution. Nature 2005, 433, 791–792. [Google Scholar] [CrossRef] [Green Version]
  7. Rosolem, C.A.; Ritz, K.; Cantarella, H.; Galdos, M.V.; Hawkesford, M.J.; Whalley, W.R.; Mooney, S.J. Enhanced plant rooting and crop system management for improved N use efficiency. Adv. Agron. 2017, 146, 205–239. [Google Scholar]
  8. China Rural Statistical Yearbook. 2021. Available online: http://cnki.nbsti.net/CSYDMirror/trade/yearbook/Single/N2021120010?z=Z009 (accessed on 13 October 2021). (In Chinese).
  9. Compilation of National Agricultural Product Cost Income Data. Available online: https://www.yearbookchina.com/naviBooklist-YZQGN-0.html (accessed on 23 November 2021). (In Chinese).
  10. Wang, C.; Zang, H.; Liu, J.; Shi, X.; Li, S.; Chen, F.; Chu, Q. Optimum nitrogen rate to maintain sustainable potato production and improve nitrogen use efficiency at a regional scale in China. A meta-analysis. Agron. Sustain. Dev. 2020, 40, 1–14. [Google Scholar] [CrossRef]
  11. Zhang, H.; Jing, W.; Zhao, B.; Wang, W.; Xu, Y.; Zhang, W.; Gu, J.; Liu, L.; Wang, Z.; Yang, J. Alternative fertilizer and irrigation practices improve rice yield and resource use efficiency by regulating source-sink relationships. Field Crops Res. 2021, 265, 108124. [Google Scholar] [CrossRef]
  12. Li, Z.; Pinson, S.R.; Stansel, J.W.; Paterson, A.H. Genetic dissection of the source-sink relationship affecting fecundity and yield in rice (shape Oryza sativa L.). Mol. Breed. 1998, 4, 419–426. [Google Scholar] [CrossRef]
  13. Yasari, E.; Mozafari, S.; Shafiee, E.; Foroutan, A. Evaluation of sink-source relationship of soybean cultivars at different dates of sowing. Res. J. Agric. Biol. Sci 2009, 5, 786–793. [Google Scholar]
  14. Durand, M.; Mainson, D.; Porcheron, B.; Maurousset, L.; Lemoine, R.; Pourtau, N. Carbon source–sink relationship in Arabidopsis thaliana: The role of sucrose transporters. Planta 2018, 247, 587–611. [Google Scholar] [CrossRef] [Green Version]
  15. Wei, H.; Meng, T.; Li, X.; Dai, Q.; Zhang, H.; Yin, X. Sink-source relationship during rice grain filling is associated with grain nitrogen concentration. Field Crops Res. 2018, 215, 23–38. [Google Scholar] [CrossRef]
  16. Hassanzadehdelouei, M.; Ul-Allah, S.; Madani, A. Cotton fiber quality response to nitrogen depends on source-sink process, boll growth habit, and weather condition. Ind. Crops Prod. 2022, 186, 115279. [Google Scholar] [CrossRef]
  17. Liu, G.; Yang, Y.; Guo, X.; Liu, W.; Xie, R.; Ming, B.; Xue, J.; Wang, K.; Li, S.; Hou, P. Coordinating maize source and sink relationship to achieve yield potential of 22.5 Mg ha-1. Field Crops Res. 2022, 283, 108544. [Google Scholar] [CrossRef]
  18. Archontoulis, S.V.; Miguez, F.E. Nonlinear regression models and applications in agricultural research. Agron. J. 2015, 107, 786–798. [Google Scholar] [CrossRef] [Green Version]
  19. Yin, X.; Goudriaan, J.; Lantinga, E.A.; Vos, J.; Spiertz, H.J. A flexible sigmoid function of determinate growth. Ann. Bot. 2003, 91, 361–371. [Google Scholar] [CrossRef] [PubMed]
  20. Yin, X.; Guo, W.; Spiertz, J.H. A quantitative approach to characterize sink–source relationships during grain filling in contrasting wheat genotypes. Field Crops Res. 2009, 114, 119–126. [Google Scholar] [CrossRef]
  21. Shi, W.; Xiao, G.; Struik, P.C.; Jagadish, K.S.; Yin, X. Quantifying source-sink relationships of rice under high night-time temperature combined with two nitrogen levels. Field Crops Res. 2017, 202, 36–46. [Google Scholar] [CrossRef]
  22. Mao, L.; Zhang, L.; Sun, X.; van der Werf, W.; Evers, J.B.; Zhao, X.; Zhang, S.; Song, X.; Li, Z. Use of the beta growth function to quantitatively characterize the effects of plant density and a growth regulator on growth and biomass partitioning in cotton. Field Crops Res. 2018, 224, 28–36. [Google Scholar] [CrossRef]
  23. Muleta, H.D.; Aga, M.C. Role of nitrogen on potato production: A review. J. Plant Sci. 2019, 7, 36–42. [Google Scholar]
  24. Moll, R.; Kamprath, E.; Jackson, W. Analysis and interpretation of factors which contribute to efficiency of nitrogen utilization 1. Agron. J. 1982, 74, 562–564. [Google Scholar] [CrossRef]
  25. Meng, L. Potato Tuber Formation Mechanism and Its Response to Cultivars and Nitrogen Content. Ph.D. Thesis, Inner Mongolia Agricultural University, Hohhot, China, 2020. (In Chinese). [Google Scholar]
  26. Men, F.; Liu, M. Potato Cultivation Physiology; China Agriculture Press: Beijing, China, 1995. (In Chinese) [Google Scholar]
  27. Bowen, W.; Cabrera, H.; Barrera, V.H.; Baigorria, G. Simulating the response of potato to applied nitrogen. In Impact on a Changing World: Program Report 1997–1998; CIP: Lima, Perú, 1999; pp. 381–386. [Google Scholar]
  28. Möller, K.; Habermeyer, J.; Zinkernagel, V.; Reents, H.-J. Impact and interaction of nitrogen and Phytophthora infestans as yield-limiting and yield-reducing factors in organic potato (Solanum tuberosum L.) crops. Potato Res. 2006, 49, 281–301. [Google Scholar] [CrossRef]
  29. Jatav, A.; Kushwah, S.; Naruka, I. Performance of potato varieties for growth, yield, quality and economics under different levels of nitrogen. Adv. Res. 2017, 9, 1–9. [Google Scholar] [CrossRef] [Green Version]
  30. Blumenthal, J.M.; Baltensperger, D.D.; Cassman, K.G.; Mason, S.C.; Pavlista, A.D. Importance and effect of nitrogen on crop quality and health. In Nitrogen in the Environment; Elsevier: Amsterdam, The Netherlands, 2008; pp. 51–70. [Google Scholar]
  31. Sharma, U.; Arora, B. Effect of nitrogen, phosphorus and potassium application on yield of potato tubers (Solatium tuberosum L.). J. Agric. Sci. 1987, 108, 321–329. [Google Scholar] [CrossRef]
  32. Lynch, D.; Rowberry, R. Population density studies with Russet Burbank II. The effect of fertilization and plant density on growth, development and yield. Am. Potato J. 1977, 54, 57–71. [Google Scholar] [CrossRef]
  33. Kleinkopf, G.; Westermann, D.; Dwelle, R. Dry Matter Production and Nitrogen Utilization by Six Potato Cultivars 1. Agron. J. 1981, 73, 799–802. [Google Scholar] [CrossRef]
  34. Zebarth, B.; Tai, G.; Tarn, R.D.; De Jong, H.; Milburn, P. Nitrogen use efficiency characteristics of commercial potato cultivars. Can. J. Plant Sci. 2004, 84, 589–598. [Google Scholar] [CrossRef]
  35. Ospina, C.; Lammerts van Bueren, E.; Allefs, J.; Engel, B.V.; Van der Putten, P.; Van der Linden, C.; Struik, P. Diversity of crop development traits and nitrogen use efficiency among potato cultivars grown under contrasting nitrogen regimes. Euphytica 2014, 199, 13–29. [Google Scholar] [CrossRef]
  36. Vos, J. Nitrogen responses and nitrogen management in potato. Potato Res. 2009, 52, 305–317. [Google Scholar] [CrossRef]
  37. Cohan, J.; Hannon, C.; Houilliez, B.; Gravoueille, J.; Geille, A.; Lampaert, E.; Laurent, F. Effects of potato cultivar on the components of nitrogen use efficiency. Potato Res. 2018, 61, 231–246. [Google Scholar] [CrossRef]
  38. Mueller, S.M.; Messina, C.D.; Vyn, T.J. Simultaneous gains in grain yield and nitrogen efficiency over 70 years of maize genetic improvement. Sci. Rep. 2019, 9, 9095. [Google Scholar] [CrossRef] [Green Version]
  39. Masclaux-Daubresse, C.; Chardon, F. Exploring nitrogen remobilization for seed filling using natural variation in Arabidopsis thaliana. J. Exp. Bot. 2011, 62, 2131–2142. [Google Scholar] [CrossRef] [Green Version]
  40. Li, W.; Xiong, B.; Wang, S.; Deng, X.; Yin, L.; Li, H. Regulation effects of water and nitrogen on the source-sink relationship in potato during the tuber bulking stage. PLoS ONE 2016, 11, e0146877. [Google Scholar] [CrossRef] [PubMed] [Green Version]
  41. Van Heemst, H. The distribution of dry matter during growth of a potato crop. Potato Res. 1986, 29, 55–66. [Google Scholar] [CrossRef]
  42. Li, X.; Zhou, Y.; Shuai, P.; Wang, X.; Peng, S.; Wang, F. Source–Sink Balance Optimization Depends on Soil Nitrogen Condition So as to Increase Rice Yield and N Use Efficiency. Agronomy 2023, 13, 907. [Google Scholar] [CrossRef]
  43. Ciampitti, I.A.; Vyn, T.J. Physiological perspectives of changes over time in maize yield dependency on nitrogen uptake and associated nitrogen efficiencies: A review. Field Crops Res. 2012, 133, 48–67. [Google Scholar] [CrossRef]
  44. Oliveira, J.S.; Brown, H.E.; Moot, D.J. Assessing potato canopy growth and development at the individual leaf level to improve the understanding of the plant source–sink relations. N. Z. J. Crop Hortic. Sci. 2021, 49, 325–346. [Google Scholar] [CrossRef]
  45. Lombardo, S.; Pandino, G.; Mauromicale, G. Optimizing nitrogen fertilization to improve qualitative performances and physiological and yield responses of potato (Solanum tuberosum L.). Agronomy 2020, 10, 352. [Google Scholar] [CrossRef] [Green Version]
Figure 1. Daily air temperature and precipitation during the potato growing seasons of 2019–2021. Tmin: minimum air temperature; Tavg: average air temperature; Tmax: maximum air temperature.
Agronomy 13 01083 g001
Figure 2. Growth stages determination method. (a) The magnification of box a, indicating the beginning of the tuber initiation stage; (b) The magnification of box b, indicating the beginning of the tuber bulking stage and the Starch accumulation stage, respectively.
Agronomy 13 01083 g002
Figure 4. Dynamic changes in source and sink activity of two potato varieties at different nitrogen application rates. The year and the source or sink, are marked in the top left of the figure. The treatments represented by the different line are shown in the legend.
Agronomy 13 01083 g004
Figure 5. Correlation of growth stage length of days to yield and its components. The figures show the correlations between seedling stage, tuber formation stage, tuber expansion stage and starch accumulation stage and yield (AD), weight per potato (EH) and number of potatoes (IL). The error bar is the standard error; the line is the result of a linear fitting; R2 is the coefficient of determination; “ns” means no significant, “*” means significant difference at 0.05 level, and “**” means significant difference at 0.01 level.
Agronomy 13 01083 g005
Table 1. Basic nutrients of 0–20 cm soil in 2019–2020.
YearOrganic Matter
(g·kg−1)
Alkali-Hydrolyzable N
(mg·kg−1)
Available P
(mg·kg−1)
Available K
(mg·kg−1)
pH
20199.7643.7516.13123.468.00
20209.4047.129.2050.699.01
202115.6853.0221.0862.908.08
Table 2. Yield and its components of two potato varieties at different nitrogen application rates.
YearsN Rate
(kg·ha−1)
VarietiesYield
(t·ha−1)
Tuber Number Per PlantWeight Per Tuber (g)Commercial Tuber Rate (%)
20190J24.19 c4.20 a94.92 c35.79 c
Y10.91 d2.23 c79.36 c9.54 d
150J42.56 b4.37 a162.66 b70.01 ab
Y25.81 c3.11 b138.17 b59.89 b
300J54.53 a4.35 a211.75 a83.10 a
Y30.35 c3.07 b167.15 b71.86 ab
20200J14.59 b3.65 a66.81 b14.75 c
Y6.46 d2.03 b54.00 c1.12 d
150J22.41 a3.91 a96.30 a39.57 b
Y8.91 c1.96 b76.08 b13.73 c
300J24.57 a3.93 a105.63 a51.78 a
Y8.41 cd1.90 b74.10 b18.22 c
20210J17.95 cd3.78 b79.12 c29.42 c
Y10.23 d2.22 c76.41 c21.08 c
150J38.67 b4.58 a140.27 b58.15 b
Y18.50 c2.56 c120.77 b53.28 b
300J49.42 a4.71 a174.15 a79.43 a
Y23.34 c2.63 c150.48 b61.83 ab
ANOVA
2019C**********
R**********
C × R**nsnsns
2020C************
R***ns*****
C × R**nsnsns
2021C******nsns
R**ns******
C × R**nsnsns
Different letters indicate multiple comparisons of an indicator between treatments in individual years, while having the same letter indicates a non-significant difference. Multiple comparisons of means were performed at the 0.05 level. For ANOVA, it is a separate year of comparison, where C is the varieties and R is the N rate, “*” means significant difference at 0.05 level, “**” means significant difference at 0.01 level, and “***” means significant difference at 0.001 level.
Table 3. NUE, NUpE and NUtE of two potato varieties at different nitrogen application rates.
YearsN Rate (kg·ha−1)VarietiesNUE (g·g N−1)NUpE (g N·g N−1)NUtE (g·g N−1)
2019150J16.20 a0.055 a298.50 a
Y11.15 b0.040 b275.03 ab
300J10.10 b0.041 b245.72 ab
Y6.57 c0.024 c268.86 b
2020150J9.96 a0.030 a331.09 a
Y3.89 b0.015 c261.85 ab
300J5.30 b0.022 b247.09 b
Y2.27 c0.010 c223.08 ab
2021150J15.54 a0.029 a534.74 a
Y11.48 ab0.023 ab495.73 b
300J9.84 b0.022 ab452.66 b
Y7.79 b0.018 b439.07 b
ANOVA
2019C****ns
R******
C × Rnsnsns
2020C*******
R***ns
C × R*nsns
2021C**ns
R*nsns
C × Rnsnsns
Different letters indicate multiple comparisons of an indicator between treatments in individual years, while having the same letter indicates a non-significant difference. Multiple comparisons of means were performed at the 0.05 level. For ANOVA, it is a separate year of comparison, where C is the varieties and R is the N rate, “*” means significant difference at 0.05 level, “**” means significant difference at 0.01 level, and “***” means significant difference at 0.001 level.
Table 6. Emergence dates of two potato varieties at different nitrogen application rates.
N Rate
(kg·ha−1)
VarietiesDate of Emergence (M/d)
201920202021
0J6/6 (36)6/14 (36)6/12 (37)
Y6/11 (41)6/20 (42)6/16 (41)
150J6/10 (40)6/21 (43)6/15 (40)
Y6/16 (46)6/23 (45)6/20 (45)
300J6/19 (49)6/28 (50)6/22 (47)
Y6/21 (51)6/30 (52)6/25 (50)
The number in parentheses is the number of days between the emergence date and the sowing date (number of days after sowing).
Table 7. Start and end time and duration length of growth stage of two potato varieties at different nitrogen application rates.
YearN Rate
(kg·ha−1)
VarietiesSeeding StageTuber Initiation StageTuber Bulking StageStarch Accumulation Stage
StartStopLDStartStopLDStartStopLDStartStopLD
20190J0 (6/6)13 (6/19)1313 (6/19)41 (7/17)2841 (7/17)53 (7/29)1253 (7/29)97 (9/11)44
Y0 (6/11)5 (6/16)55 (6/16)27 (7/8)2227 (7/8)43 (7/24)1643 (7/24)87 (9/6)44
150J0 (6/10)13 (6/23)1313 (6/23)49 (7/29)3649 (7/29)58 (8/7)958 (8/7)96 (9/14)38
Y0 (6/16)5 (6/21)55 (6/21)31 (7/17)2631 (7/17)46 (8/1)1546 (8/1)88 (9/12)42
300J0 (6/19)9 (6/28)99 (6/28)47 (8/5)3847 (8/5)58 (8/16)1158 (8/16)88 (9/15)30
Y0 (6/21)3 (6/24)33 (6/24)26 (7/17)2326 (7/17)40 (7/31)1440 (7/31)83 (9/12)43
20200J0 (6/14)16 (6/29)1516 (6/29)44 (7/28)2944 (7/28)54 (8/7)1054 (8/7)90 (9/12)36
Y0 (6/20)6 (6/26)66 (6/26)35 (7/25)2935 (7/25)51 (8/10)1651 (8/10)82 (9/10)31
150J0 (6/21)14 (7/5)1414 (7/5)50 (8/10)3650 (8/10)58 (8/18)858 (8/18)84 (9/13)26
Y0 (6/23)5 (6/28)55 (6/28)37 (7/30)3237 (7/30)54 (8/16)1754 (8/16)81 (9/12)27
300J0 (6/28)13 (7/11)1313 (7/11)48 (8/15)3548 (8/15)56 (8/23)856 (8/23)77 (9/13)21
Y0 (6/30)7 (7/7)77 (7/7)36 (8/5)2936 (8/5)50 (8/19)1450 (8/19)71 (9/9)21
20210J0 (6/12)11 (6/23)1111 (6/23)38 (7/20)2738 (7/20)47 (7/29)947 (7/29)91 (9/11)44
Y0 (6/16)9 (6/25)99 (6/25)34 (7/20)2534 (7/20)42 (7/28)842 (7/28)83 (9/7)41
150J0 (6/15)9 (6/24)99 (6/24)36 (7/21)2736 (7/21)44 (7/29)844 (7/29)88 (9/11)44
Y0 (6/20)6 (6/26)66 (6/26)32 (7/22)2632 (7/22)42 (8/1)1042 (8/1)80 (9/8)38
300J0 (6/22)8 (6/30)88 (6/30)40 (8/1)3240 (8/1)49 (8/10)949 (8/10)82 (9/12)33
Y0 (6/25)6 (7/1)66 (7/1)33 (7/28)2733 (7/28)44 (8/8)1144 (8/8)76 (9/9)32
Start and Stop represent the start and end time of the growth stage, respectively. The value before parentheses indicates the number of days after emergence (d), and the value in parentheses indicates the date (M/d) corresponding to the number of days after emergence. LD indicates the duration length of the growth stage (d).
Disclaimer/Publisher’s Note: The statements, opinions and data contained in all publications are solely those of the individual author(s) and contributor(s) and not of MDPI and/or the editor(s). MDPI and/or the editor(s) disclaim responsibility for any injury to people or property resulting from any ideas, methods, instructions or products referred to in the content.

