
Will Climate Change Affect the Disease Progression of Septoria Tritici Blotch in Northern Europe?
by
 ,
,
Ketel Christian Prahl
1,* ,
,
Holger Klink
1,
Mario Hasler
2,
Joseph-Alexander Verreet
1 and
Tim Birr
1 1
Department of Plant Diseases and Crop Protection, Institute of Phytopathology, Faculty of Agricultural and Nutritional Sciences, Christian-Albrechts-University of Kiel, Hermann-Rodewald-Straße 9, 24118 Kiel, Germany
2
Lehrfach Variationsstatistik, Faculty of Agricultural and Nutritional Sciences, Christian-Albrechts-University of Kiel, Hermann-Rodewald-Straße 9, 24118 Kiel, Germany
*
Author to whom correspondence should be addressed.
Agronomy 2023, 13(4), 1005; https://doi.org/10.3390/agronomy13041005
Submission received: 14 March 2023
/
Revised: 22 March 2023
/
Accepted: 27 March 2023
/
Published: 29 March 2023
(This article belongs to the Special Issue Pests, Pesticides and Food Safety in a Changing Climate)
Abstract
:Septoria tritici blotch (STB), caused by the fungus Zymoseptoria tritici Desm., is the most important disease affecting wheat in Northern Europe. There is a strong correlation between STB and weather variables; therefore, research on climate change and epidemiology is essential. In a long-term survey across 25 years, we evaluated the epidemiological development of STB at a representative location under maritime climatic conditions. The surveys conducted between 1996 and 2021 showed an increase in disease severity of STB with respect to time. At the survey location, the plants were also evaluated for other diseases, but other foliar diseases were only observed with negligible severities. However, a continuous increase in the severity of STB was observed throughout the survey. During the survey period, there was no significant relationship between disease severity and single weather parameters (e.g., temperature and precipitation). However, seasonal changes in the progression of conducive STB conditions within the season were observed during the survey. Therefore, STB infections occurred at increased temperatures due to infections later during the growth season. In general, the distribution of conducive weather conditions, which supports an infection, determines the epidemiological behaviour of STB during the growing season. Due to these enhanced STB epidemics, a decline in wheat production has been observed, especially in agronomic practices of maritime climates. This is particularly the case if temperature and precipitation during the growing season are affected by climate change.
1. Introduction
Septoria tritici blotch (STB), caused by Zymoseptoria tritici Desm., is one of the most serious and yield-limiting foliar diseases in global wheat production. In Europe, STB is responsible for annual yield losses of 5–10% under current agricultural practices, representing an annual economic loss of approximately EUR 1500 million in Germany alone [1]. STB is particularly prevalent in regions with temperate, humid climates, such as the EPPO “maritime zone” [2], which includes Northern Europe. As described by Klink et al. [3], in addition to agronomic practices (e.g., crop rotation, cultivar selection, or tillage systems), conducive weather conditions, such as continuous precipitation, moderate temperatures, and high humidity, determine the incidence, course, and severity of STB epidemics. In particular, sufficient precipitation with prolonged leaf wetness is essential for a successful infection. Therefore, the precipitation transports the inoculum to higher leaf layers, and the leaf wetness periods ensure infections by the pathogen [4,5].
According to Miedaner and Juroszek [6], climate change, as described in the International Council of Climate Change (IPCC) Special Report (SR) [7], is threatening wheat productivity in north-western Europe due to warmer and drier conditions during the main growing season. The recently published Sixth Assessment Report (AR6) of the IPCC [8] shows that a 1.5 °C increase in global warming is possible by 2030. As a result, more frequent and more intense rainfall events are expected by the IPCC. In general, a change in the global climate is a dynamic process with large regional variations [9]. According to the IPCC [9], the effects of climate change involve an increase in mean temperature of 0.4 to 0.5 °C and an increase in daily precipitation of 0.1 L/m2 per decade in Northern Europe, which includes Northern Germany.
Since STB is highly influenced by weather conditions [10,11], climate change is expected to have an impact on disease development and severity. Analyses of epidemics of a specific pathogen are usually carried out in greenhouses under artificial conditions with controlled abiotic and biotic factors since it is not usually possible to quantify the influence of biotic factors, especially associated pathogens, on the disease progression of pathogens on plants [12]. In this study, unique circumstances were observed. For instance, the only disease observed was STB during the surveyed period. This allowed us to analyse the disease progression of STB in the field without the biotic influences of the usually associated diseases glume blotch (caused by Parastagonospora nodorum Berk.), tan-spot (caused by Pyrenophora tritici-repentis Died.), powdery mildew (caused by Blumeria graminis f. sp. tritici), stripe rust (caused by Puccinia striiformis f. sp. tritici), or leaf rust (caused by Puccinia triticina), as described by Verreet et al. [4].
The present study investigated (i) the development of STB in wheat at a representative location from 1996 to 2021, and (ii) the possible influence of climate change on the disease progression of STB in Northern Germany. Over this period of 25 years, the progression of STB was continuously evaluated using samples from an identical reference location and a uniform cultivar. Due to the influence of the weather variables on STB, the parameters temperature, precipitation, and leaf wetness were assessed directly from the reference location and associated with climate change.
2. Materials and Methods
2.1. Surveyed Area and Survey Strategy
Since 1996, evaluations of major foliar diseases have been conducted in Germany’s northernmost federal state, Schleswig-Holstein (54°38′01′′ N; 08°52′08′′ E), proximal to the northern sea. The location is characterized by very fertile clay soils and high prevalence of wheat in crop rotations and is, therefore, one of the main wheat-producing areas in Northern Germany [13]. Due to its proximity to the North Sea, maritime weather conditions with an average temperature of 9.2 °C, an annual precipitation of 846 L/m2, and an average humidity of 81% prevail at the trial location [14]. As described by Klink et al. [3], the foliar diseases powdery mildew, stripe rust, leaf rust, and STB are the most prevalent foliar diseases in the surrounding region of the trial location. As a result of the continuous western winds, the disease powdery mildew was not observed at the trial location [15]. Additionally, rust diseases were recorded sporadically at the trial location, and the only disease that was frequently recorded at the trial location was STB [3]. As a result, based on the climate conditions at the trial site, sufficient disease pressure could be expected and was suitable for use in the evaluation of STB and weather variables in the field. Within the survey period, either winter wheat or oilseed rape growth preceded growth of the evaluated winter wheat. The type of crop grown preceding the growth of the winter wheat determined the type of soil cultivation: reduced tillage when oilseed rape preceded or ploughing when wheat preceded. Throughout the survey period from 1996 to 2021, the cultivar “Ritmo” was analysed for foliar diseases at weekly intervals from growth stages (GS) 30 (beginning of stem elongation) to 77 (late milk). The susceptibility of wheat cultivars to the major foliar wheat diseases is listed in the descriptive cultivar list by the Bundessortenamt, an independent senior federal authority under the supervision of the Federal Ministry of Food and Agriculture. The used cultivar “Ritmo” is classified as moderately to highly susceptible against STB. Additionally, it is classified as moderately susceptible to stripe rust, powdery mildew, tan spot, and glume blotch, and highly to very highly susceptible to leaf rust [16]. Klink et al. [3] suggested that glume blotch and tan spot do not occur under good agronomic practices. Accordingly, only STB occurred at the studied location with the used cultivar combination. As a consequence, this combination is representative in the evaluation of STB’s disease progression. In order to evaluate the development of STB at this location, four plots not treated with fungicides were established every year. In the absence of fungicides, the untreated plots showed the epidemiological disease behaviour. Every year, plots were planted and integrated into a 10 m2 (2 × 5 m) farm field, whereby crop management, as well as the application of herbicides, insecticides, and growth regulators, was based on common agricultural practices and was carried out comprehensively in cooperation with the Chamber of Agriculture of Schleswig-Holstein. To determine the weather conditions at this trial site, meteorological stations (Thies Clima, Göttingen, Germany) were installed at every trial location to measure the precipitation (L/m2; measuring accuracy ± 3%), air temperature at 30 cm height (°C; measuring accuracy ± 0.1 K), and leaf wetness (%, measuring accuracy ± 3%) [5]. The assessed data were recorded in 15 s intervals and were given automatically as hourly values.
2.2. Sampling and Disease Assessment
Disease analyses was conducted from GS 30 to GS77 at weekly intervals. The samples contained at least ten main tillers and were taken arbitrarily from three separate plots. To assess disease incidence (DI) and disease severity (DS), the analyses followed an exact sequence corresponding to that in Verreet et al. [4]. Primarily, the growth stage was determined according to the method in Zadoks et al. [17], and simultaneously, every leaf was rated based on their disease incidence and percentage of necrotic leaf area and affected leaf area due to these biotrophic foliar diseases on their main stem. For the preceding steps, the leaves were then soaked in water to simulate leaf wetness, which led to expanded pycnidia and ensured the highest quality ratings. To assess the quantitative parameter disease severity, the pycnidia of STB were counted at between eightfold and fiftyfold magnification for every single leaf. The results of the assessment provided the DI and DS from three plots, with ten replicates per plot, resulting in accurate DI and DS for each individual leaf layer. Additionally, notes on rating date and plot number were recorded. The assessed epidemiological data were averaged for the leaf layers F − 0 to F − 6 separately after every weekly rating for each plot and stored in an SQL database.
2.3. Data Analyses
For the data analyses and an annual comparison of the disease severity, the area under the disease progress curve (AF−x) of each leaf layer in every year was considered. This was calculated using the parameters necrotization and disease severity of STB from GS 30 to 77. For an estimation of the AF−x according to Madden et al., 2007 [18], the trapezoidal method was used by discretizing the time variable and by determining the average disease intensity between two neighbouring time points (Formula (1)).
AF−x = AUDPC of leaf layer F minus x; y = disease severity at rating date i, t = rating date;
k = number of neighbouring time intervals
k = number of neighbouring time intervals
For a comparison of the disease severities, a yield-directed comparison was also performed, adjusting the AF−x to the weighted AUDPC (WAUDPC) by weighting the disease severities separately for each leaf layer with the factors xF−0, xF−1, xF−2, xF−3, xF−4, xF−5, and xF−6, (e.g., xF−0 = 70% for F − 0, xF−0 = 20% for F − 1, xF−0 = 10% for F − 2, and xF−3 to xF−6 = 0% (nominator Formula (2)) [19,20]). The results of the WAUDPC calculation were challenging to classify. However, dividing the WAUDPC by the number of time points (k + 1 in Formula (2)) yields the relative WAUDPC (RWAUDPC), showing the disease severities in realistic quantities.
AF−x = AUDPC of leaf layer F minus x, t = rating date; k = number of neighbouring time intervals; X = percentage of considered leaf layer
2.4. Statistical Analyses
The statistical software R, Version 4.1.3 (R Foundation for Statistical Computing, Vienna, Austria; 2022) [21], was used to evaluate the data. The data evaluation was based on linear regression models and corresponding analyses. The residuals of the models were all assumed to be normally distributed and to be homoscedastic. These assumptions are based on a graphical residual analysis.
3. Results
3.1. Occurrence of Foliar Diseases from 1996 to 2021
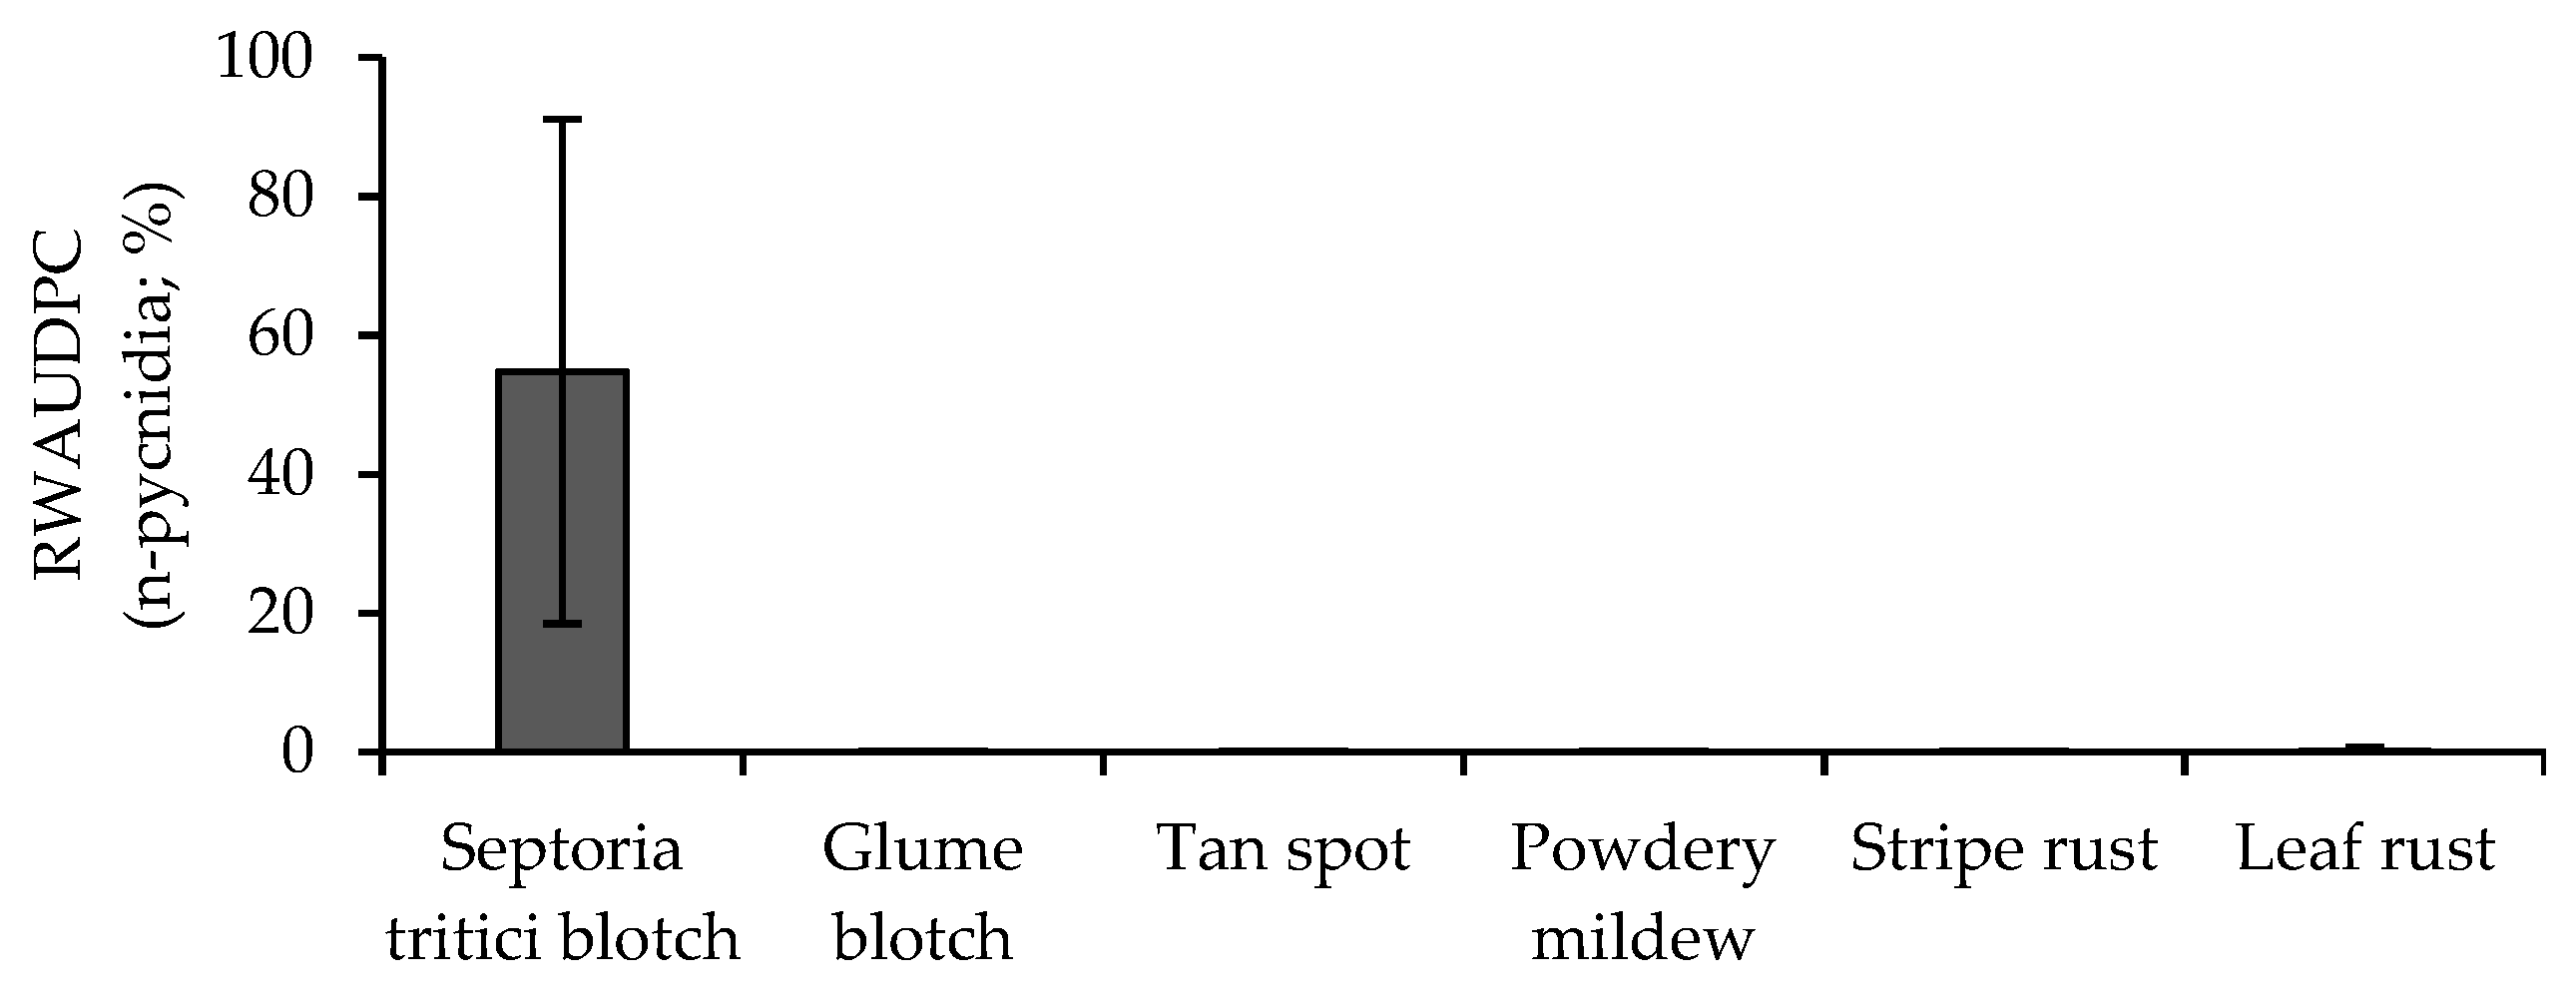
Disease severities were assessed for the major foliar diseases, namely Septoria tritici blotch, glume blotch, tan spot, powdery mildew, stripe rust, and leaf rust, from 1996 to 2021. As shown in Figure 1, except for STB, the severities of the foliar diseases averaged over every leaf layer remained at a minor level (RWAUDPC < 1). Only STB was rated as having a significant RWAUDPC(xF−0–x−6=14%), with a total average of 55 pycnidia. In 1996, the lowest disease severities recorded had 8 pycnidia, and in 2019, the highest disease severities were rated as having 134 pycnidia. It is noticeable that, in the first decade of the survey, the disease severities of STB were above the total average for only two years. In contrast, in the last decade of the survey, the disease severities were only two years below the total average (Table S1).
3.2. Prevailing Weather Conditions and Occurrence of Septoria tritici blotch
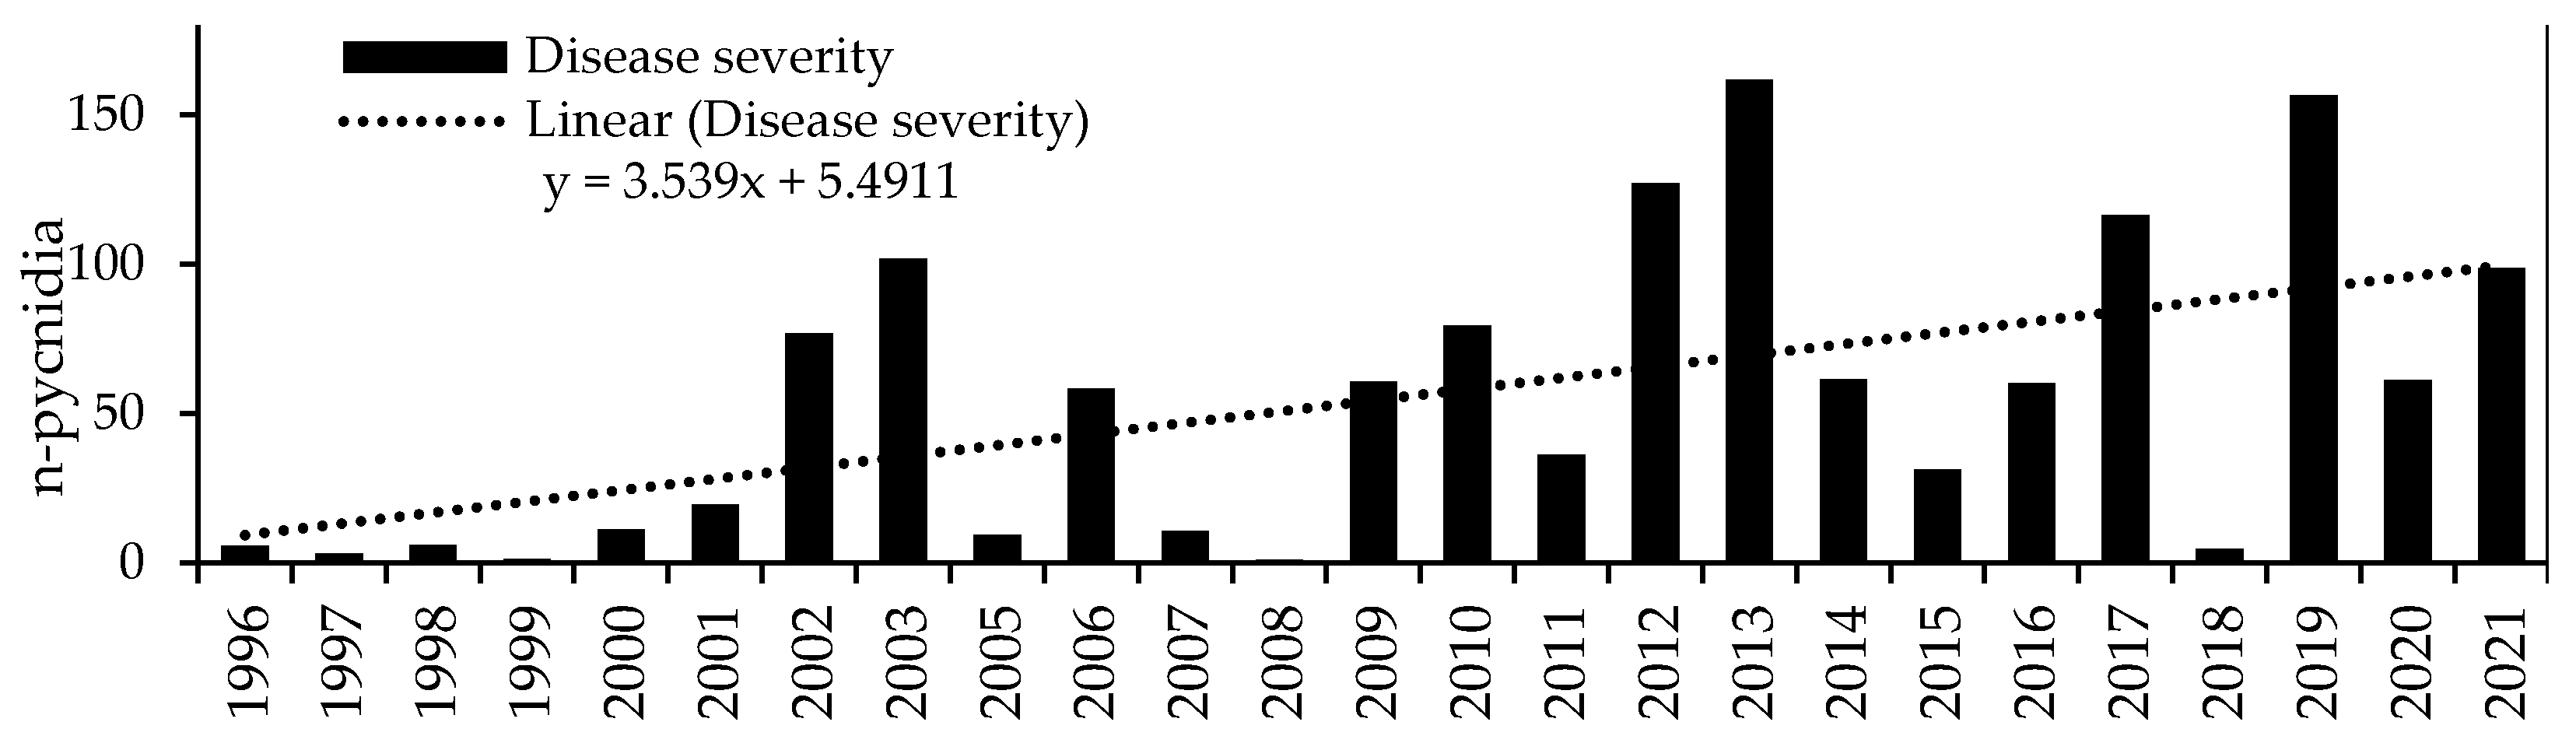
In Figure 2, the disease severity of STB is shown as RWAUDPC(xF−0–x-F−2=33%; xF−3–x-F−6=0%) of the three uppermost leaf layers; therefore, the disease severity varied, at around an average of 54 pycnidia, from 1 pycnidia in 1999 and 2008 to 162 pycnidia in 2013. Noticeably, the disease severity was consistently below the total average in the first half of the survey period and above the average in the second half of the survey period. Thus, a significant (p = 0.005) annual increase of 3.5 pycnidia from 1996 to 2021, with a R2 of 0.30, was observed. Concomitant to the disease severity of STB, the RWAUDPC from the necrotized leaf area increased significantly (p < 0.05) by 0.28% per year within the survey period from 1996 to 2021.
Considering the uniformity of agronomic practices during the survey period, a superordinate factor must determine the disease severities of STB in the field. Due to the superior dependency of STB on prevailing weather conditions in the first step, the changes in temperature and precipitation during the growth season (GS 30 to 77) were analysed for every year in the survey. Additionally, the individual influences of temperature and precipitation on the disease severity were evaluated.
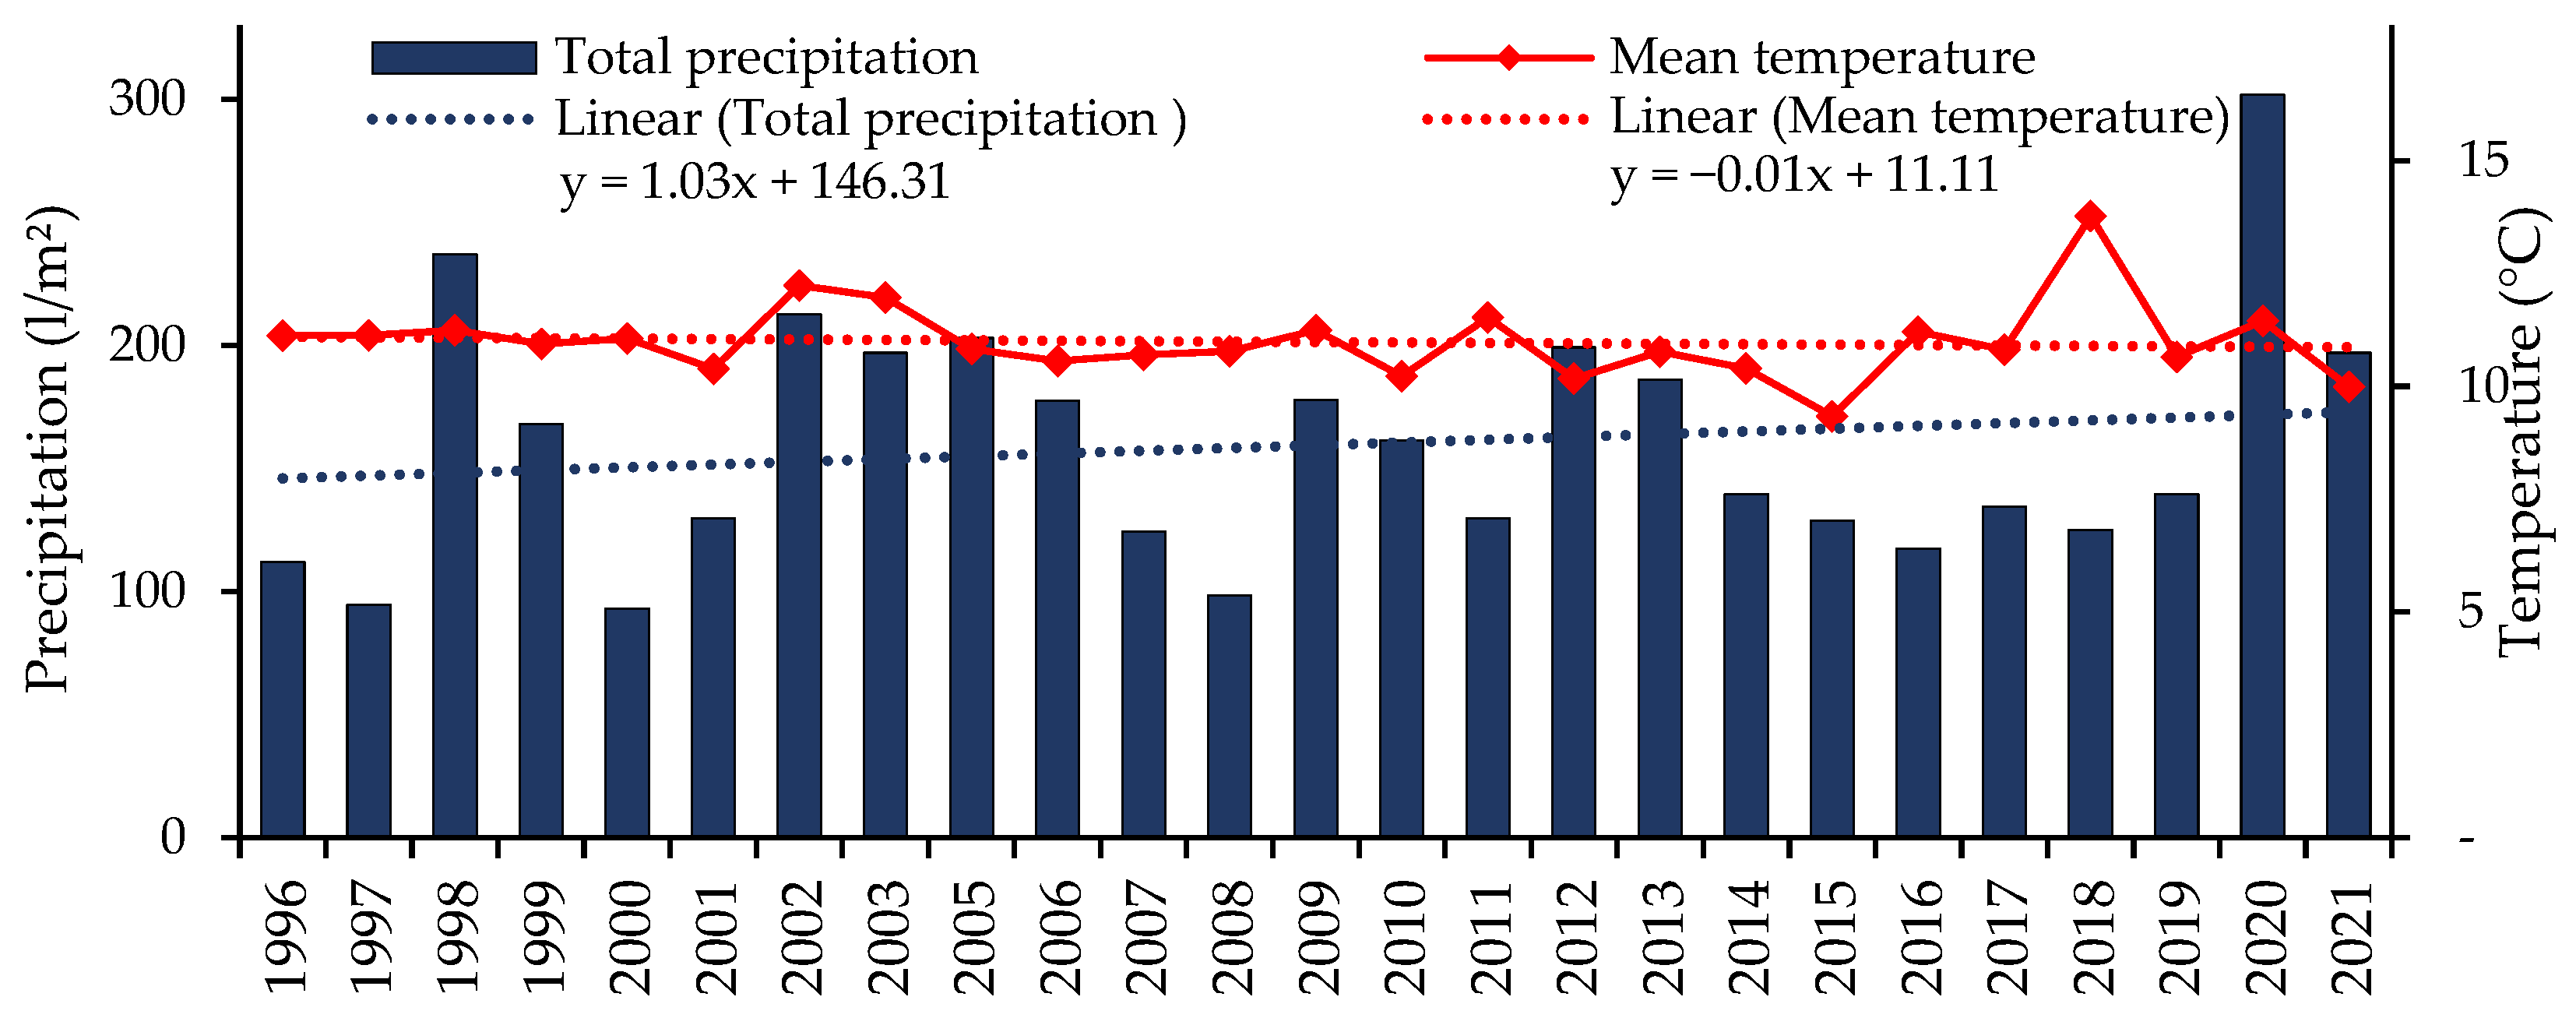
Figure 3 shows the prevailing weather conditions during the growth season from 1995 to 2021 in combination with the disease severities of STB. The mean annual temperature varied from 9.3 °C in 2015 to 13.8 in 2018 and averaged 11.0 °C, with a standard deviation of 0.9 °C. Furthermore, the regression analyses of the temperature development did not show a linear trend. Nevertheless, an increase in the variation in the annual temperature in the growth season from the linear trend was observed in the last decade of the survey. The evaluation of the relationship between the severity of STB and temperature showed an R2 of 0.04, a minor correlation. The annual precipitation varied from 93 L/m2 in 2000 to 302 L/m2, with a standard deviation of 80 L/m2 around a total average of 159 L/m2 during the observation period (GS 32 to 77). In contrast to temperature, a slight, non-significant (p = 0.47) linear trend showing an annual increase of 1 L/m2 was observed at the trial site. However, the linear regressions of precipitation and disease severity of STB showed increases over the survey period, but the monocausal relationship between these two factors remained at a minor level (R2 = 0.10).
Hence, the increase in disease severity cannot be adequately explained only by either precipitation or temperature. According to Verreet et al. [4], the leaf wetness, conceived by Weihofen as a combination of several weather factors, is a major factor affecting the disease severity of STB. The correlation between total hours of leaf wetness during the growth season and the disease severity of STB was also at a minor level (R2 = 0.08). As STB disease progression correlates with a single factor such as temperature, precipitation, or total hours of leaf wetness only on a minor level, the detailed epidemiological development of every single leaf layer of STB within a growth season was evaluated.
3.3. Case Study of Septoria Tritici Blotch
Since STB disease progression correlated with a single factor such as temperature, precipitation, or total hours of leaf wetness only at a minor level, the detailed epidemiological development of every single leaf layer of STB within a growth season was evaluated (Figure 4).
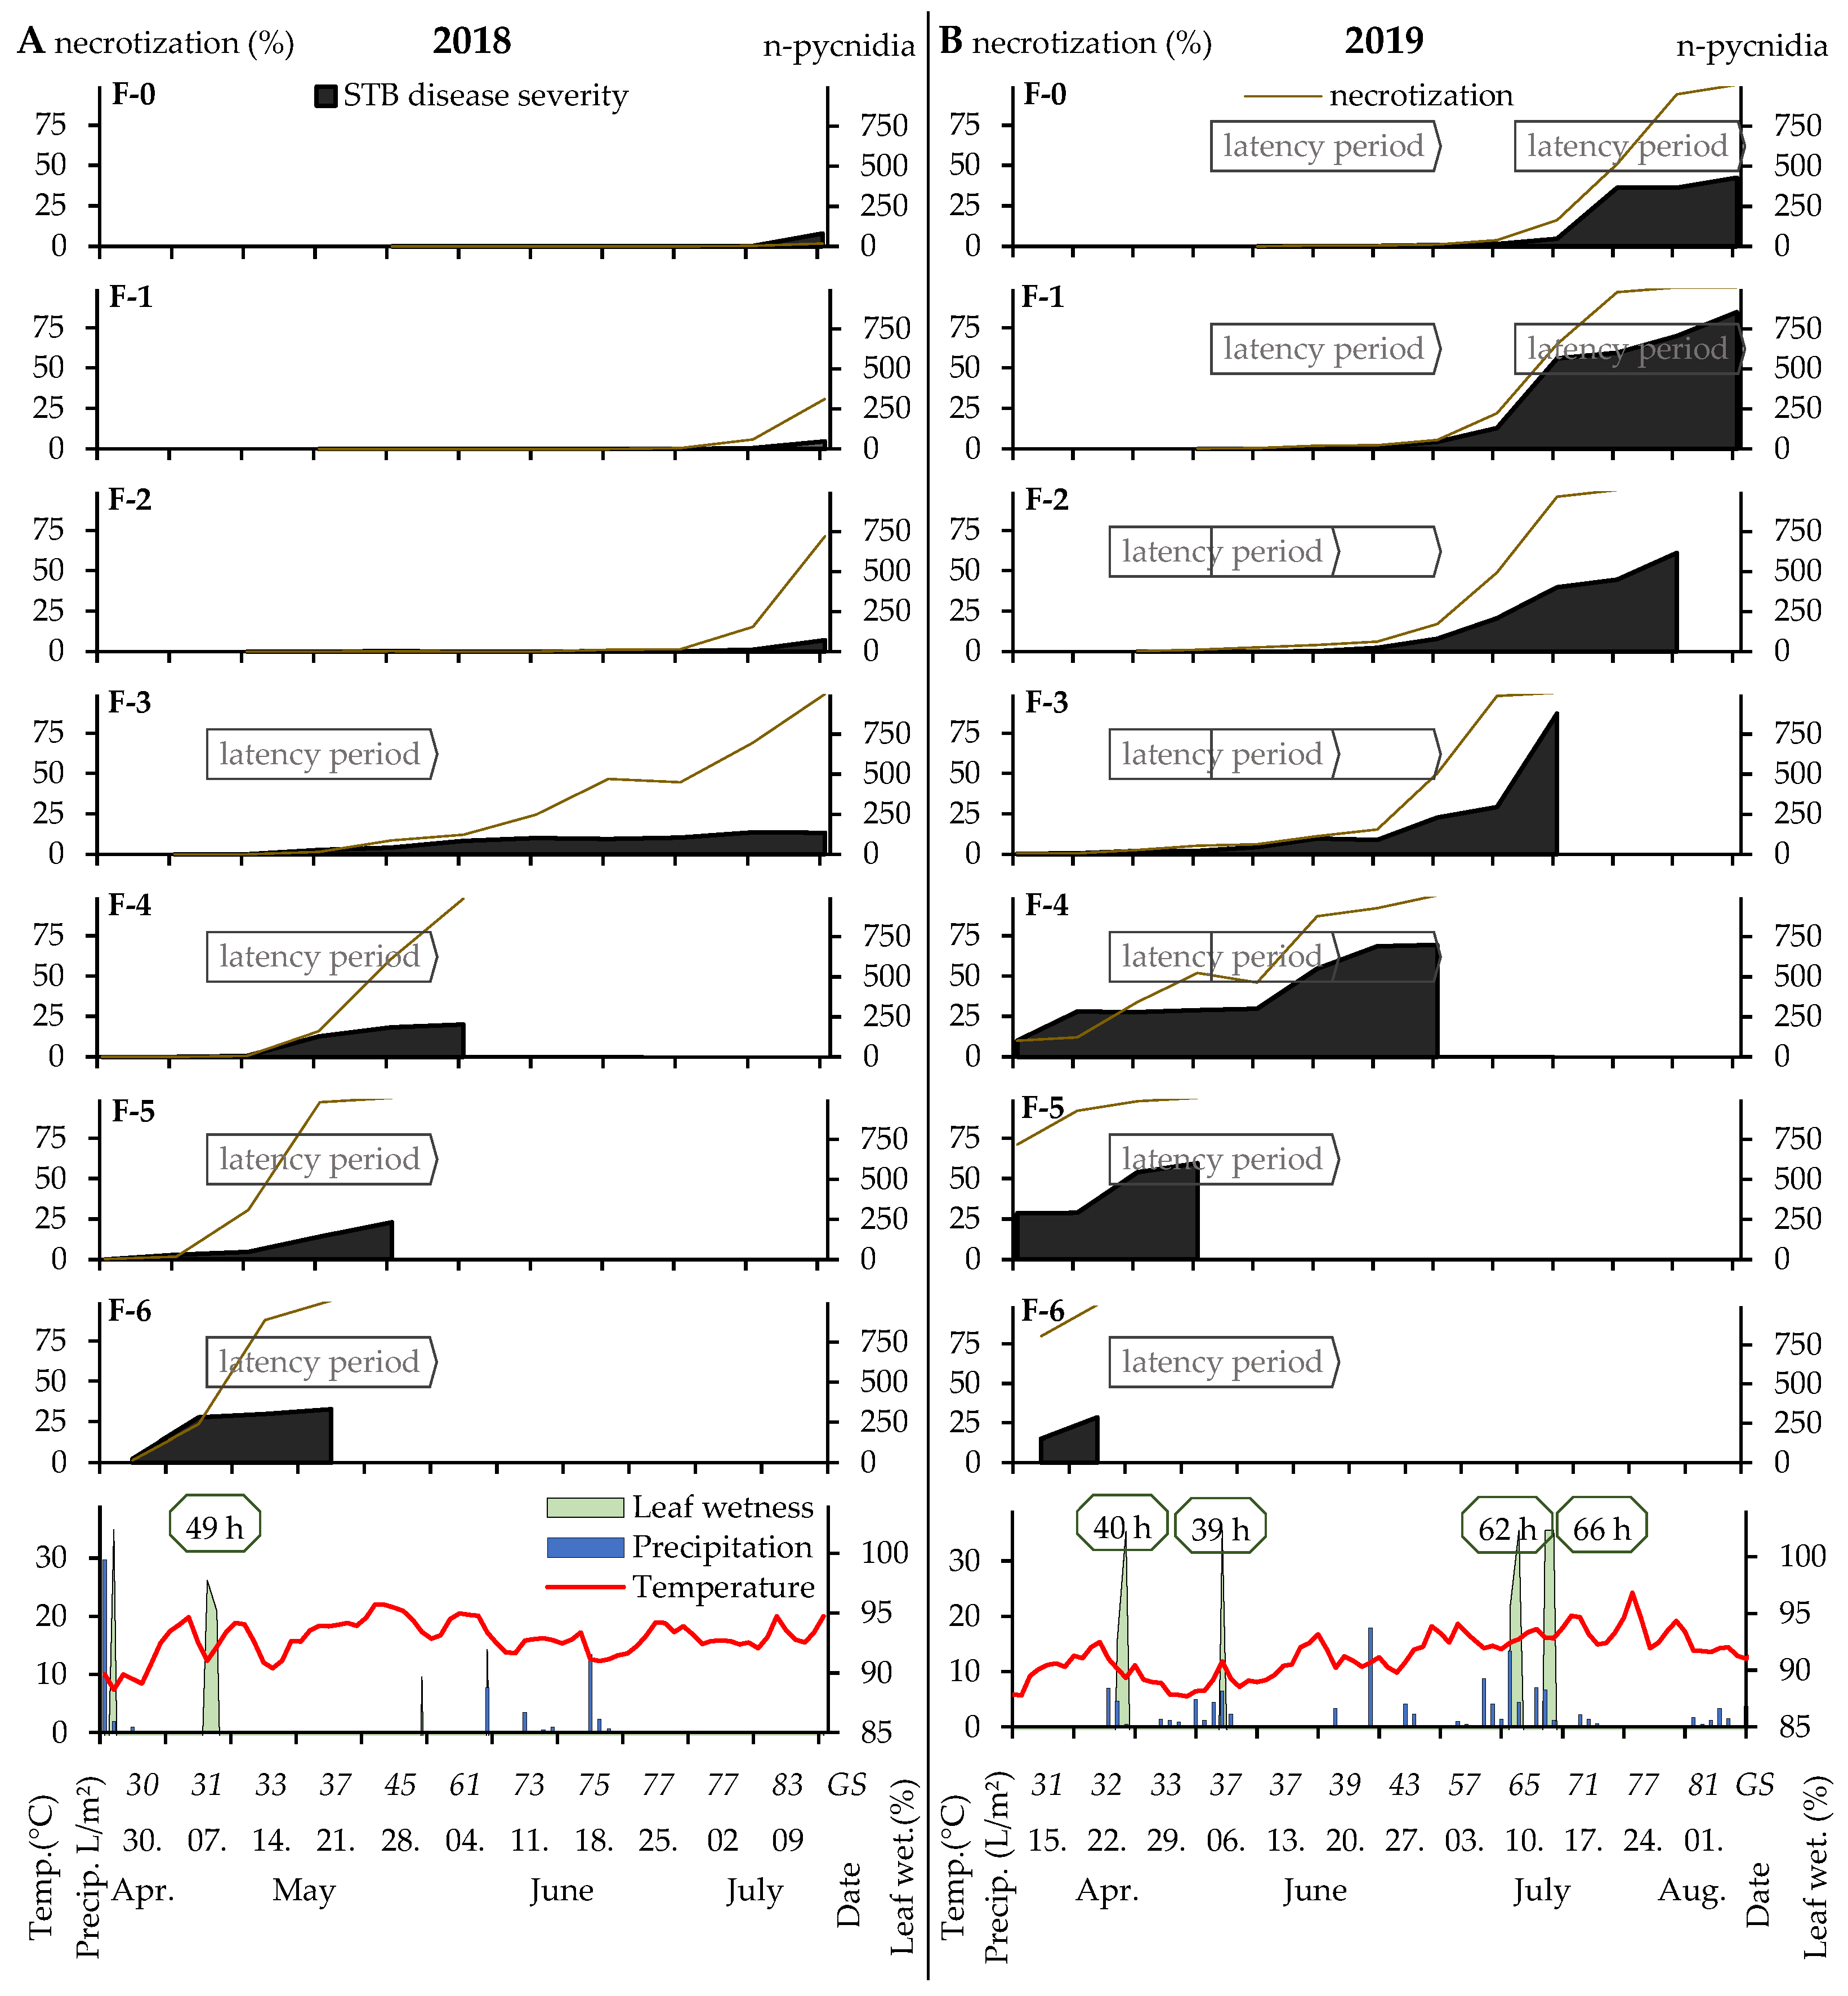
In Figure 4, the disease severity of STB is shown for two representative years of the survey, together with the individual STB disease severity for each leaf layer in combination with the necrotization of 2018 and 2019. As no other diseases were observed at the site in the years shown, the necrotization can be considered as directly dependent on STB infections and abiotic factors.
In general, the average temperature in 2018 increased during the growing season compared with 2019 by 3.0 °C, being at 16.2 °C and 13.2 °C, respectively. In contrast, the total precipitation increased by 82 L/m2 in 2019 as compared with that in 2018 during the growing season, being at 62 L/m2 and 144 L/m2, respectively. Furthermore, similar initial infestations were observed on the lower leaf layers (F − 4 to F − 6) in both years. As shown in Figure 4, STB epidemics have their origin on the lower leaf layers and infest higher leaf layers under conducive weather conditions. Therefore, conducive conditions are present if a rainfall event of at least 3 L/m2 transports the spores of STB onto higher leaf layers. On higher leaf layers, spores will need a leaf wetness of at least 98% for 36 h for an infection to proceed through its stages including germination, growth of infection hyphen with appressorium development, and stomatal leaf penetration [4,5,22]. Generally, an initial infestation of STB needs to be present at the location, and only visible leaf layers can be infected if the conditions are conducive. In 2018, the 12th of May was the only day when the weather conditions were conducive for STB at the trial site. Therefore, a plant GS of 31 was observed; thus, the upper leaf layers (F − 0 to F − 2) were not completely developed and, therefore, not affected by STB after the latency period of approximately 28 days [4]. In particular, leaf layer F − 3 was affected by this infection, as an increase in disease severity was observed 4 weeks after infection. In the absence of conducive conditions during the 2018 growing period, STB was not able to spread to the upper and yield-relevant leaf layers. However, in 2019, colder and wetter weather persisted (Figure 4B), and four infection periods were observed, namely the 29th of April (GS 32), the 5th of May (GS 37), the 10th of June (GS 65), and the 19th of June (GS 71). Compared with 2018, plant development was advanced in 2019; therefore, GS 32 was observed during the infectious conditions on the 29th of April. This resulted in an increase in disease severity after the latency period on leaf layers F − 2 and a primary increase on F − 1. The primary increase on leaf layer F − 0 and the secondary increase on the leaf layer F − 1 are a result of conducive conditions during the infection period on the 5th of May at a plant GS of 37. Consequently, the epidemiological development of STB within the growing season depends on the distribution of conducive conditions, on the one hand, and on plant growth stage (leaves of interest need to appear), on the other hand.
3.4. Conducive Conditions of Septoria Tritici Blotch during the Survey Period
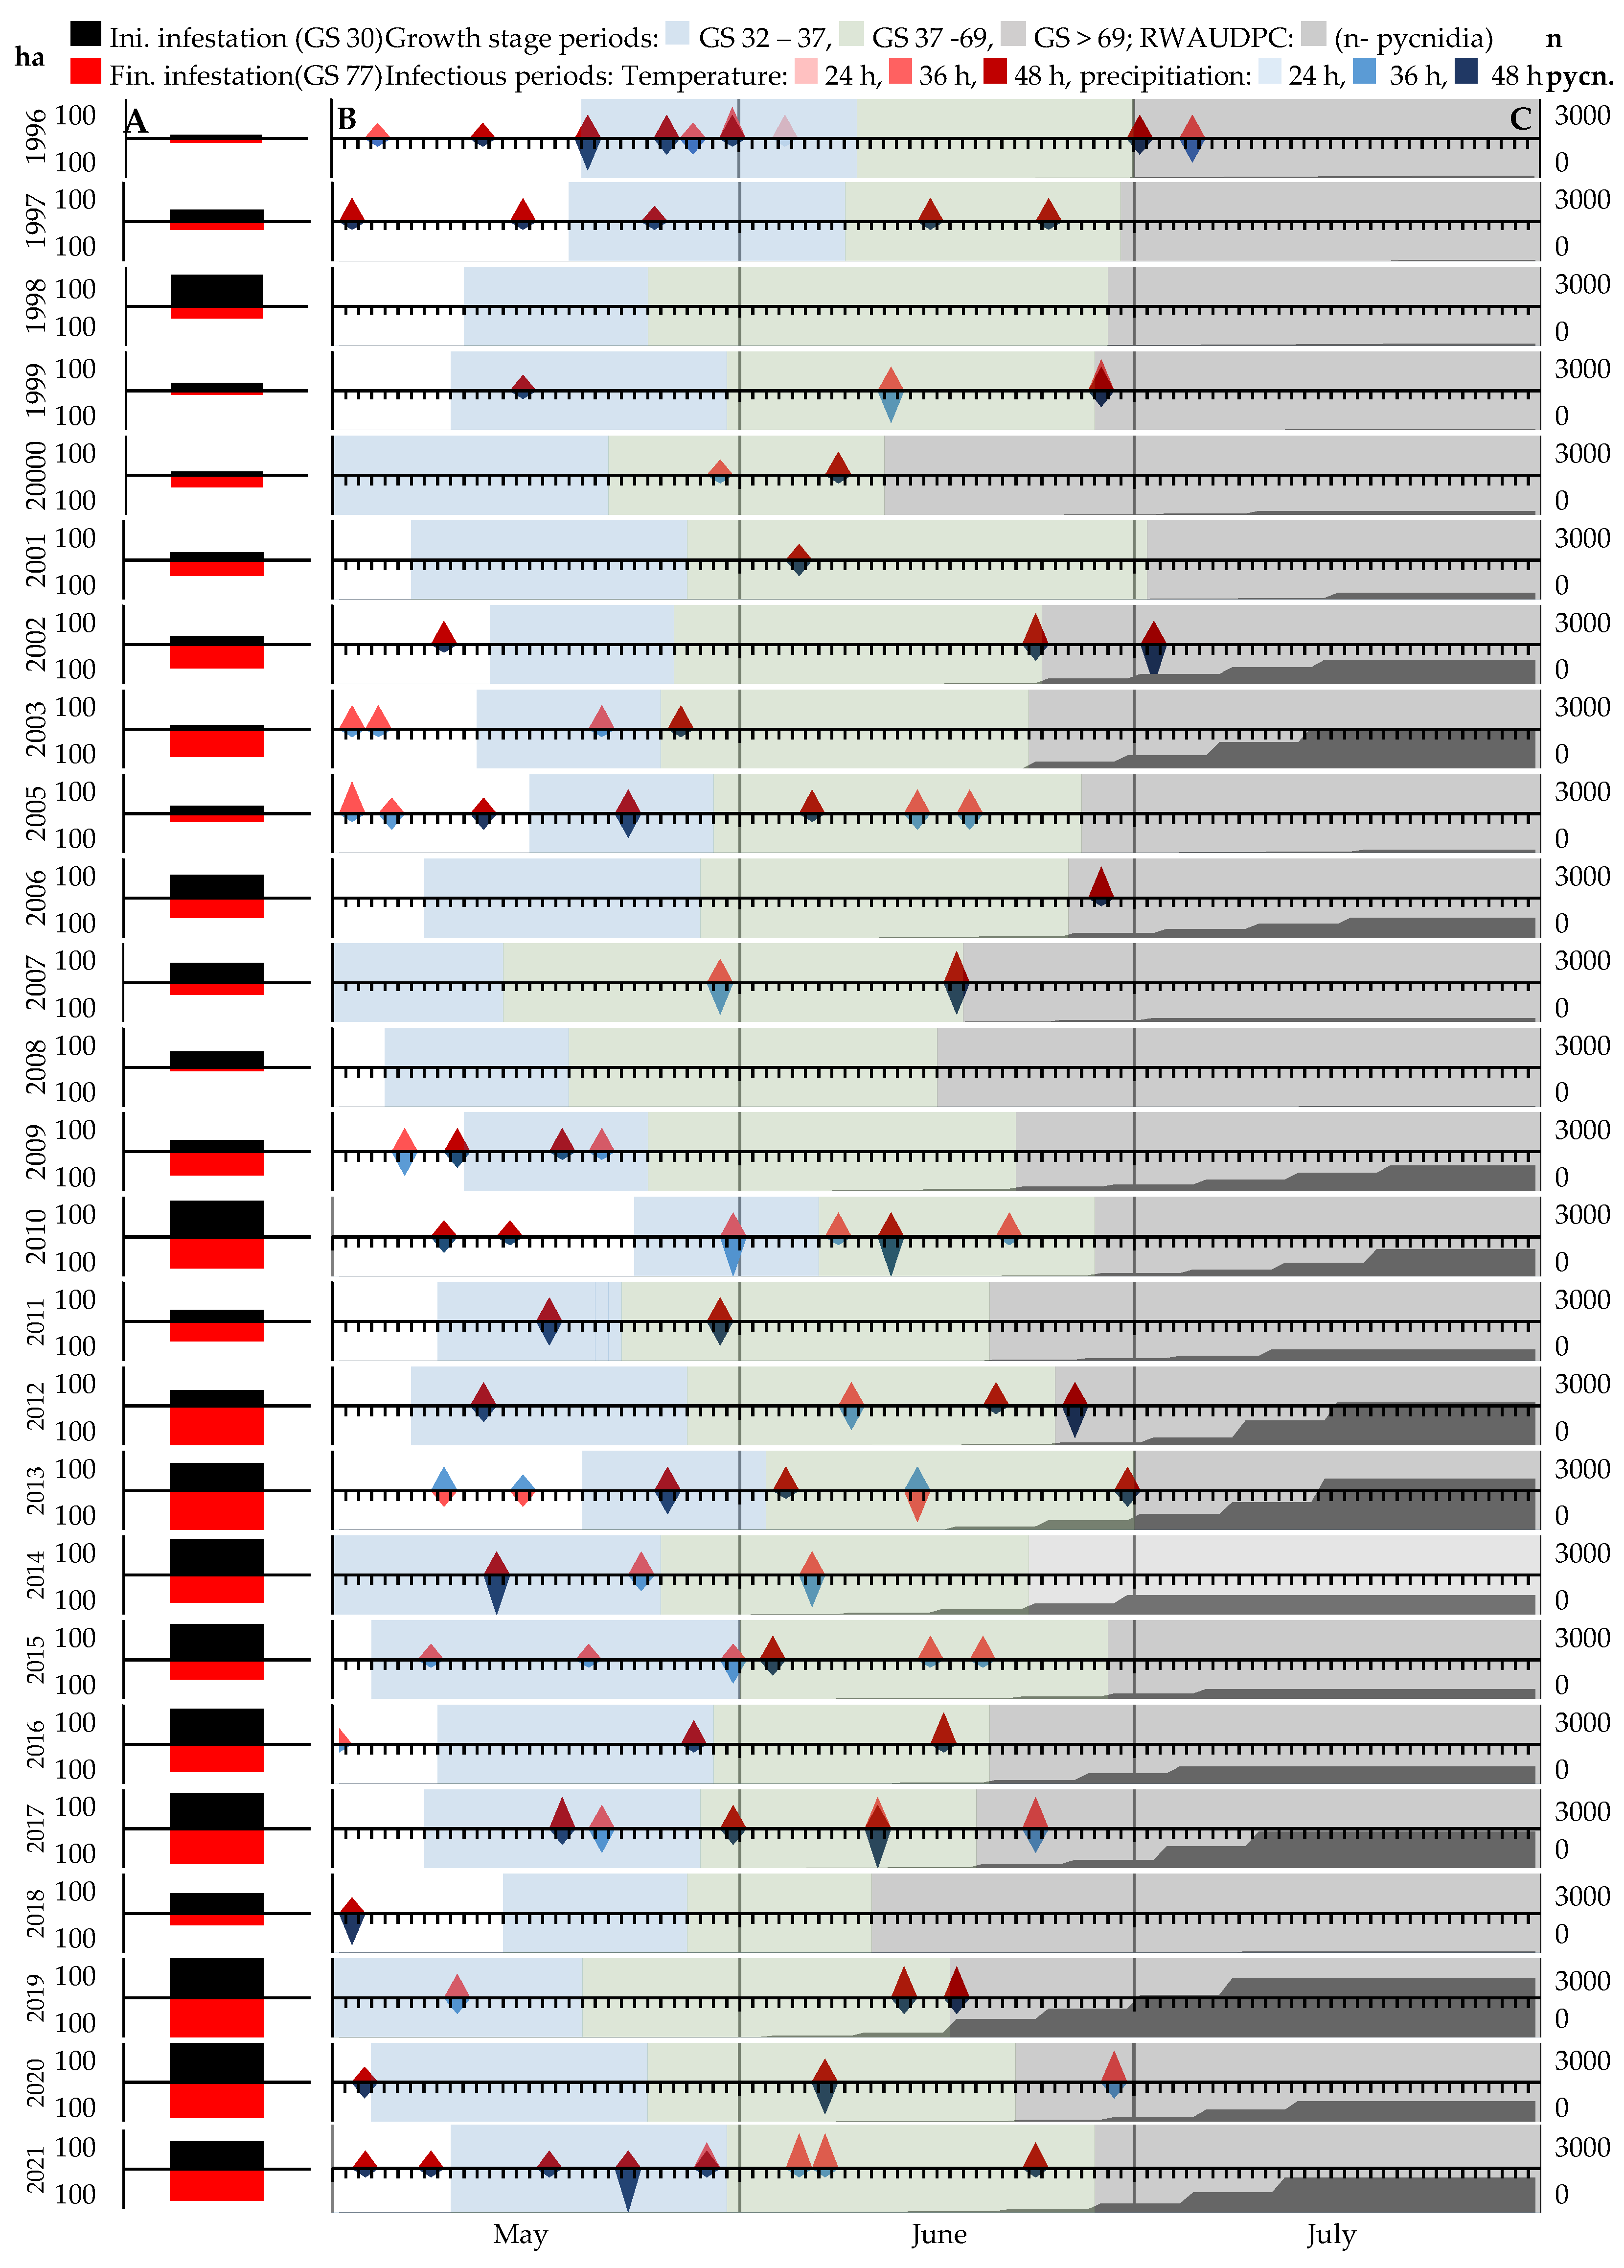
Epidemics of STB depend on the occurrence of an initial infestation at a location and the interaction of visible leaf layers and the distribution of conducive conditions during the growing season. In Figure 5, the initial and final infestations are shown relative to the highest observed initial and final infestations of STB, together with conducive conditions for STB, including classified temperature and precipitation during the corresponding leaf wetness period. Additionally, the relevant growth stage periods are shown for every year of the survey to classify the visible leaves. To assess the epidemiological behaviour of STB, the absolute RWAUDPC(xF−0–x-F−2=33%; xF−3–x-F−6=0%) is shown for every day in the growing season. The initial infestations varied from 2.81 pycnidia in 1996 to 151 pycnidia in 2020 and averaged 50 pycnidia. The final infestations varied from 27.8 pycnidia in 1996 to 552 pycnidia in 2019 and averaged 261 pycnidia. The increase in pycnidia during the growing season from GS 32 to 77 differed, with an average of 211 pycnidia. Therefore, the lowest increase was observed in 2008 (12.3 pycnidia), and the highest increase was observed in 2012 (507 pycnidia). Even if a significant (p < 0.05) correlation between initial and final infestations was observed, over 60% of the final infestation could not be explained by the initial infestation (R2 = 0.36; Figure 4A). Considering the distribution of STB-conducive conditions during the growing period, the years 2008 and 2018 showed no infections between GS 32 and GS 77. Thus, no significant increase in disease severities was observed during the growing season, even though the initial infestations were moderate, with 32.5 in 2008 and 48.2 in 2018. In contrast, the years 2003 and 2013 also showed low to moderate initial infestations, with 7.86 and 62 pycnidia, respectively, but major increases in disease severity of 330 in 2003 and 467 pycnidia in 2013.
Figure 5B shows the temperatures and precipitations within 24–35, 36–47, and ≥48 h periods with leaf wetness ≥ 98%. Over the 25-year survey, 94 STB infection periods were observed in the months of May, June, and July, which correspond to an average of 3.76 infection conditions per year. Only in 1996 was a period of more than 24 h and less than 36 h observed in the three months shown. In contrast, periods with 36 h of leaf wetness ≥ 98% were observed 25 times (1.48 periods per year), and periods with more than 48 h of leaf wetness ≥ 98% occurred 56 times (2.24 periods per year). In May, 52 periods were observed, 36 periods were observed in June, and 3 periods were observed in July. Over the years, the number of infectious periods in May were consistent, whereas the number of infectious periods of STB in June increased from 1996 to 2021. The regression analysis showed a non-significant (p = 0.65) annual increase of 0.03 infections (y = 0.031x + 3.24). This was primary based on the non-significant (p = 0.15) increase in infections in June (y = 0.044x + 0.86), whereby the infections in May remained at a constant level (y = 0.009x + 1.96). Furthermore, in 1998, 2008, and 2018, no periods with leaf wetness ≥ 98% of more than 24, 36, and 48 h were observed within growth stages 32 and 77, and apparently, STB did not occur on the three uppermost leaf layers. The relationship between the severity of STB on the three uppermost leaf layers and the number of infection periods is at a minor level with an R2 of 0.18. In Figure 5A, an initial infestation of STB was shown in every year of the survey; consequently, an initial inoculum was consistently present at the site during the period. Therefore, a progressive epidemiological development of the disease throughout the growing season in every year was possible. As the number of infectious periods does not explain the annual final infestations, the timing of the infectious conditions was analysed. In particular, the years 2012 and 2013 showed different numbers of infectious periods (four and six) with similar final STB infestations of 1654 and 1941 pycnidia, respectively. In both years, four infections occurred after GS 32, which is a possible explanation for the similar final infestations.
In Figure 5C, the course of the total disease severity during the annual growing seasons of the three uppermost leaf layers is shown in n-pycnidia. Therefore, the STB disease severities increased with conducive conditions when the observed leaf layers were visible (GS > 32). From 1996 to 2021, the required duration of leaf wetness for a successful infection, with a subsequent concomitant increase in disease severity, decreased from 48 h to 36 h. In particular, two infections occurred in 2000: the first on the 28th of May, with a leaf wetness duration of more than 36 and less than 48 h, and one on the 8th of June, with a duration of more than 48 h. An increase in disease severity was only observed after the second (longer) infection. In 2020, two infections also occurred at the location. The first was on the 7th of June, with a leaf wetness duration of more than 48 h, and the second was on the 26th of June, with a duration of more than 36 h. In contrast to 2000, both infections showed an increase in disease severity.
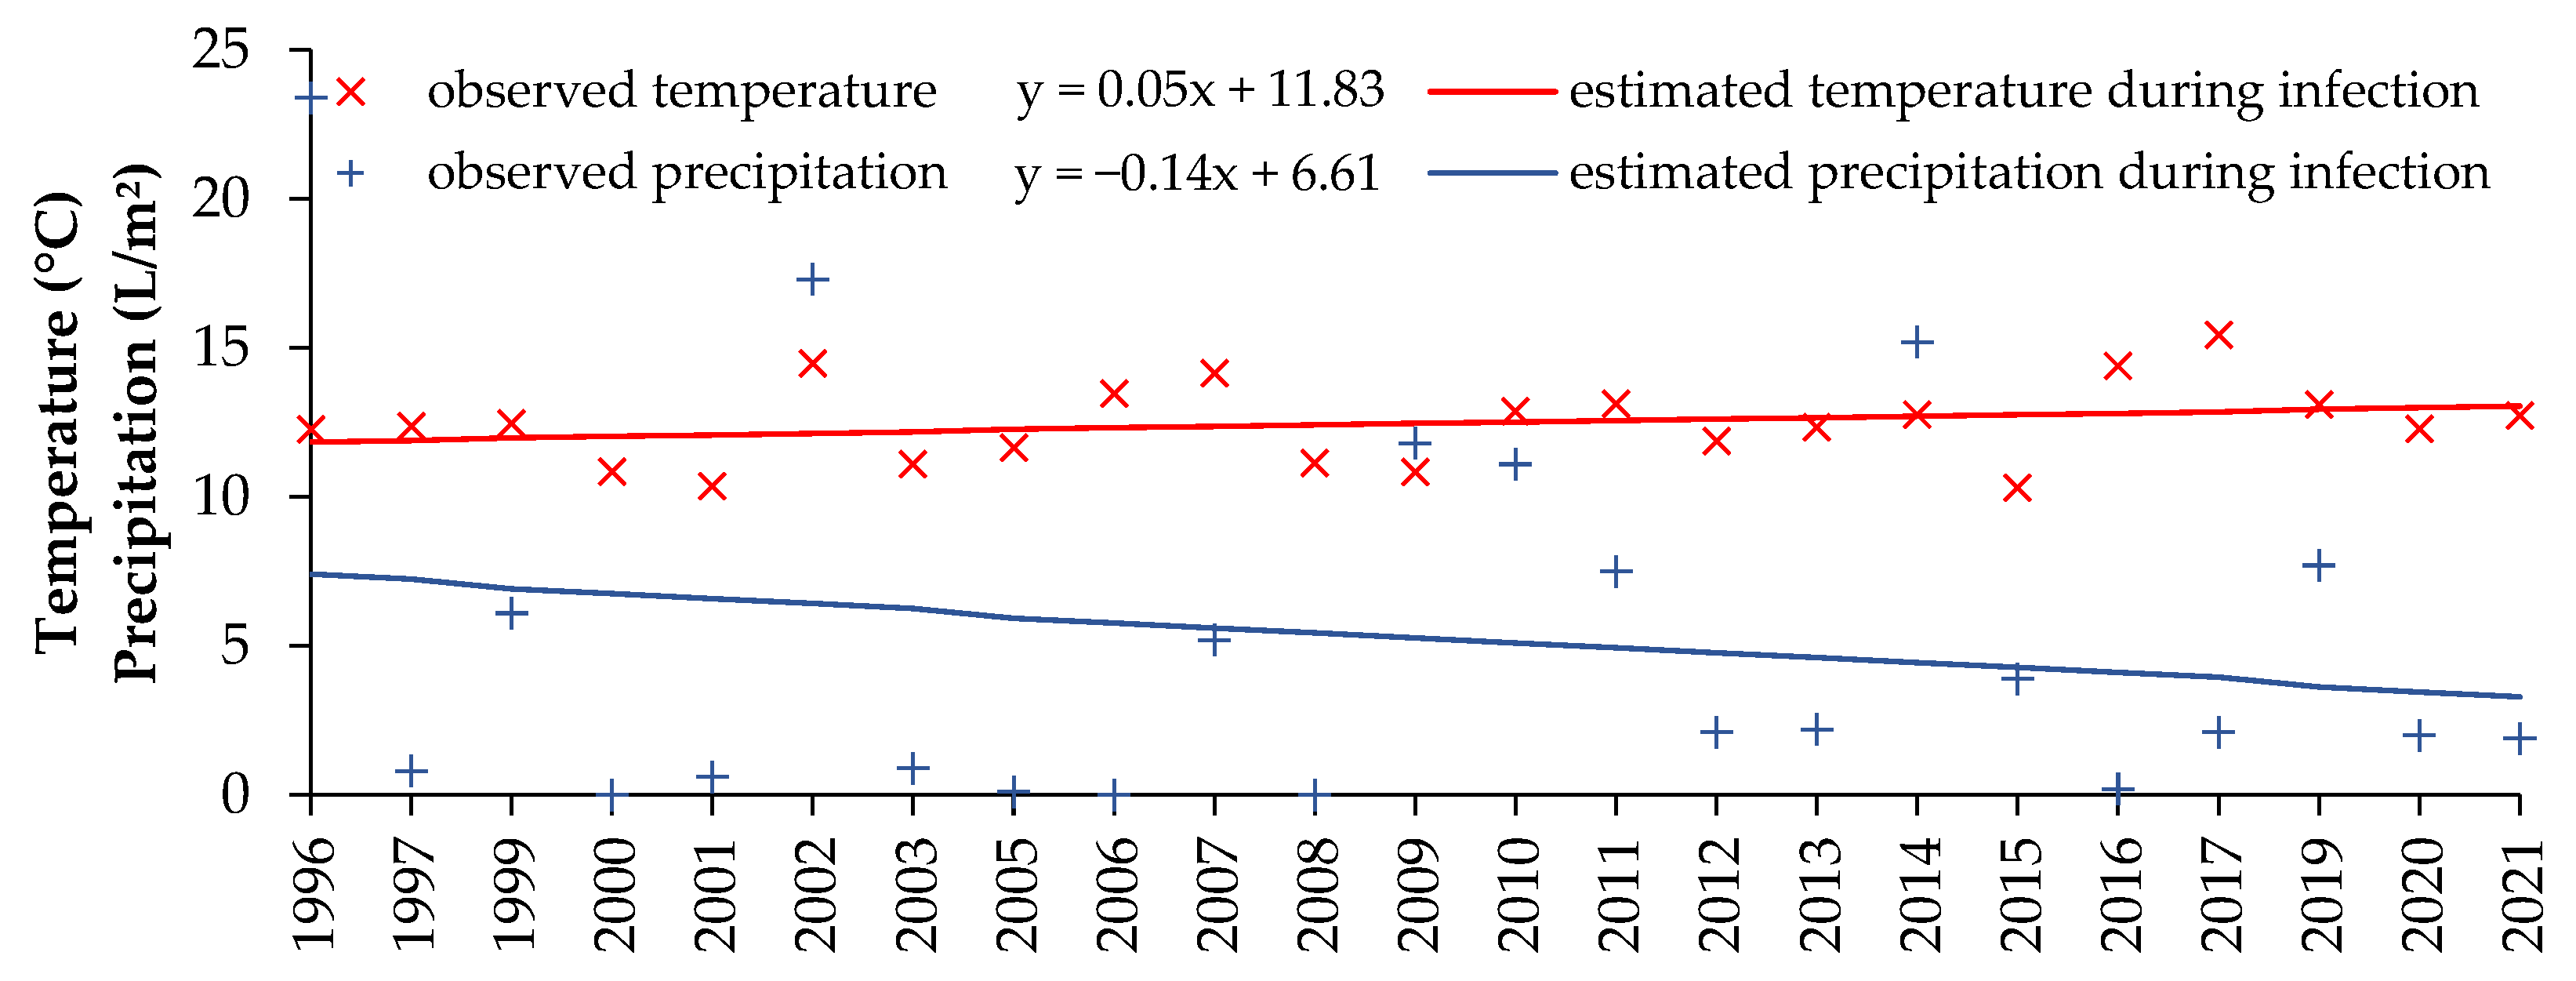
As conducive conditions shifted to later seasonal dates, it can be assumed that the corresponding temperature during the infection period increases with seasonal change. At the observed location, the multiannual temperature average from 1991 to 2020 was 3.1 °C higher in June (15.3 °C) than in May (12.1 °C). Considering the weather conditions during the infection, as shown in Figure 5B, an increase in temperature was observed during the survey period. The regression analyses showed an estimated total increase during the infection period of 1.2 °C from 1996 to 2021 (Figure 6). This equates to an annual temperature increase over the survey period of 0.1 °C. In contrast to temperature, the regression analysis showed an estimated seasonal decrease in precipitation during the infection periods of 3 L/m2, which equates to an annual decrease of 0.1 L/m2 from 1996 to 2021. Compared with the temperature, a significant increase in variation in the precipitation during the infection periods was observed during the survey.
4. Discussion
Septoria tritici blotch (STB) is one of the most important foliar diseases in global wheat production and is responsible for yield losses in all growing areas, particularly in maritime climates [1,3,10,23]. The occurrence of associated foliar diseases complicates the assessment of the progression of a single disease in the field [12,24,25]. In our field study, STB was the only disease observed at the trial site. Based on epidemiological data, the trial location was well suited for assessing the influence of climate change on the disease progression of STB. This was particularly due to the consistent epidemics of STB at the trial location and the absence of other foliar diseases. In our study, there was a significant increase in the severity of STB during the survey period at the representative trial location.
A possible explanation for the increased disease pressure of STB is that the pathogen has potentially adapted to the cultivar selected, as described by McDonald and Mundt [26]. In contrast, Prahl et al. [27] showed in a comparable study with two different susceptible cultivars, “Ritmo” (moderate to highly susceptible) and “RGT Reform” (moderately susceptible), that high disease severities were also observed in the less susceptible cultivar “RGT Reform”. In addition, the used cultivar “Ritmo” has become less important in the agronomic practices of the trail area during the long-term survey, so “Ritmo” was barely grown in the region during the last decade of the survey. An adaptation of the pathogen to the cultivar used is, therefore, rather improbable. However, the consistent use of the cultivar “Ritmo” is a possible explanation for the increased disease severity during the survey period but does not explain the intensity of the STB progression during the survey.
A similar study using epidemiological data conducted by Volk et al. [28] predicted an increase in disease severity of STB in Western Germany by 2050, by using the empiric-statistical method “WettReg” (based on SRES-Scenario A1B). In contrast, a study by Goucahe et al. [29] predicted a decrease in the disease severity of STB by 2–6% in France. A significant uncertainty in the predicted development was mentioned, in particular the probability of STB disease severity increasing rather than decreasing was 45% for the coastal location of the study.
Although the correlation between the disease severity and the weather parameters temperature, precipitation, and leaf wetness (R2 = 0.19, R2 = 0.31, R2 = 0.28, respectively) was on a minor level, an influence of the prevailing weather condition was observed. As shown in the case study, precipitation with prolonged leaf wetness is essential for a successful infection (germination, growth of infection hyphae with appressorium development, and stomatal leaf penetration). Therefore, 3 L/m2 of precipitation is sufficient to transport the inoculum and a 36 h period of leaf wetness is sufficient to complete the infection. An increase in precipitation above 3 L/m2, or an extension of the leaf wetness period, is not a determinant of the expression of the corresponding infection [22]. The prevailing temperature, as it is not under 6.0 °C, is not involved in the success of the infection but determines the expression of the respective infection [11,30,31]. As shown by Henze et al. [5], the direct influences of temperature, precipitation, and leaf wetness on the disease development were confirmed in Northern Germany. Chungu et al. [11] also showed a direct influence of the prevailing temperature on the development of STB in Manitoba, Canada. The influence of the prevailing climatic conditions was also confirmed by the change in the requirement for successful infection. As it was shown, in the first half of the study, a leaf wetness ≥ 98% with a duration of ≥48 h was necessary for a successful infection with a subsequent increase in disease severity [4,32], whereas in the second half of the study, a reduced period of leaf wetness ≥ 98% with a duration of 36–48 h was necessary for a successful infection [5]. However, a seasonal extension in conducive STB conditions from May to June was investigated at the trial site. Therefore, an increase in conducive conditions of STB was observed for the entire growing season and, in particular, for the month June. This seasonal extension explains the increase in infestation during the survey period, as the average temperature in June (15.3 °C) was 3.1 °C higher than that in May (12.1 °C) [14]. Beyer et al. [33] showed that increasing temperatures shortened the latency period between infection and epidemic outbreak. Shorter latency periods ensure that new STB pycnidia develop more quickly. Under increased temperatures, a stronger and faster epidemiological disease dynamic of STB can be expected. Even though climate change has so far only had a marginal influence on the temperature in the growth period, the seasonal expansion (periods of high precipitation in later months) has led to an increased temperature at the time of infection. Consequently, later STB infections occurred under warmer conditions, with an increased epidemiological potential [31,34,35].
According to the IPCC special report (SR) [7], the global temperature increase since 1881 has been about 1.0 °C, with regional temperature changes differing from the global average. In Germany, the increase has been about 1.5 °C [36], due to higher temperatures after the year 2000. Climate change simulations suggest that this trend will continue, even without the projected reductions in greenhouse gas emissions. Jacob et al. [37] simulated an increase in air temperature (based on the period from 1971 to 2000) in Europe of 1.0 to 4.5 °C by the end of this century under the IPCC Representative Concentration Pathway (RCP) 4.5 scenario [38] or from 2.5 to 5.5 °C under the RCP 8.5 scenario. In contrast, the temperature of the coastal regions of Germany, the Netherlands, and France will be less affected by climate change. The German National Meteorological Service (Deutscher Wetterdienst) predicted a regional temperature increase of 0.2 to 0.5 °C from 2021 to 2031 based on average temperatures from 1991 to 2020 [39]. Contrary to the predictions, no direct temperature increase was observed during the 25-year survey period. According to the IPCC SR [7], a general increase in the risk of weather phenomena (e.g., heat waves and droughts) has been predicted, which is consistent with our results, in the form of an increased variance in the measured temperature during the survey period at the trial site. As shown in our study, the initial infestation is of minor importance for the epidemiological development of STB. Consequently, it is not only the regionality of the climate but also the seasonality of the climate that are of major interest. In particular, the climate during spring (April to June) determines the epidemiological behaviour of STB [1,40,41]. Consistent with our results, seasonal and regional simulations showed an increase in precipitation during spring in Northern Europe [42,43,44]. In contrast, the same simulations also predicted an increase in temperature, which was not observed in our study. In conclusion, there is an influence of climate change on the disease progression of STB. Furthermore, if temperature and precipitation follow the trend shown, an increase in the severity of STB can be expected.
Assuming that epidemics of other diseases occur at this location, interactions between the occurring foliar diseases are possible, as described by Jesus Junior et al. [12]. As shown by Klink et al. [3], leaf rust competed primarily with STB in a long-term survey in a similar region. However, leaf rust was not recorded consistently from year to year. As described by Garin et al. [24], leaf rust and STB compete for the same leaf area, with STB inhibiting leaf rust development but leaf rust not inhibiting STB development under current weather conditions. By shortening the rust latency period (e.g., due to increased temperatures), leaf rust was more competitive. Furthermore, a strongly reduced growth rate of STB was observed when the temperature exceeded 25 °C under laboratory conditions [31]. In contrast, Klöhn [22] was able to show that increasing temperatures correlated linearly with the leaf wetness duration required for a successful infection by STB. However, the seasonal mean temperatures in Northern Europe are significantly lower than those described by Chaloner [31] and Klöhn [22], and it is therefore expected that STB remains the most dominant disease in Northern Europe under maritime conditions.
Fungal disease management in wheat is mainly based on fungicides, which are primarily used to control STB. Consequently, it can be expected that the amount of fungicides needed for proper disease management in wheat will increase as STB disease pressure increases in the future and if current practices are maintained [27]. In addition, Birr et al. [45] and Klink et al. [46] observed a shift in the sensitivity of STB to most of the available fungicides from 1999 to 2020. The increased disease pressure and the reduced sensitivity to fungicides threaten future yields of wheat production. In the European Union, pesticides are of growing concern to the general public. Due to public concern, the EU is trying to reduce the amount of pesticides used through regulations such as the reduction in authorised active substances by the ever-expanding list of candidates for substitution [47].
Additionally, the EUs plan ‘Regulation of the European Parliament and of the Council on the sustainable use of plant protection products and amending Regulation (EU) 2021/2115′ envisions a 50% reduction in total pesticide sales by 2030 [48]. Taking into account the aforementioned increase in STB disease pressure and reduced fungicide sensitivity, combined with European Union regulations, yield losses due to STB in common practice can be expected to increase beyond the 5–10% of Fones and Gurr [1]. In conclusion, this will lead to a greater reliance on genetic resistance in wheat cultivars. Although several resistance genes are currently known [49,50], resistant individual wheat cultivars with sufficient yield are currently unavailable. The durability of the resistant cultivars is also questionable, especially if the disease pressure increases [51]. An interesting approach is to use a mixture of cultivars to extend the lifetime of resistance sources due to heterogeneity [52,53]. In general, appropriate agronomic production techniques, such as proper crop rotation, tillage systems, or cultivars, will not suppress STB sufficiently.
In summary, the disease severity increased significantly at the representative location. Therefore, the prevailing weather conditions, in particular temperature and precipitation, changed within the survey period. Additionally, a seasonal expansion of infectious periods to advanced dates of the growing season was observed. Consequently, the infections occurred under higher temperatures, which might have led to the increased disease progression.
5. Conclusions
The sustainable production of wheat, the most important crop in the EU, is primary threatened by foliar diseases, especially Septoria tritici blotch (STB). During the 25-year survey period, a significant increase in STB disease severity was observed at a unique location without accompanying diseases in a maritime climate. The epidemiological development of STB is highly dependent on conducive weather conditions during the growing season. In particular, a seasonal expansion of STB-conducive weather conditions during the critical growing season from May to June was observed. Due to the higher temperatures and constant precipitation in the advanced growing season, an enhanced disease dynamic of STB was observed from 1996 to 2021. As STB disease progression is highly dependent on the prevailing weather conditions, changes in climate, e.g., global warming, have a major impact on the disease progression of STB. In particular, climate change can influence the disease dynamic of STB, particularly if spring temperatures and precipitation increase, as predicted by several climate simulations. Under this assumption, STB will become a bigger issue than it already is, and the control of STB will be a major challenge for agronomic practices in maritime climates. Therefore, the use of integrated approaches for disease management are effective, as the disease pressure is evenly distributed across all agronomic practices, including the proper use of pesticides.
Supplementary Materials
The following supporting information can be downloaded at https://www.mdpi.com/article/10.3390/agronomy13041005/s1, Table S1: RWAUDPC of all observed foliar diseases from 1996 to 2021 at the trial location of the survey.
Author Contributions
Conceptualization, K.C.P., H.K. and T.B.; methodology, K.C.P., H.K. and T.B.; software, K.C.P. and M.H.; validation, K.C.P., H.K., J.-A.V. and T.B.; formal analysis, K.C.P. and M.H.; investigation, K.C.P.; resources, K.C.P. and J.-A.V.; data curation, K.C.P.; writing—original draft preparation, K.C.P., H.K. and T.B.; writing—review and editing, M.H. and J.-A.V.; visualization, K.C.P. and T.B.; supervision, H.K., J.-A.V. and T.B.; project administration, K.C.P., H.K. and T.B.; funding acquisition, H.K., J.-A.V. and T.B. All authors have read and agreed to the published version of the manuscript.
Funding
This research was funded by the Stiftung Schleswig-Holsteinische Landschaft. We acknowledge financial support by Land Schleswig-Holstein within the funding programme Open Access Publikationsfonds.
Institutional Review Board Statement
Not applicable.
Informed Consent Statement
Not applicable.
Data Availability Statement
Data available upon request.
Acknowledgments
We thank our colleagues from the Chamber of Agriculture of Schleswig-Holstein for crop management and harvesting. We thank all M.Sc. students who collected the annual ratings. Furthermore, we wish to thank Brandt Berghuis (University of Wisconsin-River Falls) for proofreading.
Conflicts of Interest
The authors declare no conflict of interest.
References
- Fones, H.; Gurr, S.J. The impact of Septoria tritici Blotch disease on wheat: An EU perspective. Fungal Genet. Biol. 2015, 79, 3–7. [Google Scholar] [CrossRef] [Green Version]
- Bouma, E. Development of comparable agro-climatic zones for the international exchange of data on the efficacy and crop safety of plant protection products. Bull. OEPP 2005, 35, 233–238. [Google Scholar] [CrossRef]
- Klink, H.; Prahl, K.C.; Hasler, M.; Verreet, J.-A.; Birr, T. Efficiency and Effectivity of a Biological–Epidemiological Fungal Disease Management System in Wheat—A Study of 26 Years. Agriculture 2022, 12, 1099. [Google Scholar] [CrossRef]
- Verreet, J.-A.; Klink, H.; Hoffmann, G.M. Regional Monitoring for Disease Prediction and Optimization of Plant Protection Measuares: The IPM Wheat Model. Plant Dis. 2000, 84, 816–826. [Google Scholar] [CrossRef] [Green Version]
- Henze, M.; Beyer, M.; Klink, H.; Verreet, J.-A. Characterizing Meteorological Scenarios Favorable for Septoria tritici Infections in Wheat and Estimation of Latent Periods. Plant Dis. 2007, 91, 1445–1449. [Google Scholar] [CrossRef] [PubMed] [Green Version]
- Miedaner, T.; Juroszek, P. Climate change will influence disease resistance breeding in wheat in Northwestern Europe. Theor. Appl. Genet. 2021, 134, 1771–1785. [Google Scholar] [CrossRef] [PubMed]
- IPCC. Global Warming of 1.5 °C. An IPCC Special Report on the impacts of global warming of 1.5 °C above pre-industrial levels and related global greenhouse gas emission pathways. In The Context of Strengthening the Global Response to the Threat of Climate Change, Sustainable Development, and Efforts to Eradicate Poverty; Cambridge University Press: Cambridge, UK; New York, NY, USA, 2018. [Google Scholar]
- IPCC (Ed.) Summary for Policymakers. In Climate Change 2022: Mitigation of Climate Change. Contribution of Working Group III to the Sixth Assessment Report of the Intergovernmental Panel on Climate Change; Cambridge University Press: Cambridge, UK; New York, NY, USA, 2022. [Google Scholar]
- IPCC (Ed.) Summary for Policymakers. In Climate Change 2021: The Physical Science Basis. Contribution of Working Group I to the Sixth Assessment Report of the Intergovernmental Panel on Climate Change; Cambridge University Press: Cambridge, UK; New York, NY, USA, 2021. [Google Scholar]
- Goodwin, S.B. Diseases affecting wheat: Septoria tritici blotch. In Integrated Disease Management of Wheat and Barley; Oliver, R., Ed.; Burleigh Dodds Science Publishing: Cambridge, UK, 2019; pp. 47–68. ISBN 9781786762160. [Google Scholar]
- Chungu, C.; Gilbert, J.; Townley-Smith, F. Septoria tritici Blotch Development as Affected by Temperature, Duration of Leaf Wetness, Inoculum Concentration, and Host. Plant Dis. 2001, 85, 430–435. [Google Scholar] [CrossRef] [Green Version]
- Jesus Junior, W.C.; Paula Júnior, T.J.; Lehner, M.S.; Hau, B. Interactions between foliar diseases: Concepts and epidemiological approaches. Trop. Plant Pathol. 2014, 39, 1–18. [Google Scholar] [CrossRef] [Green Version]
- Statistisches Amt für Hamburg und Schleswig-Holstein. Kreisergebnisse Schleswig-Holstein 2020—Endgültiges Ergebnis der Landwirtschaftszählung 2020–: Kennziffer: C IV—LZ 2020 SH, SK Sonderbericht Kreisdaten; Statistisches Amt für Hamburg und Schleswig-Holstein: Hamburg, Germany, 2021.
- DWD Climate Data Center. Vieljährige Stationsmittelwerte für die Klimareferenzperiode 1991–2020, für Aktuellen Standort und Bezugsstandort. Available online: https://www.dwd.de/DE/leistungen/klimadatendeutschland/vielj_mittelwerte.html (accessed on 18 May 2021).
- Hamer, W.B.; Birr, T.; Verreet, J.-A.; Duttmann, R.; Klink, H. Spatio-Temporal Prediction of the Epidemic Spread of Dangerous Pathogens Using Machine Learning Methods. Int. J. Geo-Inf. 2020, 9, 44. [Google Scholar] [CrossRef] [Green Version]
- Bundessortenamt. Beschreibende Sortenliste Getreide, Mais, Ölfrüchte, Leguminosen (Großkörnig), Hackfrüchte (außer Kartoffeln) 2007; Deutscher Landwirtschaftsverlag: Hannover, Germany, 2007; ISBN 0948-4167. [Google Scholar]
- Zadoks, J.C.; Chang, T.T.; Konzak, C.F. A decimal code for the growth stages of cereals. Weed Res. 1974, 14, 415–421. [Google Scholar] [CrossRef]
- Madden, L.V.; Hughes, G.; van den Bosch, F. (Eds.) CHAPTER 4: Temporal Analysis I: Quantifying and Comparing Epidemics. In The Study of Plant Disease Epidemics; The American Phytopathological Society: St. Paul, MN, USA, 2017; ISBN 978-0-89054-505-8. [Google Scholar]
- Avci Birsin, M. Effects of Removal of Some Photosynthetic Structures on Some Yield Components in Wheat. Tarim Bilim. Derg. 2005, 11, 1. [Google Scholar] [CrossRef] [Green Version]
- Mahmood, A.; Alam, K.; Salam, A.; Iqbal, S. Effect of flag leaf removal on grain yield, its components and quality of hexaploid wheat. Cereal Res. Commun. 1991, 19, 305–310. [Google Scholar]
- R Core Team. R: A Language and Environment for Statistical Computing; Statistical Computing; R Foundation: Vienna, Austria, 2022. [Google Scholar]
- Klöhn, H. Populationsgenetische Erhebungen von Weizenpathogenen zur Entwicklung Eines Lernfähigen, Telemetriefähigen Gerätesystems zur Pflanzenschutzoptimierung Anhand des Modellpathogens Septoria Tritici. Ph.D. Thesis, Christian-Albrechts-Universiät, Kiel, Germany, 2011. [Google Scholar]
- Ponomarenko, A.; Goodwin, S.B.; Kema, K. Septoria tritici blotch (STB) of wheat. Plant Health Instr. 2011. [Google Scholar] [CrossRef]
- Garin, G.; Pradal, C.; Fournier, C.; Claessen, D.; Houlès, V.; Robert, C. Modelling interaction dynamics between two foliar pathogens in wheat: A multi-scale approach. Ann. Bot. 2018, 121, 927–940. [Google Scholar] [CrossRef] [PubMed]
- Willocquet, L.; Aubertot, J.N.; Lebard, S.; Robert, C.; Lannou, C.; Savary, S. Simulating multiple pest damage in varying winter wheat production situations. Field Crops Res. 2008, 107, 12–28. [Google Scholar] [CrossRef]
- McDonald, B.A.; Mundt, C.C. How Knowledge of Pathogen Population Biology Informs Management of Septoria Tritici Blotch. Phytopathology 2016, 106, 948–955. [Google Scholar] [CrossRef] [PubMed] [Green Version]
- Prahl, K.C.; Klink, H.; Hasler, M.; Hagen, S.; Verreet, J.-A.; Birr, T. Can Decision Support Systems Help Improve the Sustainable Use of Fungicides in Wheat? Sustainability 2022, 14, 15599. [Google Scholar] [CrossRef]
- Volk, T.; Epke, K.; Gerstner, V.; Leuthner, C.; Rotterdam, A.; Johnen, A.; von Richthofen, S. Klimawandel in Nordrhein-Westfalen—Auswirkungen auf Schädlinge und Pilzkrankheiten Wichtiger Ackerbaukulturen. Available online: https://www.lanuv.nrw.de/fileadmin/lanuv/klimaanpassung/dokumente/bericht_klimawandel_schaedlinge.pdf (accessed on 28 January 2023).
- Gouache, D.; Bensadoun, A.; Brun, F.; Pagé, C.; Makowski, D.; Wallach, D. Modelling climate change impact on Septoria tritici blotch (STB) in France: Accounting for climate model and disease model uncertainty. Agric. For. Meteorol. 2013, 170, 242–252. [Google Scholar] [CrossRef]
- Lovell, D.J.; Hunter, T.; Powers, S.J.; Parker, S.R.; van den Bosch, F. Effect of temperature on latent period of septoria leaf blotch on winter wheat under outdoor conditions. Plant Pathol. 2004, 53, 170–181. [Google Scholar] [CrossRef]
- Chaloner, T.M.; Fones, H.N.; Varma, V.; Bebber, D.P.; Gurr, S.J. A new mechanistic model of weather-dependent Septoria tritici blotch disease risk. Philos. Trans. R. Soc. Lond. B Biol. Sci. 2019, 374, 20180266. [Google Scholar] [CrossRef] [Green Version]
- Klink, H. Geoepidemiologische Erhebungen von Weizenpathogenen in Schleswig-Holstein unter Anwendung und Entwicklung des Integrierten Pflanzenschutzsystems (IPS-Modell Weizen) für Einen Minimierten, Bedarfsgerechten Fungizideinsatz (1993–1996). Ph.D. Thesis, Christian-Albrechts-Universität, Kiel, Germany, 1997. [Google Scholar]
- Beyer, M.; Pallez-Barthel, M.; Dam, D.; Hoffmann, L.; El Jarroudi, M. Enhancing septoria leaf blotch forecasts in winter wheat I: The effect of temperature on the temporal distance between critical rainfall periods and the breaking of the control threshold. J. Plant. Dis. Prot. 2022, 129, 37–44. [Google Scholar] [CrossRef]
- Magboul, A.M. Environmental Influence on the Infection of Wheat by Mycosphaerella graminicola. Phytopathology 1992, 82, 1407. [Google Scholar] [CrossRef]
- Beyer, M.; Marozsak, B.; Dam, D.; Parisot, O.; Pallez-Barthel, M.; Hoffmann, L. Enhancing septoria leaf blotch forecasts in winter wheat II: Model architecture and validation results. J. Plant. Dis. Prot. 2022, 129, 45–51. [Google Scholar] [CrossRef]
- DWD Deutscher Wetterdienst. Time Series and Trends for the Parameters Temperature, Precipitation, Sunshine Duration and Various Climate Indices. Available online: https://www.dwd.de/EN/ourservices/zeitreihen/zeitreihen.html?nn=24778 (accessed on 28 January 2023).
- Jacob, D.; Petersen, J.; Eggert, B.; Alias, A.; Christensen, O.B.; Bouwer, L.M.; Braun, A.; Colette, A.; Déqué, M.; Georgievski, G.; et al. EURO-CORDEX: New high-resolution climate change projections for European impact research. Reg. Environ. Chang. 2014, 14, 563–578. [Google Scholar] [CrossRef]
- IPCC. Climate Change 2014: Synthesis Report. Contribution of Working Groups I, II and III to the Fifth Assessment Report of the Intergovernmental Panel on Climate Change; World Meteorological Organization (WMO): Geneva, Switzerland, 2014; ISBN 978-92-9169-143-2. [Google Scholar]
- DWD Deutscher Wetterdienst. Klimavorhersagen der Nächsten Wochen bis Jahre. Available online: https://www.dwd.de/DE/leistungen/kvhs_de/0_main/start_main.html (accessed on 2 February 2023).
- Gladders, P.; Paveley, N.D.; Barrie, I.A.; Hardwick, N.V.; HIMS, M.J.; Langdon, S.; Taylor, M.C. Agronomic and meteorological factors affecting the severity of leaf blotch caused by Mycosphaerella graminicola in commercial wheat crops in England. Ann. Appl. Biol. 2001, 138, 301–311. [Google Scholar] [CrossRef]
- Pietravalle, S.; Shaw, M.W.; Parker, S.R.; van den Bosch, F. Modeling of Relationships Between Weather and Septoria tritici Epidemics on Winter Wheat: A Critical Approach. Phytopathology 2003, 93, 1329–1339. [Google Scholar] [CrossRef] [Green Version]
- Iturbide, M.; Fernández, J.; Guitérrez, J.M.; Bedia, J.; Cimadevilla, E.; Díez-Sierra, J.; Manzanas, R.; Casanueva, A.; Baño-Medina, J.; Milovac, J.; et al. Repository supporting the implementation of FAIR principles in the IPCC-WGI Atlas. Sci. Data 2022, 9, 629. [Google Scholar] [CrossRef]
- Guitérrez, J.M.; Jones, R.G.; Narisma, G.T.; Alves, L.M.; Amjad, M.; Gorodetskaya, I.V.; Grose, M.; Klutse, N.; Krakovska, S.; Li, J.; et al. Atlas. In Climate Change 2021: The Physical Science Basis. Contribution of Working Group I to the Sixth Assessment Report of the Intergovernmental Panel on Climate Change; IPCC, Ed.; Cambridge University Press: Cambridge, UK; New York, NY, USA, 2021. [Google Scholar]
- Fealy, R.; Bruyère, C.; Duffy, C. Regional Climate Model Simulations for Ireland for the 21st Century: (2011-CCRP-MS-2.2); Online Version; Environmental Protection Agency; Johnstown Castle, Co.: Wexford, Ireland, 2018; ISBN 978-1-84095-770-9. [Google Scholar]
- Birr, T.; Hasler, M.; Verreet, J.-A.; Klink, H. Temporal Changes in Sensitivity of Zymoseptoria tritici Field Populations to Different Fungicidal Modes of Action. Agriculture 2021, 11, 269. [Google Scholar] [CrossRef]
- Klink, H.; Verreet, J.-A.; Hasler, M.; Birr, T. Will Triazoles Still Be of Importance in Disease Control of Zymoseptoria tritici in the Future? Agronomy 2021, 11, 933. [Google Scholar] [CrossRef]
- European Parliament. Commission Implementing Regulation (EU) 2015/408 of 11 March 2015 on implementing Article 80(7) of Regulation (EC) No 1107/2009 of the European Parliament and of the Council concerning the placing of plant protection products on the market and establishing a list of candidates for substitution. Off. J. Eur. Union 2015, 2015, 18–22. [Google Scholar]
- European Commission; Directorate-General for Health and Food Safety. Proposal for a Regulation of the European Parliament and of the Council on the sustainable use of plant protection products and amending Regulation (EU) 2021/2115. Off. J. Eur. Union 2022, 2022, 1–71. [Google Scholar]
- Tidd, H.; Rudd, J.J.; Ray, R.V.; Bryant, R.; Kanyuka, K. A large bioassay identifies Stb resistance genes that provide broad resistance against Septoria tritici blotch disease in the UK. Front. Plant Sci. 2022, 13, 1070986. [Google Scholar] [CrossRef] [PubMed]
- Saintenac, C.; Lee, W.-S.; Cambon, F.; Rudd, J.J.; King, R.C.; Marande, W.; Powers, S.J.; Bergès, H.; Phillips, A.L.; Uauy, C.; et al. Wheat receptor-kinase-like protein Stb6 controls gene-for-gene resistance to fungal pathogen Zymoseptoria tritici. Nat. Genet. 2018, 50, 368–374. [Google Scholar] [CrossRef] [PubMed]
- Stam, R.; McDonald, B.A. When resistance gene pyramids are not durable-the role of pathogen diversity. Mol. Plant. Pathol. 2018, 19, 521–524. [Google Scholar] [CrossRef] [Green Version]
- Orellana-Torrejon, C.; Vidal, T.; Saint-Jean, S.; Suffert, F. The impact of wheat cultivar mixtures on virulence dynamics in Zymoseptoria tritici populations persists after interseason sexual reproduction. Plant Pathol. 2022, 71, 1537–1549. [Google Scholar] [CrossRef]
- Orellana-Torrejon, C.; Vidal, T.; Boixel, A.-L.; Gélisse, S.; Saint-Jean, S.; Suffert, F. Annual dynamics of Zymoseptoria tritici populations in wheat cultivar mixtures: A compromise between the efficacy and durability of a recently broken-down resistance gene? Plant Pathol. 2022, 71, 289–303. [Google Scholar] [CrossRef]
Figure 1.
Occurrence of the major foliar diseases averaged from 1996 to 2021 at the trial location. RWAUDPC (xF−0–x−6 = 14%) of Septoria tritici blotch and glume blotch as n-pycnidia. RWAUDPC(xF−0–x−6=14%) of tan spot, powdery mildew, stripe rust, and leaf rust as % affected leaf area from GS 30 to GS 77.

Figure 2.
RWAUDPC(xF−0–x-F−2=33%; xF−3–x-F−6=0%) of STB (n-pycnidia) of the observation period (GS 30 to GS 77) from the survey period at the trial location. Dotted line describes the linear regression of disease severity.
Figure 2.
RWAUDPC(xF−0–x-F−2=33%; xF−3–x-F−6=0%) of STB (n-pycnidia) of the observation period (GS 30 to GS 77) from the survey period at the trial location. Dotted line describes the linear regression of disease severity.

Figure 3.
Mean temperature (°C; red line), total precipitation (L/m2; blue bars) of the observation period (GS 30 to GS 77) from the survey period at the trial location. Dotted lines describe the linear regressions of temperature and precipitation.
Figure 3.
Mean temperature (°C; red line), total precipitation (L/m2; blue bars) of the observation period (GS 30 to GS 77) from the survey period at the trial location. Dotted lines describe the linear regressions of temperature and precipitation.

Figure 4.
Epidemiological development of STB (n-pycnidia; black area) on the seven uppermost leaf layers in combination with the necrotized leaf area (%; gold line), prevailing weather conditions (temperature as red line; precipitation as blue bars; leaf wetness (%) as green area (duration of leaf wetness ≥ 98% is given in hours) as a function of the date), and growth stage of the survey years (A) 2018 and (B) 2019.

Figure 5.
(A) Initial (Ini.) infestation and final (Fin.) infestation of STB at the trial location of every year of the survey. (B) Temperature (red) and precipitation (blue) during leaf wetness periods over 24 h (light), 36 h (medium), and 48 h (solid) in four categories (temperature < 5 °C, 5–10 °C, 10–15 °C, and 15–20 °C; precipitation < 4 L/m2, 4–8 L/m2, 8–12 L/m2, 12–16 L/m2, and 16–20 L/m2), and (C) disease severities of STB (grey area) in combination with plant growth stages from the months May, June, and July.

Figure 6.
Average temperature (°C; red dots) and total precipitation (L/m2; blue dots) during the annual infection periods and estimated temperature (red line) and precipitation (blue line) of the regression analysis.
Figure 6.
Average temperature (°C; red dots) and total precipitation (L/m2; blue dots) during the annual infection periods and estimated temperature (red line) and precipitation (blue line) of the regression analysis.

Disclaimer/Publisher’s Note: The statements, opinions and data contained in all publications are solely those of the individual author(s) and contributor(s) and not of MDPI and/or the editor(s). MDPI and/or the editor(s) disclaim responsibility for any injury to people or property resulting from any ideas, methods, instructions or products referred to in the content. |
© 2023 by the authors. Licensee MDPI, Basel, Switzerland. This article is an open access article distributed under the terms and conditions of the Creative Commons Attribution (CC BY) license (https://creativecommons.org/licenses/by/4.0/).
Share and Cite
MDPI and ACS Style
Prahl, K.C.; Klink, H.; Hasler, M.; Verreet, J.-A.; Birr, T. Will Climate Change Affect the Disease Progression of Septoria Tritici Blotch in Northern Europe? Agronomy 2023, 13, 1005. https://doi.org/10.3390/agronomy13041005
AMA Style
Prahl KC, Klink H, Hasler M, Verreet J-A, Birr T. Will Climate Change Affect the Disease Progression of Septoria Tritici Blotch in Northern Europe? Agronomy. 2023; 13(4):1005. https://doi.org/10.3390/agronomy13041005
Chicago/Turabian StylePrahl, Ketel Christian, Holger Klink, Mario Hasler, Joseph-Alexander Verreet, and Tim Birr. 2023. "Will Climate Change Affect the Disease Progression of Septoria Tritici Blotch in Northern Europe?" Agronomy 13, no. 4: 1005. https://doi.org/10.3390/agronomy13041005
Note that from the first issue of 2016, this journal uses article numbers instead of page numbers. See further details here.