Article

Anaerobic Soil Disinfestation Promotes Soil Microbial Stability and Antagonistic Bacteria Abundance in Greenhouse Vegetable Production Systems

1
College of Resources and Environmental Sciences, China Agricultural University, Beijing 100193, China
2
Institute of Meteorology and Climate Research, Atmospheric Environmental Research, Karlsruhe Institute of Technology, 82467 Garmisch-Partenkirchen, Germany
3
College of Life Science and Technology, Hubei Engineering University, Xiaogan 432000, China
4
Pioneer Center for Research in Sustainable Agricultural Futures (Land-CRAFT), Department of Agroecology, Aarhus University, 8000 Aarhus, Denmark
*
Author to whom correspondence should be addressed.
Agronomy 2023, 13(3), 939; https://doi.org/10.3390/agronomy13030939
Submission received: 15 February 2023 / Revised: 17 March 2023 / Accepted: 20 March 2023 / Published: 22 March 2023

Abstract

:
Excessive water and fertiliser inputs, as well as long-term monocropping, not only cause resource waste and environmental pollution but also drive soil degradation and the occurrence of soil-borne diseases. Anaerobic soil disinfestation (ASD) is a widely used technique in greenhouse vegetable production to replace the use of agrochemicals in disinfestation and improve product quality. While the short-term effects of ASD on the soil microbial community have been well documented in the past 15 years, only a few studies have investigated the multiseason effects of ASD, particularly on the soil microbial community composition and stability, as well as on pathogens and antagonistic microorganisms. Field experiments were conducted in three adjacent greenhouses used for tomato production for at least 20 years. Three treatments were included: CK (control: no irrigation, no plastic film covering, incorporation of chicken manure), ASD (irrigation, plastic film covering, and incorporation of rice husks), and ASD+M (ASD plus incorporation of chicken manure). Results showed that (1) ASD significantly reduced the diversity of soil bacteria and fungi and improved the complexity and stability of the soil bacterial community at the end of the ASD, but the soil microbial diversity recovered to the level before the experiment after 1.5 years. (2) Compared with CK, ASD significantly increased the relative abundance of antagonistic bacteria Bacillus, Paenibacillus and Streptomyces, decreased the relative abundance of pathogens Fusarium and the quantity of nematodes and could still effectively eliminate soil pathogens after 1.5 years. (3) Chicken manure application did not increase the pathogenic microorganisms Fusarium and nematodes, but it significantly decreased the relative abundance of antagonistic bacteria. Our results highlight that ASD not only showed an inhibitory effect on soil-borne diseases after 1.5 years but also significantly increased the relative abundance of antagonistic bacteria. However, the additional incorporation of chicken manure for ASD should be avoided due to its negative effects on the abundance of antagonistic bacteria and its contribution to environmental pollution due to N leaching and increased emissions of GHG N2O.

1. Introduction

Off-season vegetable production in greenhouses plays an important role in meeting the increasing demand for vegetables due to a growing population [1,2]. China has experienced significant growth in greenhouse vegetable production over the past three decades, with a production area of 4.7 million hectares [3]. In northern China, where winter temperatures can drop to as low as −20 °C, unheated sunken solar greenhouses are used to produce off-season vegetables such as tomatoes, cucumbers, and eggplant. This technology has spread quickly to other countries, including Russia, Japan, and Korea, due to its simplicity [4].
During winter nights, the roofs of sunken solar greenhouses (located 0.5–2.0 m underground) are covered with 1.5 cm thick thermal insulation felt to maintain the minimum temperature inside the greenhouse above 10 °C [5]. However, since fertile topsoil is used to build the back wall of solar greenhouses, the remaining soil’s water and nutrient holding capacity is too low to support vegetable crop production [5,6]. Consequently, high rates of nitrogen fertiliser (up to 2000 kg N ha−1 yr−1) and irrigation (1500–2000 mm yr−1) are applied, which exceed crop water and nutrient demands by 4–6 times [6,7]. Furthermore, due to farmers’ cultivation habits and simple marketing channels, vegetables are typically cropped for decades [8]. These factors contribute to environmental pollution [9], soil degradation [10], an increase in soil-borne diseases and an imbalance in the soil microbial community [11].
Chemical soil disinfestations are effective measures to control soil-borne diseases and continuous cropping obstacles [12]. However, these methods inevitably produce secondary environmental pollution and reduce the quality of agricultural products [13]. Anaerobic soil disinfestation (ASD) has been developed and widely used in Japan, the Netherlands and the United States [14]. The principle of this approach is to create an anaerobic soil environment by adding organic amendments with a high C/N ratio into the soil during the summer high-temperature fallow period (July), followed by irrigating the soil to water saturation and covering it with plastic film to induce full soil anaerobicity for 20–25 days [15]. ASD is usually conducted every three to four years and has been found to effectively control soil-borne pests and diseases [16,17]. However, most reports only assess the seasonal effects of ASD, and observations on multiseason effects on soil microbial communities and soil-borne diseases are lacking. In China, the usual ASD practice has been modified since the Chinese government introduced a series of subsidy policies, such as the “Action Plan for Zero Growth of Fertiliser Use by 2020”, to promote the use of organic fertilisers. Vegetable farmers have started to use large amounts of organic fertilisers, such as chicken and cow manure, for the ASD [7], although the overuse of chicken manure may result in serious environmental pollution [7,9]. However, whether the use of chicken manure for ASD affects the soil microbial community and diminishes its effect on soil-borne diseases has yet to be reported.
To address these points, we monitored the effects of a 25-day ASD period and its post-effect (1.5 years after the ASD) in three adjacent greenhouses used for over 20 years for tomato production on soil microbial diversity, community composition, network complexity, relative abundance of pathogenic fungi and antagonistic bacteria and nematode numbers. Soil samples were collected during the ASD period and 1.5 years after the ASD. Our hypotheses are as follows: (1) Compared with the control (without ASD measures), ASD effectively improves the complexity and stability of the bacterial network; (2) ASD induces changes in the soil microbial composition for more than one season and remains detectable after 1.5 years; and (3) Compared with classical ASD, the incorporation of chicken manure for ASD has no significant additional effect on the soil microbial community or the abundance of soil-borne diseases.

2. Materials and Methods

2.1. Description of the Experimental Site

An initial ASD experiment was conducted in Luojiazhuang village, Shouguang city (36°55′ N; 118°44′ E), from 26 June to 22 July 2019, to assess the immediate effects, with sites resampled on 30 December 2020, to evaluate the post-effects. The region has an average annual precipitation and temperature of 592 mm and 12.4 °C, respectively [18]. The minimum temperature in winter is −12 °C, and the maximum temperature in summer is 39 °C. Three adjacent greenhouses (<100 m) were built in 1999 and have since been used to produce tomatoes (Solanum lycopersicum. L.) during two growing seasons each year: winter−spring (WS) and autumn−winter (AW). The summer fallow period between the two growing seasons lasts approximately 1.5 months (late June to mid-August). Soil type is classified as meadow cinnamon with soil organic carbon 1.2 ± 0.15 g kg−1, C/N ratio 6.6 ± 0.21, pH 7.1 ± 0.14, the electrical conductivity 479 ± 53.1 µs cm−1, and the inorganic nitrogen content 143 ± 8.7 mg kg−1 at the topsoil (0–30 cm) [2]. The topsoil texture was sandy loam with sand (20–2000 µm) 62 ± 2.1%, silt (2–20 µm) 34 ± 1.9% and clay (<2 µm) 4 ± 0.2%. The soil physicochemical properties of the three selected greenhouses were basically the same.

2.2. Experimental Design and Field Management

A field experiment was performed in three adjacent greenhouses with a randomized plot design in each greenhouse. The three greenhouses had areas of 8.2 m × 142 m, 9 m × 133 m, and 7.6 m × 119 m, respectively. The three treatments were as follows: (1) control (CK), which involved usual field management with chicken manure (Runqiang Fertiliser Co., Ltd., Shouguang, China) application but no irrigation or covering with plastic film (Runqiang Fertiliser Co., Ltd., Shouguang, China); (2) ASD, the standard procedure, which included incorporating rice husks (Runqiang Fertiliser Co., Ltd., Shouguang, China), applying irrigation water to soil saturation, and covering the soil with plastic film; and (3) ASD+M (ASD plus chicken manure). Each treatment was replicated six times, with two replicates in each greenhouse. Each plot had an area of 14.5 m × 8.2 m, including 10 raised beds.
In the CK treatment plots, 522 kg N ha−1 of chicken manure (fresh material-based rate 12 t ha−1) was applied to the surface soil (0–20 cm). In the ASD treatment plots, 8.8 t C ha−1 of rice husks (fresh material-based rate 23 t ha−1) were incorporated into the soil. The carbon, nitrogen and water content of rice husks was 38.2%, 0.51% and 8% respectively, while for the chicken manure it was 34.8%, 4.35% and 11%, respectively. The ASD+M treatment plots received rice husks together with the chicken manure (8.8 t C ha−1 and 522 kg N ha−1). All ASD and ASD+M plots, except for the CK plots, were covered with transparent polyethylene film after ploughing. The ASD and ASD+M treatment plots received 129 mm of flood irrigation on 27 June 2019 to increase the soil water content to saturation.
After plot preparation, the greenhouses were completely closed for 25 days (27 June–22 July 2019), which increased indoor air temperatures up to 60 °C during the daytime. On 22 July, the plastic films were removed, and the greenhouses were opened. Before 29 July 2019, one-month-old tomato seedlings were transplanted. Thereafter, all treatment plots were flood irrigated with approximately 115 mm. In the following tomato growing season, flood irrigation was performed every six to fifteen days. For the ASD treatment, the average nitrogen application amount was 80 kg N ha−1, and the average irrigation amount was 553 mm for the three greenhouses. The average nitrogen application amount of the CK and ASD+M treatments was 118 kg N ha−1, and the average irrigation amount was 722 mm [2]. In the three growing seasons during the 1.5-year post-ASD period, the average annual application rate of nitrogen fertiliser was 1800 kg N ha−1 yr−1, and the annual irrigation rate was 1400 mm yr−1 according to the usual field management by local farmers.

2.3. Soil Sample Collection, DNA Extraction and High-Throughput Sequencing

A 4 cm-diameter soil drill was used to collect 0–30 cm surface soil samples at days 0, 8, 17 and 25 during the ASD period in June/July 2019. Among them, soil samples in 25 days were taken after the plastic film had been removed. In addition, soils were resampled 1.5 years after that period on 30 December 2020. For each plot, three sub-samples were collected, mixed to form a composite soil sample, and sieved through a 2 mm mesh. The samples were divided into two parts and stored at −20 °C and −80 °C, for subsequent analysis of soil physicochemical properties and molecular biology. The soil inorganic nitrogen content was analysed using an autoanalyzer (AA3; Bran + Luebe, Nordstadt Hamburg, Germany). Soil organic carbon and total N content were measured by using an elemental analyser (Flash-EA 1112; Thermo Electron Inc., Milan, Italy). The electrical conductivity and pH were determined using EC (FE30; Mettler Toledo Inc., Zurich, Switzerland) and pH meters (IS126; Insmark Instrument Technology Co., Ltd., Shanghai, China) with a soil: water solution ratio of 1:5, respectively. Soil nematodes were isolated and extracted from 100 g fresh soil samples by a shallow dish method and counted with a microscope (Olympus Inc., Tokyo, Japan) [14].
After extracting soil DNA from 0.5 g of a freeze-dried sample according to the FastDNA Kit (MP Biomedicals LLC, Santa Ana, CA, USA) operating manual, a NanoDrop® ND-2000c ultramicronic nucleic acid protein analyser (NanoDrop Technologies, Wilmington, DE, USA) was used to detect the concentration and quality of the extracted DNA. The qualified DNA samples were then stored in a −80 °C refrigerator. The primers selected for bacteria polymerase chain reaction (PCR) were barcoded-515F (GTGCCAGCMGCCGCGGTAA) and barcoded-806R (GGACTACVSGGGTATCTAAT) [19]. The primers selected for fungi were barcoded-ITS1 (CTTGGTCATTTAGAGGAAGTAA) and barcoded-ITS2 (TGCGTT CTTCATCGATGC) [20]. The PCR product was purified directly, and a 1% agarose gel was prepared. Samples were added to TAE buffer and electrophoresed at 120 V for 30 min. The gel was cut with the target band under an ultraviolet lamp and purified with a PCR product purification kit (Aidlab Biotechnologies Co., Ltd., Beijing, China). Sequencing libraries were generated using NEBNext® Ultra™ II DNA Library Prep Kit for Illumina® (New England Biolabs, Ipswich, MA, USA) following the manufacturer’s recommendations and index codes were added: (1) Adapter ligation; (2) Screening and removing the self-connecting fragment of adapter by using magnetic bead; (3) Enrichment of library templates by PCR amplification; (4) Post-PCR clean-up. The library quality was assessed on the Qubit@ 2.0 Fluorometer (Thermo Fisher Scientific, Peabody, MA, USA). Finally, the library was sequenced on an Illumina Nova6000 platform (Magigene Technology Co., Ltd., Guangzhou, Guangdong, China).

2.4. Bioinformatics Analysis

Cutadapt (https://github.com/marcelm/cutadapt/; accessed on 1 December 2022) was used for removing primers, and usearch-fastq_mergepairs (V10, http://www.drive5.com/usearch/; accessed on 1 December 2022) were applied to filter the non-matching tags and obtain the raw tags. UPARSE was used for operational taxonomic unit (OTU) clustering with a threshold of 97%, and taxonomic assignment was conducted by using the SILVA (16S) and Unite (ITS) databases. Alpha diversity was characterised by the Shannon index. Beta diversity was evaluated by calculating the Bray−Curtis distance. Network construction and data analysis were performed by the MENA platform (http://ieg4.rccc.ou.edu/mena; accessed on 25 December 2022) [21]. Network analysis determines the correlation of two microorganisms by the Spearman correlation coefficient. Only similar values above a specific threshold were used to calculate matrix eigenvalues, and the results were then visualised using Cytoscape (version 3.8.2; JetBrains, Prague, Czech Republic).

2.5. Statistical Analysis

SAS software (version 8.0; SAS Institute Inc., Cary, NC, USA) was used for statistical analysis. A Shapiro−Wilk test was used to check the normality of all data. The mixed linear model PROC MIXED was used for two-way variance analysis (ANOVA) to analyse the effects of different disinfestation days and treatments on soil pathogens, nematodes and antagonistic bacteria. A Duncan’s multiple comparison test was then performed to determine the significance among factors (p < 0.05). On the basis of the OTU table, R software (version 4.1.0; R Foundation for Statistical Computing, Vienna, Austria) was used to analyse the effects of different disinfestation days and treatments on the Shannon index and soil microbial community structure. The vegan R package (v.2.5-2; R Foundation for Statistical Computing, Vienna, Austria) was used for data processing and statistical analysis (https://cran.r-project.org/package=vegan; accessed on 12 December 2022). The correlations between soil physicochemical properties and soil microbial communities were analysed by Pearson’s correlation.

3. Results

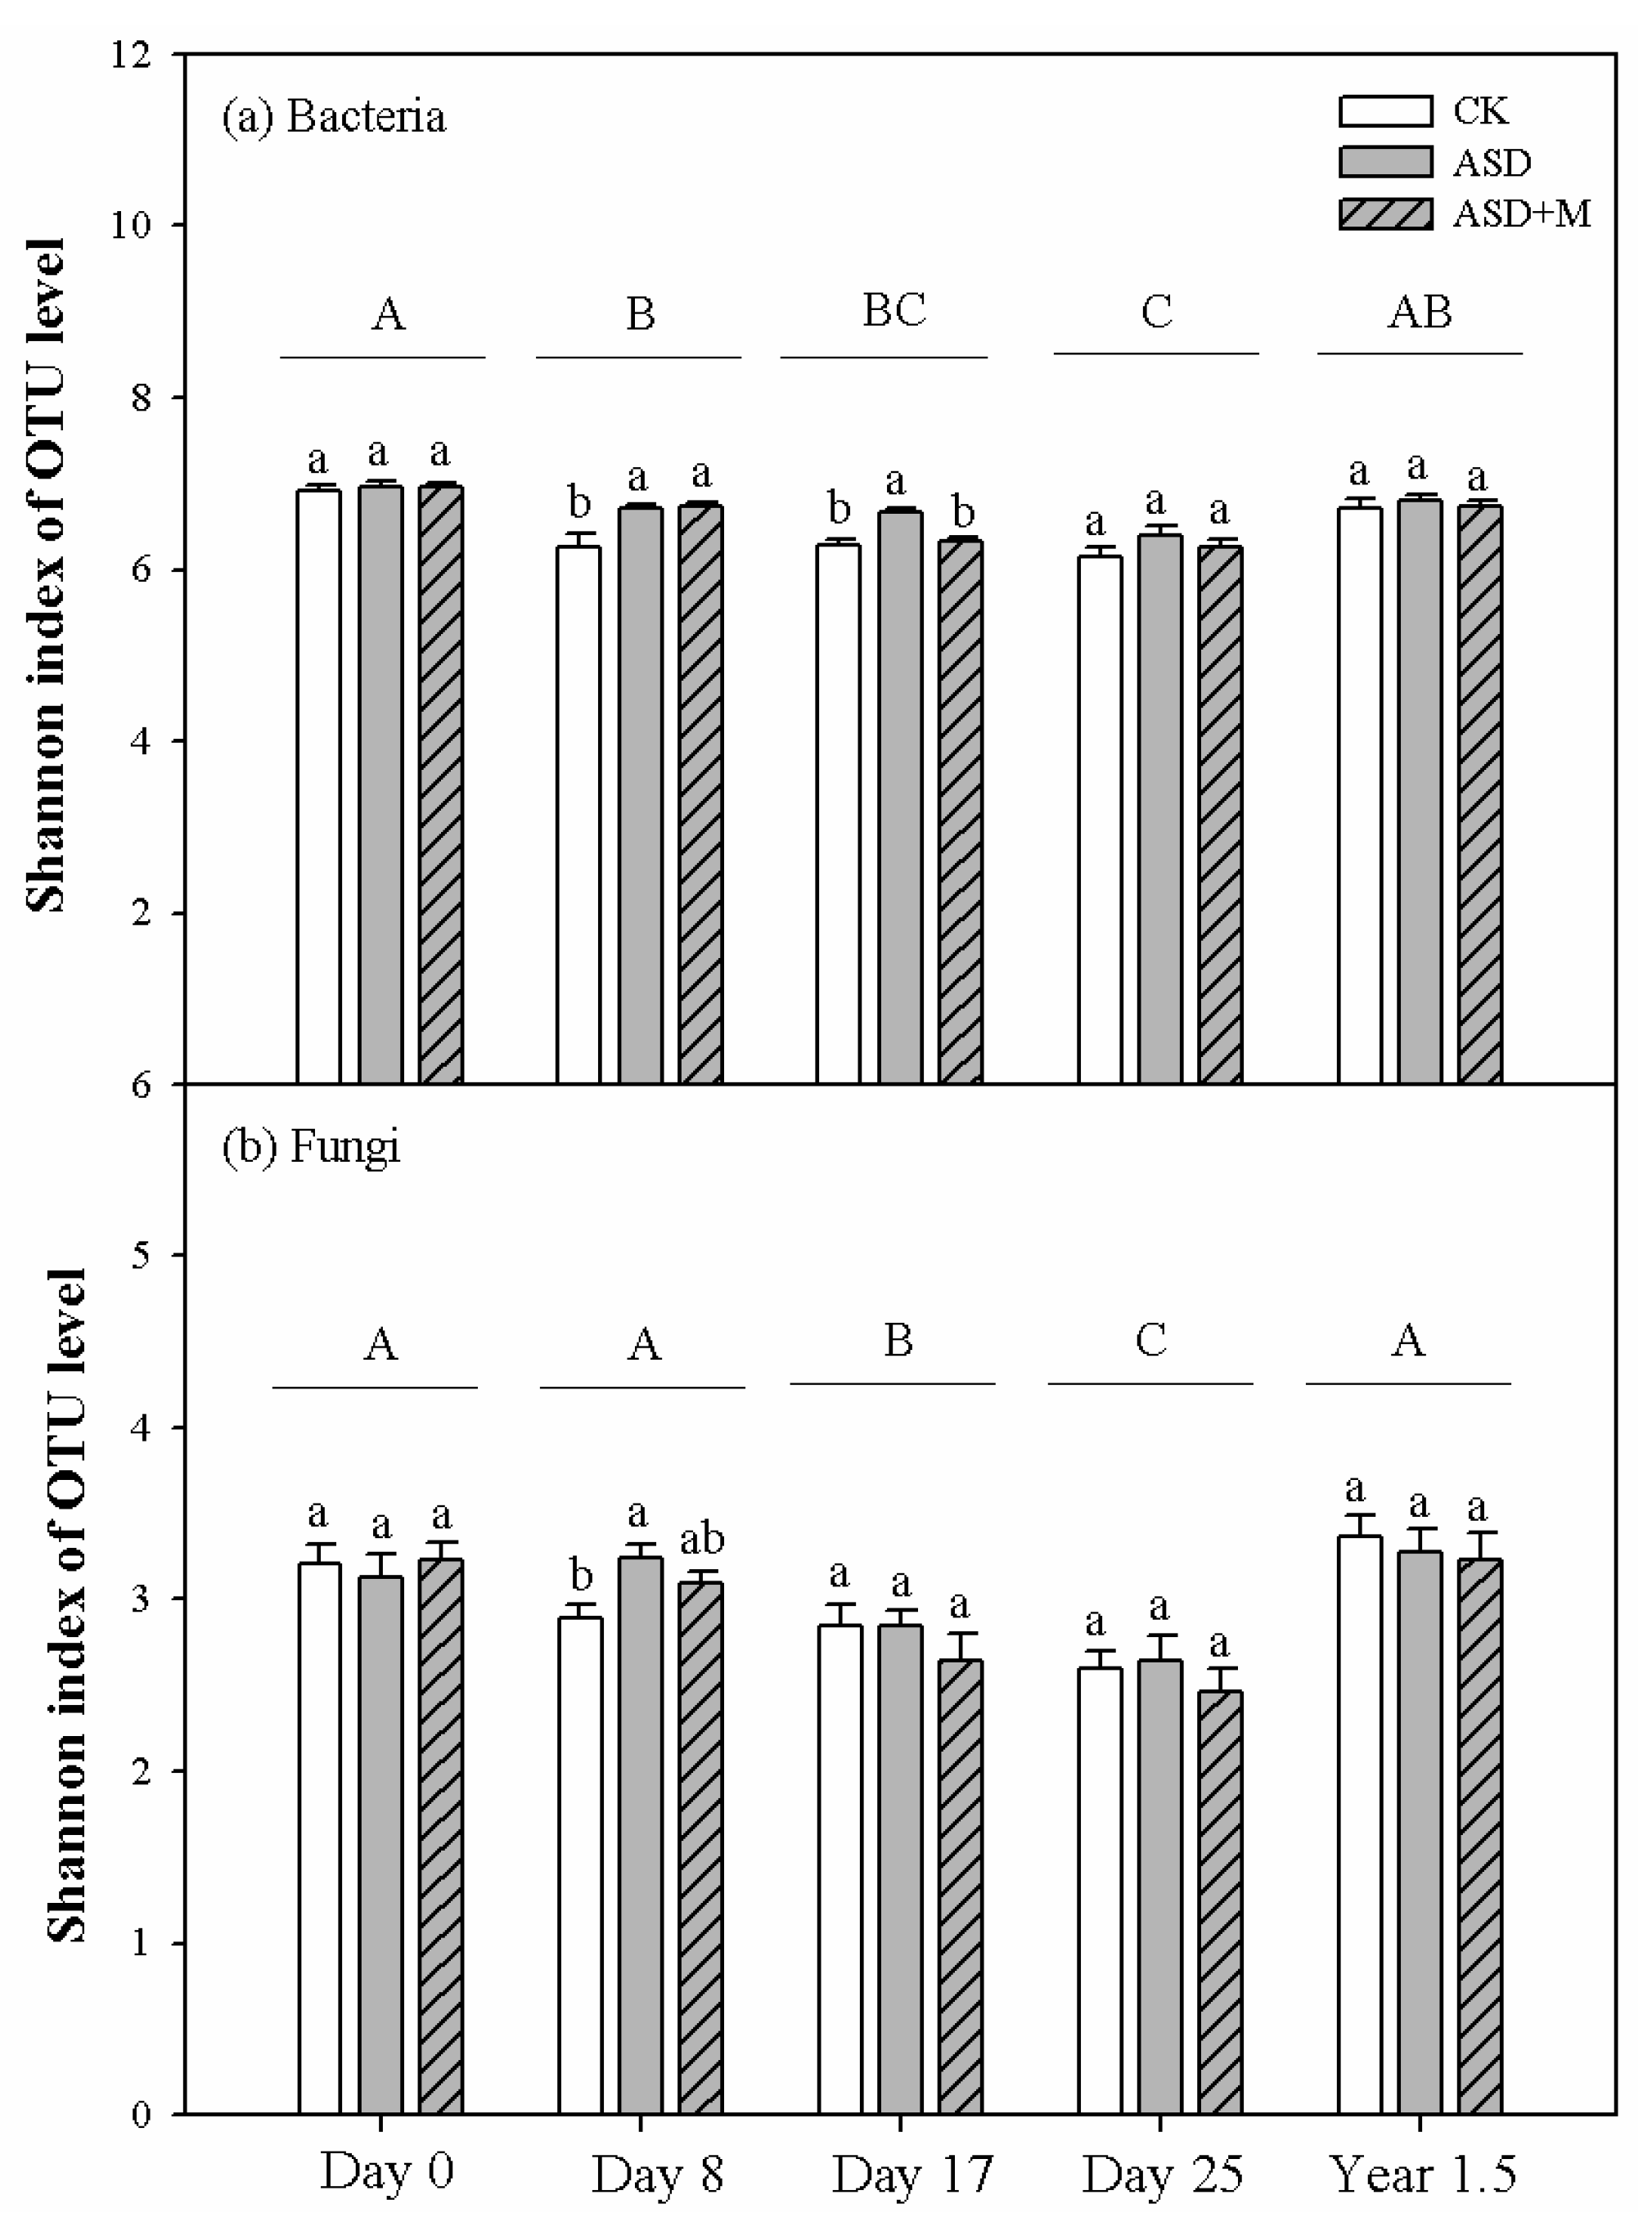
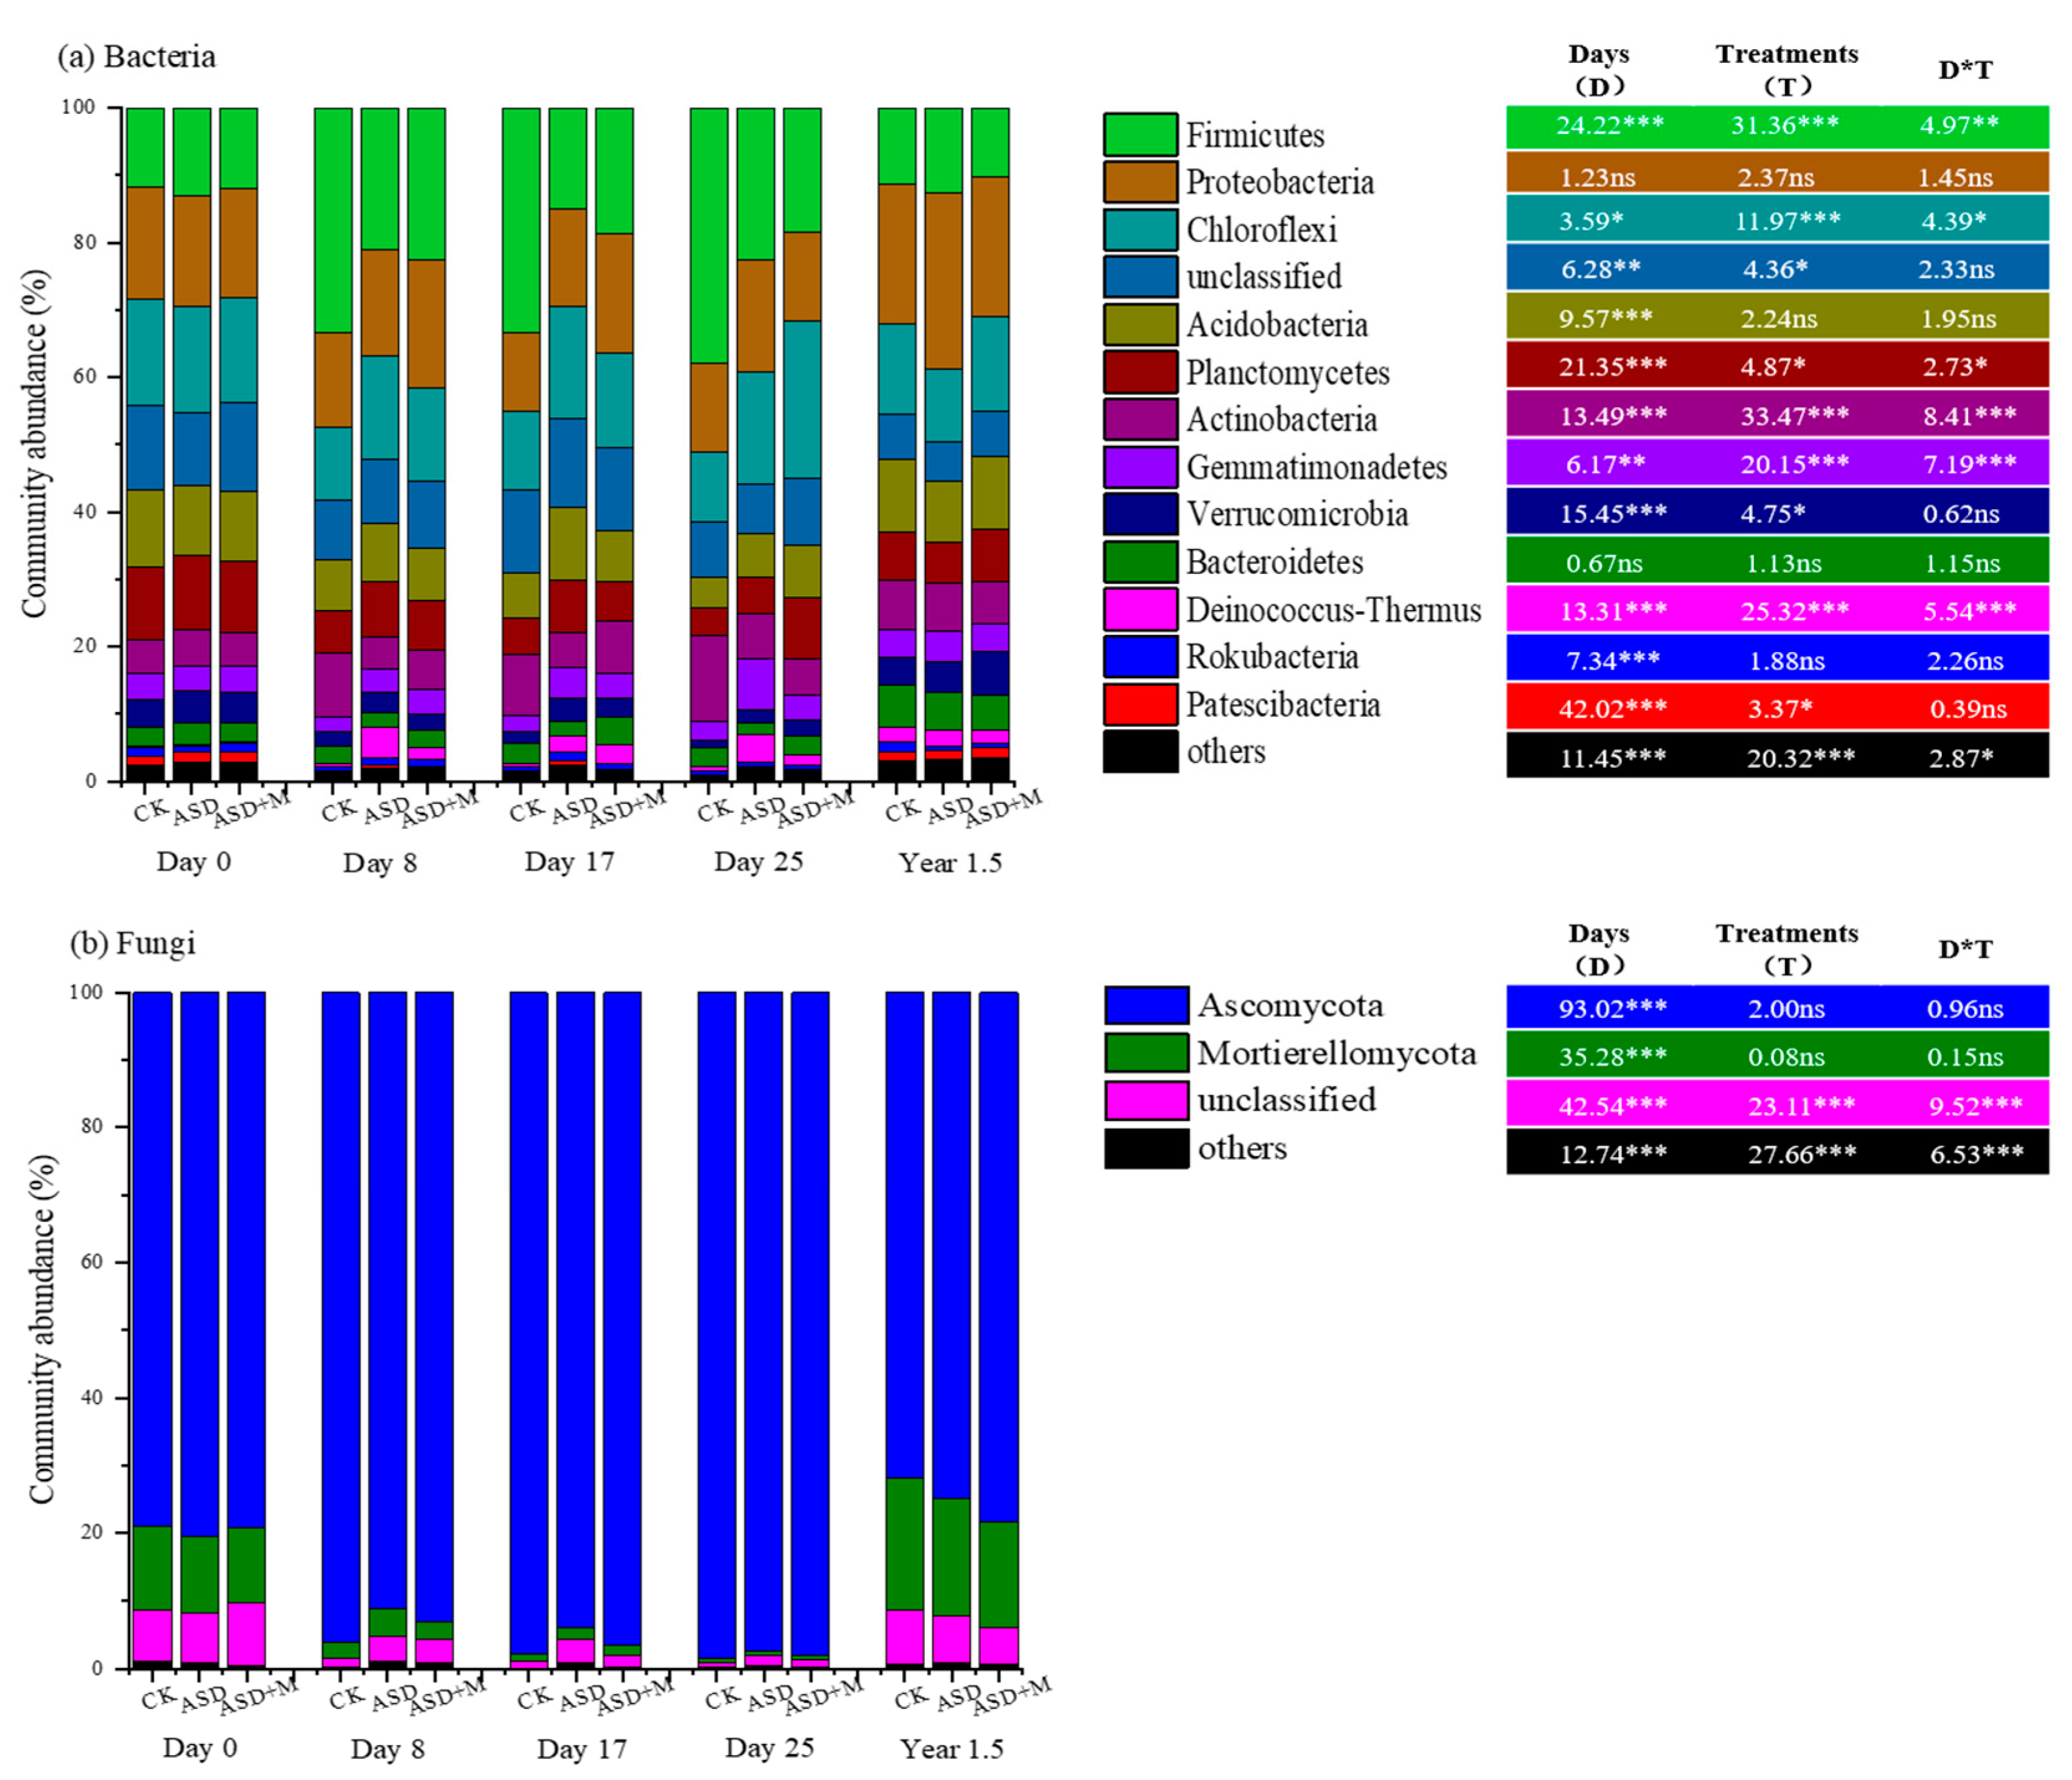
3.1. Soil Microbial Diversity and Composition

Compared with Day 0, the average Shannon index of bacteria and fungi significantly decreased at the end of the ASD (Day 25) (Figure 1; Table 1; p < 0.05). At 1.5 years after the ASD, the average Shannon index of bacteria and fungi returned to the original level before the experiment. No significant differences were found between treatments except during ASD periods (Days 8 and 17). The bacterial and fungal Shannon indices were negatively correlated with the soil NO3 and NH4+ concentrations, respectively (Figure 2; p < 0.05).
Principal coordinate analysis (PCoA) showed significant clustering distribution of soil microbial community composition before (Day 0) and after (Day 25) ASD, with axes 1 and 2 explaining 23.7% and 14.8% of the total bacterial community variation and 22.6% and 14.5% of the fungal community variation (Figure 3; p = 0.001). The composition of the microbial communities cannot be clearly differentiated according to the different treatments but according to the time chronology. After 1.5 years, it showed an intermediate position between the soils currently treated and the initial soil along the x-axis with the highest explanatory value (Figure 3). The top nine bacterial communities with relative abundance greater than 2% accounted for about 90% of all identifiable phylum (Figure 4a). Among them, the relative abundance of Firmicutes and Actinobacteria showed a significant positive correlation with soil NO3 and NH4+ concentrations, respectively (Figure 2a; p < 0.05). The relative abundance of Acidobacteria, Planctomycetes and Verrucomicrobia was negatively correlated with soil NO3 and NH4+ concentrations (Figure 2a; p < 0.05). Compared with day 0, the relative abundance of Firmicutes in each treatment increased significantly on Days 8, 17 and 25 (Figure 4a; p < 0.05). The relative abundance of Firmicutes in the CK treatment was higher than that in both ASD and ASD+M treatments. In all identifiable genera, Bacillus was the dominant taxa in each treatment (Figure S1a). Except for Day 0, the relative abundance of Bacillus in the ASD treatment was highest in each sampling time. In the fungal community, the relative abundance of Ascomycota and Mortierellomycota accounted for about 90% of all identifiable phyla (Figure 4b). The relative abundance of Ascomycota was positively correlated with soil NO3 and NH4+ concentrations (Figure 2b; p < 0.05). Mortierellomycota showed a significant negative correlation with soil NO3 and NH4+ concentrations (Figure 2b; p < 0.05). Compared with Day 0, the relative abundance of Ascomycota increased significantly in each treatment during ASD periods, while Mortierellomycota decreased (Figure 4b; p < 0.05). At the genus level, the relative abundance of Mycothermus was significantly lower in the CK treatment than in ASD treatments; in contrast, the relative abundance of Cephaliophora was higher in the CK (Figure S1b).

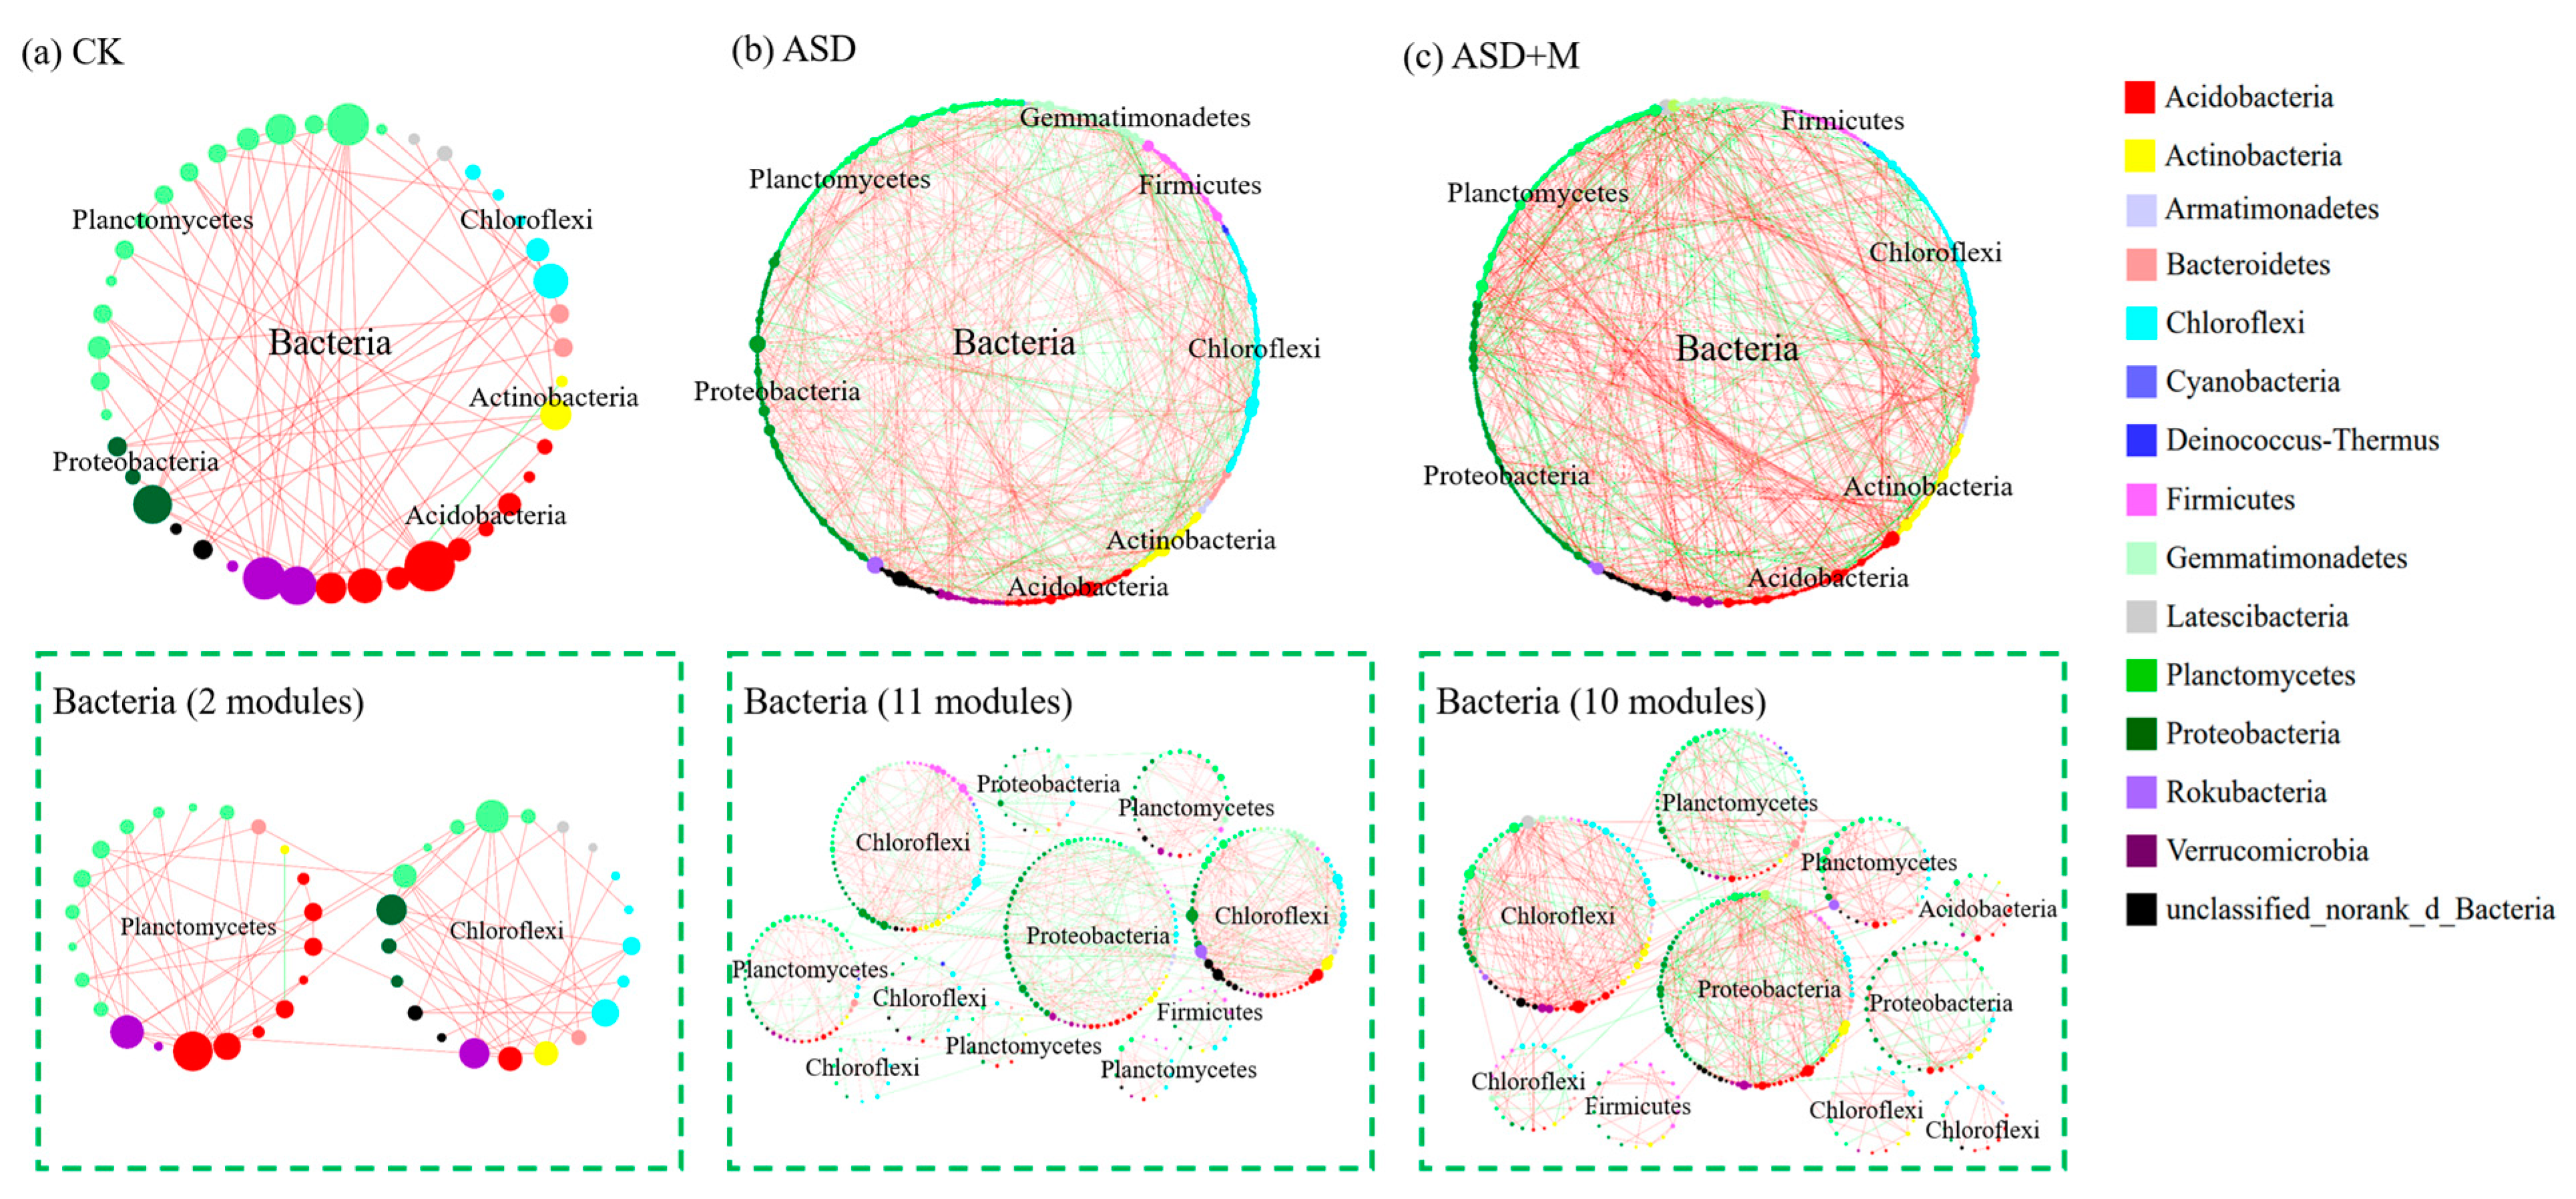
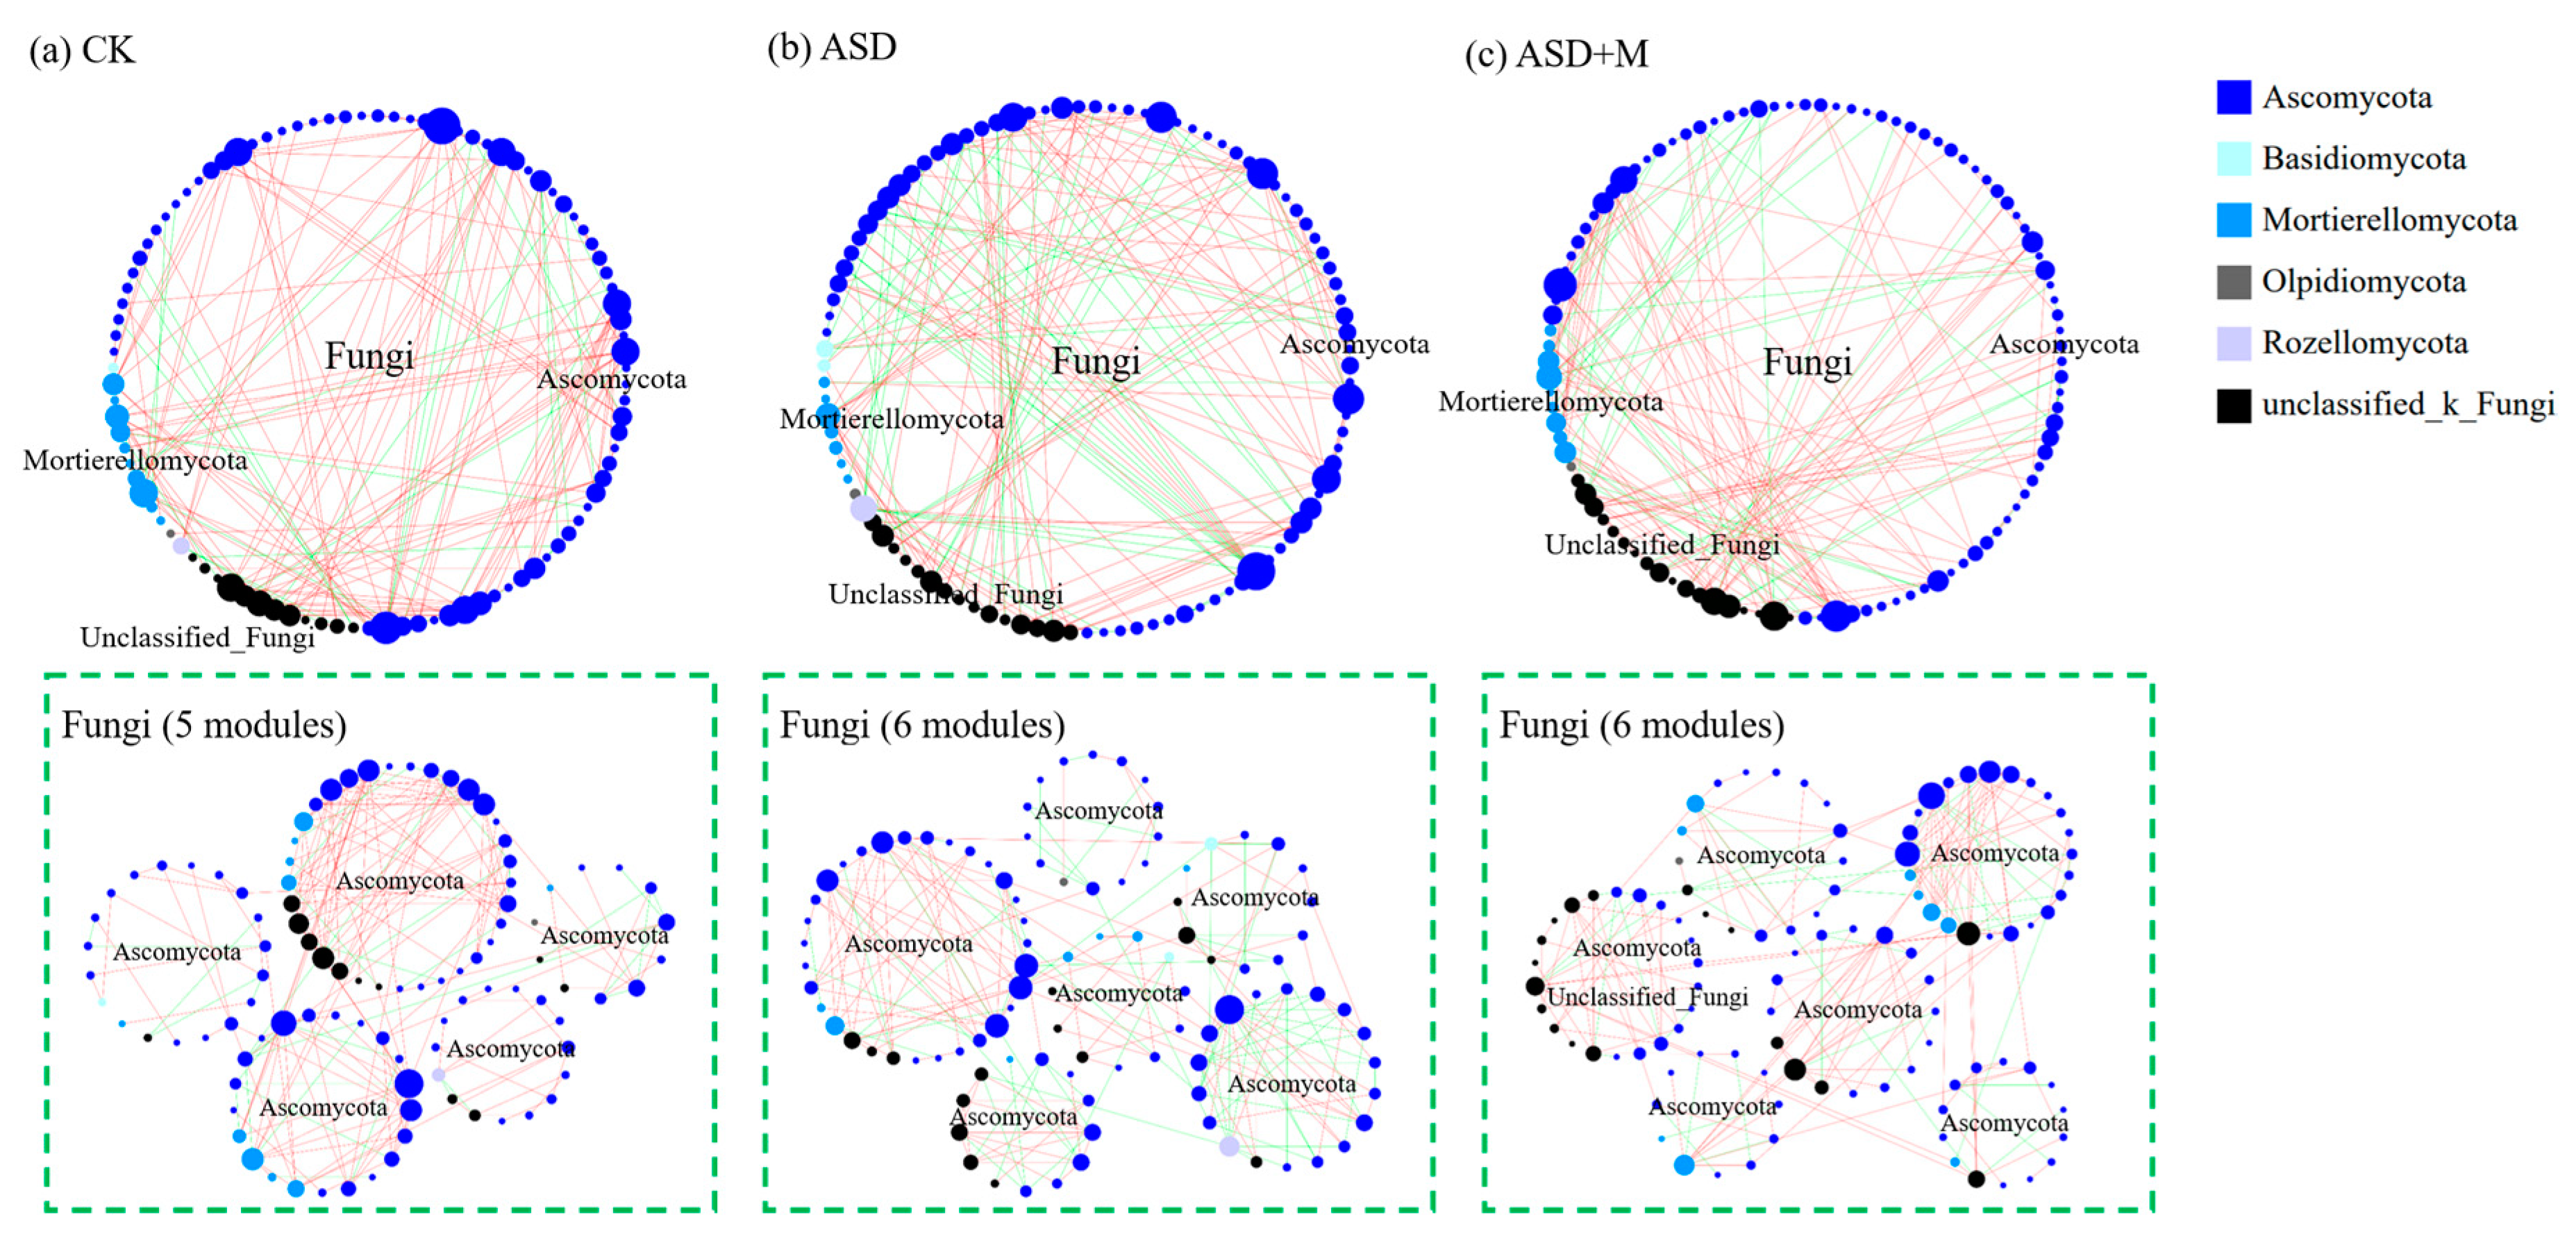
3.2. Soil Microbial Network Complexity

The co-occurrence networks of soil bacterial communities differed significantly between the treatments (Figure 5 and Table S1). The number of nodes, links, and modules (nodes ≥ 10) as well as the average degree of connectivity were significantly higher in the ASD and ASD+M treatments than in the CK treatment (Figure 5 and Table S1). No significant difference was found between ASD and ASD+M treatments. Furthermore, bacterial community network analysis revealed that the number of keystone species increased from one in the CK treatment to 12 in the ASD treatment and 14 in the ASD+M treatment (Figure S2a–c). The co-occurrence networks of soil fungal communities under different treatments were similar, with the module numbers in the CK treatment (nodes ≥ 10) being 5 and those in the ASD and ASD+M treatments being 6 (Figure 6 and Table S2). Fungal network analysis indicated that the keystones species in the ASD treatment were OTU333 (Ascomycota) and OTU692 (unclassified fungi), while those in the ASD+M treatment were OTU791 (Ascomycota) and OTU2700 (Mortierellomycota) (Figure S2d–f).

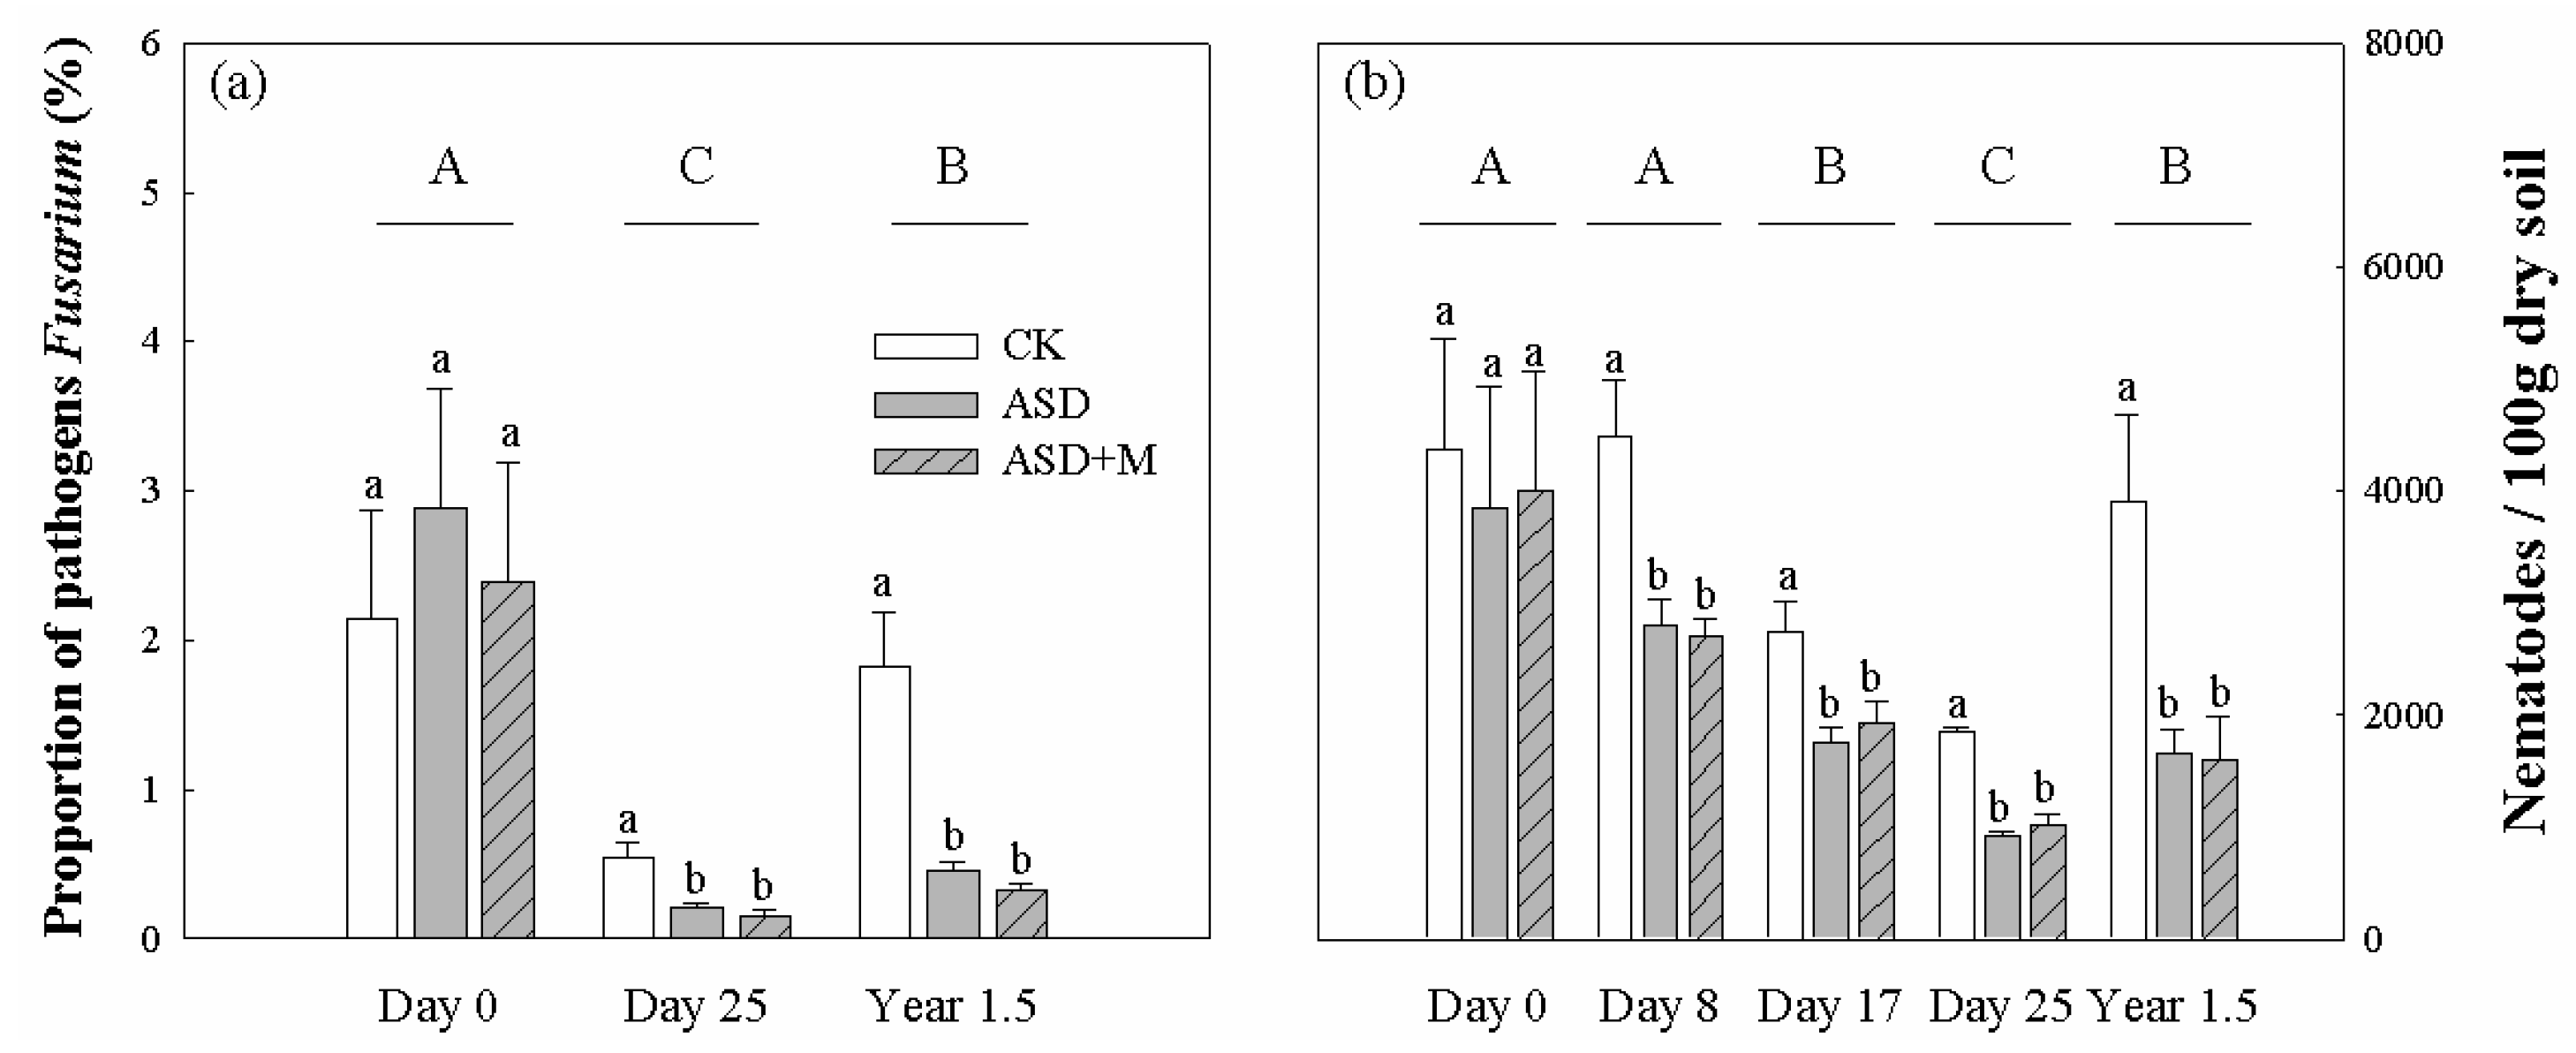
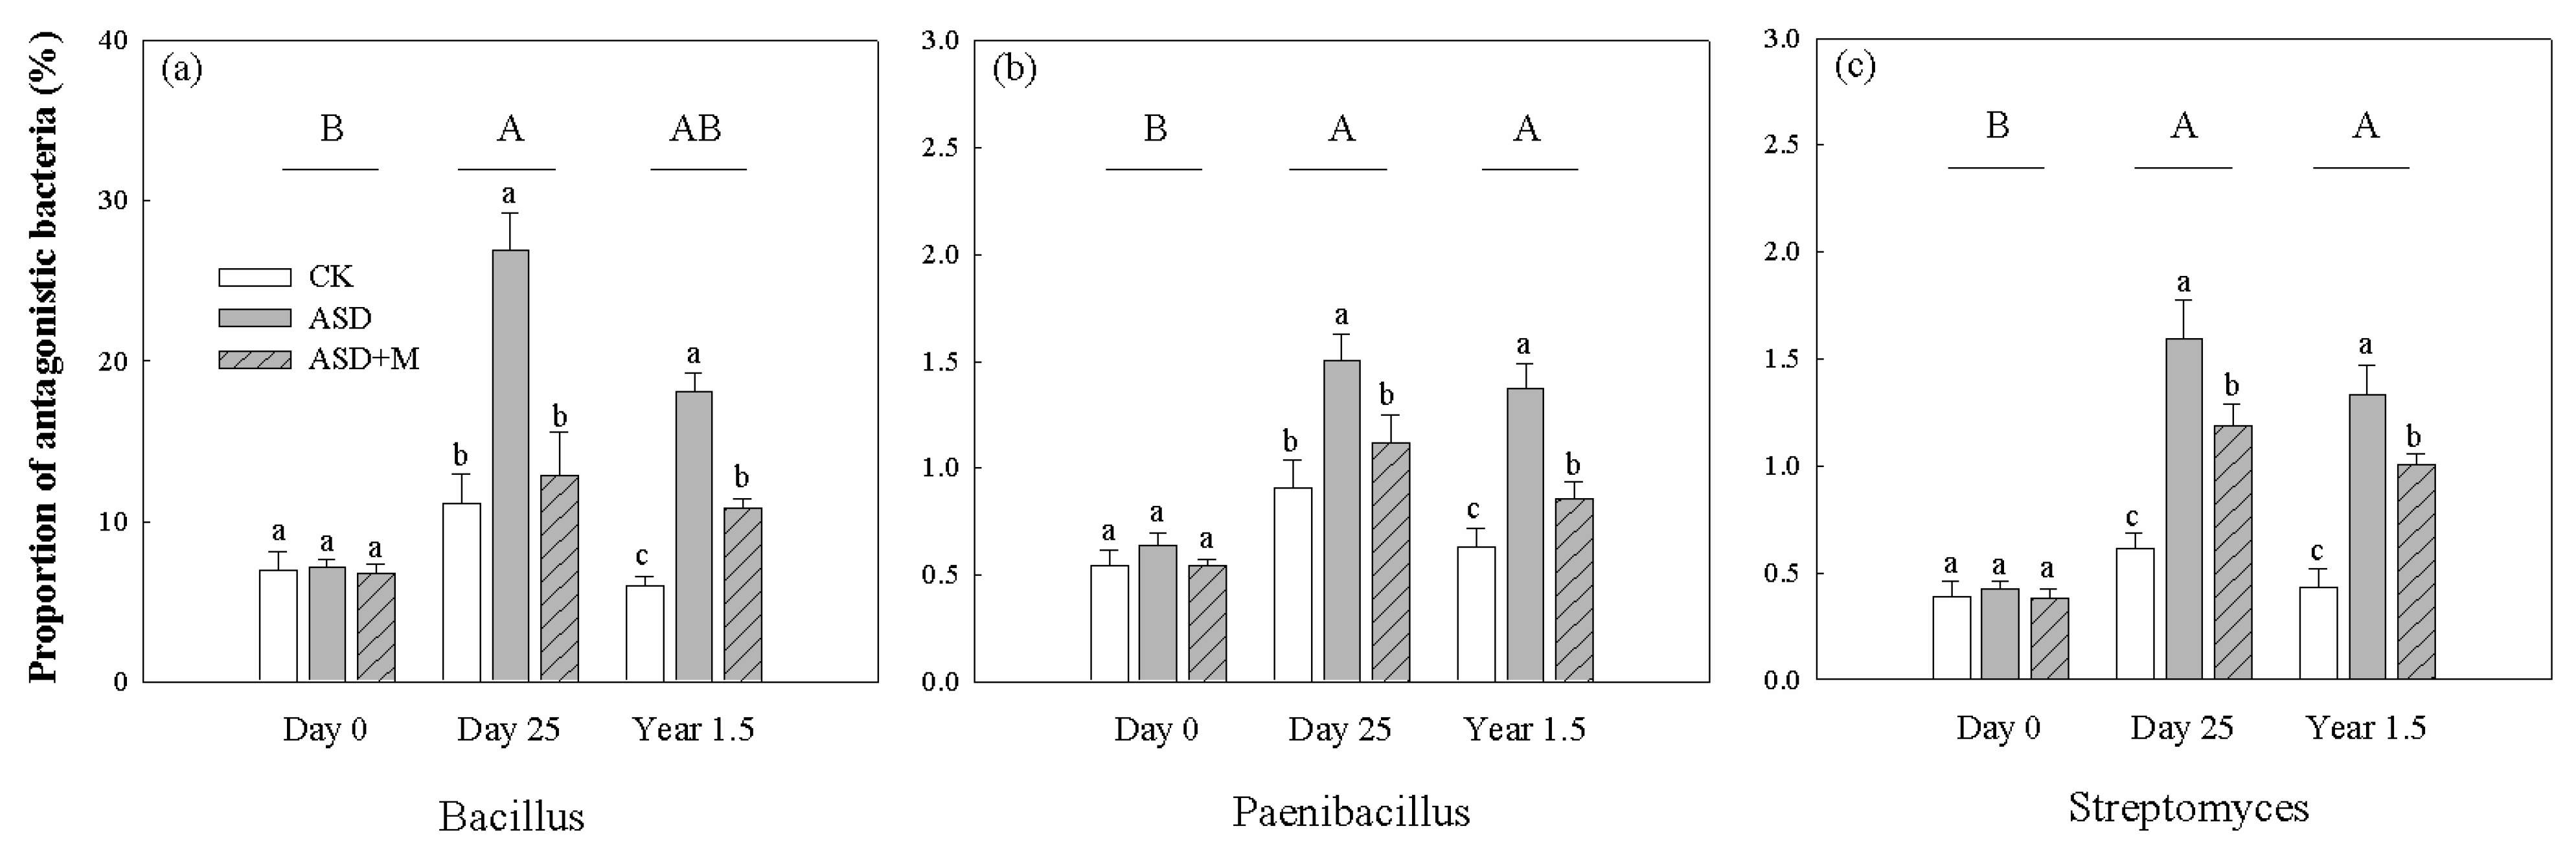
3.3. Plant Pathogens, Soil Nematodes and Antagonistic Bacteria

The average relative abundance of Fusarium, a pathogen that causes tomato wilt, decreased significantly from 2.5% to 0.3% at the end of the ASD period (Day 25) compared to Day 0 (Figure 7a; p < 0.05). However, the average relative abundance of Fusarium in all treatments rebounded at 1.5 years after the ASD, with the largest rebound observed in the control treatment, which recovered to the level before the experiment and was three to four times higher than that in the ASD and ASD+M treatments (Figure 7a; p < 0.05). The average number of nematodes per 100 g of dry soil also significantly decreased from 4079 on Day 0 to 1268 on Day 25 (Figure 7b; p < 0.05). However, soil nematodes in all treatments rebounded at 1.5 years after the ASD, with the control treatment recovering to the original level before the experiment, which was significantly higher than that of the ASD and ASD+M treatments (Figure 7b; p < 0.05).
The relative abundance of the antagonistic bacteria Bacillus, Paenibacillus and Streptomyces significantly increased on Day 25 compared with that before the experiment (Day 0) and fell back at 1.5 years after the ASD (Figure 8a, p < 0.05). Before the experiment, no significant difference was found in the relative abundance of Bacillus between the three treatments. However, the relative abundance of Bacillus in the ASD treatment was significantly higher than that in the CK and ASD+M treatments on Day 25 and at 1.5 years. The antagonistic bacteria Paenibacillus and Streptomyces with relative abundances greater than 1% at the genus level showed similar trends to Bacillus (Figure 8b,c). Moreover, a significant negative relationship of relative abundance of Fusarium was detected with the antagonistic bacteria Bacillus, Paenibacillus and Streptomyces, respectively (Figure 9).

4. Discussion

The immediate effects of ASD on soil microbial diversity and community composition have been well documented in previous studies [17,22,23]. However, there are few reports on the long-term effects of ASD or the effects of using chicken manure on ASD. Our results show that 1.5 years after ASD, although soil bacterial and fungal diversity had recovered to the original level before ASD, the positive effects of ASD were still detectable. Specifically, the ASD plots had a higher abundance of beneficial microorganisms and lower levels of the pathogenic microorganisms Fusarium and nematodes than the CK plots. The additional use of chicken manure for the ASD did not increase the relative abundance of pathogenic microorganisms Fusarium or the number of nematodes, but it did significantly decrease the relative abundance of antagonistic bacteria.

4.1. ASD Changed Soil Microbial Community Composition and Increased Bacterial Network Complexity

The drastic changes in soil environmental conditions caused by the ASD not only eliminated pathogenic microorganisms but also inhibited the growth and reproduction of soil nontarget organisms [22,23,24], leading to a decline in the diversity of soil bacteria and fungi, as shown in our study (Figure 1; p < 0.05). In addition, the bacterial and fungal diversity fully returned to pre-ASD levels after 1.5 years (Figure 1).
In agreement with previous studies, we found that the addition of large amounts of organic materials and the high temperature, high humidity and strong anaerobic environment during the ASD period [25,26] resulted in a significant increase in the relative abundance of Firmicutes, whereas the relative abundance of Firmicutes in the CK treatment was significantly higher than that in the ASD and ASD+M treatment [27,28] (Figure 4a; p < 0.05). This was because Firmicutes have thicker cell walls, and most can produce spores which are resistant to drought and extreme environments [29]. Our study showed for the first time that ASD effects on the bacterial community composition are long-lasting and still detectable after 1.5 years, although differences between treatments diminish (Figure 4a). Moreover, ASD significantly increased the relative abundance of Ascomycota compared to Day 0 sampling (Figure 4b), an observation also found in previous studies [30,31] (Figure 4b; p < 0.05). However, the relative abundance of Mortierellomycota decreased significantly with a higher nitrate nitrogen content (Figure 2b and Figure 4b; p < 0.05).
Compared to fungi, bacterial networks are more easily affected by soil nutrient concentrations and environmental factors [32], as verified by our results. Earlier studies showed that compared to the CK treatment, ASD and ASD+M not only increased the content of soil-available carbon and nitrogen, but also provided sufficient energy for the growth, reproduction and interaction of soil bacteria [33,34], thus increasing the complexity of bacterial networks and niche differentiation potential, as shown in our study [35] (Figure 5; Table S1). Keystone taxa are highly connected microorganisms that play an important role in the structure and function of microbial community and are an indicator of environmental change [36]. The increase in the species and number of soil bacterial keystones can improve the complexity and stability of the bacterial community structure (Figure S2), which can not only maintain the versatility and sustainability of the ecosystem but also help to inhibit the proliferation of pathogenic microorganisms [37].

4.2. Effectively Alleviating Fungal and Nematode Diseases

High temperature and humidity, an anaerobic environment, and the presence of organic materials improved the complexity and stability of the soil bacterial network, effectively inhibiting the growth and propagation of soil-borne pathogens and soil nematodes [15,38]. Although there were no data on plant-parasitic nematodes in our study, previous studies showed that ASD decreased the quantity of 2-instar root-knot nematodes by 59%–97% compared with the control [39]. In ASD treatments, irrigation and application of soil amendments resulted in an anaerobic state of the soil, which implies that oxygen was being consumed [40]. Under anaerobic conditions, the survival period of pathogens decreased when the soil temperature increased [41]. Thus, the abundance of Fusarium decreased by 93% to 96% on the 25th day compared to Day 0 (Figure 7a). Although the soil returned to an aerobic state 1.5 years after the end of the ASD, Fusarium was still decreased by 84% to 95%. Moreover, organic acids and reducing compounds (such as NH3, H2S, low metal ions) produced during the fermentation of organic materials during the ASD period were responsible for the significant reduction in the numbers of soil-borne pathogens and soil nematodes [14,17,38]. Furthermore, changes in soil environmental conditions such as the dissolved organic carbon and nitrogen as well as soil pH during the ASD period strongly affected the soil microbial community composition (Figure 4) and soil nematode trophic group composition in previous studies [39,42]. The ASD conditions promoted the growth of competitive saprophytic microorganisms known to inhibit the proliferation of pathogens and soil nematodes [39]. In addition, earlier studies showed that the antagonistic bacteria Bacillus, Paenibacillus and Streptomyces in the ASD and ASD+M treatments produce antibiotics that inhibit soil-borne fungal diseases, such as tomato wilt caused by Fusarium [43]. Although our study indicates that the addition of chicken manure effectively improved soil properties and reduced the relative abundance of pathogens and nematodes (Figure 7), other studies found that the high nitrogen content in the ASD+M treatment may cause ammonia toxicity [44] and reduce the soil C/N ratio [42], resulting in a significant decline in the relative abundance of antagonistic bacteria and the ability to inhibit diseases and insect pests (Figure 8; p < 0.05).

5. Conclusions

By analysing the complexity of soil microbial networks and the relative abundance of pathogens and antagonistic bacteria under different treatments, we have shown that ASD can rapidly improve degraded soil and effectively control soil-borne pests and diseases while also improving the soil microbial community structure. After three growing seasons, the ASD remained significantly better than the control treatment in promoting beneficial microorganisms and inhibiting pathogens. This study highlights the effectiveness of ASD as a simple and sustainable soil disinfestation method for improving degraded soil quality in greenhouse vegetable fields. However, further research is needed to explore the effects of different organic materials, organic fertiliser dosages, irrigation amounts and other factors on the soil microbial community structure during the ASD process, as well as the mechanisms underlying the effects of ASD on inhibiting soil-borne diseases. In addition, because DNA remains stable for quite a long time period outside of living organisms in the soil, soil RNA analysis should be carried out in future studies.

Supplementary Materials

The following supporting information can be downloaded at: https://www.mdpi.com/article/10.3390/agronomy13030939/s1, Table S1: The characteristics of empirical bacterial network structure constructed in studies; Table S2: The characteristics of empirical fungal network structure constructed in studies; Figure S1: Soil bacterial (a) and fungal (b) community bar plot analysis under different treatments at the genus level (n = 6); Figure S2: Z-P plot exhibiting the distribution of OTU was based on the topological roles (a–c: bacteria; d–f: fungi). Each point represents an OTU. The location of each OTU determined according to the within-module connectivity (Zi) and among-module connectivity (Pi). The module hub is defined according to Zi and Pi values (Zi > 2.5, Pi ≤ 0.62). The four identified module hubs were marked with OTU numbers and phyla.

Author Contributions

Conceptualization, S.L. and J.H.; Methodology, J.H., L.W. and W.Q.; Investigation, H.L., Y.Z. and G.L.; Data Curation, S.L. and J.H.; Writing—Original Draft Preparation, J.H.; Writing—Review and Editing, K.B.-B., S.L. and J.H.; Project Administration, S.L. and K.B.-B.; Funding Acquisition, S.L. and K.B.-B. All authors have read and agreed to the published version of the manuscript.

Funding

This work was financially supported by the National Nature Sciences Foundation of China (grant no. 41761134087 and 42177013) and the German Science Foundation (Deutsche Forschungsgemeinschaft, DFG) (grant no. BU1173/19-1), and co-supported by the Yunnan Tobacco Company of China National Tobacco Corporation (grant number 2021530000241032).

Institutional Review Board Statement

Not applicable.

Informed Consent Statement

Not applicable.

Data Availability Statement

Not applicable.

Acknowledgments

We are grateful for the support of Xinhewotu Efficient Agriculture Research and Development Center, China.

Conflicts of Interest

The authors declare no conflict of interest.

References

  1. Wang, X.X.; Zhao, F.Y.; Zhang, G.X.; Zhang, Y.Y.; Yang, L.J. Vermicompost improves tomato yield and quality and the biochemical properties of soils with different tomato planting history in a greenhouse study. Front. Plant Sci. 2017, 8, 1978. [Google Scholar] [CrossRef] [PubMed] [Green Version]
  2. Qasim, W.; Wan, L.; Lv, H.F.; Zhao, Y.M.; Hu, J.; Meng, F.Q.; Lin, S.; Butterbach-Bahl, K. Impact of anaerobic soil disinfestation on seasonal N2O emissions and N leaching in greenhouse vegetable production system depends on amount and quality of organic matter additions. Sci. Total Environ. 2022, 830, 154673. [Google Scholar] [CrossRef] [PubMed]
  3. FAO. Food and Agriculture Data. 2020. Available online: http://www.fao.org/faostat/zh/#data (accessed on 22 May 2022).
  4. Gao, L.H.; Qu, M.; Ren, H.Z.; Sui, X.L.; Chen, Q.Y. Structure, function, application and ecological benefit of single-slope, energy-efficient solar greenhouse in China. Hortic. Technol. 2010, 20, 626–631. [Google Scholar] [CrossRef] [Green Version]
  5. Fan, Z.B.; Lin, S.; Zhang, X.M.; Jiang, Z.M.; Yang, K.C.; Jian, D.D.; Chen, Y.Z.; Li, J.L.; Chen, Q.; Wang, J.G. Conventional flooding irrigation causes an overuse of nitrogen fertilizer and low nitrogen use efficiency in intensively used solar greenhouse vegetable production. Agric. Water Manag. 2014, 144, 11–19. [Google Scholar] [CrossRef]
  6. Lv, H.F.; Lin, S.; Wang, Y.F.; Lian, X.J.; Zhao, Y.M.; Li, Y.J.; Du, J.Y.; Wang, Z.X.; Wang, J.G.; Butterbach-Bahl, K. Drip fertigation significantly reduces nitrogen leaching in solar greenhouse vegetable production system. Environ. Pollut. 2019, 245, 694–701. [Google Scholar] [CrossRef]
  7. Qasim, W.; Xia, L.L.; Lin, S.; Wan, L.; Zhao, Y.M.; Butterbach-Bahl, K. Global greenhouse vegetable production systems are hotspots of soil N2O emissions and nitrogen leaching: A meta-analysis. Environ. Pollut. 2021, 272, 116372. [Google Scholar] [CrossRef]
  8. Shen, W.; Hu, M.; Qian, D.; Xue, H.; Gao, N.; Lin, X. Microbial deterioration and restoration in greenhouse-based intensive vegetable production systems. Plant Soil 2021, 463, 1–18. [Google Scholar] [CrossRef]
  9. Zhao, Y.M.; Lv, H.F.; Qasim, W.; Wan, L.; Wang, Y.F.; Lian, X.J.; Liu, Y.N.; Hu, J.; Wang, Z.X.; Li, G.Y.; et al. Drip fertigation with straw incorporation significantly reduces N2O emission and N leaching while maintaining higher vegetable yields in solar greenhouse production. Environ. Pollut. 2021, 273, 116521. [Google Scholar] [CrossRef]
  10. Lv, H.F.; Zhao, Y.M.; Wang, Y.F.; Wan, L.; Wang, J.G.; Butterbach-Bahl, K.; Lin, S. Conventional flooding irrigation and over fertilization drives soil pH decrease not only in the top- but also in subsoil layers in solar greenhouse vegetable production systems. Geoderma 2020, 363, 114156. [Google Scholar] [CrossRef]
  11. Zhou, X.G.; Gao, D.M.; Liu, J.; Qiao, P.L.; Zhou, X.L.; Lu, H.B.; Wu, X.; Liu, D.; Jin, X.; Wu, F.Z. Changes in rhizosphere soil microbial communities in a continuously monocropped cucumber (Cucumis sativus L.) system. Eur. J. Soil Biol. 2014, 60, 1–8. [Google Scholar] [CrossRef]
  12. Lamers, J.G.; Runia, W.T.; Molendijk, L.P.G.; Bleeker, P.O. Perspectives of anaerobic soil disinfestation. Acta Hortic. 2010, 883, 277–284. [Google Scholar] [CrossRef] [Green Version]
  13. Meng, T.; Zhu, T.; Zhang, J.; Xie, Y.; Sun, W.; Yuan, L.; Cai, Z. Liming accelerates the NO3 removal and reduces N2O emission in degraded vegetable soil treated by reductive soil disinfestation (RSD). J. Soils Sediments 2015, 15, 1968–1976. [Google Scholar] [CrossRef]
  14. Butler, D.M.; Kokalis-Burelle, N.; Muramoto, J.; Shennan, C.; McCollum, T.G.; Rosskopf, E.N. Impact of anaerobic soil disinfestation combined with soil solarization on plant-parasitic nematodes and introduced inoculum of soil-borne plant pathogens in raised-bed vegetable production. Crop Prot. 2012, 39, 33–40. [Google Scholar] [CrossRef]
  15. Rosskopf, E.N.; Serrano-Pérez, P.; Hong, J.; Shrestha, U.; del Carmen Rodríguez-Molina, M.; Martin, K.; Butler, D. Anaerobic soil disinfestation and soilborne pest management. In Organic Amendments and Soil Suppressiveness in Plant Disease Management; Springer: Cham, Switzerland, 2015; pp. 277–305. [Google Scholar] [CrossRef]
  16. Yong, T.; Cui, Y.; Li, H. Rhizospheric soil and root endogenous fungal diversity and composition in response to continuous Panaxnotoginseng cropping practices. Microbiol. Res. 2017, 194, 10–19. [Google Scholar]
  17. Huang, X.Q.; Zhao, J.; Zhou, X.; Zhang, J.B.; Cai, Z.C. Differential responses of soil bacterial community and functional diversity to reductive soil disinfestation and chemical soil disinfestation. Geoderma 2019, 348, 124–134. [Google Scholar] [CrossRef]
  18. Liang, B.; Kang, L.; Ren, T.; Junliang, L.; Chen, Q.; Wang, J. The impact of exogenous N supply on soluble organic nitrogen dynamics and nitrogen balance in a greenhouse vegetable system. J. Environ. Manag. 2015, 154, 351–357. [Google Scholar] [CrossRef]
  19. Bergmann, G.T.; Bates, S.T.; Eilers, K.G.; Lauber, C.L.; Caporaso, J.G.; Walters, W.A.; Knight, R.; Fierer, N. The under-recognized dominance of Verrucomicrobia in soil bacterial communities. Soil Biol. Biochem. 2011, 43, 1450–1455. [Google Scholar] [CrossRef] [PubMed] [Green Version]
  20. Zhuang, L.B.; Li, Y.; Wang, Z.S.; Yu, Y.; Zhang, N.; Yang, C.; Zeng, Q.C.; Wang, Q. Synthetic community with six Pseudomonas strains screened from garlic rhizosphere microbiome promotes plant growth. Microb. Biotechnol. 2020, 14, 488–502. [Google Scholar] [CrossRef]
  21. Deng, Y.; Jiang, Y.H.; Yang, Y.F.; He, Z.L.; Luo, F.; Zhou, J.Z. Molecular ecological network analyses. BMC Bioinform. 2012, 13, 113–132. [Google Scholar] [CrossRef] [Green Version]
  22. Meng, T.Z.; Ren, G.D.; Wang, G.F.; Ma, Y. Impacts on soil microbial characteristics and their restorability with different soil disinfestation approaches in intensively cropped greenhouse soils. Appl. Microbiol. Biotechnol. 2019, 103, 6369–6383. [Google Scholar] [CrossRef]
  23. Ji, C.Y.; Ye, R.Z.; Yin, Y.F.; Sun, X.F.; Ma, H.L.; Gao, R. Reductive soil disinfestation with biochar amendment modified microbial community composition in soils under plastic greenhouse vegetable production. Soil Tillage Res. 2022, 218, 105323. [Google Scholar] [CrossRef]
  24. Liu, L.; Chen, S.; Zhao, J.; Zhou, X.; Wang, B.; Li, Y.; Zheng, G.; Zhang, J.; Cai, Z.; Huang, X. Watermelon planting is capable to restructure the soil microbiome that regulated by reductive soil disinfestation. Appl. Soil Ecol. 2018, 129, 52–60. [Google Scholar] [CrossRef]
  25. Bouskill, N.J.; Lim, H.C.; Borglin, S.; Salve, R.; Wood, T.E.; Silver, W.L.; Brodie, E.L. Pre-exposure to drought increases the resistance of tropical forest soil bacterial communities to extended drought. ISME J. 2013, 7, 384–394. [Google Scholar] [CrossRef]
  26. Naylor, D.; DeGraaf, S.; Purdom, E.; Coleman-Derr, D. Drought and host selection influence bacterial community dynamics in the grass root microbiome. ISME J. 2017, 11, 2691–2704. [Google Scholar] [CrossRef] [PubMed] [Green Version]
  27. DeBruyn, L.M.; Nixon, L.T.; Fawaz, M.N.; Johnson, A.M.; Radosevich, M. Global biogeography and quantitative seasonal dynamics of gemmatimonadetes in soil. Appl. Environ. Microbiol. 2011, 77, 6295–6300. [Google Scholar] [CrossRef] [Green Version]
  28. Wolińska, A.; Kuzniar, A.; Zielenkiewicz, U.; Izak, D.; Szafranek-Nakonieczna, A.; Banach, A.; Błaszczyk, M. Bacteroidetes as a sensitive biological indicator of agricultural soil usage revealed by a culture independent approach. Appl. Soil Ecol. 2017, 119, 128–137. [Google Scholar] [CrossRef]
  29. Galperin, M.Y. Genome diversity of spore-forming firmicutes. Microbiol. Spectr. 2013, 1, 2. [Google Scholar] [CrossRef] [PubMed] [Green Version]
  30. Hannula, S.E.; Boschker, H.T.S.; Boer, W.D.; Veen, J.A.V. 13C pulse-labeling assessment of the community structure of active fungi in the rhizosphere of a genetically starch-modified potato (Solanum tuberosum) cultivar and its parental isoline. New Phytol. 2012, 194, 784–799. [Google Scholar] [CrossRef]
  31. Bastida, F.; Hernández, T.; Albaladejo, J.; García, C. Phylogenetic and functional changes in the microbial community of long-term restored soils under semiarid climate. Soil Biol. Biochem. 2013, 65, 12–21. [Google Scholar] [CrossRef]
  32. Bahram, M.; Hildebrand, F.; Forslund, S.K.; Anderson, J.L.; Soudzilovskaia, N.A.; Bodegom, P.M. Structure and function of the global topsoil microbiome. Nature 2018, 560, 233–237. [Google Scholar] [CrossRef] [Green Version]
  33. Araki, H.; Hamada, A.; Hossain, M.A.; Takahashi, T. Waterlogging at jointing and/or after anthesis in wheat induces early leaf senescence and impairs grain filling. Field Crops Res. 2012, 137, 27–36. [Google Scholar] [CrossRef]
  34. Peralta, A.L.; Ludmer, S.; Matthews, J.W. Bacterial community response to changes in soil redox potential along a moisture gradient in restored wetlands. Ecol. Eng. 2014, 73, 246–253. [Google Scholar] [CrossRef]
  35. Li, L.J.; Zhu-Barker, X.; Ye, R.Z.; Doane, T.A.; Horwath, W.R. Soil microbial biomass size and soil carbon influence the priming effect from carbon inputs depending on nitrogen availability. Soil Biol. Biochem. 2018, 119, 41–49. [Google Scholar] [CrossRef]
  36. Banerjee, S.; Walder, F.; Büchi, L.; Meyer, M.; Held, A.Y.; Gattinger, A.; Keller, T.; Charles, R.; Van Der Heijden, M.G.A. Agricultural intensification reduces microbial network complexity and the abundance of keystone taxa in roots. ISME J. 2019, 13, 1722–1736. [Google Scholar] [CrossRef] [Green Version]
  37. Ochoa-Hueso, R.; Collins, S.L.; Delgado-Baquerizo, M.; Hamonts, K.; Pockman, W.T.; Sinsabaugh, R.L.; Smith, M.D.; Knapp, A.K.; Power, S.A. Drought consistently alters the composition of soil fungal and bacterial communities in grasslands from two continents. Glob. Chang. Biol. 2018, 24, 2818–2827. [Google Scholar] [CrossRef] [PubMed]
  38. Momma, N.; Kobara, Y.; Uematsu, S.; Kita, N.; Shinmura, A. Development of biological soil disinfestations in Japan. Appl. Microbiol. Biotechnol. 2013, 97, 3801–3809. [Google Scholar] [CrossRef] [PubMed]
  39. Shi, L.; Zhao, H.H.; Li, M.L.; Zhang, J.B.; Zhang, L. Effects of strong reductive approach on root-knot nematodes, the growth of tomato and soil physicochemical properties. Chin. J. Ecol. 2018, 37, 6. (In Chinese) [Google Scholar]
  40. Momma, N. Biological soil disinfestation (BSD) of soilborne pathogens and its possible mechanisms. Jpn. Agric. Res. Q. 2008, 42, 7–12. [Google Scholar] [CrossRef] [Green Version]
  41. Ebihara, Y.; Uematsu, S. Survival of strawberry-pathogenic fungi Fusarium oxysporum f. sp. fragariae, Phytophthora cactorum and Verticillium dahliae under anaerobic conditions. J. Gen. Plant Pathol. 2014, 80, 50–58. [Google Scholar] [CrossRef]
  42. Bonanomi, G.; Antignani, V.; Capodilupo, M.; Scala, F. Identifying the characteristics of organic soil amendments that suppress soil-borne plant diseases. Soil Biol. Biochem. 2010, 42, 136–144. [Google Scholar] [CrossRef]
  43. Kinsella, K.; Schulthessm, C.P. Rapid quantification of Bacillus subtilis antibiotics in the rhizosphere. Soil Biol. Biochem. 2010, 42, 1009–1192. [Google Scholar] [CrossRef]
  44. Li, B.H.; Li, Q.; Xiong, L.M.; Kronzucker, H.J.; Krämer, U.; Shi, W.M. Arabidopsis Plastid AMOS1/EGY1 Integrates Abscisic Acid Signaling to Regulate Global Gene Expression Response to Ammonium Stress. Plant Physiol. 2012, 160, 2040–2051. [Google Scholar] [CrossRef] [PubMed] [Green Version]
Figure 1. Soil bacterial (a) and fungal (b) diversity (Shannon index) under different disinfestation days and treatments at the OTU level (n = 6). The different capital letters represent significant differences (p < 0.05) between different disinfestation days. The different lowercase letters represent significant differences (p < 0.05) between different treatments.
Agronomy 13 00939 g001
Figure 2. Relationship between bacterial (a) and fungal (b) abundance in phylum taxa and soil parameters (n = 36). Red indicates a positive correlation, whereas blue indicates a negative correlation. *, ** and *** indicate significant effects at p = 0.05, 0.01 and 0.001, respectively.
Agronomy 13 00939 g002
Figure 3. Principal coordinate analysis of the bacterial (a) and fungal (b) communities under different treatments at the OTU level (n = 6).
Agronomy 13 00939 g003
Figure 4. Soil bacterial (a) and fungal (b) community bar plot analysis under different treatments at the phylum level (n = 6). Others = the relative abundance of individual taxa was ≤1%. Significant level at * p < 0.05, ** p < 0.01, *** p < 0.001. ns, not significant.
Agronomy 13 00939 g004
Figure 5. Co-occurrence pattern of the bacterial community and co-occurrence pattern of each subnetwork in CK (a), ASD (b) and ASD+M treatments ((c); n = 24). Subnetworks were generated for each treatment from the network by preserving nodes and edges presented (nodes ≥ 10). Node colours signify different phyla. Bigger nodes represent the dominant taxa with a high degree of nodes. The red and green lines represent positive and negative correlations, respectively. Data were fitted using linear regression and assessed by Spearman’s rank correlation ρ.
Agronomy 13 00939 g005
Figure 6. Co-occurrence pattern of the fungal community and co-occurrence pattern of each subnetwork in CK (a), ASD (b) and ASD+M treatments ((c); n = 24). Subnetworks were generated for each treatment from the network by preserving nodes and edges presented (nodes ≥ 10). Node colours signify different phyla. Bigger nodes represent the dominant taxa with a high degree of nodes. The red and green lines represent positive and negative correlations, respectively. Data were fitted using linear regression and assessed by Spearman’s rank correlation ρ.
Agronomy 13 00939 g006
Figure 7. Mean proportion of plant pathogens Fusarium at the genus level (a) and number of nematodes per 100 g of dry soil (b) under different soil disinfestation treatments (n = 6). The different capital letters represent significant differences (p < 0.05) between different disinfestation days. The different lowercase letters represent significant differences (p < 0.05) between different treatments.
Agronomy 13 00939 g007
Figure 8. Mean proportion of antagonistic bacteria Bacillus (a), Paenibacillus (b) and Streptomyces (c) at the genus level under different soil disinfestation treatments (n = 6). The different capital letters represent significant differences (p < 0.05) between different disinfestation days. The different lowercase letters represent significant differences (p < 0.05) between different treatments.
Agronomy 13 00939 g008
Figure 9. Relationship between relative abundance of pathogen (Fusarium) and antagonistic bacteria (Bacillus, Paenibacillus, Streptomyces) in genus taxa (n = 72). Red indicates a positive correlation, whereas blue indicates a negative correlation. *, ** and *** indicate significant effects at p = 0.05, 0.01 and 0.001, respectively.
Agronomy 13 00939 g009
Table 1. Results of two-way ANOVA that assesses the effects of disinfestation days and treatments, as well as their interaction on the Shannon index and community structure of soil bacteria and fungi.
Shannon IndexBacterial Community StructureFungal Community
Structure
BacteriaFungi
Days (D)33.60 ***23.79 ***10.79 ***13.56 ***
Treatments (T)10.42 ***0.87 ns4.61 ***5.04 ***
D × T2.45 *1.64 ns1.76 ns1.53 ns
Note: Significant level at * p < 0.05, *** p < 0.001. ns, not significant.
Disclaimer/Publisher’s Note: The statements, opinions and data contained in all publications are solely those of the individual author(s) and contributor(s) and not of MDPI and/or the editor(s). MDPI and/or the editor(s) disclaim responsibility for any injury to people or property resulting from any ideas, methods, instructions or products referred to in the content.

