Article

Identification and Analysis of the Catalase Gene Family Response to Abiotic Stress in Nicotiana tabacum L.

Agricultural Big-Data Research Center, College of Plant Protection, Shandong Agricultural University, Taian 271002, China
*
Author to whom correspondence should be addressed.
These authors contributed equally to this work.
Agronomy 2023, 13(3), 936; https://doi.org/10.3390/agronomy13030936
Submission received: 13 February 2023 / Revised: 17 March 2023 / Accepted: 20 March 2023 / Published: 22 March 2023
(This article belongs to the Special Issue Genetic Analysis in Crops)

Abstract

:
Catalase (CAT) is an enzyme encoded by the catalase gene family that plays an important role in the removal of reactive oxygen species. In this study, seven CAT genes were identified in Nicotiana tabacum L. and were classified into three groups. Gene structure analysis revealed that NtCAT1–6 has six or seven introns while NtCAT7 only contains one. The relative position of introns in NtCAT1 and NtCAT2 had high similarity. Tissue-specific analysis shows that NtCAT1–4 were expressed intensively in the shoot while NtCAT5 and NtCAT6 were in the root. NtCAT7 expression was influenced by circadian rhythms. NtCATs expression had the greatest change under drought stress. Additionally, expression of NtCAT5, NtCAT6 and NtCAT7 were upregulated under cold stress but downregulated under drought and salt stress. This study will help in understanding the behavior of CAT genes during environmental stress in tobacco.

1. Introduction

Various abiotic stress conditions such as cold, drought, flooding and high temperature are potential sources of ROS in organisms. Organisms also form highly active and reduced oxygen metabolites such as superoxide anions and H2O2 during cellular respiration. ROS play a dual role in plants. At low concentrations, H2O2 acts as a signaling molecule. When ROS are overgenerated in cells, they will participate in various harmful processes in organisms, such as destroying cell structures including lipids, membranes, proteins and DNA. In order to regulate oxidative stress and keep ROS at a basic nontoxic level, eukaryotic cells produce different ROS-scavenging enzymes, such as superoxide dismutase, glutathione peroxidase, and catalase. These three enzymes play an important role in preventing the key defense mechanisms of DNA, protein and lipid oxidative modification by blocking the chain reaction of free radicals in organisms. Therefore, the resistance of plants to environmental stress is related to their antioxidant systems. Genome information and methods greatly promote the understanding of plant antioxidant systems. Compared with other peroxidases, CAT has a unique advantage in removing H2O2, and its activity could help cells resist oxidative stress [1]. CAT can be used as an indicator of plant antioxidant capacity.
CATs, together with SOD and POD, are called enzyme protection systems. Their main function is to decompose hydrogen peroxide into water and oxygen, thereby removing H2O2 produced during plant photorespiration, fatty acid β-oxidation, and mitochondrial electron transport. Previous studies have shown that enhancing the activity of antioxidant enzymes and the level of antioxidant metabolism in plants can improve the stress resistance of the plants themselves. Typical CATs are homotetrameric haem proteins. They regulate hydrogen peroxide (H2O2) homeostasis by converting H2O2 into H2O and O2 with high specificity for H2O2. H2O2 has toxicity because it can produce highly reactive hydroxyl radicals. CAT needs to remove excess H2O2 to maintain intracellular stability [2]. Unlike other peroxide-metabolizing enzymes, CAT catalyzes the disproportionation reaction without a reductant but with weak activity against organic peroxides [3].
The CAT gene family has been identified in some species and expressed in different tissues and organs in plants. CAT is encoded by a small multigene family, such as seven members in cotton [4], four in cucumber [5], three in Arabidopsis thaliana [6] and pumpkin [7], and one in Scots pine [8]. According to the structure and functions of CAT genes, they can be divided into three groups related to photosynthetic, vascular, and reproductive functions [6,9,10,11]. In previous studies, NpCat1, NpCat2 and NpCat3 belonged to class I, class II, and class III, respectively; AtCAT2 was class I [12]. According to the distance between Nicotiana tabacum and N. plumbaginifolia, the classification of tobacco CAT genes was determined [13]. In A. thaliana, CAT1 and CAT3 mRNA was most abundant in bolts and CAT2 was highly abundant in leaves [6]. In rice seedlings, CatA and CatC were mainly expressed in leaves while CatB was expressed in roots [14]. In maize, the CAT-1 catalase isozyme was expressed in milky endosperm, aleurone and scutellum [15]. In hot peppers, CaCat1 showed stronger expression in vascular tissues, while CaCat2 was nearly equal in all tissues. In contrast to CaCat1 and CaCat2, CaCat3 demonstrated a constant low level in young seedlings and vegetative organs [16]. Three kinds of expressed CAT genes were found in N. plumbaginifolia, and Cat2 mRNA levels rose rapidly when exposed to UV-B light, ozone and sulfur dioxide (SO2) [17].
CAT gene expression in plants is regulated temporally. In A. thaliana seeding, CAT3 and CAT2 are controlled by the circadian clock and are mainly expressed in the evening and early morning, respectively [18]. CAT2 and CAT3 could maintain reactive oxygen species (ROS) homeostasis in light and dark, respectively. In rice, the peak of CatC mRNA occurred in the light period and earlier than CatA, while CatB occurred in the dark period. Further research suggests that CatA and CatC have different transcriptional regulatory mechanisms; one is dependent on the circadian clock while the other has a light-dependent mechanism [19].
CAT genes play an important role in plants’ resistance to adversity. In A. thaliana, CAT plays an important role in programmed cell death and stomatal regulation under drought stress, and CAT2 can be activated under cold and drought. The activity of CAT3 can be enhanced by Abscisic acid (ABA), particularly by an oxidation reaction at the senescence stage [20,21,22,23]. In rice, CatB was significantly expressed under drought conditions [19]. When CAT of Escherichia coli was introduced into tobacco chloroplasts, the plants could tolerate high irradiation under drought conditions, while the photosynthesis of wild plants was seriously destroyed under the same conditions [24]. The level of CAT gene expression dropped sharply, maybe as a result of necrotic leaves and raised salicylic acid levels, and it approximated the reason for the defensive reaction [25]. In pumpkin, cat1 encoding CAT may be involved in the senescence process [7]. The expression level of CAT2 mRNA increased rapidly under stress conditions of UV-B, O3 and SO2 [13].
Abiotic stresses such as cold, drought, salt and heavy metals have a great impact on the growth and development of tobacco and the quality of tobacco leaves. Exploring the mechanism of gene family response to stress in tobacco and its role in tobacco growth and development is helpful for tobacco resistance breeding. At present, the CAT gene family has been identified in many species, but there is a lack of research in tobacco. The increase in genomic data release and sequencing types in N. tabacum has provided a lot of information for research on the CAT gene family. In this study, CAT genes were systematically identified in N. tabacum, and the physiological and biochemical characteristics of each gene, gene structure, conserved domains, and phylogenetic relationships with other species were developed. In addition, the expression of CAT genes was studied in different tissues and under different abiotic stresses. The results were helpful in understanding the role of CAT in tobacco growth and development.

2. Materials and Methods

2.1. Plant Materials and Data Sources

Tobacco plants (N. tabacum cv. K326) were grown hydroponically in a growth chamber at 25 °C with an illumination of 16/8 h light/dark. For polyethylene glycol (PEG) and NaCl treatments, 7-week-old seedlings were transferred to growth media supplemented with 15% PEG6000 and 200 mM NaCl [26]. Cold treatments were performed by transferring 7-week-old seedlings to a pre-cooled medium in a growth chamber at 4 °C. The second and third leaves on the top were collected 24 h after each treatment. Harvested leaves were immediately frozen in liquid nitrogen and then stored at −80 °C for RNA isolation.
Total RNA of N. tabacum cv. K326 were isolated using a Plant Total RNA Extraction Kit (BioFlux, Beijing, China). RNA samples were reverse transcribed according to the instructions of ReverTra Ace qPCR RT Master Mix with gDNA Remover (TOYOBO, Osaka, Japan).
The K326 genome and A. thaliana genome were downloaded from the Solanaceae Genomics Network (SGN) (https://solgenomics.net/) (accessed on 16 April 2022) [27] and Arabidopsis Information Resource (TAIR) (https://www.arabidopsis.org/) (accessed on 16 April 2022) [28], respectively. The gene expression profile files (SRP101432) of 8-week-old tobacco roots, stems and branch tips at different time points (0 h, 6 h, 12 h and 18 h) can be obtained from NCBI [29].The protein sequences encoded by catalase genes of Solanum lycopersicum, Solanum tuberosum, Capsicum annuum and Nicotiana plumbaginifolia were also downloaded from NCBI.

2.2. Identification of CAT Members in Tobacco

Acquisition protein sequences of tobacco CAT genes were used as a query for BLAST with protein sequences of A. thaliana CAT genes, and the expected value was set to 1 × 10⁻⁵. Then, the Hidden Markov Model (HMM) of the CAT (PF00199) obtained from the Pfam database (https://pfam.xfam.org/) (accessed on 20 April 2022) [30] was scanned with the protein sequence file to select tobacco CAT genes. Additionally, the results of BLASTP and HMM were merged and the redundant protein sequences were removed. Finally, the identified candidate CAT genes were confirmed by CD-Search in NCBI (https://www.ncbi.nlm.nih.gov/) (accessed on 26 April 2022) [31] and InterProScan (https://www.ebi.ac.uk/interpro/) (accessed on 26 April 2022) [32].

2.3. Phylogenetic Analysis

MEGA X v10.2.6 [33] was used to construct an unrooted phylogenetic tree using the neighbor-joining method. An NJ tree was constructed through ClustalW with 1000 bootstrap replicates and 95% partial deletion. After the phylogenetic tree was completed, the final visualization was done with Evolview (http://www.evolgenius.info/evolview) (accessed on 1 June 2022).

2.4. Gene Structure Analysis

CAT gene structures were analyzed using the Gene Structure Display Server (GSDS) (http://gsds.cbi.pku.edu.cn/) (accessed on 20 June 2022) [34]. The structures of genes shown with the data from gene annotation files were extracted according to the corresponding requirements.

2.5. Conserved Motif Prediction and Domain Presentation

The proteins of CAT were searched for conserved motifs using MEME (http://meme-suite.org/) (accessed on 21 June 2022) [35]. The motif site selected any number of repetitions (anr). The conserved domains of the protein sequences that had been identified were presented by IBS (http://ibs.biocuckoo.org/) (accessed on 21 June 2022) [36].

2.6. Expression Profiling Analysis by Quantitative Real-Time PCR

The transcriptome data of tobacco CAT genes were used to generate heat maps with R language. Quantitative real-time PCR (qRT-PCR) was performed to analyze the expression patterns of tobacco CAT genes. β-actin was used as an internal control. The PCR primers (Supplementary Table S1) were designed to avoid the conserved region and to amplify products of 80 to 200 bp. The qRT-PCR was performed in optical 96-well plates (Monad, Suzhou, China) with a CFX96 Touch Real-Time PCR Detection System (BIO-RAD, Hercules, CA, USA) by using 2× Universal SYBR Green Fast qPCR Mix (ABclonal, Wuhan, China) and using the following thermal cycles: 95 °C for 3 min, followed by 40 cycles at 95 °C for 5 s, and 58 °C for 30 s. Quantitative analysis was performed using the 2−ΔΔCT method [37]. Three biological duplicates were included in each treatment and there were three technical replicates for each of the biological duplicates.

2.7. Gene Ontology (GO) and KEGG Orthology (KO) Enrichment Analysis

The Tobacco GO annotation file was downloaded from agriGO (http://systemsbiology.cau.edu.cn/agriGOv2/download.php) (accessed on 10 July 2022) [38]. The KO term was obtained from the KAAS (KEGG Automatic Annotation Server) database (https://www.genome.jp/tools/kaas/) (accessed on 12 July 2022) [39] and the method for assigning orthologs was BBH (bi-directional best hit) with prepared protein sequences.

2.8. Secondary and Tertiary Structures of CAT Proteins

The secondary structures were predicted by Phyre2 programs (http://www.sbg.bio.ic.ac.uk/phyre2/html/page.cgi?id=index) (accessed on 20 July 2022). The modelling mode was normal and the PDB file could be obtained. The tertiary structures were predicted by PDBsum (http://www.ebi.ac.uk/thornton-srv/databases/pdbsum/Generate.html) (accessed on 21 July 2022) and displayed by PyMOL software.

3. Results

3.1. Identification of Tobacco CAT Genes

HMMER and BLASTP were used to search for CAT genes in tobacco protein with the HMM profile of CAT (PF00199) obtained from the Pfam database. Then, seven CAT genes were identified by using CD-Search in NCBI and named based on their proximity to A. thaliana (Table 1).
CAT genes in tobacco encoded 91 to 492 amino acids and the molecular weight fluctuation range was from 55.254 kDa to 56.947 kDa, and different NtCATs had no different variants except NtCAT7, which was 10.249 kDa. The isoelectric point (pI) of CATs trended acidic. The grand average of hydropathy (GRAVY) showed that most of the CAT genes were hydrophilic proteins. Subcellular localization showed that different genes encode proteins in different compartments but were mainly focused in the peroxisome.

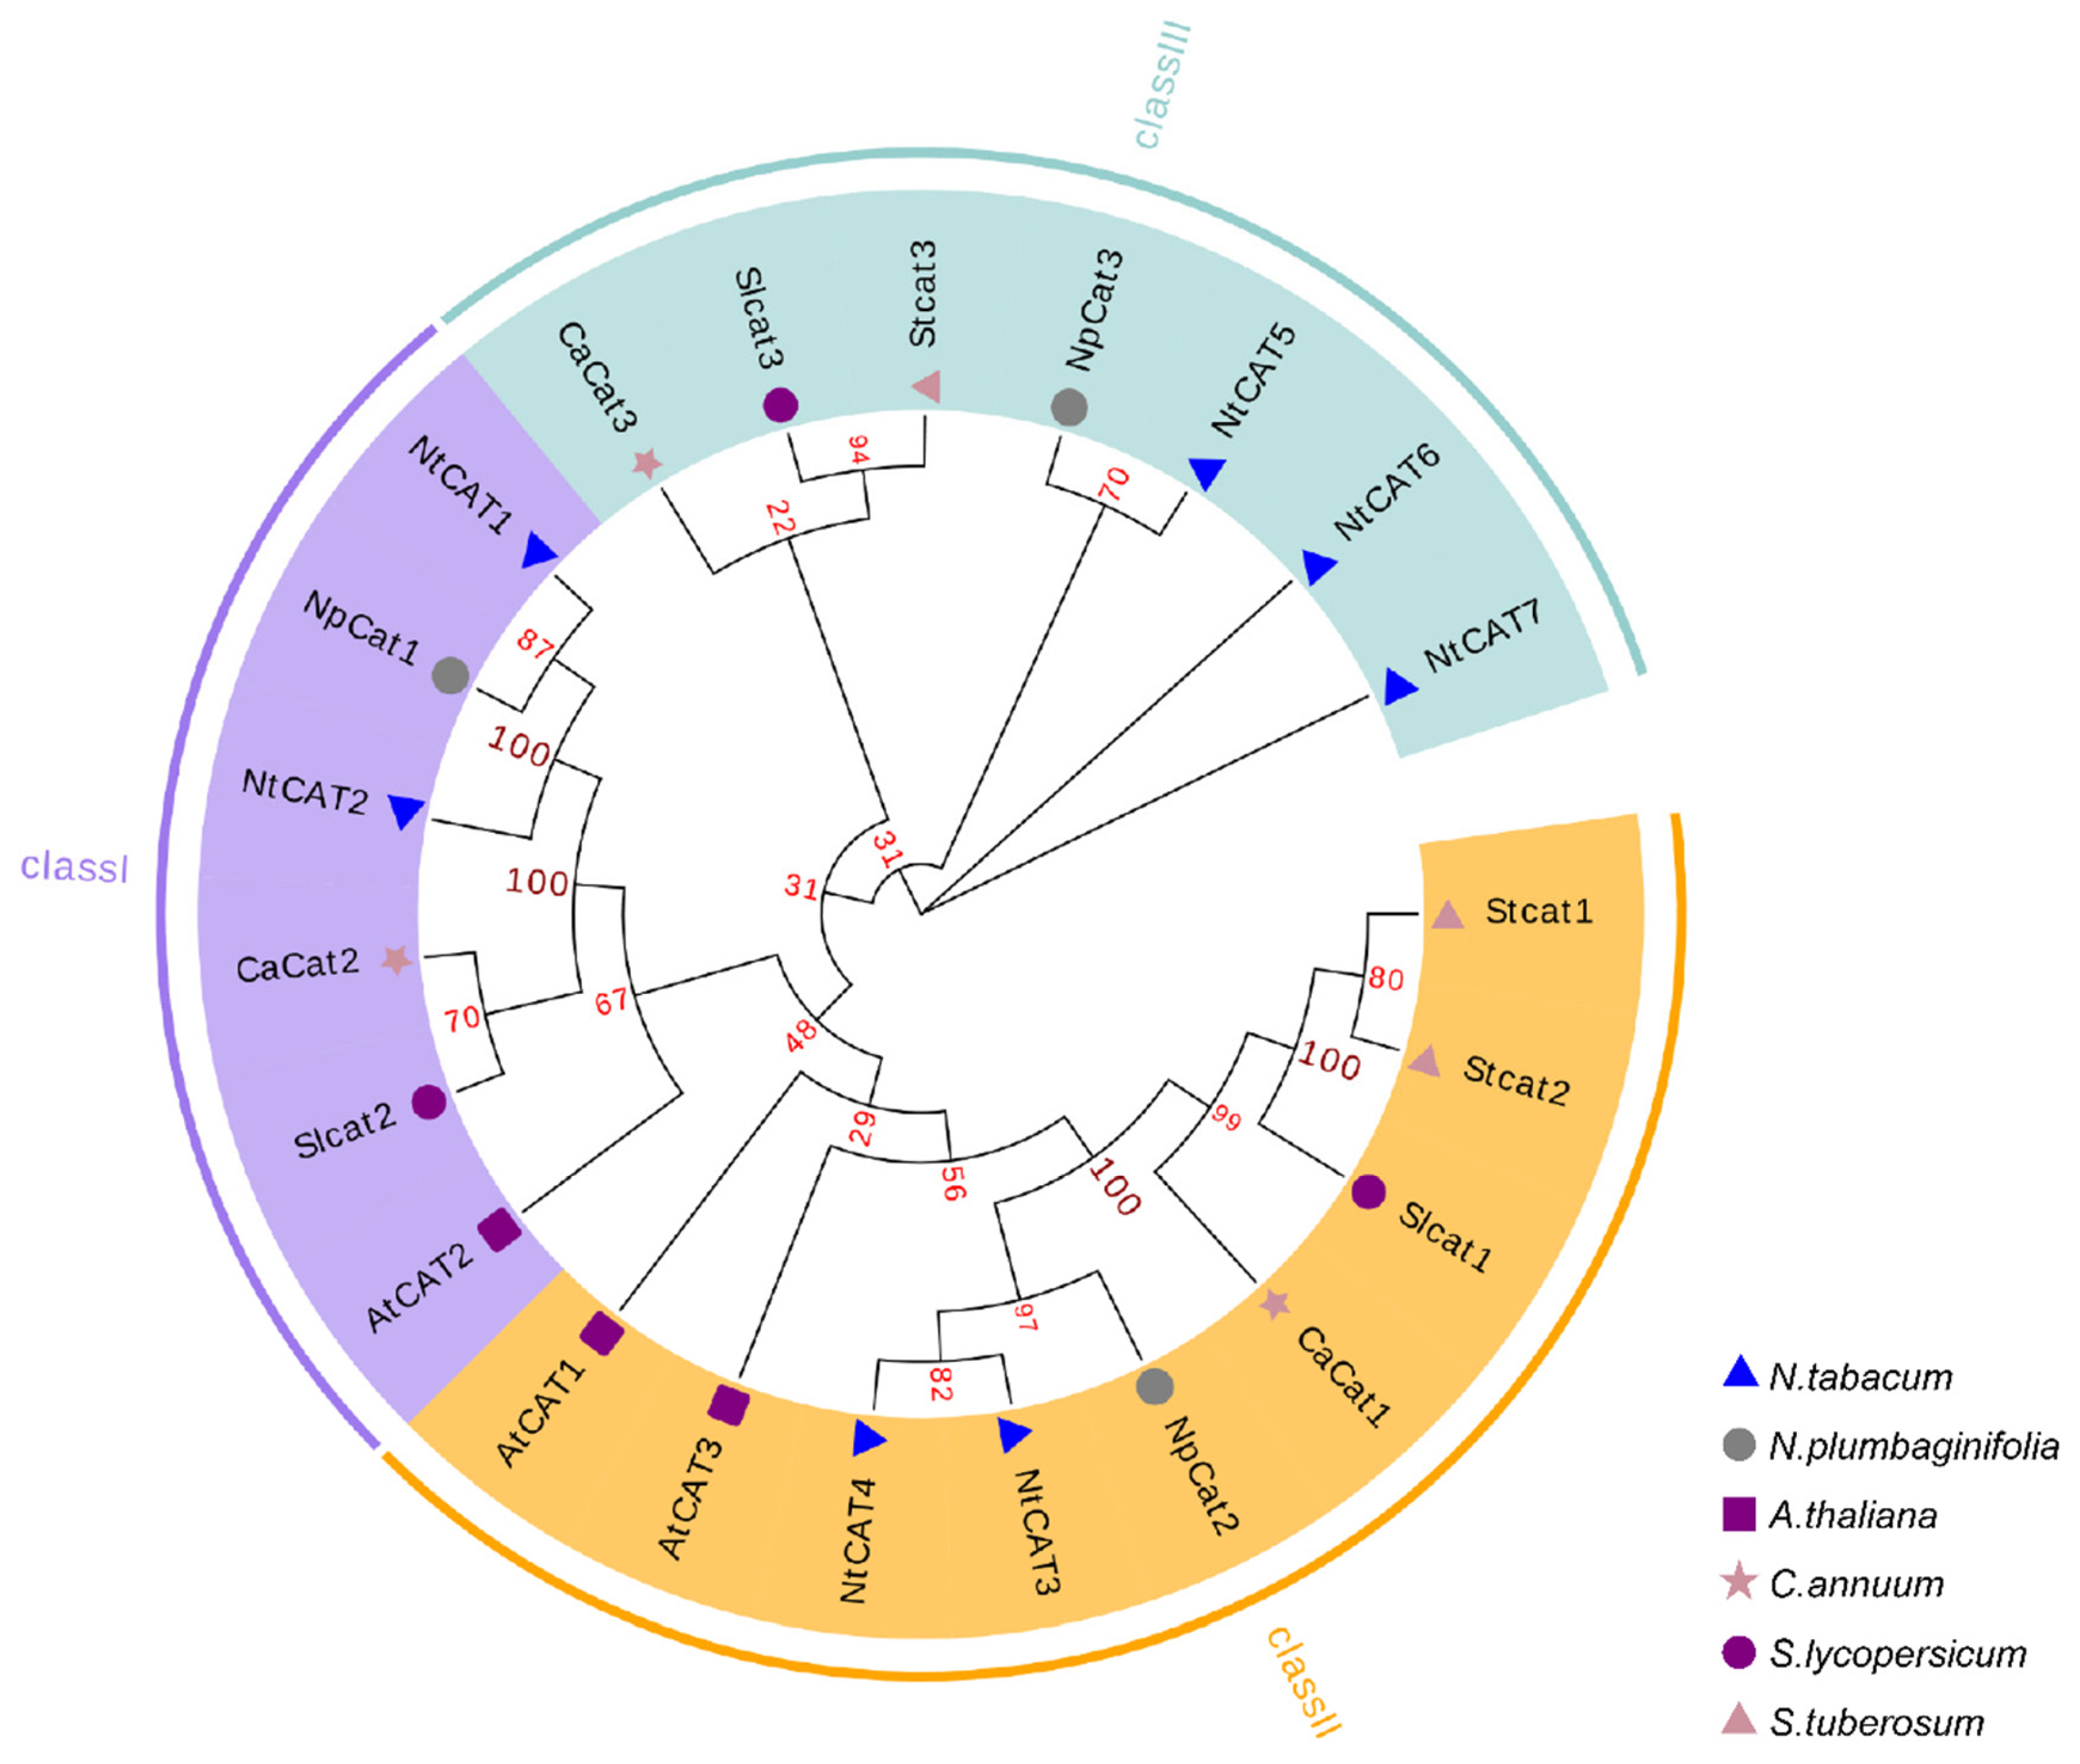
3.2. Phylogenetic Analysis of NtCATs

An unrooted phylogenetic tree was constructed using MEGA X software with CAT genes from N. tabacum and other species (Figure 1). According to the phylogenetic tree, twenty-two CAT genes could be divided into three classes (class I, class II and class III). All of the identified NtCATs were named based on the N. plumbaginifolia CAT family. NtCAT1 and NtCAT2 belonged to class I, NtCAT3 and NtCAT4 belonged to class II, NtCAT5, NtCAT6 and NtCAT7 belonged to class III. Obviously, NtCATs had a high similarity in each group.

3.3. NtCAT Structure Analysis

The structure of NtCATs was displayed by GSDS. All NtCATs were longer than AtCATs. NtCAT1–6 had six or seven introns and four different patterns according to the positions and lengths of introns and exons. CAT genes in the same class had a highly similar pattern. The number of introns and CDS regions is the same and their distribution is similar. NtCAT6 was the longest, but the number of introns was less than for NtCAT1–NtCAT5. Different from other genes, NtCAT7 only had two CDS regions and one intron (Figure 2A,B).

3.4. NtCATs Conserved Motif Prediction

Most CAT genes had nine motifs and the distribution of motifs in every protein sequence was approximately the same. Nine motifs had great similarity in CAT except for in NtCAT7 (Figure 2C). The length of nine motifs had difference. NtCAT3 lacked Motif 7 and was shorter than NtCAT1–6. Meanwhile, NtCAT7 only had Motif 5 and lacked the CAT-rel domain (Figure 2D). The lengths of the proteins were estimated using the scale. In the CAT family, Motif 5 was shared by all members, and Motifs 1-4 were longer than the others (Figure 2E).

3.5. NtCAT Expression in Different Tissues and Times

In order to further study the relationship between the expression and function of the CAT gene in tobacco, the transcriptome data of an 8−week−old common tobacco genome were downloaded in NCBI, and the expression of the CAT gene in different parts (roots, shoot and shoot apex) at different times (0 h, 6 h, 12 h and 18 h) was collected. The data were standardized and plotted into a heat map with an R package (Figure 3). According to the clustering results, the CAT gene expression patterns on the same branch are the same. The results showed that NtCAT1 and NtCAT2 were mainly expressed in the shoot, were also expressed in the shoot apex at 0 h, and the expression level in roots was very low. The expression of NtCAT3 and NtCAT4 was also concentrated in the shoot, but it was only expressed at 0−12 h, and the expression level was very low at 18 h. In the shoot apex, NtCAT3 and NtCAT4 were not significantly expressed at all time periods, and the expression level in the root was lower than that in the shoot apex. Unlike NtCATl−4, NtCAT5 and NtCAT6 were mainly expressed in roots. NtCAT7 is expressed in roots, the shoot and the shoot apex. Compared with tissue-specific expression, the gene is more affected by time regulation. Compared with other time periods, NtCAT7 is more likely to be expressed at 0 h. NtCAT1 and NtCAT2 were also affected by time regulation. In the shoot, genes were more likely to be expressed at 0 h than at 6 h, 12 h or 18 h. In the shoot, the expression of NtCAT2 was higher at 0 h, while the expression of NtCAT3 was higher at 12 h. The expression of NtCAT1 was similar at 0 h and 18 h, and the expression of NtCAT4 was not significantly different at 0 h and 12 h.

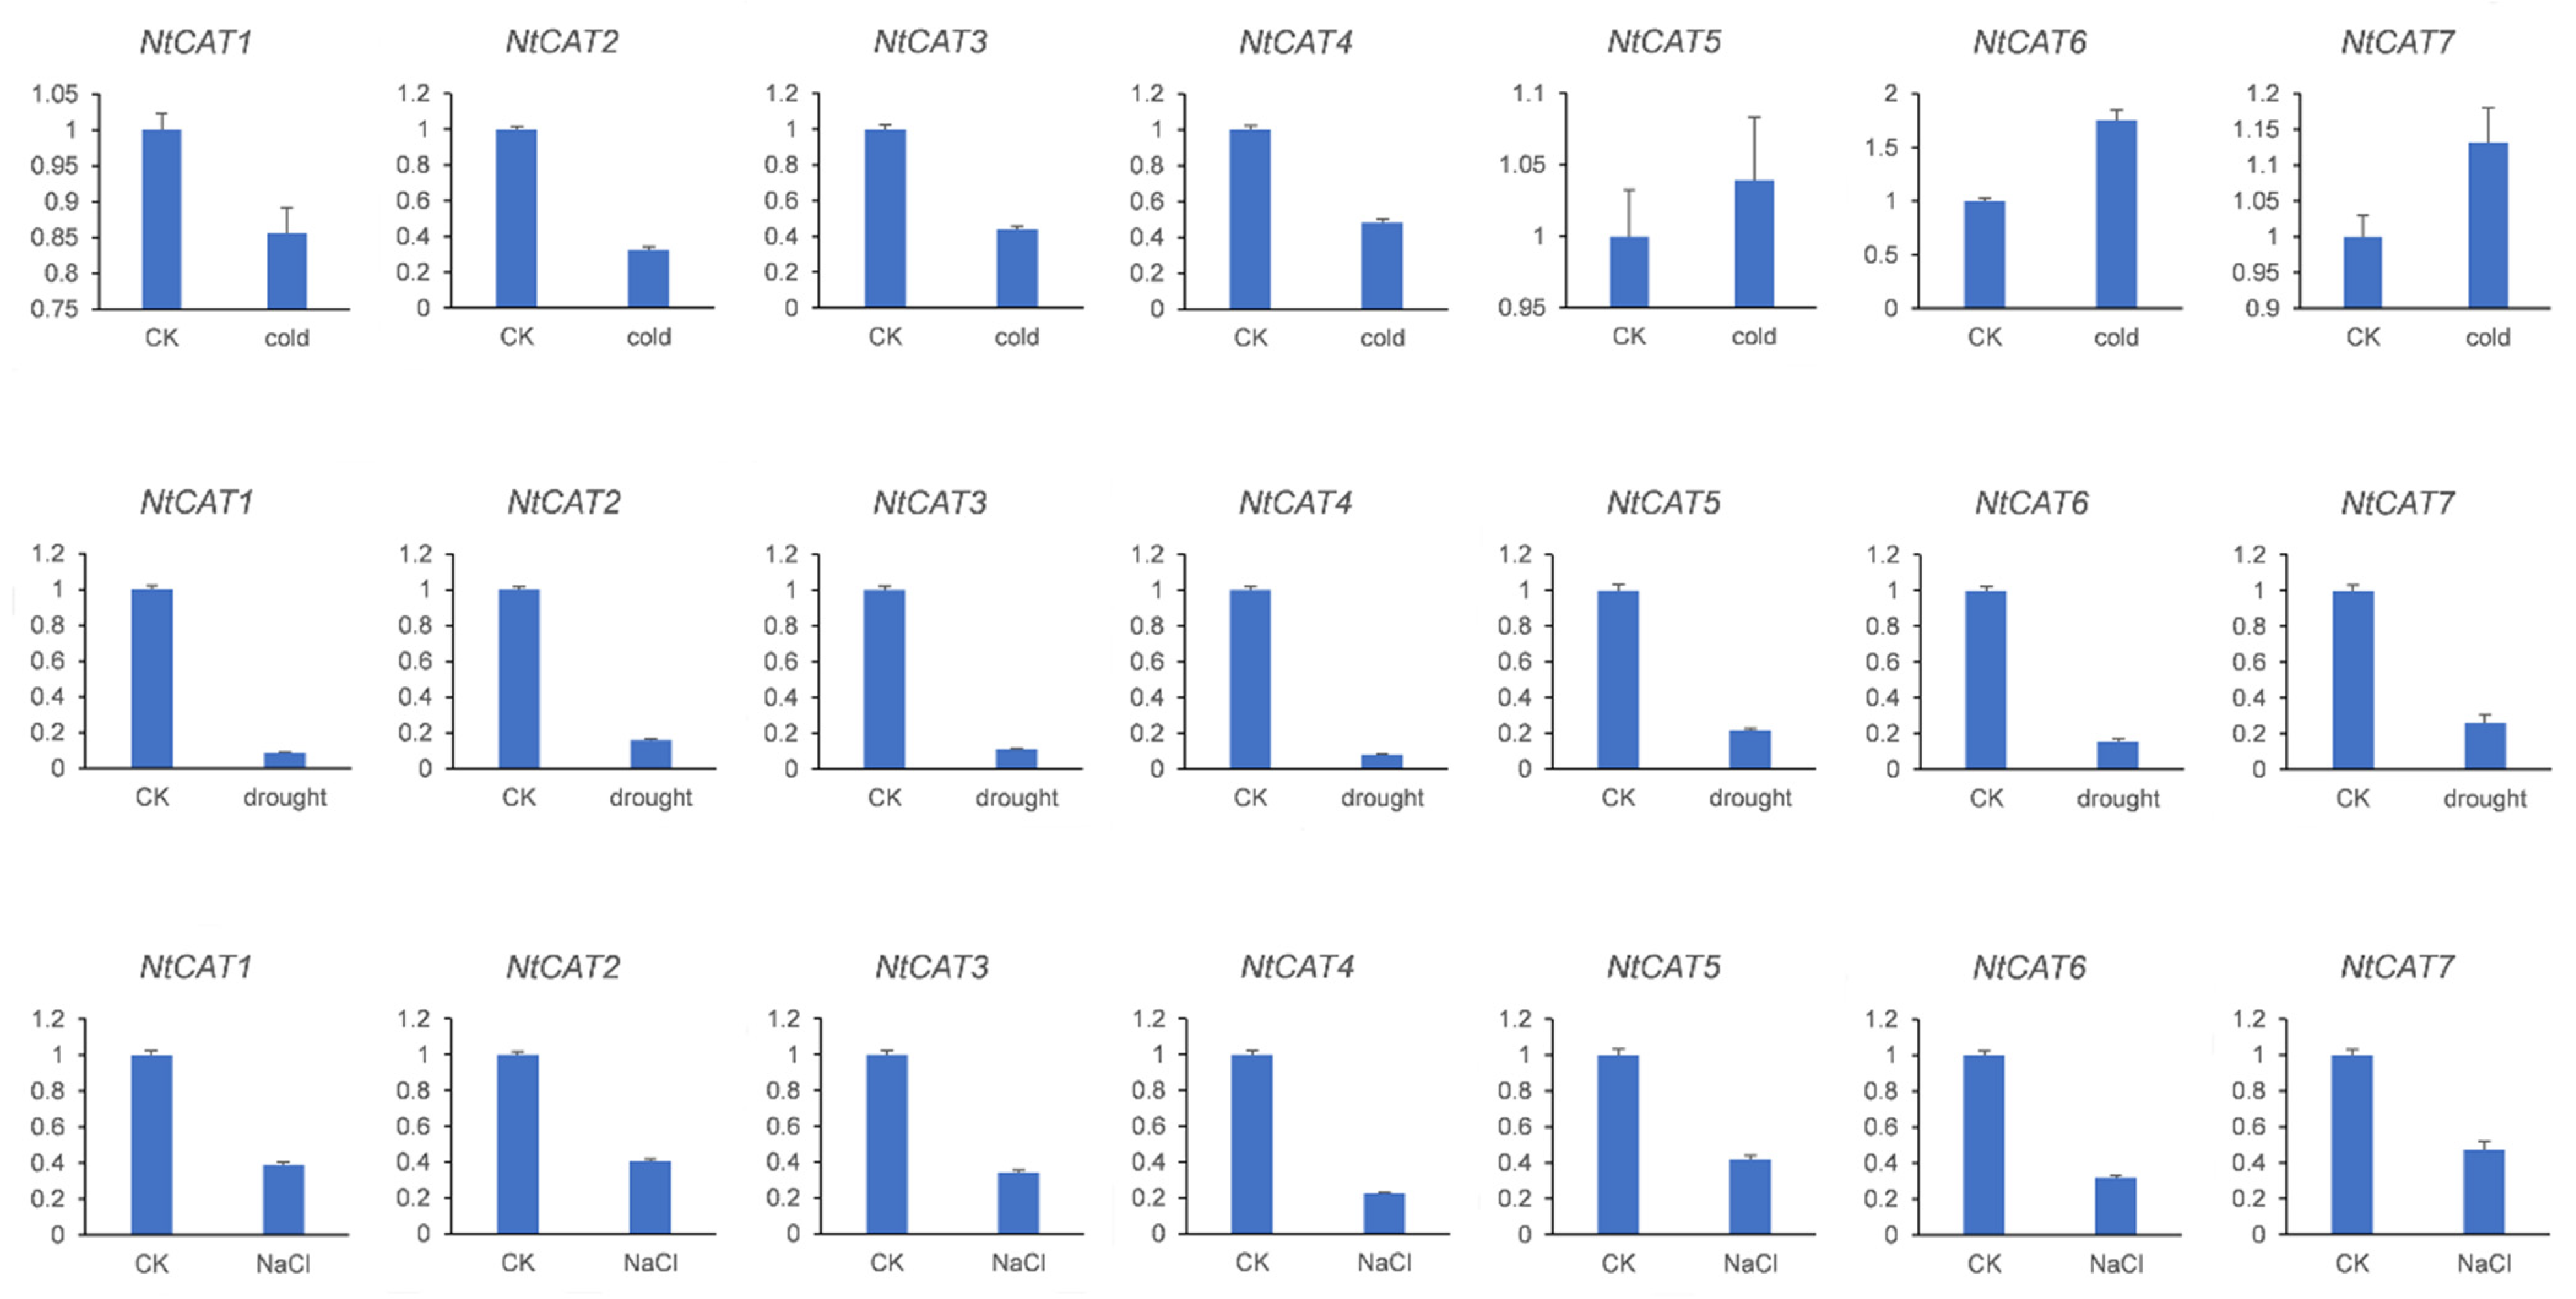
3.6. Response of NtCATs to Various Abiotic Stresses

To investigate the response of NtCATs to various abiotic stresses, tobacco seedlings were treated under three different sets of abiotic stress conditions (NaCl, cold, drought) (Figure 4). Compared with the control without stress (CK), the expressions of NtCAT1, 2, 3 and 4 were downregulated under abiotic stress, but were not sensitive to low temperature. The expressions of NtCAT5, 6 and 7 were upregulated under the stimulus of cold, while on the contrary—especially with drought and NaCl—NtCAT6 was more sensitive to the external environment and had the greatest variation in gene expression. This suggests that gene expression was induced by cold and might have a unique regulatory pattern when confronted with cold stress. Compared with cold and NaCl stress, the gene was more sensitive to a drought environment, and the downregulation was larger, especially for NtCAT1, 2, 3 and 4; the greatest change was in NtCAT4 expression. The experimental results showed that NtCATs responded to abiotic stress and were involved in the regulation of stress response.

3.7. NtCAT Function Analysis

GO annotation indicated that NtCATs were involved in molecular functions and biological processes (Figure 5). All NtCATs had two molecular functions, and NtCAT7 lacked a response to oxidative stress in biological processes. Except NtCAT7, the others had one common pathway (K03781) and were associated with two metabolisms, two signaling pathways, one cellular process and one organismal system.

3.8. Secondary Structures of CAT Proteins

The secondary structure of NtCATs was predicted using the Phyre2 programs and these proteins revealed alpha helix, extended strand, beta turn and random coil (Figure 6). Different structures were represented by lines of different colors. The arrangement of these secondary structures in proteins was very similar. Except NtCAT7, random coil accounted for a large proportion (57–49%). The second was alpha helix (27–30%) and has a concentrated area in the 3′-region. Alpha helix also concentrated in the 5′-region in NtCAT6 and NtCAT7. Beta turn accounted for the smallest proportion (3–6%) of secondary structures. The ratio of extended strand was higher than alpha helix in NtCAT7.

3.9. Tertiary Structures of CAT Proteins

PDBsum showed a typical three−dimensional frame comprising various parallel α-helixes. The reliability of the protein model was illustrated by ramachandran plot (Figure 7). The comparisons between these structures in NtCATs showed the conserved structures. The results of NtCAT1−6 suggested that there were very few differences in structures. The structure of NtCAT7 was different from others. Some diversities in these protein structures may reflect their different obligations in expression and function. Ramachandran plots of NtCATs revealed that the results of structure prediction were very reliable. Most amino acid dihedral angles appeared in the preferred region.

4. Discussion

In this study, seven CAT genes were identified and divided into three classes (Figure 1). Only three CAT genes were found in N. plumbaginifolia [17]. The reason for this difference might be that N. plumbaginifolia was diploid, while N. tabacum was allotetraploid. These two types of tobacco and other solanaceae crops were used to build evolutionary trees. The phylogenetic tree analysis indicated that CAT genes in Nicotiana and Solanum are closely related. It is of great significance to study the structure of proteins. Analysis of protein structure, function and interrelationship is an important part of the proteome project. Studying the structure of proteins helps to understand the role of proteins, understand how proteins perform their biological functions, and understand the interaction between proteins. In this study, some structural diversity of CAT proteins may reflect their different responsibilities in expression and function, which lays a foundation for further analysis of the function of the CAT gene family in tobacco (Figure 5, Figure 6 and Figure 7). Through sequence alignment, it was found that the similarity of two protein sequences in each class is very high (>97%), except in NtCAT7. The results showed that CAT genes are highly conserved during evolution (Figure 2).
Three CAT genes were identified in the genomes of other species in the evolutionary tree. Variable splicing was found in three Arabidopsis family members, two kinds of splicing were found in AtCAT2, and four kinds of splicing were found in AtCAT3. A total of seven proteins were encoded by CAT genes. Variable shearing also exists in rice, with three kinds of variable shearing in OsCATA and two kinds of variable shearing in OsCATB. Studies also found that there are not only three family members in the rice genome, namely OsCATA, OsCATB and OsCATC, but also a new family member named OsCATD. Analysis of OsCATD showed that the sequence length encoded by this gene was 2392 aa, which was much longer than that of other family members. Moreover, according to the analysis of the protein domain, the protein sequence contained an AMP-binding domain (PF00501.21) that was not found in other family members [40]. This indicates that OsCATD gene has its own unique function while playing the role of catalase. However, no variable splicing was found in the seven family members identified, and other species’ genomes may have variable splicing to consider.
CAT function analysis determined they had catalase activity and were involved in the oxidation-reduction process. Because there is more chlorophyll in shoots, NtCAT1 and NtCAT2 were expressed centrally in them and are related to photosynthesis. NpCat1 was also expressed in leaves with high chlorophyll content. NtCAT3 and NtCAT4 expression was likely high in shoots, while NtCAT5 and NtCAT6 expression was high in roots (Figure 3). NpCat3 mRNA also accumulated in flowers, and it may be related to glyoxysomal activity. In future work, the expression of NtCAT5 and NtCAT6 in flowers could be explored, as well as the physiological and biochemical processes involving CAT genes in different organs. Although Cat4 had been identified in N. plumbaginifolia, its mRNA was not detected in various organs at the time of expression analysis. The protein sequence of NtCAT7 was very short, but it was well expressed in shoots (Figure 3). Thus, NtCAT7 should not be considered a pseudogene.
Changes in NtCAT expression under cold, drought and salt stress indicate that genes respond to environmental stimuli and are involved in the defense response of tobacco (Figure 4), but CAT genes may respond differently to adversity in different species [5]. CAT genes being involved in signaling and metabolic pathways further verified that CAT genes can respond to environmental stress. The commonalities and differences in expression could be analyzed by the regulatory mechanisms of the CAT gene family in tobacco’s growth and development. With the increase in availability of tobacco transcriptome data, more and more expression patterns of CAT genes may be disclosed.

5. Conclusions

In this study, the family members in the tobacco genome were scanned based on the identified CAT gene in the Arabidopsis genome, and the physical and chemical properties and subcellular localization of the family members were analyzed using online website tools. The phylogenetic tree of the CAT gene in tobacco and other species was constructed using MEGA X for phylogenetic analysis. Gene structure analysis, motif analysis and conserved domain analysis were performed to further understand the function of the CAT gene. Transcriptome data were used to explore the expression patterns of CAT genes under cold, drought and salt stress conditions. The conclusions are described below.
Seven gene family members were identified in tobacco and divided into three categories by phylogenetic analysis: class I, class II and class Ⅲ. Gene structure analysis showed that the location and number of introns and exons of the same type of NtCATs were highly similar. In addition to NtCAT7, the remaining NtCAT genes contain six or seven introns. Motif analysis showed that all NtCATs had nine motifs except NtCAT3 and NtCAT7, and Motif 5 was common to the CAT gene. Gene expression analysis showed that the expression of different types of NtCATs was tissue-specific. NtCATI–4 was mainly expressed in shoots, while NtCAT5–6 was mainly expressed in roots. Under cold stress, the expression of NtCAT1–4 was downregulated, while the expression of NtCAT5–7 was upregulated. All CAT genes were downregulated under drought and NaCl stress. The changes in NtCAT expression under different stress conditions indicated that the genes respond to environmental stimuli and participate in the defense response of tobacco. GO and KEGG annotation of NtCATs showed that the genes were involved in oxidative stress response.

Supplementary Materials

The following supporting information can be downloaded at: https://www.mdpi.com/article/10.3390/agronomy13030936/s1, Table S1. Primers in this study.

Author Contributions

L.Y., Z.L. and D.W. designed the study. X.Z. and H.L. contributed to most experiments. S.D. assisted with the analysis of the results. L.Y., H.T. and L.Z. provided guidance on the study. L.Y. and L.Z. modified the language of the manuscript. Z.L., D.W. and L.Y. wrote the manuscript. All authors have read and agreed to the published version of the manuscript.

Funding

This work was supported by the Foundation of Shandong Province Modern Agricultural Technology System Innovation Team (SDAIT-25-01) and the Foundation of Taishan brand cigarette high-quality core raw material development and application in Shandong (202102004).

Conflicts of Interest

The authors declare that the research was conducted in the absence of any commercial or financial relationships that could be construed as a potential conflict of interest.

References

  1. Hasanuzzaman, M.; Bhuyan, M.; Zulfiqar, F.; Raza, A.; Mohsin, S.M.; Mahmud, J.A.; Fujita, M.; Fotopoulos, V. Reactive Oxygen Species and Antioxidant Defense in Plants under Abiotic Stress: Revisiting the Crucial Role of a Universal Defense Regulator. Antioxidants 2020, 9, 681. [Google Scholar] [CrossRef]
  2. Sofo, A.; Scopa, A.; Nuzzaci, M.; Vitti, A. Ascorbate Peroxidase and Catalase Activities and Their Genetic Regulation in Plants Subjected to Drought and Salinity Stresses. Int. J. Mol. Sci. 2015, 16, 13561–13578. [Google Scholar] [CrossRef] [Green Version]
  3. Mhamdi, A.; Queval, G.; Chaouch, S.; Vanderauwera, S.; Van Breusegem, F.; Noctor, G. Catalase function in plants: A focus on Arabidopsis mutants as stress-mimic models. J. Exp. Bot. 2010, 61, 4197–4220. [Google Scholar] [CrossRef] [PubMed] [Green Version]
  4. Wang, W.; Cheng, Y.; Chen, D.; Liu, D.; Hu, M.; Dong, J.; Zhang, X.; Song, L.; Shen, F. The Catalase Gene Family in Cotton: Genome-Wide Characterization and Bioinformatics Analysis. Cells 2019, 8, 86. [Google Scholar] [CrossRef] [PubMed] [Green Version]
  5. Hu, L.; Yang, Y.; Jiang, L.; Liu, S. The catalase gene family in cucumber: Genome-wide identification and organization. Genet. Mol. Biol. 2016, 39, 408–415. [Google Scholar] [CrossRef] [Green Version]
  6. Frugoli, J.A.; Zhong, H.H.; Nuccio, M.L.; McCourt, P.; McPeek, M.A.; Thomas, T.L.; McClung, C.R. Catalase is encoded by a multigene family in Arabidopsis thaliana (L.). Heynh. Plant Physiol. 1996, 112, 327–336. [Google Scholar] [CrossRef] [Green Version]
  7. Esaka, M.; Yamada, N.; Kitabayashi, M.; Setoguchi, Y.; Tsugeki, R.; Kondo, M.; Nishimura, M. cDNA cloning and differential gene expression of three catalases in pumpkin. Plant Mol. Biol. 1997, 33, 141–155. [Google Scholar] [CrossRef] [PubMed]
  8. Vuosku, J.; Sutela, S.; Kestilä, J.; Jokela, A.; Sarjala, T.; Häggman, H. Expression of catalase and retinoblastoma-related protein genes associates with cell death processes in Scots pine zygotic embryogenesis. BMC Plant Biol. 2015, 15, 88. [Google Scholar] [CrossRef] [Green Version]
  9. Chen, H.J.; Wu, S.D.; Huang, G.J.; Shen, C.Y.; Afiyanti, M.; Li, W.J.; Lin, Y.H. Expression of a cloned sweet potato catalase SPCAT1 alleviates ethephon-mediated leaf senescence and H(2)O(2) elevation. J. Plant Physiol. 2012, 169, 86–97. [Google Scholar] [CrossRef]
  10. Zámocký, M.; Koller, F. Understanding the structure and function of catalases: Clues from molecular evolution and in vitro mutagenesis. Prog. Biophys. Mol. Biol. 1999, 72, 19–66. [Google Scholar] [CrossRef]
  11. Zhou, Y.B.; Liu, C.; Tang, D.Y.; Yan, L.; Wang, D.; Yang, Y.Z.; Gui, J.S.; Zhao, X.Y.; Li, L.G.; Tang, X.D.; et al. The Receptor-Like Cytoplasmic Kinase STRK1 Phosphorylates and Activates CatC, Thereby Regulating H2O2 Homeostasis and Improving Salt Tolerance in Rice. Plant Cell 2018, 30, 1100–1118. [Google Scholar] [CrossRef] [PubMed] [Green Version]
  12. Willekens, H.; Inzé, D.; Van Montagu, M.; Van Camp, W. Catalases in plants. Mol. Breed. 1995, 1, 207–228. [Google Scholar] [CrossRef]
  13. Willekens, H.; Langebartels, C.; Tire, C.; Van Montagu, M.; Inze, D.; Van Camp, W. Differential expression of catalase genes in Nicotiana plumbaginifolia (L.). Proc. Natl. Acad. Sci. 1994, 91, 10450–10454. [Google Scholar] [CrossRef] [PubMed] [Green Version]
  14. Iwamoto, M.; Higo, H.; Higo, K. Differential diurnal expression of rice catalase genes: The 5′-flanking region of CatA is not sufficient for circadian control. Plant Sci. 2000, 151, 39–46. [Google Scholar] [CrossRef]
  15. Jiao, Z.; Wang, J.; Tian, Y.; Wang, S.; Sun, X.; Li, S.; Ma, W.; Zhou, T.; Fan, Z. Maize catalases localized in peroxisomes support the replication of maize chlorotic mottle virus. Phytopathol. Res. 2021, 3, 17. [Google Scholar] [CrossRef]
  16. Lee, S.H.; An, C.S. Differential expression of three catalase genes in hot pepper (Capsicum annuum L.). Mol. Cells 2005, 20, 247–255. [Google Scholar]
  17. Willekens, H.; Villarroel, R.; Van Montagu, M.; Inzé, D.; Van Camp, W. Molecular identification of catalases from Nicotiana plumbaginifolia (L.). FEBS Lett. 1994, 352, 79–83. [Google Scholar] [CrossRef] [Green Version]
  18. Zhong, H.H.; Mcclung, C.R. The circadian clock gates expression of two Arabidopsis catalase genes to distinct and opposite circadian phases. Mol. Gen. Genet. MGG 1996, 251, 196–203. [Google Scholar]
  19. Joo, J.; Lee, Y.H.; Song, S.I. Rice CatA, CatB, and CatC are involved in environmental stress response, root growth, and photorespiration, respectively. J. Plant Biol. 2014, 57, 375–382. [Google Scholar] [CrossRef]
  20. Du, Y.Y.; Wang, P.C.; Chen, J.; Song, C.P. Comprehensive functional analysis of the catalase gene family in Arabidopsis thaliana. J. Integr. Plant Biol. 2008, 50, 1318–1326. [Google Scholar] [CrossRef]
  21. Li, Y.; Chen, L.; Mu, J.; Zuo, J. LESION SIMULATING DISEASE1 interacts with catalases to regulate hypersensitive cell death in Arabidopsis. Plant Physiol. 2013, 163, 1059–1070. [Google Scholar] [CrossRef] [Green Version]
  22. Zimmermann, P.; Heinlein, C.; Orendi, G.; Zentgraf, U. Senescence-specific regulation of catalases in Arab. thaliana (L.). Heynh. Plant Cell Environ. 2006, 29, 1049–1060. [Google Scholar] [CrossRef] [PubMed]
  23. Zou, J.J.; Li, X.D.; Ratnasekera, D.; Wang, C.; Liu, W.X.; Song, L.F.; Zhang, W.Z.; Wu, W.H. Arabidopsis CALCIUM-DEPENDENT PROTEIN KINASE8 and CATALASE3 Function in Abscisic Acid-Mediated Signaling and H2O2 Homeostasis in Stomatal Guard Cells under Drought Stress. Plant Cell 2015, 27, 1445–1460. [Google Scholar] [CrossRef] [PubMed] [Green Version]
  24. Shikanai, T.; Takeda, T.; Yamauchi, H.; Sano, S.; Tomizawa, K.-I.; Yokota, A.; Shigeoka, S. Inhibition of ascorbate peroxidase under oxidative stress in tobacco having bacterial catalase in chloroplasts. FEBS Lett. 1998, 428, 47–51. [Google Scholar] [CrossRef] [PubMed] [Green Version]
  25. Takahashi, H.; Chen, Z.; Du, H.; Klessig, D.F. Development of necrosis and activation of disease resistance in transgenic tobacco plants with severely reduced catalase levels. Plant J. 1997, 11, 993–1005. [Google Scholar] [CrossRef] [PubMed]
  26. Zhang, X.; Wei, X.; Wang, M.; Zhu, X.; Zhao, Y.; Wei, F.; Xia, Z. Overexpression of NtabDOG1L promotes plant growth and enhances drought tolerance in Nicotiana tabacum. Plant Sci. 2019, 287, 110186. [Google Scholar] [CrossRef]
  27. Fernandez-Pozo, N.; Menda, N.; Edwards, J.D.; Saha, S.; Tecle, I.Y.; Strickler, S.R.; Bombarely, A.; Fisher-York, T.; Pujar, A.; Foerster, H. The Sol Genomics Network (SGN)—From genotype to phenotype to breeding. Nucleic Acids Res. 2014, 43, D1036–D1041. [Google Scholar] [CrossRef]
  28. Lamesch, P.; Berardini, T.Z.; Li, D.; Swarbreck, D.; Wilks, C.; Sasidharan, R.; Muller, R.; Dreher, K.; Alexander, D.L.; Garcia-Hernandez, M. The Arabidopsis Information Resource (TAIR): Improved gene annotation and new tools. Nucleic Acids Res. 2011, 40, D1202–D1210. [Google Scholar] [CrossRef]
  29. Edwards, K.D.; Fernandez-Pozo, N.; Drake-Stowe, K.; Humphry, M.; Evans, A.D.; Bombarely, A.; Allen, F.; Hurst, R.; White, B.; Kernodle, S.P.; et al. A reference genome for Nicotiana tabacum enables map-based cloning of homeologous loci implicated in nitrogen utilization efficiency. BMC Genom. 2017, 18, 448. [Google Scholar] [CrossRef] [Green Version]
  30. Finn, R.D.; Coggill, P.; Eberhardt, R.Y.; Eddy, S.R.; Mistry, J.; Mitchell, A.L.; Potter, S.C.; Punta, M.; Qureshi, M.; Sangrador-Vegas, A. The Pfam protein families database: Towards a more sustainable future. Nucleic Acids Res. 2015, 44, D279–D285. [Google Scholar] [CrossRef]
  31. Sayers, E.W.; Agarwala, R.; Bolton, E.E.; Brister, J.R.; Canese, K.; Clark, K.; Connor, R.; Fiorini, N.; Funk, K.; Hefferon, T. Database resources of the national center for biotechnology information. Nucleic Acids Res. 2019, 47, D23. [Google Scholar] [CrossRef] [PubMed] [Green Version]
  32. Mitchell, A.L.; Attwood, T.K.; Babbitt, P.C.; Blum, M.; Bork, P.; Bridge, A.; Brown, S.D.; Chang, H.-Y.; El-Gebali, S.; Fraser, M.I. InterPro in 2019: Improving coverage, classification and access to protein sequence annotations. Nucleic Acids Res. 2018, 47, D351–D360. [Google Scholar] [CrossRef] [PubMed] [Green Version]
  33. Kumar, S.; Stecher, G.; Li, M.; Knyaz, C.; Tamura, K. MEGA X: Molecular evolutionary genetics analysis across computing platforms. Mol. Biol. Evol. 2018, 35, 1547–1549. [Google Scholar] [CrossRef] [PubMed]
  34. Hu, B.; Jin, J.; Guo, A.-Y.; Zhang, H.; Luo, J.; Gao, G. GSDS 2.0: An upgraded gene feature visualization server. Bioinformatics 2014, 31, 1296–1297. [Google Scholar] [CrossRef] [Green Version]
  35. Bailey, T.L.; Johnson, J.; Grant, C.E.; Noble, W.S. The MEME suite. Nucleic Acids Res. 2015, 43, W39–W49. [Google Scholar] [CrossRef] [Green Version]
  36. Liu, W.; Xie, Y.; Ma, J.; Luo, X.; Nie, P.; Zuo, Z.; Lahrmann, U.; Zhao, Q.; Zheng, Y.; Zhao, Y. IBS: An illustrator for the presentation and visualization of biological sequences. Bioinformatics 2015, 31, 3359–3361. [Google Scholar] [CrossRef] [Green Version]
  37. Livak, K.J.; Schmittgen, T.D. Analysis of relative gene expression data using real-time quantitative PCR and the 2− ΔΔCT method. Methods 2001, 25, 402–408. [Google Scholar] [CrossRef]
  38. Tian, T.; Liu, Y.; Yan, H.; You, Q.; Yi, X.; Du, Z.; Xu, W.; Su, Z. agriGO v2.0: A GO analysis toolkit for the agricultural community 2017 update. Nucleic Acids Res. 2017, 45, W122–W129. [Google Scholar] [CrossRef] [Green Version]
  39. Moriya, Y.; Itoh, M.; Okuda, S.; Yoshizawa, A.C.; Kanehisa, M. KAAS: An automatic genome annotation and pathway reconstruction server. Nucleic Acids Res. 2007, 35, 182–185. [Google Scholar] [CrossRef] [Green Version]
  40. Alam, N.B.; Ghosh, A. Comprehensive analysis and transcript profiling of Arabidopsis thaliana and Oryza sativa catalase gene family suggests their specific roles in development and stress responses. Plant Physiol. Biochem. 2018, 123, 54–64. [Google Scholar] [CrossRef]
Figure 1. Phylogenetic relationships of CATs in six plants. GenBank accession numbers of CAT sequences were as follows: NpCat1 (CAA85424.1), NpCat2 (CAA85425.1), NpCat3 (CAA85426.1), CaCat1 (AAF34718.1), CaCat2 (AAM97541.1), CaCat3 (AAM97542.1), Slcat1 (AAA34145.1), Slcat2 (AAD41256.1), Slcat3 (XP_004238430.1), Stcat1 (ABC01913.1), Stcat2 (P55312.1), Stcat3 (XP_006342134.1).
Agronomy 13 00936 g001
Figure 2. Analysis of evolutionary relationship, protein domains, multiple sequence alignment and gene structures of NtCATs. (A) Phylogenetic relationship in AtCATs and NtCATs. (B) The structure of NtCATs. The length of every region can be confirmed using the scale. (C) Nine conserved motifs of NtCATs were generated. Conserved motifs are shown in different-colored boxes. (D) The distribution of catalase core domain and catalase-related immune-responsive domain. (E) The sequences of Motif 5.
Agronomy 13 00936 g002
Figure 3. Transcriptional profiling of NtCATs. r: root; sh: shoot; sha: shoot apex.
Agronomy 13 00936 g003
Figure 4. Expression patterns of NtCATs in response to cold, drought and NaCl treatments.
Agronomy 13 00936 g004
Figure 5. Function annotation of NtCATs based on Gene Ontology (GO) and KEGG pathways.
Agronomy 13 00936 g005
Figure 6. The secondary structure pattern—including alpha helix (blue color), extended strand (red color), beta turn (green color) and random coil (yellow color)—of NtCATs.
Agronomy 13 00936 g006
Figure 7. The 3D structures of NtCAT proteins and ramachandran plot analysis. The red, brown and yellow areas represent the preferred, permitted and generally permitted areas, respectively. The lightest areas represent the impossible.
Agronomy 13 00936 g007
Table 1. The members of CAT gene family in Nicotiana tabacum L.
Gene NameGene IDLength (aa)MW (kDa)pIGRAVYSubcellular Localization
NtCAT1Nitab4.5_0000702g0130.149256.8246.70−0.568pero, chlo, cyto
NtCAT2Nitab4.5_0006960g0010.149256.8226.86−0.564pero, chlo, cyto
NtCAT3Nitab4.5_0009821g0010.147655.2546.50−0.531cyto, pero, plas, cysk_plas, nucl
NtCAT4Nitab4.5_0000407g0130.149256.8246.60−0.518cyto, pero, mito, plas, cysk_plas
NtCAT5Nitab4.5_0000588g0030.149256.9476.95−0.569pero, mito, chlo, cyto
NtCAT6Nitab4.5_0011405g0020.149056.6736.75−0.555pero, mito, chlo, cyto
NtCAT7Nitab4.5_0009395g0030.19110.2499.250.349plas, golg_plas, golg
aa: animo acid; kDa: 1000 Daltons; pero: peroxisome; chlo: chloroplast; cyto: cytoplasmic; plas: plasma membrane; cysk: cytoskeleton; nucl: nuclear; mito: mitochondrial; golg: Golgi apparatus.
Disclaimer/Publisher’s Note: The statements, opinions and data contained in all publications are solely those of the individual author(s) and contributor(s) and not of MDPI and/or the editor(s). MDPI and/or the editor(s) disclaim responsibility for any injury to people or property resulting from any ideas, methods, instructions or products referred to in the content.

