Article

Phytolith Content Negatively Affects Forage Quality of Eragrostis curvula (Schrad.) Nees

1
Centro de Recursos Naturales Renovables de la Zona Semiárida (CERZOS), Universidad Nacional del Sur-Consejo Nacional de Investigaciones Científicas y Técnicas (CONICET), Bahía Blanca 8000, Argentina
2
Departamento de Agronomía, Universidad Nacional del Sur (UNS), San Andrés 800, Bahía Blanca 8000, Argentina
3
Departamento de Biología, Bioquímica y Farmacia, Universidad Nacional del Sur (UNS), San Juan 670, Bahía Blanca 8000, Argentina
4
Departamento de Matemática, Universidad Nacional del Sur (UNS), Av. Alem 1253, Bahía Blanca 8000, Argentina
*
Author to whom correspondence should be addressed.
Agronomy 2023, 13(3), 924; https://doi.org/10.3390/agronomy13030924
Submission received: 10 February 2023 / Revised: 10 March 2023 / Accepted: 15 March 2023 / Published: 21 March 2023

Abstract

:
Phytoliths are intra and extracellular siliceous deposits present in different plant tissues. Si uptake and transport are mediated by Lsi genes and its concentration is associated with forage quality. Our objective was to determine the phytolith content in seven Eragrostis curvula genotypes at the outbreak and re-growth stages to assess its relationship with the forage quality parameters and perform a genome-wide analysis to detect the presence/absence of Lsi genes. The mean values of the phytolith content of dry matter varied between 1.94–2.26% and 2.72–4.71% at the outbreak and re-growth stages, respectively, with highly significant differences among the genotypes and phenological stages. A highly negative correlation was observed in the phytolith content and in vitro dry matter digestibility and crude protein, revealing its importance as a selection parameter in breeding programs. A positive correlation was obtained between the phytolith content and lignin, neutral detergent fiber, and acid detergent fiber. The main morphotypes of the phytoliths included saddle-shaped, bulliform, and acicular cells. Genes Lsi1, Lsi2, Lsi3, and Lsi6, previously reported in silica uptake, were identified and compared with related species, being the gene sequences highly conserved, meaning that its accumulation is probably due to differences in the gene expression or different allelic variants among cultivars.

1. Introduction

Phytoliths are silica structures that originate from the precipitation and polymerization of silicic acid through a process known as biosilicification, largely distributed throughout the plant kingdom. This process occurs at both intracellular (cytoplasm or vacuole) and intercellular spaces in almost all plant parts (i.e., roots, stems, leaves, fruits and inflorescences) [1,2].
In soil solution, silica (Si) is present in the form of silicic acid [Si(OH)4], being found in percentages ranging from approximately 10% to close to 100% in some sediments [3]. Its presence is a consequence of the leaching processes of siliceous minerals (for example, quartz and feldspars) as well as the dissolution of the silica biominerals themselves (phytoliths, diatoms, sponge spicules, among others). Silicic acid is absorbed by plant roots at <9 pH and is transported to different parts of the plant through the vascular system [4]. In most grasses, the uptake of Si is mediated by both an aquaporin-like channel gene Low silicon 1 (Lsi1) and a proton antiporter (Lsi2) gene. The gene Lsi3, together with Lsi2, are involved in the generation of a Si concentration gradient that is used by Lsi6, another aquaporin-like gene, to transport the Si to other organs [5,6]. The content of phytoliths in plants is very diverse and depends on the taxon and phenological stage, and largely on the environmental conditions (soil composition and weather conditions). In grasses, from the quantitative and qualitative point of view, leaves are the main source of phytolith production, while stems and inflorescences provide a smaller amount of phytoliths of characteristic shapes, while the presence of phytoliths in the roots is rare and shows little morphological variation [7,8].
Various hypotheses explain the role of phytoliths in plants. In the case of grasses, one of their functions would be to act as resistance elements to the compression that occurs during the transpiration process or in the absence of water, thus preventing the collapse of the cell walls [9]. Silica was also found to increase the plant tolerance to manganese and aluminum [10] as well as the resistance to excess salts in the soil [11]. In other cases such as in the genus Oryza, its protective function against certain fungi has been demonstrated, since the association of silica with the constituents of the cell wall makes it less susceptible to the enzymatic degradation that accompanies the penetration of the cell wall by the fungal hyphae [12,13]. Regarding crop yield and water use efficiency, a beneficial effect of the application of different forms of silica was observed in the plants of wheat exposed to drought stress [14] or growing in calcareous soils [15]. In Avena sativa and sugarcane, a positive response was observed in the increase in the plant height and number of leaves, respectively, when they were treated with different doses of monosilicic acid [16,17]. Although an extra supply of silica can be beneficial for plant development, if the plant is used as forage, this accumulation can be detrimental to its nutritional quality. It has been suggested that phytoliths act as a defense against herbivores, both vertebrates and invertebrates, by increasing the abrasiveness of grass blades. This causes the deterioration of animal teeth, so they therefore find it difficult to feed [18,19]. Recently, it has been demonstrated that although the plant–herbivore interaction did not promote a net silica accumulation in grasses, it enhanced their overall quality, especially in silica-poor grasses, being preferred by herbivores. This fact could partially explain why certain environments are dominated by silica-rich grasses [20]. Moreover, it has been observed that grasses growing in soils with an additional contribution of silica are significantly more abrasive than those that grow without it [21]. Herbivores preferentially eat grasses with lower silica content, but when they are forced to consume grasses rich in this mineral, their growth is lower [19,21,22]. This is not because they consume less grass, but because they absorb less carbohydrates and nitrogen. The reasons may be because the animals must chew less to avoid excessive use of their teeth, resulting in less mechanical rupture of the cells. On the other hand, silica particles directly protect the proteins and the starch deposited in the chlorenchyma cells of the leaf from mechanical damage by chewing, and the silica acts chemically, preventing digestion or absorption [23].
Silica content determination methods basically consist of dry matter calcination and acid digestion, but differ in the techniques used to quantify it. Of these methods, there is no universally accepted one, since they all have one or more disadvantages [24,25]. Subsequently, silicon can be quantified by gravimetry, colorimetry, and atomic absorption spectrophotometry [24,25,26].
Initially, the taxonomic classifications of phytoliths sought to associate certain morphological types with their plant of origin. That is, each phytolith was specific to a particular plant species (orthotaxonomic approach). Subsequently, it was observed that different morphological types of phytoliths could be found in the same orthotaxon (multiplicity) as well as morphologically similar phytoliths in different orthotaxons (redundancy) [27,28]. Thus, it is common to find in the phytolith literature that the same morphological type is named in different ways, or that in the different classifications, the same morphological type has dissimilar ranges of variability [29]. The International Code for Phytolith Nomenclature 1.0 was published in 2005, where a standard protocol and a glossary of descriptors (nouns and adjectives) were presented to describe and name the types of phytoliths [30].
Regarding the species under study, Eragrostis curvula (Schrad.) Nees, weeping lovegrass, belongs to the Poaceae (Gramineae) family, Eragrostoideas subfamily, Eragrostea tribe. It is a perennial plant, native to Southern Africa and is distributed throughout the world, especially in arid and semiarid regions. It is used mainly as forage, since it has spring–summer growth and has a high biomass production compared with forage from temperate climates. With regard to other forage quality indicators, weeping lovegrass, like other species from tropical or subtropical regions, has a high fiber content and low protein in its tissues, resulting in decreased digestibility, and therefore in animal performance [31]. Since E. curvula presents a C4 leaf anatomy, it has a low proportion of mesophyll (easily digestible tissue) and a high proportion of vascular and epidermal tissue; this ratio increases as the plant matures. The sheaths that surround the bundles, characteristic of plants with a high photosynthetic rate, are numerous and highly indigestible in this grass [32,33,34]. Digestibility shows a marked decline as the reproductive stage (stem elongation) is reached, a trend that does not change in the subsequent shoots [35].
This work aimed at determining the relative phytolith content in the vegetative tissues of seven weeping lovegrass genotypes at two clipping dates (November and April), analyzing the correlation between the number of phytoliths with other variables associated with forage quality, the identification of the genes involved in silica uptake through the exploration of the E. curvula genome, and the description of the phytolith morphotypes. The data collected here can be used in breeding programs to improve the forage quality of E. curvula.

2. Materials and Methods

2.1. Plant Material

Seven cultivars of Eragrostis curvula were evaluated: Tanganyika, Morpa, Don Pablo, Don Juan, Don Eduardo, Don Luis, and 9355. A trial with a completely randomized block design (b = 3) was carried out over two consecutive years at the Experimental Station of the Asociación de Cooperativas Argentinas (ACA) located at Cabildo, Buenos Aires, Argentina (39°36′ S, 61°64′ W).
Plants were planted in plots with coarse loam, thermal, and calcic petrocalcic soils [36] and each plot consisted of four rows (0.5 m spacing) of eight plants each (0.3 m apart). However, to avoid the edge effects, only the two central rows were considered. Plots were fertilized with 100 kg ha−1 of urea (46–0–0) one month before the first cut and supplementary irrigation was provided for 3 months prior to the second cut. Each cultivar was hand clipped at 5 to 10, dried at 65 °C to constant weight, and ground with a 2-mm screen in a Wiley mill [31].
The temperature and precipitation data (Figure S1) were recorded at the experimental site with a Davis Weather Monitor II weather station (Davis Instruments Corp., Hayward, CA, USA).

2.2. Phytolith Extraction and Experimental Design

Three biological replicates per sample for each genotype were analyzed in two different phenological stages: outbreak (in November) and re-growth (in April) using the same plants analyzed by Luciani et al. [31] for other forage quality variables.
Each sample was composed of 1.5 g of dried tissue (tillers) cut into pieces of approximately 1.5–2 cm. Before the extraction of phytoliths, samples were pretreated to remove substances deposited on the plant surface such as pollen and the cells of other plants as well as edaphic and atmospheric materials. For this, they were washed with distilled water twice, shaking by inversion 4–5 times between washes. Then, a third wash was carried out with distilled water and 2% non-ionic detergent and gentle agitation for 12–14 h. Subsequently, samples were sonicated for 20 min and the material was washed again with distilled water until the detergent was completely removed. After this, the tubes were placed in the oven at 45 °C for 2 days. Then, samples were chemically digested and calcined with a technique specifically developed to remove alkali and alkaline earth metals in soluble chloride form [37,38,39]. The crucibles were placed in an oven at 45 °C for 2 days and then transferred to a desiccator until they reached room temperature. Subsequently, they were weighed on a four-decimal place balance (CW: crucible weight). The plant material was placed in the tared crucibles and weighed (IDM: initial dry matter). Subsequently, the samples were calcined in the muffle at 200 °C for 2 h and transferred to 250 mL beakers, adding a 5N hydrochloric acid solution to each beaker until the material was completely covered. The beakers were placed on hot plates under a fume hood, stirring for 20 min after reaching the boiling point. The material was filtered with ash-free paper (Whatman 42–110 mm) and washed with abundant distilled water until no chloride ions were detected in the sample. The presence of chlorides in the wash water was observed as a whitish turbidity that was detected by adding 1% silver nitrate. The filter papers with the plant material were placed on the porcelain crucibles and dried in an oven at 40 °C for 24 h. Then, these were calcined in a muffle at 800 °C for 4 h and allowed to cool in the muffle. Subsequently, the samples were transferred to a desiccator and weighed (CWP: crucible weight with phytoliths). Phytolith weight (PW) was determined using the following expression: PW = CWP − CW.
Finally, the percentage of phytoliths present in the dry matter was calculated as follows: % phytoliths = IDM × PW/100.

2.3. Statistical Analysis

An analysis of variance (ANOVA) was performed to compare the mean values of the different genotypes and the cut-off dates (outbreak and re-growth) and their interactions. To evaluate the differences between the different genotypes, comparisons of the paired means were made using Fisher’s test.
In addition, the relationships between the phytolith content (PhC) and other forage quality variables determined by Luciani et al. [31] on the same samples were analyzed. These variables were: crude protein (CP), in vitro dry matter digestibility (IVDMD), lignin (L), neutral detergent fiber (NDF), and acid detergent fiber (ADF). This analysis was performed using a Pearson correlation test and principal component analyses.
The statistical software Infostat [40] was used for all of the data analyses.

2.4. Genome-Wide Analysis to Look for Lsi Genes and Phylogenetic Analysis

The genes corresponding to the silicon (Si) transporters of Oryza sativa, Lsi1 (Os02g0745100), Lsi2 (Os03g0107300), Lsi3 (Os10g0547500), and Lsi6 (Os06g0228200) were used as the query to detect via BLAST alignment [41] and their orthologous genes in E. curvula [42], Eragrostis tef [43], Setaria italica [44], Zea mays [45], Sorghum bicolor [46], Triticum aestivum [47], Hordeum vulgare [48], Lolium perenne [49], and Panicum virgatum [50]. The protein sequences of the orthologous genes (Table S1) were aligned using MUSCLE software [51] and a phylogenetic tree was constructed using the MEGA X software [52] and the neighbor-joining method [53].

2.5. Microscopic Observations

Once the phytoliths were obtained using the Labouriau technique [39], they were spread on a slide and rehydrated with distilled water to favor the observation with a Nikon Eclipse 80i microscope and a Nikon DXM1200F digital camera.
The classification of phytoliths by the shape of the isolated forms and associations was carried out following the International Code for Phytolith Nomenclature 1.0 (ICPN) [30].

3. Results

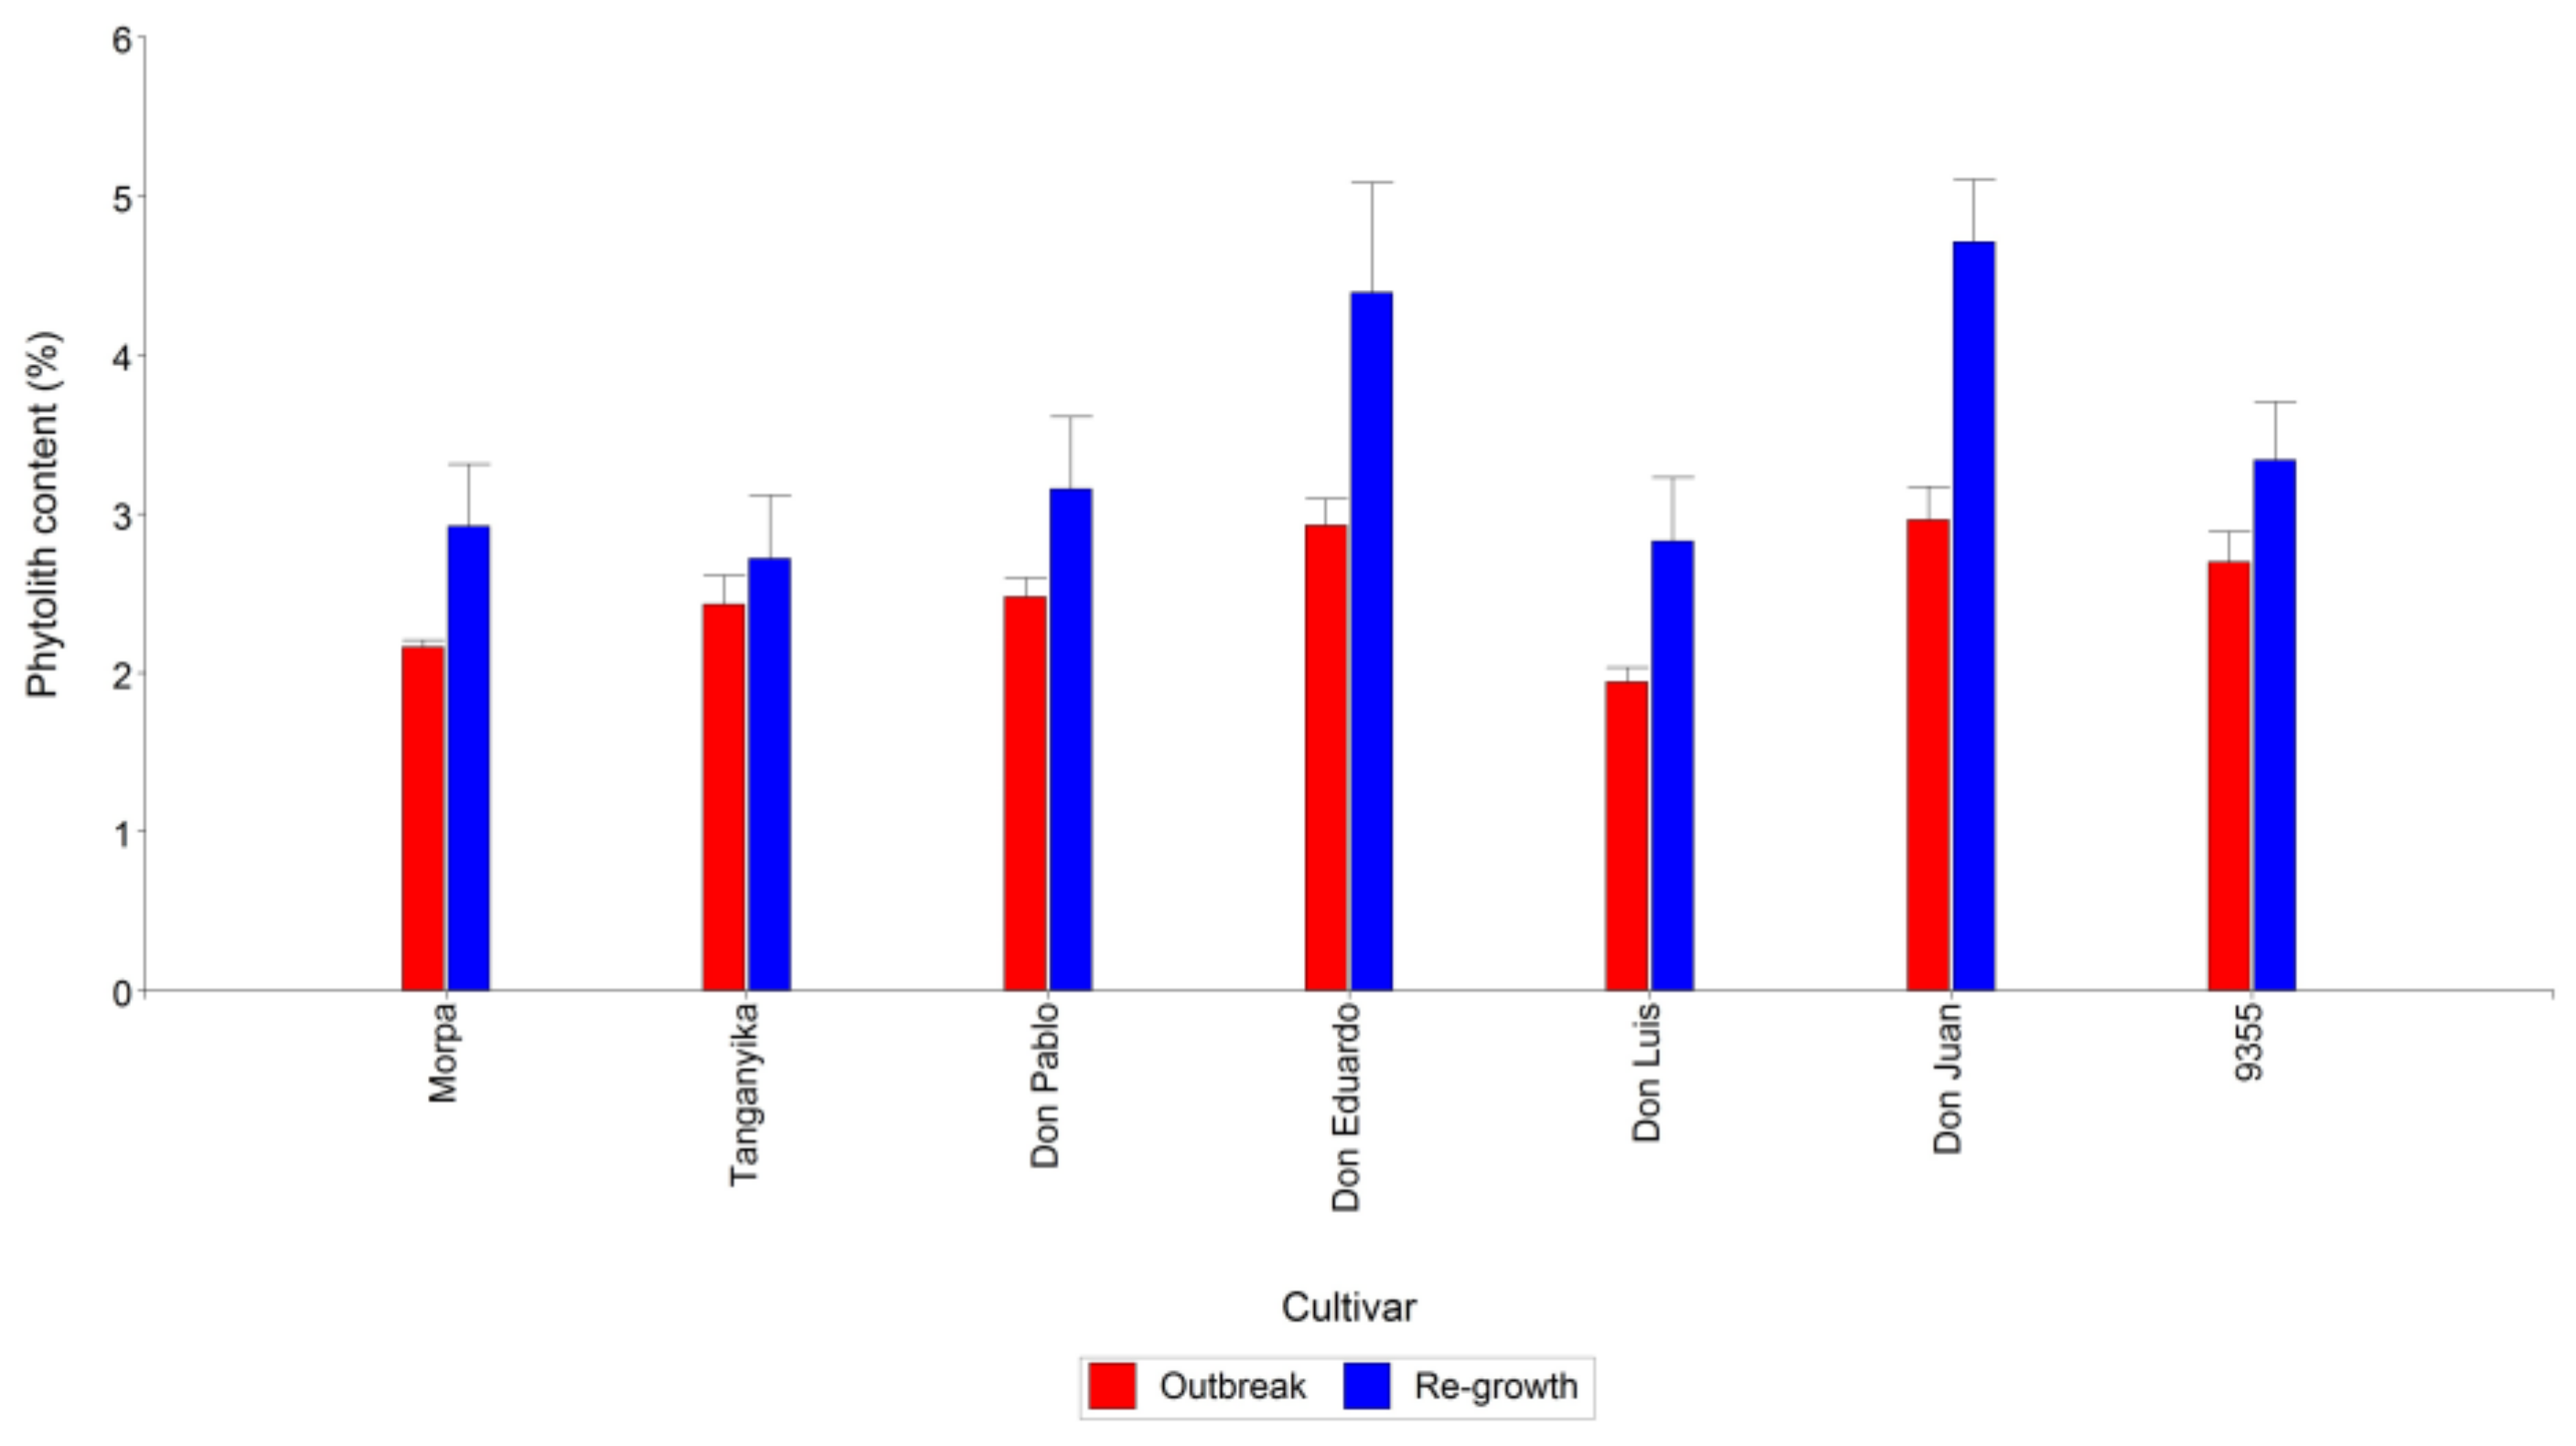
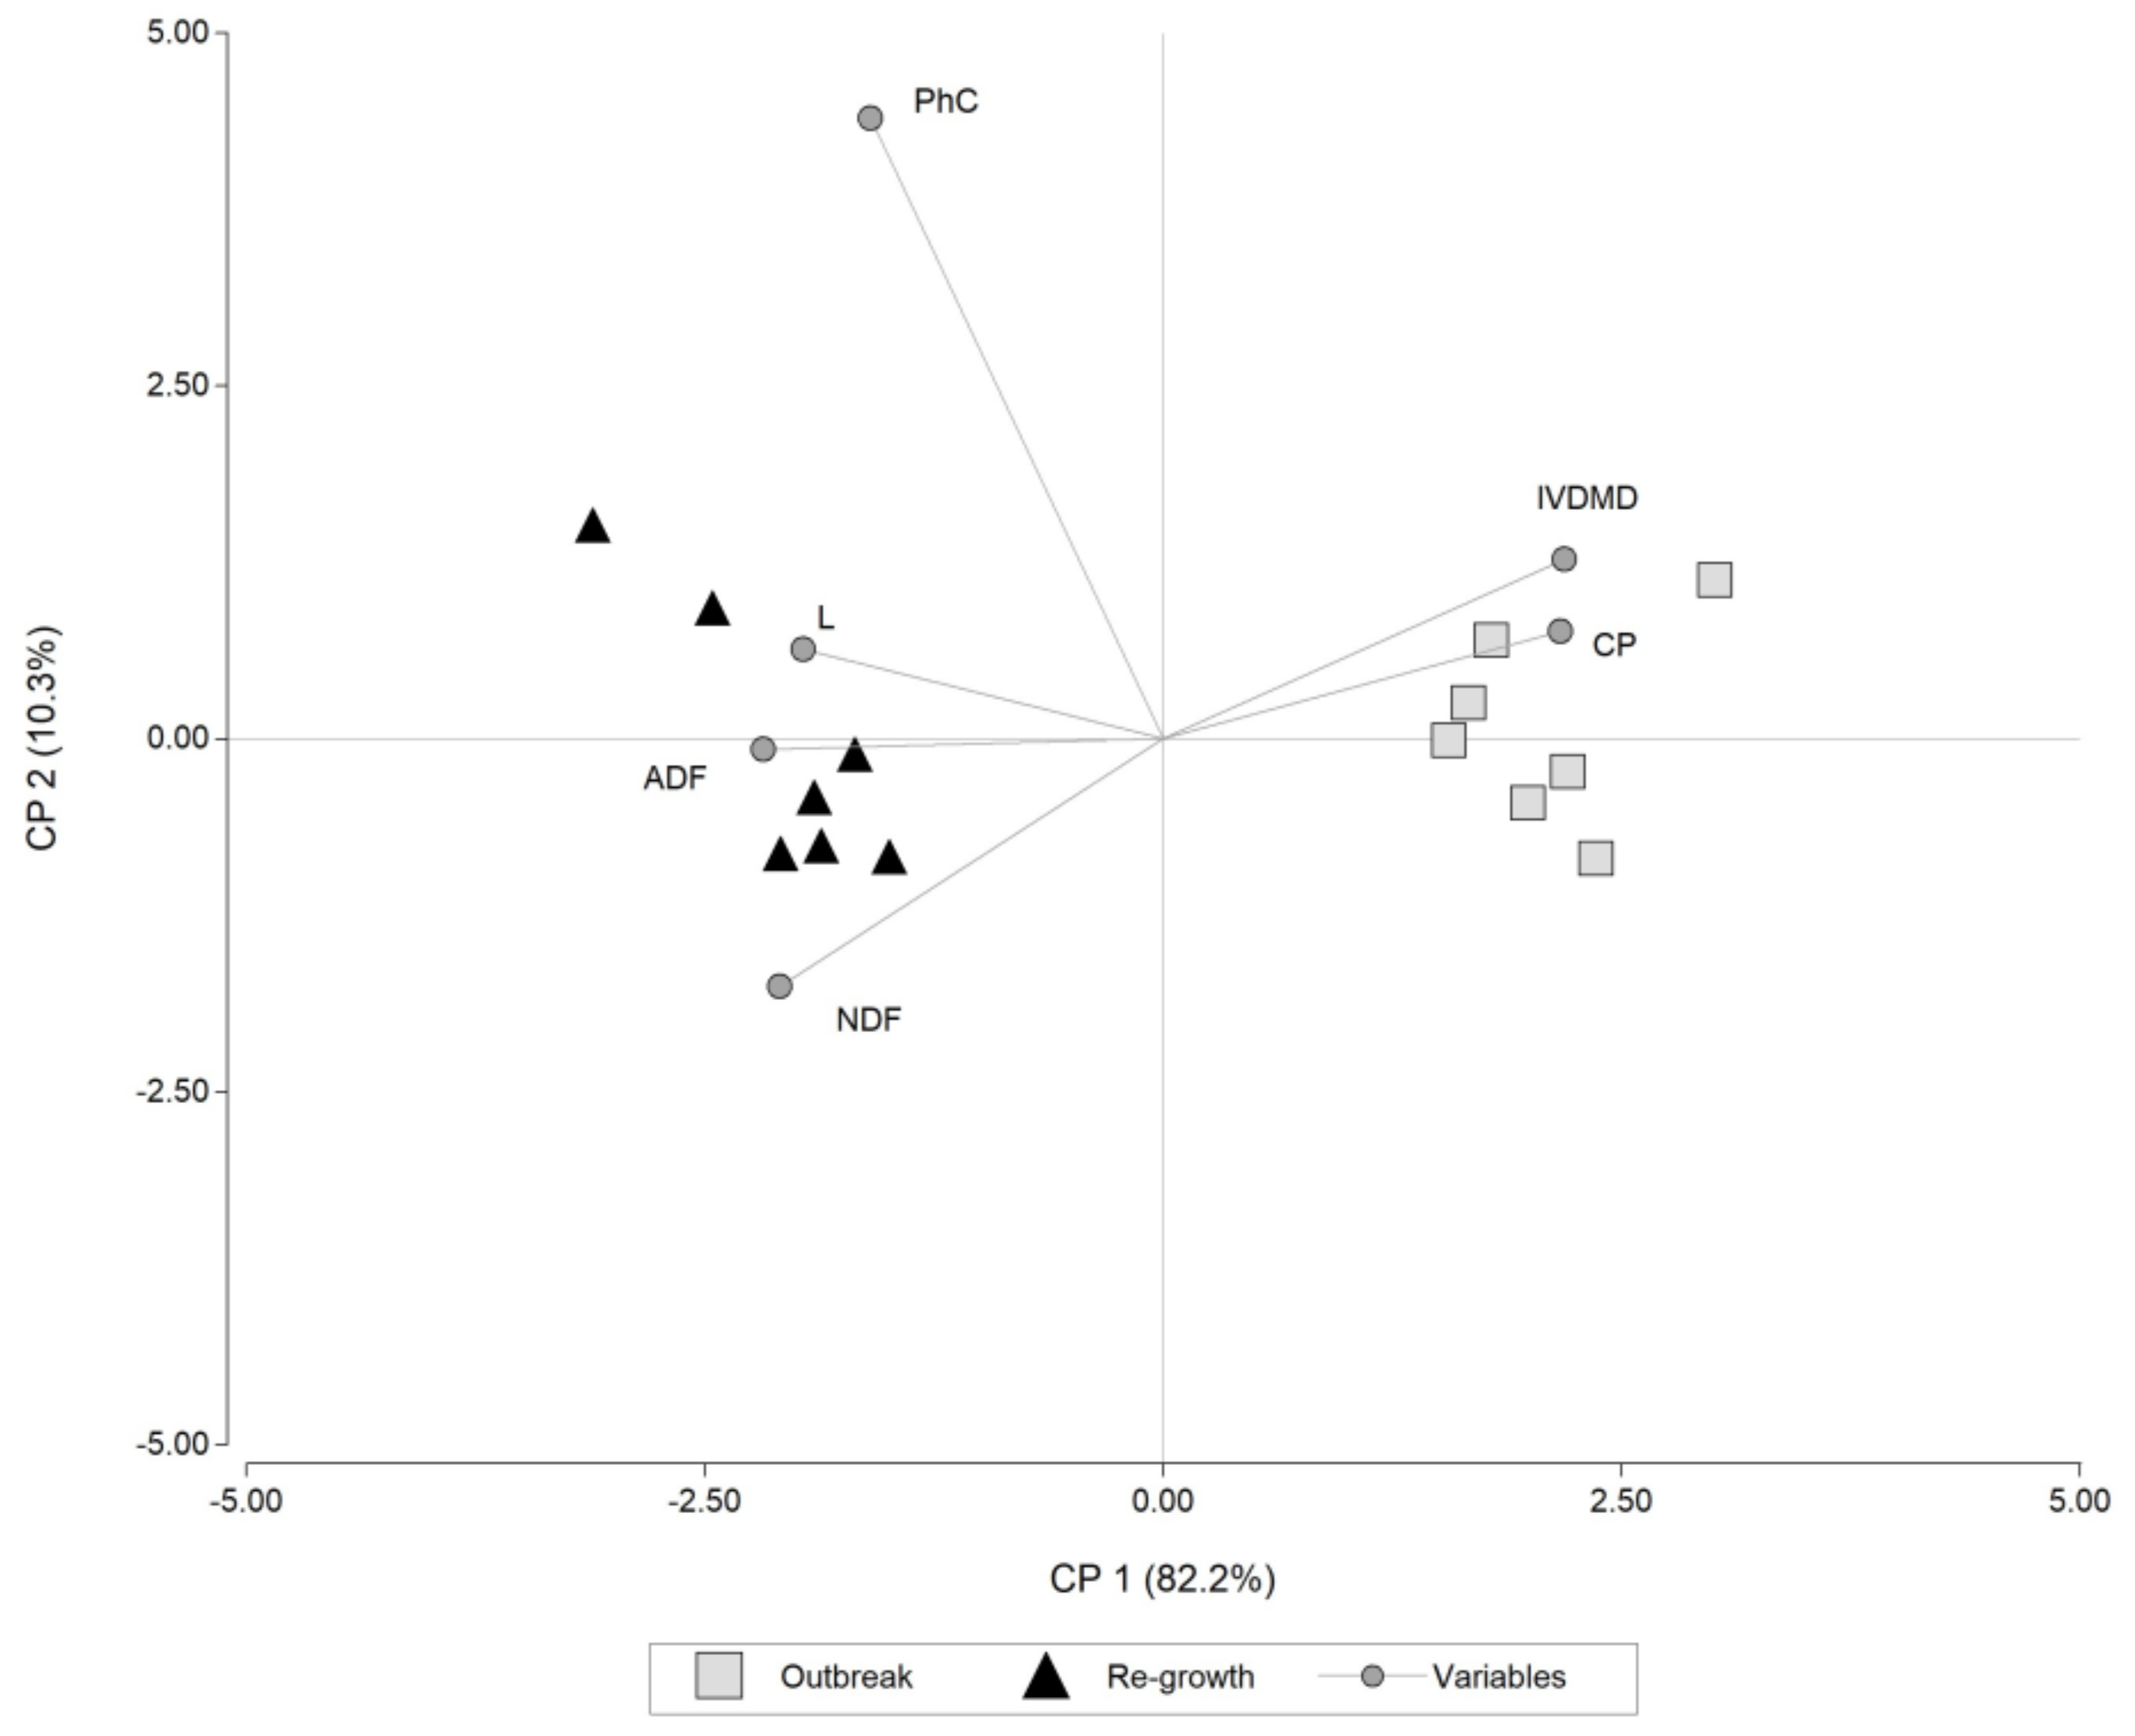
3.1. Phytolith Content and the Interaction between Cultivars and Cutting Time

The average phytolith content in dry matter were 2.5 and 3.44% for the outbreak and the re-growth stages, respectively (Figure 1). Using a significance level greater than 39%, the ANOVA test did not detect the interaction between the cultivars and clipping dates (Table 1). When analyzing the differences between cultivars, Don Luis, Morpa, Tanganyika, and Don Pablo differed significantly in the mean phytolith content from Don Eduardo and Don Juan, and finally, 9355 differed from Don Juan (Fisher test, p < 0.05; Table 2). The highest phytolith content at both clipping dates was shown by Don Juan, although this value did not differ significantly from the one observed in Don Eduardo. In contrast, the lowest phytolith content was shown by Don Luis, although it did not show significant differences with Morpa, Tanganyika, Don Pablo, and 9355.
Correlation analysis between the phytolith content (PhC) and crude protein (CP), lignin (L), neutral detergent fiber (NDF), acid detergent fiber (ADF), and in vitro dry matter digestibility (IVDMD) revealed a negative relationship between PhC and IVDMD and CP (r = −0.6 in both cases) and a positive correlation with ADF (r = 0.7), L (r = 0.6) and NDF (r = 0.5).
The first two components of the principal component analysis (PCA) displayed a contribution rate of 92.5%. All variables showed more than 76% of their variation represented by these two components. The first component displayed a high and positive correlation with CP and IVDMD (r > 0.96) and a negative correlation with NDF, ADF, L, and PhC (r < −0.71), whereas the second was positively correlated with PhC (r = 0.69). Outbreak and re-growth stages were completely separated in component 1 (Figure 2), showing that the re-growth stage had higher values for ADF, L, NDF, and PhC than the outbreak stage with lower values for the IVDMD and CP variables.

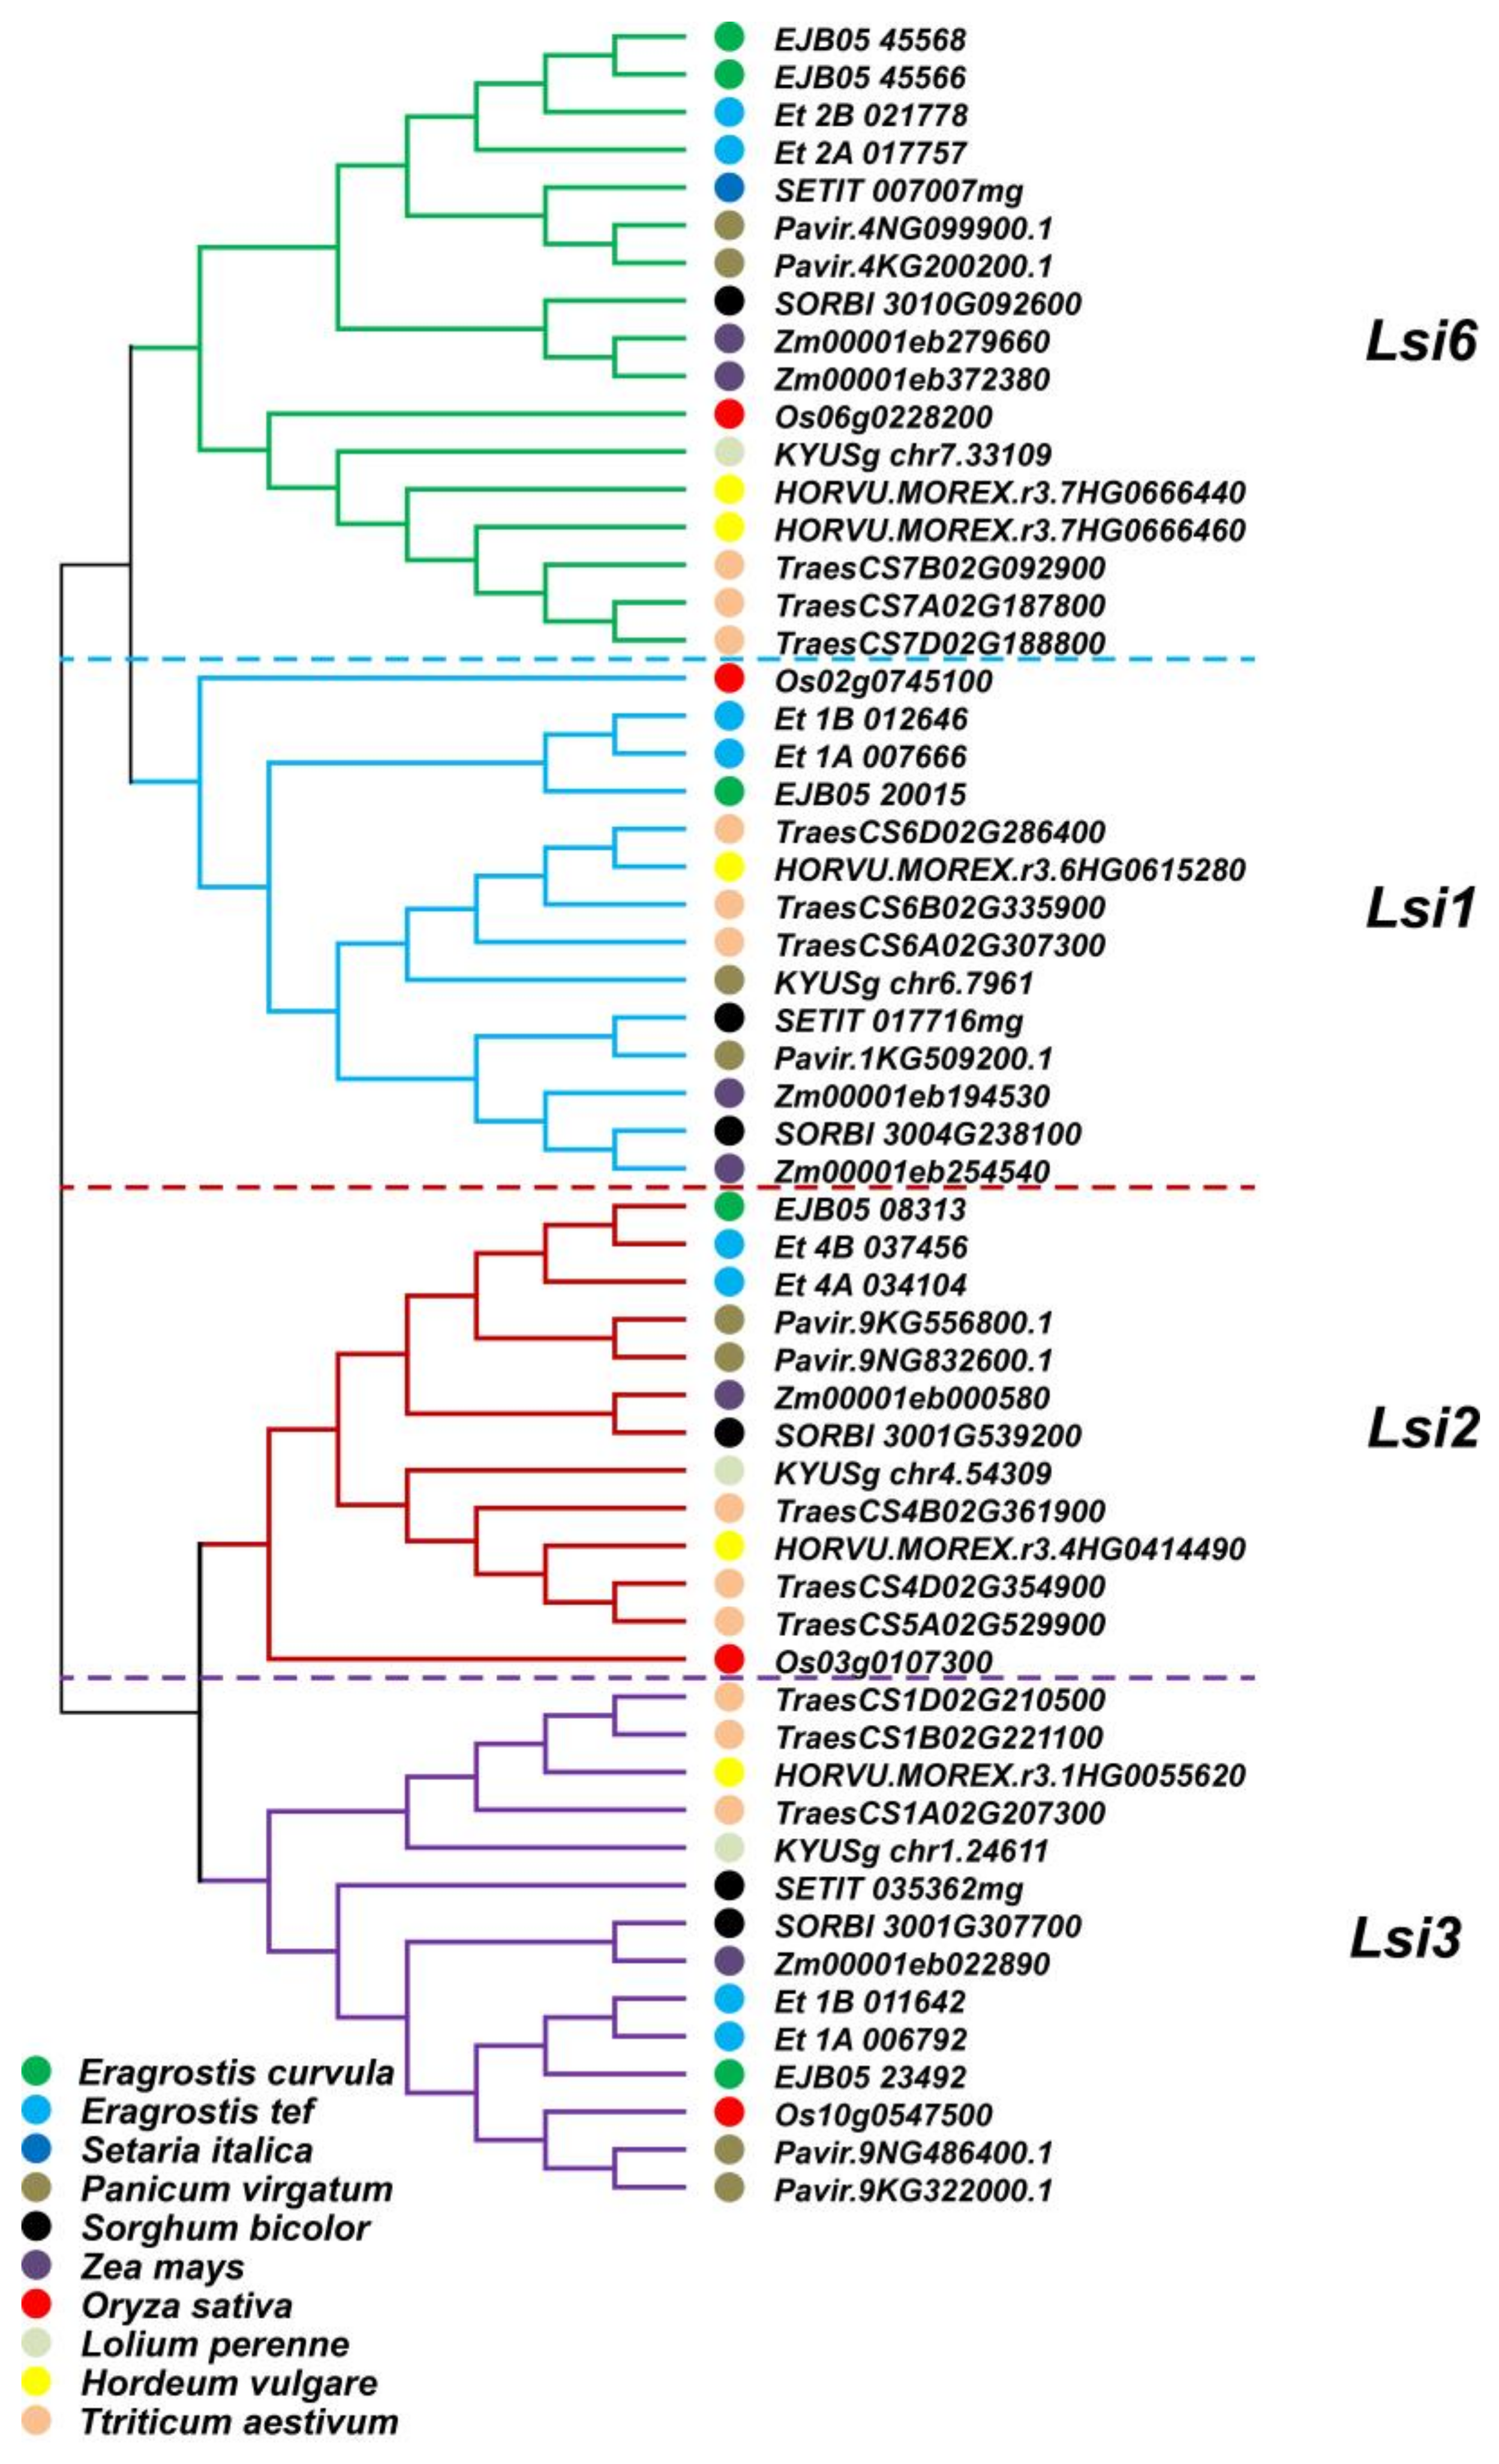
3.2. Genome-Wide Analysis to Look for Lsi Genes and Phylogenetic Analysis

Based on the orthologous sequences of rice Lsi proteins, four Lsi genes were identified in weeping lovegrass with a key role in the capture and transportation of Si, Lsi1, Lsi2, Lsi3, and Lsi6. A phylogenetic tree was constructed using the sequence of the Lsi transporter genes of E. curvula and other grass species (Figure 3). These results show that Lsi genes are conserved in all of the analyzed grasses.

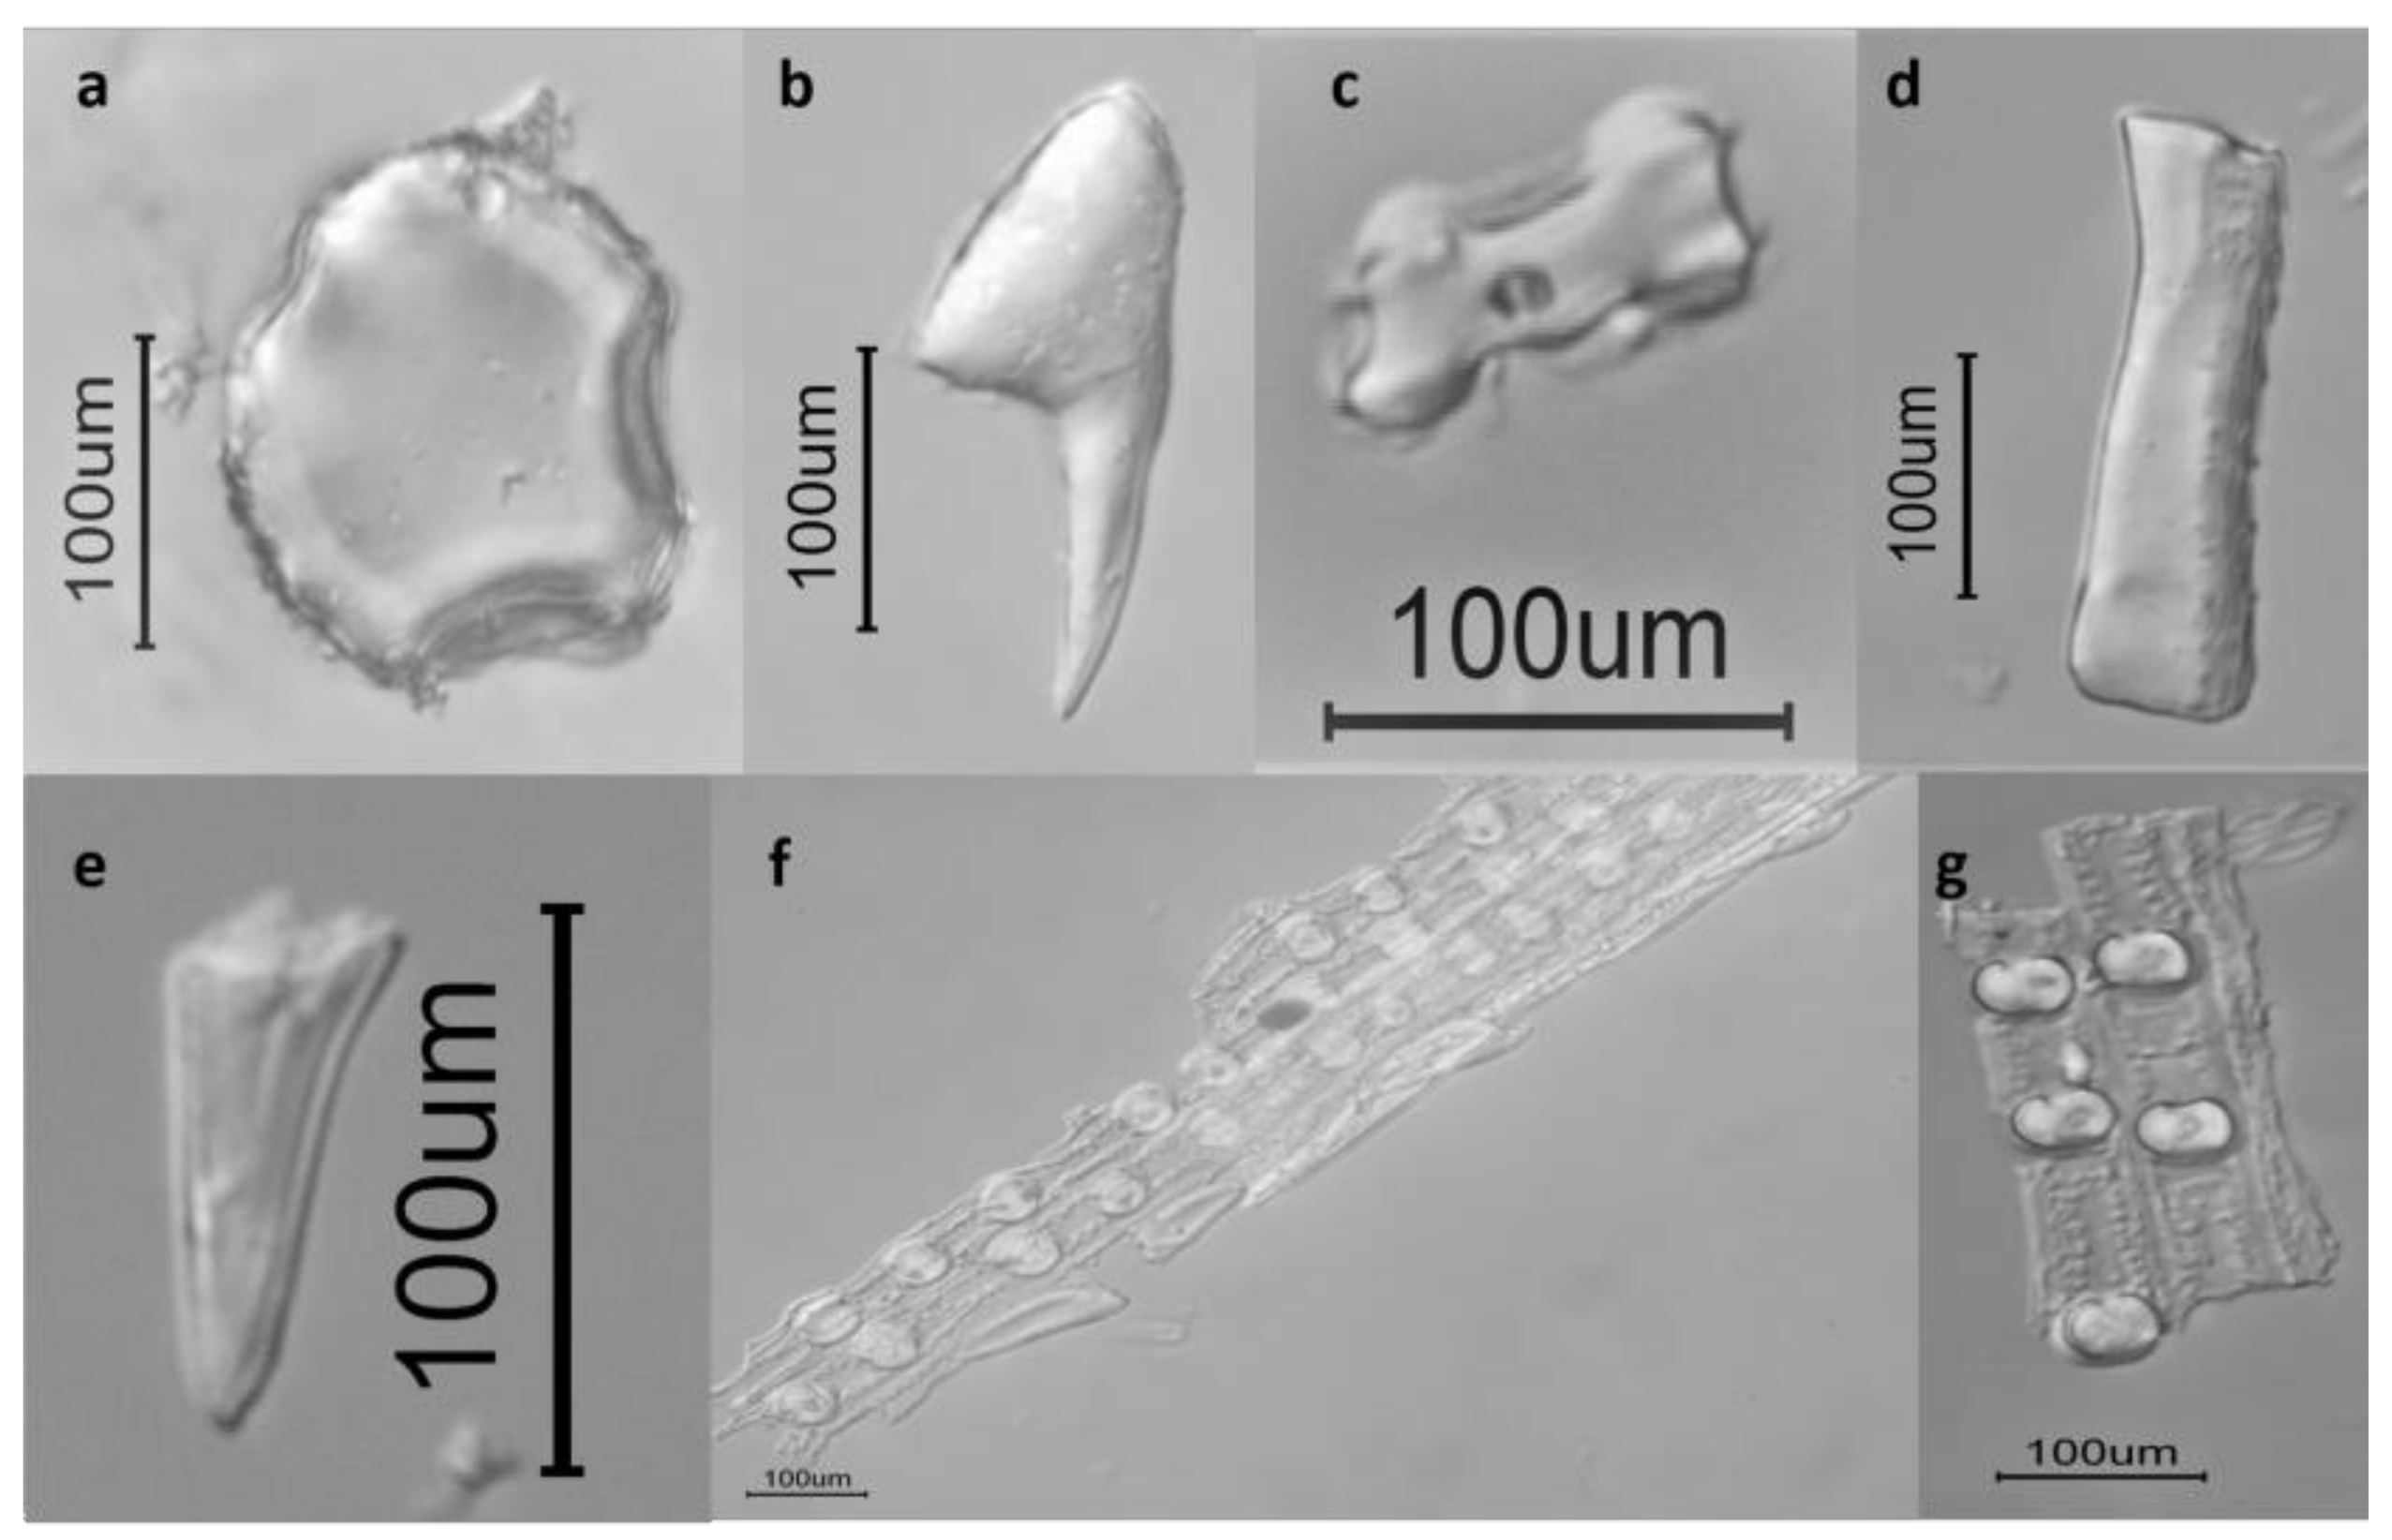
3.3. Microscopic Observations

Different phytolith morphotypes could be observed in the E. curvula samples of tillers. In conformity with The International Code for Phytolith Nomenclature 1.0 [30] and based on their shape and anatomical origin, they were named as the cuneiform bulliform cell, bilobate short cell, acicular hair cell, unciform hair cell, elongate entire cylindric, ovate cell, and short saddle-shaped cell (Figure 4).

4. Discussion

This was the first quantitative study on phytoliths in E. curvula. Here, we showed that the content of phytoliths varied among different genotypes and phenological stages. Moreover the degree of silicification has a significant genetic component in this species. Furthermore, it was found that phytolith content has a negative correlation with parameters associated with forage quality such as in vitro dry matter digestibility and crude protein.
In all of the analyzed E. curvula genotypes, a higher content of phytoliths at the re-growth stage was observed than at the outbreak, confirming the fact that as the phenological state advances, its phytolith content increases, concomitantly decreasing its forage quality. Previously, Luciani et al. [31], based on the same samples, showed that at the re-growth stage, plants had higher values of ADF, NDF, and L content than at the outbreak, whereas for IVDMD and CP, the re-growth stage displayed the lowest values. Gargano et al. [54] had already detected a decrease in the forage quality of weeping lovegrass cv Tanganyika and Digitaria eriantha cv Irene while progressing the crop cycle. When analyzing the interaction between the different genotypes and clipping dates, it was observed that there was no interaction between the two cutting moments and the cultivars for the mean values of the phytolith content. This shows that the degree of silicification would have a significant genetic component and that the response patterns of the genotypes are maintained under different management conditions. The Morpa, Tanganyika, and Don Luis cultivars showed the lowest variation in their phytolith content at both clipping dates, while Don Juan and Don Eduardo expressed a higher content of phytoliths during re-growth. Don Pablo and 9355 did not differ significantly in both groups.
In grasses, the presence of silica is associated not only with intrinsic metabolic processes, but also with the growth and productivity of the plant, and with the phenomenon of resistance to diseases, toxicities, insect attacks, and effects produced by herbivores [20,55]. In general, in forage species, decreases of up to 3% in in vitro dry matter digestibility have been observed for each unit of increase in silica, mainly due to the reduced digestion of cell wall polysaccharides [56,57]. According to Leigh [32], the concentration of silica in the epidermis of E. curvula could explain its low digestibility. Our results reinforce this assumption.
A higher accumulation of phytoliths in plants makes them distasteful as well as gives them a prickly texture, which grazers usually avoid [58]. This could also be the reason for older seedlings to be better defended, due to the higher accumulation of phytoliths [59]. The silica content increases as the phenological stage of the plants advances, regardless of the genotype, implying that weeping lovegrass plants will decrease their quality as forage as they reach more advanced phenological stages. The lower the silica content and the smaller the variation between the content in the shoot and regrowth, the better the quality of the weeping lovegrass forage.
Phytolith content assessment is not an easy task since there are multiple and laborious methods with many technical steps that make them imprecise [27,39,56,60,61]. The methods differ in the type of digestion used to mineralize and solubilize silicon and the techniques used to quantify it [62]. Of these methods, there is not one universally accepted, because all present one or more disadvantages such as the oxidation of organic matter requires a lot of time, uses potentially dangerous acids, requires calibration, there is a loss due to splashing, and special teams are needed [24,25]. Silicon can be quantified by gravimetry, colorimetry, atomic absorption spectrophotometry, and inductively coupled plasma emission spectroscopy [24,25,26]. Of these analytical techniques, the most accessible, but at the same time the most laborious, widely used in the past, is the determination by gravimetry [63]. A very important aspect to be considered when silicon is analyzed in plant tissue is the lack of reference materials or standards [25], which leaves an uncertainty about the accuracy of the data obtained. In this study, the chosen methodology combined calcination with chemical digestion with a pretreatment that significantly improved the removal of contaminants. By pretreating the samples with 5 N hydrochloric acid, ADF was obtained, which includes cellulose, lignin, and silica. Subsequently, when this fraction is calcined at 800 °C, the silica and nitrogen, which are not soluble in an acid detergent, remain as residues. Since the determination is gravimetric, we minimized the error of starting from dry matter samples greater than one gram. Our results provide an indication of the accuracy of the methodology used for weeping lovegrass.
The analysis of the Si absorption in more than 500 species of plants has made it possible to differentiate between those that accumulate Si such as Oryza sativa, Equisetum arvense, and Saccharum officinarum, or those that do not accumulate Si (less than 3 mg Si/g dry matter) such as most dicotyledons including legumes [1]. Consequently, the Si concentrations in plant tissues vary considerably, from only 0.1% (dry weight basis) in dicotyledons, over 1–3% in grasses such as oats (Avena sativa) and rye (Secale cereale), up to 10–15% in other members of the Gramineae family, for instance, rice and in the Cyperaceae family (sedges) [64,65]. Additionally, the silica content shows great variation, even within grasses with the same leaf anatomy. In C4 grasses, the percentage of SiO2 in dry matter varies from Cynodon dactylon at 5.2% [56] to Nassella mucronata at 2.29% [66] while in grasses with C3 leaf anatomy, the values are in general lower, like in Phalaris arundinacea of 1.3%, Avena sp. of 1% and ryegrass of 2.9% [56]. In E. curvula, the phytolith content was variable among the genotypes, ranging from 2.39 to 3.84% considering the average of the two analyzed phenological stages.
Si accumulation in the plant organs is associated with Lsi1, Lsi2, Lsi3, and Lsi6 Si transporter expression [67]. Since the presence of these genes is conserved across diverse grass species (Figure 3) with different digestibility and Si content, it is reasonable to think that the differences in Si in E. curvula cultivars are associated with Lsi expression through the presence of different allelic variants or other factors related to the whole Si pathway. Looking for allelic variants and expression analyses by qPCR should be carried out to confirm this hypothesis. For instance, in Zea mays, Lsi6 and Lsi1 were found to be expressed until the final developmental stage of the kernels, showing a correlation between gene expression and Si accumulation [68]. In rice, similar results obtained by analyzing Lsi6 expression were also associated with the accumulation of Si in the shoots [5].
The biogenic process of phytolith formation creates intriguing irregular (dumbbells, saddles, bowls, boats, bulliform, tracheid, polylobate, etc.) to regular shapes (spherical, globular, cylindrical, hexagonal, cubical, and hair-cell, etc.), which may or may not cross the different levels of taxonomic boundaries [58,69]. Phytolith size is under genetic control and it is variably affected by temperature, heat stress, physiology of the cells, age and maturity of the plant tissues, seasonal climatic changes, and disease incidence [1]. A single plant species (and sometimes even different plant parts of the same species) can produce many different morphologies of phytoliths [70], but some forms are characteristic of certain taxonomic groups [71]. In E. curvula, we mainly observed the saddle-shape type, characteristic of the C4 grasses [72] and other forms such as those from hairs, bulliform cells, and hooks that have an epidermic origin and are observed in different grasses, which do not have a taxonomic value [71].
The production of phytoliths is very diverse depending on the species, so according to the content of phytoliths obtained in this test, it could be said that Eragrostis curvula presents silica values that correspond to those usually presented by other species of grasses also used as forage. This characteristic in phytolith content, added to the great adaptability to semi-arid regions shown by weeping lovegrass, makes it a very convenient species to form the grazing chain of any livestock establishment.

5. Conclusions

(1)
This is the first study on the phytolith content and the relationship with forage quality parameters in different genotypes and phenological stages in Eragrostis curvula.
(2)
The content of phytoliths in E. curvula, expressed as a percentage of dry matter, is similar to the one usually shown by other forage grasses from semi-arid regions.
(3)
Based on the criterion that lower phytolith content implies better palatability and digestibility, the best cultivars analyzed here were Don Luis, Morpa, and Tanganyika. Additionally, those with the lowest forage value were Don Juan and Don Eduardo.
(4)
The low forage quality of weeping lovegrass could be attributed, in part, to the content of phytoliths, particularly at the re-growth stage.
(5)
The variation in the degree of silicification observed in the analyzed cultivars was independent of the plant phenological stage.
(6)
The sequence of Lsi genes involved in Si uptake and transport was conserved across the grass family.
(7)
The results obtained in this work constitute a valuable source for breeding programs to select genotypes based on the phytolith content to improve the E. curvula forage quality.

Supplementary Materials

The following supporting information can be downloaded at: https://www.mdpi.com/article/10.3390/agronomy13030924/s1, Table S1: Protein sequences used for the phylogenetic analysis of the Lsi genes, Figure S1: Temperature and precipitation data obtained at the experimental site with a Davis Weather Monitor II weather station. The averages of the maximum, average and minimum temperatures (°C) and the average precipitations (mm) of each month were observed during the growth cycle of the Eragrostis curvula plants in which two cutting moments were carried out.

Author Contributions

Conceptualization, J.G. and M.D.; Methodology, J.G., M.D. and J.C.; Formal analysis, J.G. and A.G.; Investigation, J.G., M.D., J.C., A.G. and V.E.; Resources, V.E.; Data curation, J.C. and A.G.; Writing—original draft preparation, J.G., M.D., J.C., A.G. and V.E.; Writing—review and editing, J.G., M.D., J.C. and V.E.; Supervision, M.D. and V.E.; Project administration, V.E.; Funding acquisition, V.E. All authors have read and agreed to the published version of the manuscript.

Funding

This research was funded by the Agencia Nacional de Promoción Científica y Tecnológica (ANPCyT, PICT Raíces 2017–0879), Universidad Nacional del Sur (PGI 24/A199), and Consejo Nacional de Investigaciones Científicas y Tecnológicas (CONICET).

Data Availability Statement

The data presented in this study are available on request from the corresponding author.

Conflicts of Interest

The authors declare no conflict of interest.

References

  1. Nawaz, M.A.; Zakharenko, A.M.; Zemchenko, I.V.; Haider, M.S.; Ali, M.A.; Imtiaz, M.; Chung, G.; Tsatsakis, A.; Sun, S.; Golokhvast, K.S. Phytolith Formation in Plants: From Soil to Cell. Plants 2019, 8, 249. [Google Scholar] [CrossRef] [PubMed] [Green Version]
  2. Katz, O.; Puppe, D.; Kaczorek, D.; Prakash, N.B.; Schaller, J. Silicon in the Soil–Plant Continuum: Intricate Feedback Mechanisms within Ecosystems. Plants 2021, 10, 652. [Google Scholar] [CrossRef] [PubMed]
  3. Bowdery, D. Phytolith Analysis Applied to Pleistocene-Holocene Archaeological Sites in the Australian Arid Zone; British Archaeological Reports Ltd.: Oxford, UK, 1998; p. 216. [Google Scholar]
  4. Feng, J.; Yamaji, N.; Mitani-Ueno, N. Transport of silicon from roots to panicles in plants. Proc. Jpn. Acad. Ser. B 2011, 87, 377–385. [Google Scholar] [CrossRef] [Green Version]
  5. Yamaji, N.; Mitatni, N.; Ma, J.F. A transporter regulating silicon distribution in rice shoots. Plant Cell 2008, 20, 1381–1389. [Google Scholar] [CrossRef] [Green Version]
  6. Yamaji, N.; Sakurai, G.; Mitani-Ueno, N.; Ma, J.F. Orchestration of three transporters and distinct vascular structures in node for intervascular transfer of silicon in rice. Proc. Natl. Acad. Sci. USA 2015, 112, 11401–11406. [Google Scholar] [CrossRef] [Green Version]
  7. Sendulsky, T.; Labouriau, L.G. Corpos silicosos de gramíneas dos Cerrados. I. AABC 1966, 38, 159–185. [Google Scholar]
  8. Zucol, A.F. Fitolitos. III. Asociaciones fitolíticas de Piptochaetium montevidense (Stipeae: Arundinoideae: Poaceae). Una nueva metodología descriptiva. Bol. Soc. Argent. Bot. 2001, 36, 69–85. [Google Scholar]
  9. Zurro, D. El análisis de fitolitos y su papel en el estudio del consumo de recursos vegetales en la prehistoria: Bases para una propuesta metodológica materialista. Trab. Prehist. 2006, 63, 35–54. [Google Scholar] [CrossRef] [Green Version]
  10. Carnelli, A.L.; Madella, M.; Theurillat, J.P.; Ammann, B. Aluminum in the opal silica reticule of phytoliths: A new tool in palaeoecological studies. Am. J. Bot. 2002, 89, 346–351. [Google Scholar] [CrossRef]
  11. Epstein, E. The anomaly of silicon in plant biology. Proc. Natl. Acad. Sci. USA 1994, 91, 11–17. [Google Scholar] [CrossRef] [Green Version]
  12. Piperno, D.R. Phytolyth Analysis: An Archaeological and Geological Perspective; Elsevier: Amsterdam, The Netherlands, 2014; Volume 22, pp. 119–120. [Google Scholar]
  13. Salvant, N.; Snyder, G.; Danoff, L. Silicon management and sustentable rice production. Adv. Agron. 1997, 58, 151–199. [Google Scholar]
  14. Salem, E.M.M.; Kenawey, M.K.M.; Saudy, H.S.; Mubarak, M. Influence of Silicon Forms on Nutrients Accumulation and Grain Yield of Wheat Under Water Deficit. Gesunde Pflanz. 2022, 74, 539–548. [Google Scholar] [CrossRef]
  15. Saudy, H.S.; Salem, E.M.M.; El-Momen, W.R. A Effect of Potassium Silicate and Irrigation on Grain Nutrient Uptake and Water Use Efficiency of Wheat Under Calcareous Soils. Gesunde Pflanz. 2022. [Google Scholar] [CrossRef]
  16. Borda, O.A.; Barón, F.H.; Gómez, M.I. Silicon as a beneficial element in forage oat (Avena sativa L.): Physiological responses of growth and management. Agron. Colomb. 2007, 25, 273–279. [Google Scholar]
  17. Sánchez, P. Properties and Management of Soils in the Tropics, 1st ed.; Cruz, M., Escoto, J.B., Eds.; IICA Library Venezuela: San José, Costa Rica, 1981; p. 235. [Google Scholar]
  18. Guntzer, F.; Keller, C.; Meunier, J.D. Benefits of plant silicon for crops: A review. Agron. Sustain. Dev. 2012, 32, 201–213. [Google Scholar] [CrossRef] [Green Version]
  19. Massey, F.P.; Ennos, A.R.; Hartley, S.E. Grasses and the resource availability hypothesis: The importance of silica-based defences. J. Ecol. 2007, 95, 414–424. [Google Scholar] [CrossRef] [Green Version]
  20. Bon, M.P.; Inga, K.G.; Utsi, T.A.; Jónsdóttir, I.S.; Bråthen, K.A. Forage quality in tundra grasslands under herbivory: Silicon based defences, nutrients and their ratios in grasses. J. Ecol. 2021, 110, 129–143. [Google Scholar] [CrossRef]
  21. Massey, F.P.; Ennos, A.R.; Hartley, S.E. Silica in grasses as a defence against insect herbivores: Contrasting effects on folivores and phloem feeders. J. Ecol. 2006, 75, 595–603. [Google Scholar] [CrossRef]
  22. Massey, F.P.; Hartley, S.E. Experimental demonstration of the antiherbivore effects of silica in grasses: Impacts on foliage digestibility and vole growth rates. Proc. Biol. Sci. 2006, 273, 2299–2304. [Google Scholar] [CrossRef] [Green Version]
  23. Hunt, J.W.; Dean, A.P.; Webster, R.E.; Jonhson, G.N.; Ennos, A.R. A Novel Mechanism by which Silica Defends Grasses Against Herbivory. Ann. Bot. 2008, 102, 653–656. [Google Scholar] [CrossRef] [Green Version]
  24. Van der Vorm, P.D.J. Dry ashing of plant material and dissolution of the ash in HF for the colorimetric determination of silicon. Commun. Soil Sci. Plant Anal. 1987, 18, 1181–1189. [Google Scholar] [CrossRef]
  25. Taber, H.G.; Shogren, D.; Gang, L. Extraction of silicon from plant tissue with dilute HCl and HF and measurement by modified inductive coupled argon plasma procedures. Commun. Soil Sci. Plant Anal. 2002, 33, 1661–1670. [Google Scholar] [CrossRef]
  26. Jones, R.L.; Dreher, G.B. Silicon. In Methods of Soil Analysis. Part 3. Chemical Methods; Sparks, D.L., Ed.; SSSA Book Series 5; Soil Science Society of America and American Society of Agronomy: Madison, WI, USA, 1996; pp. 627–637. [Google Scholar]
  27. Rovner, I. Potential of opal phytoliths for use in palaeoecological reconstruction. Quat. Res. 1971, 3, 345–359. [Google Scholar]
  28. Rovner, I.; Russ, J.C. Darwin and design in phytolith systematics: Morphometric methods for mitigating redundancy. In Phytolith Systematics; Rapp, G., Mulholland, S.C., Eds.; Plenum Press: New York, NY, USA, 1992; pp. 253–276. [Google Scholar]
  29. Zucol, A.F.; Brea, M. Phytolith systematics, guideline for a classificatory system. A study case in the Alvear formation (lower Pleistocene), Entre Ríos, Argentine. Ameghiniana 2005, 42, 685–704. [Google Scholar]
  30. Mandela, M.; Alexandre, A.; Ball, T. International Code for Phytolith Nomenclature 1.0 (ICPN). Ann. Bot. 2005, 96, 253–260. [Google Scholar] [CrossRef] [Green Version]
  31. Luciani, G.F.; Sobanski, M.G.; Meier, M.S.; Polci, P.A.; Miranda, R.; Echenique, C.V. Weeping lovegrass yield and nutritional quality provides an alternative to beef cattle feeding in semiarid environments of Argentina. Crop Sci. 2012, 52, 1955–1965. [Google Scholar] [CrossRef]
  32. Leigh, J.H. The relative paptability of various varieties of weeping lovegrass (Eragrostis curvula (Schrad) Nees). Grass Forage Sci. 1961, 16, 135–140. [Google Scholar] [CrossRef]
  33. Wilson, J.; Minson, D. Comparative digestibility of tropical and temperate forage—A contrast between grasses and legumes. J. Aust. Inst. Agric. Sci. 1980, 46, 247–249. [Google Scholar]
  34. Wilson, J. Cell wall characteristics in relation to forage digestion by ruminants. J. Agric. Sci. 1994, 122, 173–182. [Google Scholar] [CrossRef]
  35. Laborde, H. Quality and nutritional value. In Weeping Grass, Its Biology and Management; Fernández, O., Brevedad, R., Gargajo, A., Eds.; CERZOS and Department of Agronomy University Nacional del Sur: Bahía Blanca, Argentina, 1991; pp. 325–347. [Google Scholar]
  36. Soil Survey Staff. Soil Taxonomy: A Basic System of Soil Classification for Making and Interpreting Soil Surveys, 2nd ed.; Natural Resources Conservation Service, US Government Print Office: Washington, DC, USA, 1999; p. 786. [Google Scholar]
  37. De Campos, A.C.; Labouriau, L.G. Corpos silicosos de gramíneas dos Cerrados. II. Pesqui. Agropecu. Bras. 1969, 4, 143–151. [Google Scholar]
  38. Da Silva, S.T.; Labouriau, L.G. Corpos silicosos de gramíneas dos Cerrados. III. Pesqui. Agropecu. Bras. 1970, 5, 167–182. [Google Scholar]
  39. Labouriau, L.G. Phytolith work in Brazil: A mini-review. Phytolith. Newsl. 1983, 2, 6–11. [Google Scholar]
  40. Di Rienzo, J.A.; Casanoves, F.; Balzarini, M.G.; Gonzalez, L.; Tablada, M.; Robledo, C.W. InfoStat, Versión 2010; Grupo InfoStat. 2010. Available online: http://www.infostat.com.ar.
  41. Altschul, S.F.; Gish, W.; Miller, W.; Myers, E.W.; Lipman, D.J. Basic local alignment search tool. J. Mol. Biol. 1990, 215, 403–410. [Google Scholar] [CrossRef]
  42. Carballo, J.; Santos, B.A.; Zappacosta, D.; Garbus, I.; Selva, J.P.; Gallo, C.A.; Díaz, A.; Albertini, E.; Cáccamo, M.; Echenique, V. A high-quality genome of Eragrostis curvula grass provides insights into Poáceae evolution and supports new strategies to enhance forage quality. Sci. Rep. 2019, 9, 10250. [Google Scholar] [CrossRef] [PubMed] [Green Version]
  43. VanBuren, R.; Man Wai, C.; Wang, X.; Pardo, J.; Yocca, A.E.; Wang, H.; Chaluvadi, S.R.; Han, G.; Bryant, D.; Edger, P.P.; et al. Exceptional subgenome stability and functional divergence in the allotetraploid Ethiopian cereal teff. Nat. Commun. 2020, 11, 884. [Google Scholar] [CrossRef] [PubMed] [Green Version]
  44. Zhang, C.J.; Ning, Y.Q.; Zhang, S.W.; Chen, Q.; Shao, C.R.; Guo, Y.W.; Zhou, J.X.; Li, L.; Chen, S.; He, X.J. IDN2 and its paralogs form a complex required for RNA-directed DNA methylation. PLoS Genet. 2012, 8, e1002693. [Google Scholar] [CrossRef]
  45. Jiao, Y.; Peluso, P.; Shi, J.; Liang, T.; Stitzer, M.C.; Wang, B.; Campbell, M.S.; Stein, J.C.; Wei, X.; Chin, C.S.; et al. Improved maize reference genome with single-molecule technologies. Nature 2017, 546, 524–527. [Google Scholar] [CrossRef]
  46. McCormick, R.F.; Truong, S.K.; Sreedasyam, A.; Jenkins, J.; Shu, S.; Sims, D.; Kennedy, M.; Amirebrahimi, M.; Weers, B.D.; McKinley, B.; et al. The Sorghum bicolor reference genome: Improved assembly, gene annotations, a transcriptome atlas, and signatures of genome organization. Plant. J. 2018, 93, 338–354. [Google Scholar] [CrossRef] [Green Version]
  47. International Wheat Genome Sequencing Consortium (IWGSC); Kanyuka, K.; King, R. Shifting the Limits in Wheat Research and Breeding Using a Fully Annotated Reference Genome. Science 2018, 361, eaar7191. [Google Scholar] [CrossRef] [Green Version]
  48. Mascher, M.; Wicker, T.; Jenkins, J.; Plott, C.; Lux, T.; Koh, C.S.; Ens, J.; Gundlach, H.; Boston, L.B.; Tulpová, Z.; et al. Long-read sequence assembly: A technical evaluation in barley. Plant Cell 2021, 33, 1888–1906. [Google Scholar] [CrossRef]
  49. Frei, D.; Veekman, E.; Grogg, D.; Stoffel-Studer, I.; Morishima, A.; Shimizu-Inatsugi, R.; Yates, S.; Shimizu, K.K.; Frey, J.E.; Studer, B.; et al. Ultralong Oxford Nanopore reads enable the development of a reference-grade perennial ryegrass genome assembly. Genome Biol. Evol. 2021, 13, evab159. [Google Scholar] [CrossRef] [PubMed]
  50. Lovell, J.T.; MacQueen, A.H.; Mamidi, S.; Bonnette, J.; Jenkins, J.; Napier, J.D.; Sreedasyam, A.; Healey, A.; Session, A.; Shu, S.; et al. Genomic mechanisms of climate adaptation in polyploid bioenergy switchgrass. Nature 2021, 590, 438–444. [Google Scholar] [CrossRef] [PubMed]
  51. Edgar, R.C. MUSCLE: A multiple sequence alignment method with reduced time and space complexity. BMC Bioinform. 2004, 5, 113. [Google Scholar] [CrossRef] [PubMed] [Green Version]
  52. Kumar, S.; Stecher, G.; Li, M.; Knyaz, C.; Tamura, K. MEGA X: Molecular evolutionary genetics analysis across computing platforms. Mol. Biol. Evol. 2018, 35, 1547. [Google Scholar] [CrossRef] [PubMed]
  53. Saitou, N.; Nei, M. The neighbor-joining method: A new method for reconstructing phylogenetic trees. Mol. Biol. Evol. 1987, 4, 406–425. [Google Scholar]
  54. Gargano, A.O.; Aduriz, M.A.; Arelovich, H.M.; Amela, M.I. Forage yield and nutritive value of Eragrostis curvula and Digitaria eriantha in central-south semi-arid Argentina. Tropl. Grassl. 2001, 35, 161–167. [Google Scholar]
  55. Rovner, I. Macro and Micro ecological Reconstruction Using Plant Opal Phytolith Analysis. Geoarchaeology 1988, 3, 155–163. [Google Scholar] [CrossRef]
  56. Van Soest, P.; Jones, L. Effect of silica in forage upon digestibility. J. Dairy Sci. 1968, 51, 1644–1648. [Google Scholar] [CrossRef]
  57. Hoover, W. Chemical factors involved in ruminal fiber digestion. J. Dairy Sci 1986, 69, 2755–2766. [Google Scholar] [CrossRef]
  58. Neethirajan, S.; Gordon, R.; Wang, L. Potential of silica bodies (phytoliths) for nanotechnology. Trends Biotechnol. 2009, 27, 461–467. [Google Scholar] [CrossRef]
  59. Elger, A.; Lemoine, D.G.; Fenner, M.; Hanley, M.E. Plant ontogeny and chemical defense: Older seedlings are better defended. Oikos 2009, 118, 767–773. [Google Scholar] [CrossRef]
  60. Jones, L.; Milne, A.; Sanders, J. Tabashir: An opal of plant origin. Science 1966, 151, 464–466. [Google Scholar] [CrossRef] [PubMed]
  61. Allen, M.S. Relationship between fermentation acid production in the rumen and the requirement for physically effective fiber. J. Dairy Sci. 1997, 80, 1447–1462. [Google Scholar] [CrossRef] [PubMed]
  62. Parra-Terraza, S.; Baca-Castillo, G.A.; Carrillo-González, R.; Kohashi-Shibata, J.; Martínez-Garza, A.; Trejo-López, C. Comparison of three methods of analysis of silicon in cucumber leaf tissue. TERRA Latinoam. 2004, 22, 401–407. [Google Scholar]
  63. Kilmer, V.J. Silicon. In Methods of Soil Analysis. Part 2. Chemical and Microbiological Properties; Black, C.A., Ed.; American Society of Agronomy: Madison, WI, USA, 1965; pp. 959–962. [Google Scholar]
  64. Jones, L.H.; Handreck, K.A. Silica in soils, plant and animals. Adv. Agron. 1967, 19, 107–149. [Google Scholar]
  65. Coradin, T.; Lopez, P.J.; Gautier, C.; Livage, J. From biogenic to biomimetic silica. Comptes Rendus Palevol 2004, 3, 443–452. [Google Scholar] [CrossRef]
  66. Vásquez, A.; Meza, C.M.; Rivas, G.M.; Gámez, B.G.; Fierro, A.; Olivares, O. Study on the nutritional properties of Nassella mucronata. In Proceedings of the XVIII Buiatric Congress, Québec, QC, Canada, 11–16 July 2004; Mexican Association of Veterinary Doctors Specialists in Bovines A.C.: Mexico City, Mexico, 2004. [Google Scholar]
  67. Bokor, B.; Bokorová, S.; Ondoš, S.; Švubová, R.; Lukačová, Z.; Hýblová, M.; Lux, A. Ionome and expression level of Si transporter genes (Lsi1, Lsi2, and Lsi6) affected by Zn and Si interaction in maize. Environ. Sci. Pollut. Res. 2015, 22, 6800–6811. [Google Scholar] [CrossRef]
  68. Bokor, B.; Ondoš, S.; Vaculík, M.; Bokorová, S.; Weidinger, M.; Lichtscheidl, I.; Turňa, J.; Lux, A. Expression of Genes for Si Uptake, Accumulation, and Correlation of Si with Other Elements in Ionome of Maize Kernel. Front. Plant Sci. 2017, 8, 1063. [Google Scholar] [CrossRef] [Green Version]
  69. Ge, Y.; Lu, H.; Zhang, J.; Wang, C.; Gao, X. Phytoliths in Inflorescence Bracts: Preliminary Results of an Investigation on Common Panicoideae Plants in China. Front. Plant Sci. 2020, 10, 1736. [Google Scholar] [CrossRef] [Green Version]
  70. Golokhvast, K.S.; Seryodkin, I.V.; Chaika, V.V.; Zakharenko, A.M.; Pamirsky, I.E. Phytoliths in taxonomy of phylogenetic domains of plants. BioMed Res. Int. 2014, 2014, 648326. [Google Scholar] [CrossRef] [Green Version]
  71. Erra, G. Systematic assignment and lower paleocommunities from the phytolithic study of Quaternary sediments from Entre Ríos, Argentina. Bol. Soc. Argent. Bot. 2010, 45, 309–319. [Google Scholar]
  72. Livingstone, D.; Clayton, W. An Altitudinal Cline in Tropical African Grass Floras and Its Paleoecological Significance. Quat. Res. 1980, 13, 392–402. [Google Scholar] [CrossRef]
Figure 1. Mean values of the phytolith content (%) in the dry matter of seven weeping lovegrass cultivars at two clipping dates: outbreak and re-growth. Bars indicate standard errors.
Agronomy 13 00924 g001
Figure 2. Biplot of the principal components 1 (CP 1) and 2 (CP 2) explaining 92.5% of the variation: weeping lovegrass genotypes at the outbreak and re-growth stages, respectively. PhC: phytolith content, CP: crude protein, L: lignin, NDF: neutral detergent fiber, ADF: acid detergent fiber, IVDMD: in vitro dry matter digestibility.
Agronomy 13 00924 g002
Figure 3. Neighbor-joining phylogenetic tree using Lsi1, Lsi2, Lsi3, and Lsi6 genes of ten species of grasses: Eragrostis curvula, Eragrostis tef, Setaria italica, Panicum virgatum, Sorghum bicolor, Zea mays, Oryza sativa, Lolium perenne, Hordeum vulgare, and Triticum aestivum. Each species is represented by a different color.
Agronomy 13 00924 g003
Figure 4. Phytolith extracted from tillers of Eragrostis curvula: (a) cuneiform bulliform cell, (b) uniform hair cell, (c) bilobate short cell, (d) elongate entire cylindric, (e) acicular hair cell, (f) ovate cell, (g) short saddle-shaped cell.
Agronomy 13 00924 g004
Table 1. Analysis of variance chart for the mean value of the phytolith content of different weeping lovegrass cultivars in two phenological stages: outbreak and re-growth.
Source of VariationSum of SquaresDegrees of FreedomMean SquaresFp-Value
Block 0.4620.23
Clipping date8.9518.9525.35<0.0001
Cultivar11.6161.945.480.0009
Clipping date × Cultivar2.3160.391.090.3937
Error9.18260.35
Total32.5141
Table 2. Mean values of the phytolith content (%) in the dry matter of different weeping lovegrass cultivars at two phenological stages: outbreak and re-growth. Different letters indicate significant differences (p < 0.05) according to the Fisher test. Error: 0.3530, df: 26.
CultivarAverageN
Don Luis2.396A
Morpa2.546A
Tanganyika2.576A
Don Pablo2.826A
93553.026AB
Don Eduardo3.666 BC
Don Juan3.846 C
Disclaimer/Publisher’s Note: The statements, opinions and data contained in all publications are solely those of the individual author(s) and contributor(s) and not of MDPI and/or the editor(s). MDPI and/or the editor(s) disclaim responsibility for any injury to people or property resulting from any ideas, methods, instructions or products referred to in the content.

