Article

How to Efficiently Produce the Selenium-Enriched Cucumber Fruit with High Yield and Qualities via Hydroponic Cultivation? The Balance between Selenium Supply and CO2 Fertilization

1
State Key Laboratory of Soil and Sustainable Agriculture, Institute of Soil Science, Chinese Academy of Sciences, Nanjing 210008, China
2
University of Chinese Academy of Sciences, Beijing 100049, China
3
Department of Horticultural Sciences, Institute of Crop Science and Resource Conservation, University of Bonn, 53121 Bonn, Germany
4
Zhongke Clean Soil (Guangzhou) Technology Service Co., Ltd., Guangzhou 510640, China
*
Author to whom correspondence should be addressed.
Agronomy 2023, 13(3), 922; https://doi.org/10.3390/agronomy13030922
Submission received: 6 March 2023 / Revised: 16 March 2023 / Accepted: 18 March 2023 / Published: 20 March 2023

Abstract

:
Hydroponic-producing selenium (Se)-biofortified vegetables in a greenhouse is a convenient and effective way to provide Se-enriched food and overcome hidden hunger. CO2 fertilization is commonly implemented to increase vegetable yield in greenhouse production. However, this application accompanies decreased mineral concentrations in the edible parts. Here we investigated the effects of [CO2] and Se supply on the growth, gas exchange, and cucumber fruit quality. A hydroponic experiment with two CO2 concentrations ([CO2]) (C1: 410, and C2: 1200 μmol mol−1) and four Se supply levels (Se0: 0, Se1: 0.125, Se2: 0.250, and Se3: 0.500 mg Se L−1) was carried out. A low level of Se supply (Se1: 0.125 mg Se L−1) protected the photosynthetic pigments and stimulated the stomatal opening, especially under [CO2] fertilization. It leads to a higher net photosynthesis rate (Pn) and transpiration rate (Tr) than other Se treatments. The most significant changes in dry weight, fruit yield, and soluble sugar concentration were also obtained in Se1 under CO2 fertilization due to the enhanced CO2 fixation. Meanwhile, the Se concentration in fruit was 0.63 mg kg−1 FW in C2Se1, with the highest Se accumulation and use efficiency. According to the recommended dietary allowance of 55 μg Se day−1 for adults, an intake of 87 g of cucumber grown in C2Se1 is sufficient. Because of the improved Tr and better root structure in Se1, the uptake of mineral nutrients through mass flow and interception was well maintained under CO2 fertilization. So, the concentrations of N, P, K, Ca, and Mn in cucumber fruits were not significantly decreased by elevated [CO2] in Se1. However, the concentrations of soluble proteins, S, Mg, Fe, and Zn in cucumber fruits in C2Se1 were lower than those in C1Se1, which was mainly attributed to the dilution effects under CO2 fertilization. Therefore, a selenite supply of 0.125 mg Se L−1 was found to be the optimal dosage for producing Se-enriched cucumber fruits with high yield and better qualities under CO2 fertilization (1200 μmol mol−1).

1. Introduction

As an essential trace micronutrient, selenium (Se) is a critical component of seleno-amino acids and selenoproteins, which play a crucial role in animals, including humans [1,2]. Se deficiency is a severe health problem that could cause many human diseases, such as Kashin–Beck disease, Keshan disease, and so on [3,4]. Recent studies also demonstrated that a complement of Se may help reduce the incidence and severity of various viral infections, including severe acute respiratory syndrome coronavirus 2 (SARS-CoV-2), which caused the global pandemic of coronavirus disease 2019 (COVID-19), due to its anti-inflammatory, antioxidant, and immune-boosting effects [5,6,7]. The primary source of Se for humans is derived along the food chain from edible plants, and the Se concentration ([Se]) in plants largely depends on the Se content and bioavailability in the soil where the plants grow [8,9]. Therefore, more than one billion people living in the Se deficiency area suffer the long-term deficiency of this essential element [9,10]. Among the methods to meet the dietary demand for Se for these people, biofortification of agricultural products is one of the most economical and safe approaches to providing Se-enriched food and overcoming hidden hunger [11,12].
Vegetables are an essential component of the daily diet [13,14], accounting for nearly one-third of dietary intake and about 10% of Se intake [15]. In food-based dietary guidelines from the World Health Organization (WHO) and 90 countries globally, an intake of 200~250 g of vegetables per person per day is usually recommended for health [16]. For example, in a questionnaire of 143,305 participants from 18 countries on five continents, the average vegetable intake per capita was 2.19 servings per day (95% CI 2.13~2.25) [17]. Similarly, vegetable consumption per capita ranged from 140 to 250 g per day, based on the data from representative surveys in 19 European countries [18]. Hydroponics can efficiently increase the concentration of essential and/or beneficial micronutrients due to biofortification in edible plant organs, promoting human health [19]. Meanwhile, Se-biofortified cucumber (Cucumis sativus L.), tomato (Solanum lycopersicum L.), cabbage (Brassica oleracea L.), lettuce (Lactuca sativa L.), chard (Beta vulgaris L.), parsley (Petroselinum crispum L.), chicory (Chicorium intybus L.), and spinach (Spinacia oleracea L.) have already been produced by root fertilization or foliar spray with selenite or selenate solutions [20,21,22,23,24]. Accordingly, intake of these Se-biofortified vegetables is a convenient and effective way to match the recommended dietary allowance (RDA) of 55 μg Se day−1 for adults, as recommended by the WHO [25,26].
Moreover, the biofortification of vegetables with Se has at least three advantages. Firstly, vegetables are commonly eaten fresh, avoiding the Se lost in the cooking process [27,28]. Secondly, most vegetables can be produced using a hydroponic cultivation system, which brings higher Se utilization efficiency and bioavailability, meanwhile eliminating the adsorption of Se by the Al- and Fe-oxides and organic matters in soils [8,9]. Thirdly, the [Se] in the vegetables could be precisely controlled in a hydroponic system without exceeding the toxic threshold for plants and humans [2,29]. Therefore, producing Se-enriched vegetables is a convenient and reliable way to provide Se-biofortified foods.
On the other hand, CO2 fertilization is commonly implemented to increase vegetable yields in greenhouse production [30,31]. However, many studies showed a decrease in vegetable mineral concentrations under CO2 fertilization, resulting from the dilution effects, decreased mass flow and transpiration, and so on [32,33,34]. To date, studies dealing with the effect of CO2 fertilization on the [Se] in plants are rare. Moreover, the application rate of Se also had significant impacts on the leaf pigments, the gas exchange parameters, and the plant’s mineral nutrient uptake [35,36]. Therefore, it is essential to find the optimum dosage of Se supplement to produce Se-enriched vegetables with high yield and qualities under CO2 fertilization.
Based on the previous work, the growth of cucumber seedlings was significantly inhibited when treated with a selenite concentration beyond 10 μmol L−1 (0.79 mg Se L−1) for 14 days [36]. We also found no cucumber fruits were harvested in the treatments with a selenite concentration beyond 1.00 mg Se L−1 with a longer treatment period (70 days) in a pre-experiment. Therefore, a hydroponic experiment on cucumber plants with a whole growth period of 70 days after transplanting (DAT) was carried out, with two CO2 concentrations ([CO2]) (410 and 1200 μmol mol−1) and four Se supply levels (0, 0.125, 0.250, and 0.500 mg Se L−1). The objectives of the present study were: (1) to investigate the effects of [CO2] and Se supply levels on the growth and gas exchange parameters of cucumber plants; (2) to characterize the nutritional qualities of cucumber fruits under different [CO2] and Se supply levels, including the [Se], organic and inorganic nutrients; and (3) to determine the optimal dosage of Se supply for producing Se-enriched cucumber fruits with high yield and qualities under CO2 fertilization.

2. Materials and Methods

2.1. Plant Material and Experimental Design

The hydroponic experiment on cucumber plants was carried out in four open-top chambers (OTCs) at the Institute of Soil Science, Chinese Academy of Sciences, P.R. China (32.0596° N, 118.8050° E), which had been used in our previous study [37]. The experiment used a split-plot design, in which [CO2] was designed as the primary treatment and Se supply levels were the sub-plot treatment. Seeds of cucumber (Cucumis sativus L.) cultivar ‘Jinmei 3′ (Tianjin Kerun Cucumber Research Institute, China) were germinated in a growth chamber at a temperature of 28 °C and a relative humidity of 70% and then sown into trays containing a peat-vermiculite mixture (2:1, v/v). After ten days, 64 healthy seedlings of similar size were transplanted into 2.5 L polyvinyl chloride polymer (PVC) pots, with one seedling per pot. Each pot was filled with 2 L Yamazaki nutrient solution for cucumbers [38], and then sixteen of them were moved into each OTC. The nutrient solution was composed of (mg L−1): Ca(NO3)2·4H2O (826), KNO3 (607), MgSO4·7H2O (493), NH4H2PO4 (115), Na2Fe-EDTA (29.27), H3BO3 (2.86), MnSO4·4H2O (2.03), ZnSO4·7H2O (0.22), CuSO4·5H2O (0.08), and (NH4)6Mo7O24·4H2O (0.02) [37]. After that, the [CO2] and Se treatments began. Four Se levels (Se0: 0, Se1: 0.125, Se2: 0.250, and Se3: 0.500 mg Se L−1) were set by adding sodium selenite (Sigma-Aldrich) into the nutrient solution with four replicates in each OTC. The [CO2] in two OTCs was set at 410 μmol mol−1 (C1), and the other two were set at 1200 μmol mol−1 (C2) and were controlled by an infrared gas analyzer (Ultramat 6, Siemens, Munich, Germany) from 8:00 am to 5:00 pm every sunny day. All pots were aerated intermittently by a pump every 30 min per hour, and the nutrient solution was renewed every week. The pots were also rotated within and among OTCs every two weeks to reduce the chamber effects. After 21 days of treatment (DOT), half of the seedlings were harvested, and the other half were transplanted into 5 L PVC pots with 4 L nutrient solution. All the plants were harvested on the 70 DOT. During the 70 DOT, the accumulated [CO2] treating period was 372 h, and the average [CO2] was 412.1 ± 4.7 (mean ± sd) and 1196.2 ± 8.3 μmol mol−1 in C1 and C2 treatment during the treating period, respectively.

2.2. Sampling and Measurements

2.2.1. Gas-Exchange Rate Measurements

Cucumber plants’ gas exchange properties were measured the day before harvesting (69 DOT). The third leaves from the top of cucumber plants were chosen for the measurement of net photosynthetic rate (Pn), transpiration rate (Tr), and stomatal conductance (Gs) by a portable photosynthesis system (Li-6400, Li-Cor Inc., Lincoln, NE, USA). Four replicates in each treatment were used for measurements. The standard leaf chamber (2 cm × 3 cm) (6400-02B) was used, and the photosynthetic photon flux density was set at 1500 mol m−2 s−1 by a LED light source. The [CO2] of the flow-in air was set at the same level as the [CO2] treatment where the plant was grown. The temperature, relative air humidity, and air flow rate inside the leaf chamber were set at 25 °C, 50%, and 500 μmol s−1, respectively.

2.2.2. Plant Harvest and Weight Determination

All the plants harvested on the 70 DOT were separated into roots, stems, leaves, and fruits and washed with tap water, followed by distilled water. First, the fresh weight (FW) of each part was recorded. Then a portion of fresh leaves and fruits was used immediately to determine the photosynthetic pigment and organic nutrient concentrations, respectively. Next, fresh roots, stems, and leaves were dried at 105 °C for 30 min and then at 75 °C to a constant weight in an electro-thermostatic oven. Finally, the fresh fruits were cut into pieces and frozen immediately, and then lyophilized to obtain the dry samples.

2.2.3. Leaf Pigment Concentration Determination

The photosynthetic pigment concentrations in leaves, including chlorophyll a (Chl a), chlorophyll b (Chl b), and carotenoids in leaves, were determined by the method described by Linchenthaler and Wellburn [39]. Briefly, 0.2 g of fresh leaves was homogenized and extracted with 25 mL of 80% (v/v) acetone. Afterwards, the extracts were centrifuged at 10,000× g for 5 min. The absorbance of the resulting supernatant was then measured at 646, 663, and 470 nm using a microplate spectrophotometer (EPOCH, BioTek Instruments, Inc., Winooski, VT, USA). The Chl a, Chl b, and carotenoid concentrations were calculated according to the formulas given by Lichtenthaler and Wellburn [39].

2.2.4. Fruit Organic Nutrient Concentration Determination

The soluble sugar concentrations in cucumber fruits were determined by the phenol-sulfuric acid method [40]. Briefly, 0.2 g pieces of fresh fruits were homogenized and extracted with 10 mL of hot water (95 °C) twice. Then, the extracts were combined and diluted to 100 mL, and 1 mL of 9% phenol solution and 5 mL of concentrated sulfuric acid were added to 2 mL of the sample solution in turn. The mixture was shaken for 5 min and placed for 25 min, and then the absorbance of the final solution was measured at 485 nm by a microplate spectrophotometer (EPOCH, BioTek Instruments, Inc., Winooski, VT, USA).
The soluble protein concentrations in cucumber fruits were determined by the Coomassie brilliant blue method [41]. Briefly, 0.5 g pieces of fresh fruits were homogenized in 10 mL of distilled water and then centrifuged at 4000× g for 20 min. Next, 1 mL of the supernatant was mixed with 5 mL of Coomassie brilliant blue G-250. The mixture was shaken for 30 s and placed for 2 min, and then the absorbance of the final solution was measured at 595 nm by a microplate spectrophotometer (EPOCH, BioTek Instruments, Inc., Winooski, VT, USA).
The crude fiber concentrations in cucumber fruits were determined by the acid detergent method [42]. Briefly, 2.0 g pieces of fresh fruits were refluxed in 100 mL acid detergent solution (adding 20 g cetyltrimethylammonium bromide (CTAB) into 1 L 0.5 mol L−1 sulfuric acid) for 1 h. Next, the residue was washed with boiled water three times until the pH of the eluate was neutral, and then the residue was rewashed with acetone three times until the eluate was colorless. Finally, the residue was dried at 100 °C for 5 h, and the DW was recorded.
The vitamin C concentrations in cucumber fruits were determined by the colorimetric method using the 2,6-dichlorophenol method [43]. Briefly, 2.0 g of fresh fruits was ground, extracted with 100 mL of 1% oxalic acid extraction solution, and then filtered. Next, 4 mL of the extract solution was mixed with 2 mL of dye solution (250 mg L−1 2,6-dichlorophenol indophenol and 205 mg L−1 sodium bicarbonate) and 5 mL of xylene. The mixture was shaken for 30 s and placed for 5 min, and then the absorbance of the xylene phase was measured at 500 nm by a microplate spectrophotometer (EPOCH, BioTek Instruments, Inc., Winooski, VT, USA).
The soluble sugars, protein, and crude fiber concentrations were expressed as milligrams per gram of FW, and the vitamin C concentrations were expressed as milligrams per 100 g of FW.

2.2.5. Fruit Inorganic Mineral Concentration Determination

Lyophilized fruit samples (0.2 g) were digested in H2SO4–H2O2 at 180 °C for 5 h and measured for nitrogen concentration ([N]) by a discrete auto-analyzer (Smartchem200, Alliance, France) [37]. Another portion of lyophilized fruit samples (0.3 g) was digested in HNO3–HClO4 (85:15 v/v) at 190 °C for 6 h and used for the concentration determination of phosphorus ([P]), potassium ([K]), calcium ([Ca]), magnesium ([Mg]), sulfur ([S]), iron ([Fe]), manganese ([Mn]), and zinc ([Zn]) by an inductively coupled plasma atomic emission spectrometer (Iris-Advantage, Thermo Elemental, Franklin, MA, USA) [44]. The third portion of the lyophilized fruit sample (0.25 g) was digested in 10 mL of HNO3–HClO4 (ultra-pure grade, 9:1 v/v) at 160 °C for 6 h, and then 5 mL of 6 mol L−1 hydrochloric acid was added to maintain the temperature at 120°C until the yellow color disappeared. The digested solution was diluted to 25 mL by ultra-pure water, and [Se] was measured by an atomic fluorescence spectrometer (AFS-8520, Haiguang Co., Ltd., Beijing, China) [45]. A certified reference material (GBW10014/GSB-5; cabbage leaf) was used for method validation.
Because the [Se] in the cucumber fruits grown in Se0 (without Se supply) was below the detection limit, the [Se] and accumulation in Se0 were not given, and Se use efficiency (SeUE) was calculated as follows:
SeUE (%) = Se accumulation in fruits (mg)/Se added in the nutrient solutions (mg) × 100%

2.3. Statistical Analysis

All data were shown as the mean ± standard error of four replicates. The means of DWs, gas exchange properties, leaf pigment concentrations, fruit organic and inorganic nutrient concentrations, and the Se concentrations and accumulations in each treatment were compared using the Fisher LSD test (p < 0.05) using the application “Paired Comparison Plot” in OriginPro (Version 2021; OriginLab Corp., Northampton, MA, USA). The effects of [CO2], Se supply levels, and their interactions were quantified using a two-way analysis of variance (ANOVA) in OriginPro. Heat maps displaying fold-changes in the mineral element concentrations in cucumber fruits relative to the mean value of the C1Se0 treatment were generated and clustered according to the Euclidean distance using the application “Heat Map with Dendrogram” in OriginPro. Pearson correlations between [CO2] level, Se supply level, gas exchange property, and Se concentration, organic and mineral concentrations in cucumber fruits under different [CO2] and Se supply levels were generated using the application “Correlation Plot” in OriginPro. The variation of gas exchange property, and Se concentration, organic and mineral concentrations in cucumber fruits in response to [CO2] and Se supply levels were quantified and visualized using the application “principal component analysis” (PCA) in OriginPro.

3. Results

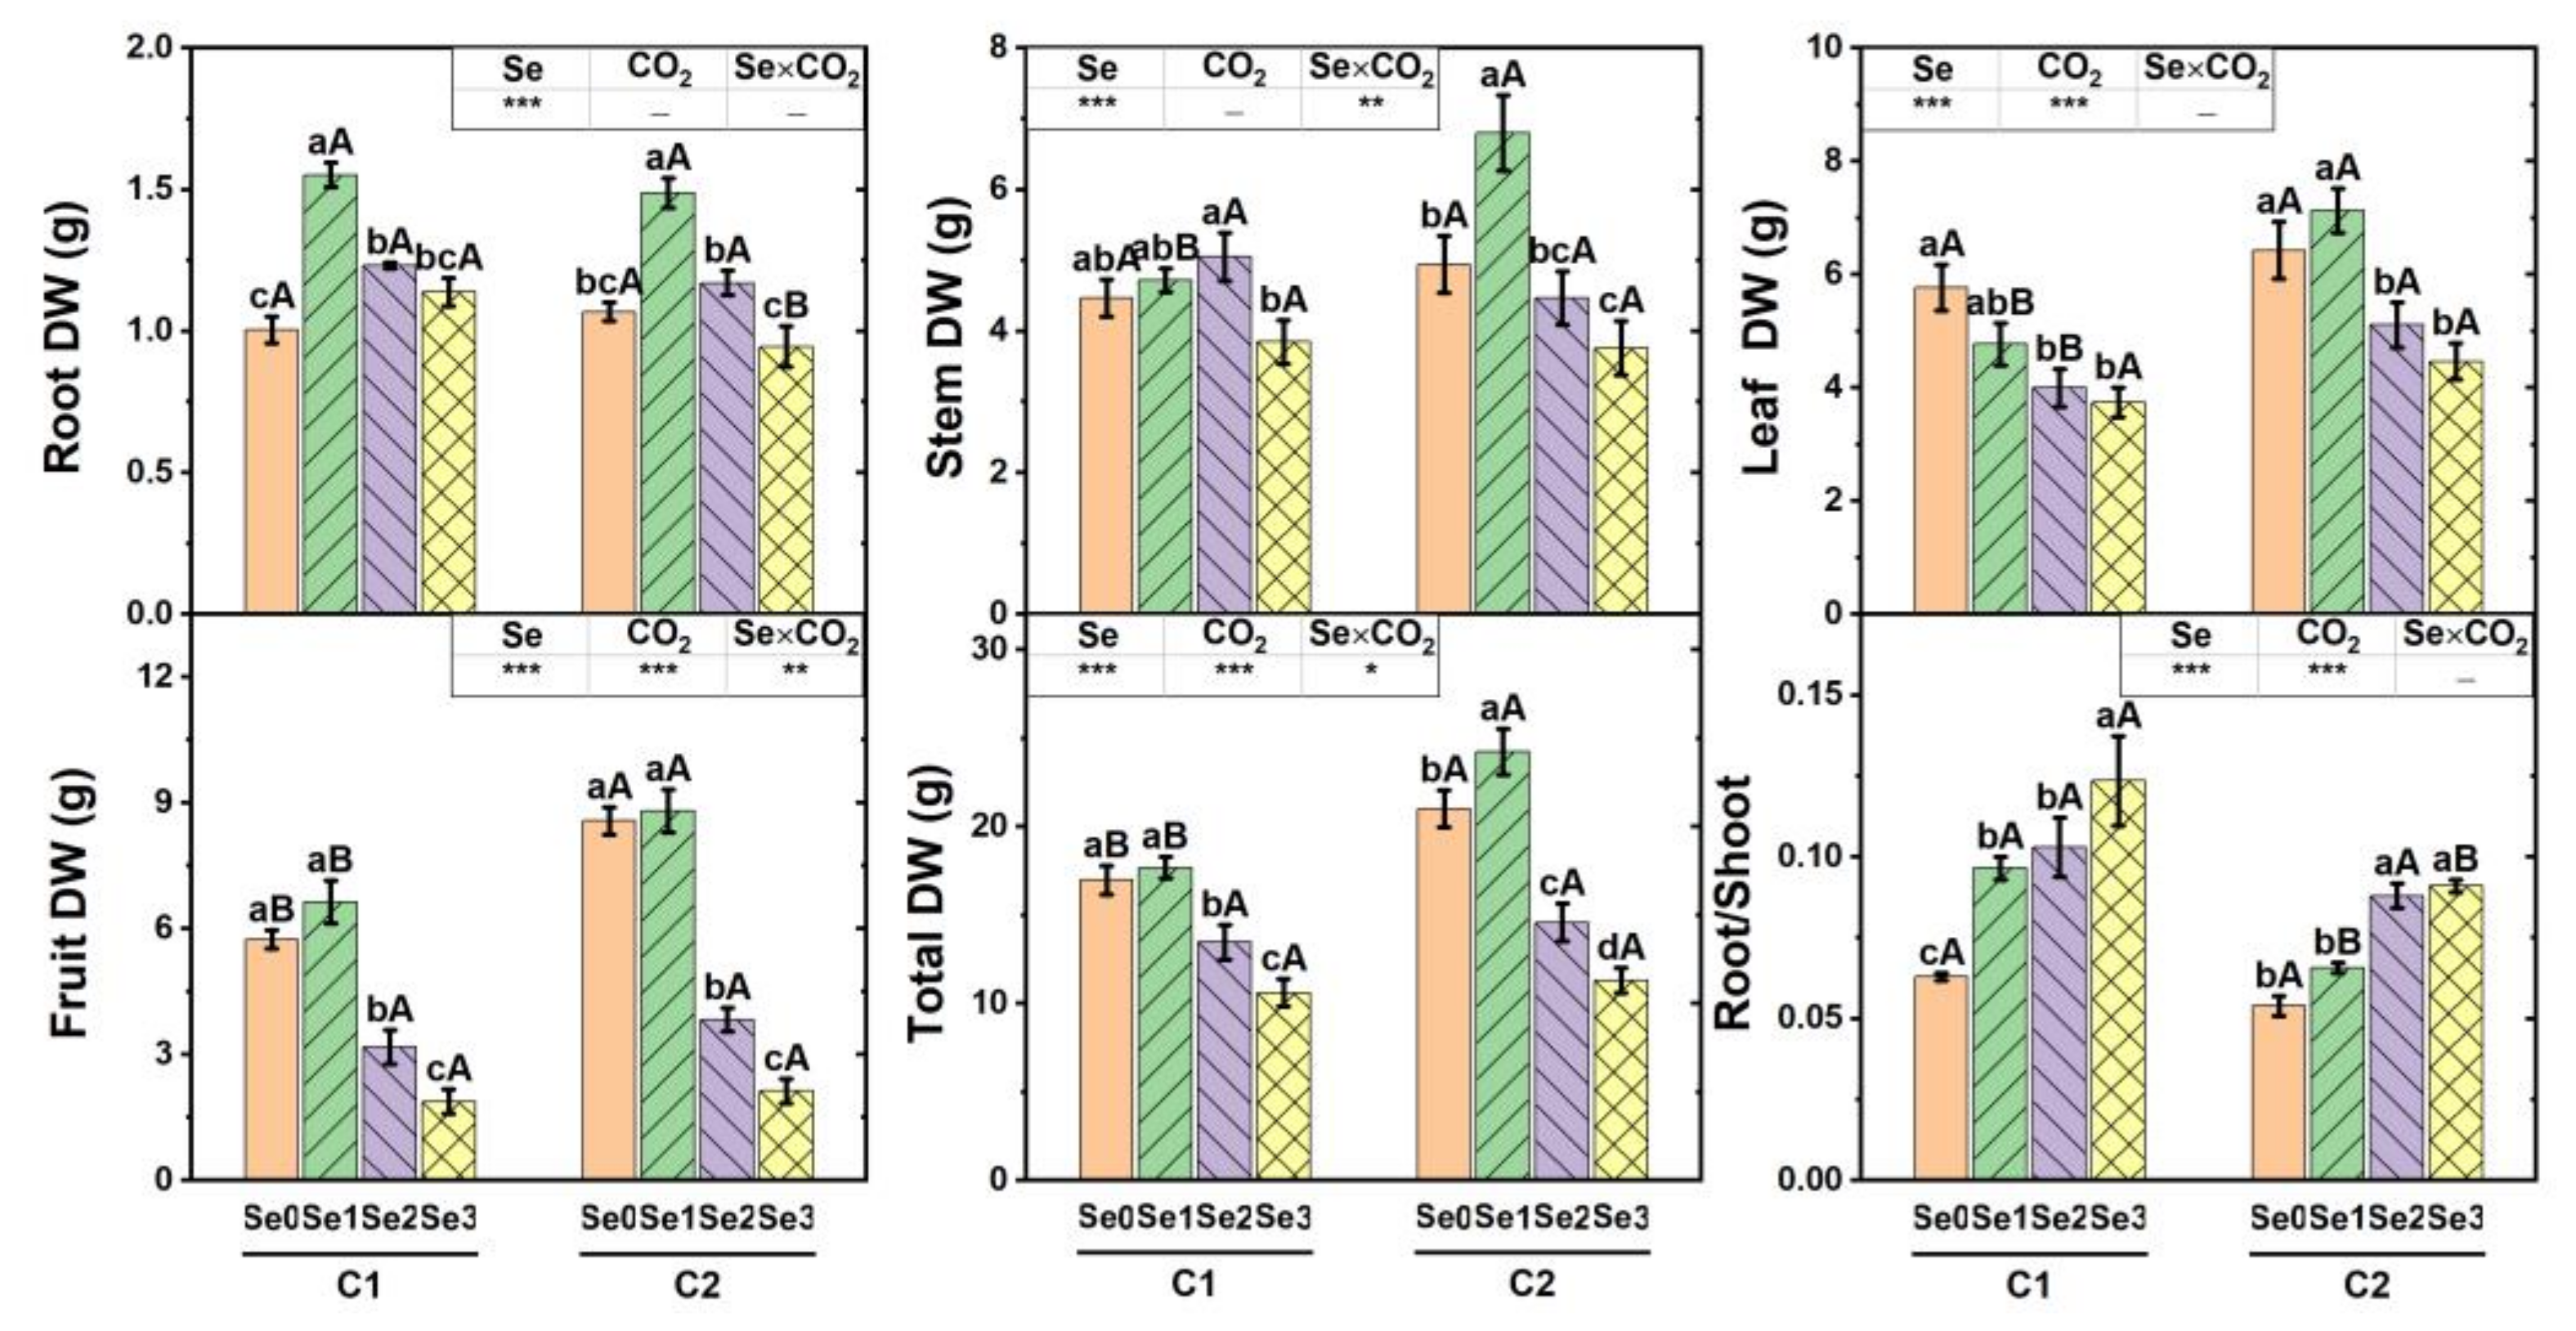
3.1. Dry Weight of Cucumber Plant

Se supply levels had significant effects on the DW of the roots, stems, leaves, fruits, and the whole cucumber plants, as well as the root-to-shoot ratios (R/S), whereas [CO2] levels only significantly impacted the DW of leaves, fruits, the whole plants, and R/S (Figure 1). Under ambient [CO2] (C1), the largest DW of root, stem, and leaf was obtained in Se1, Se2, and Se0 treatments, respectively, whereas the largest DW of fruit and whole plants were found in Se0 and Se1 treatments. Under CO2 fertilization (C2), Se1 treatment always produced the highest DW, and the DW was decreased as the Se supply increased from 0.125 (Se1) to 0.500 (Se3) mg Se L−1. Compared with Se1, the DW of roots, stems, leaves, fruits, and whole cucumber plants significantly decreased by 36.5%, 44.7%, 37.3%, 75.8%, and 53.3% in Se3, respectively. High levels of Se supply (Se2 and Se3) inhabited the DW formation under both ambient and elevated [CO2], and this inhabitation was more severe in leaf and fruit, resulting in a larger R/S in Se3. On the other hand, CO2 fertilization increased the DW formation in the above-ground parts of cucumber plants, especially in the Se1 treatment, so a significant decrease in R/S of 31.9% was found in Se1 by CO2 fertilization.

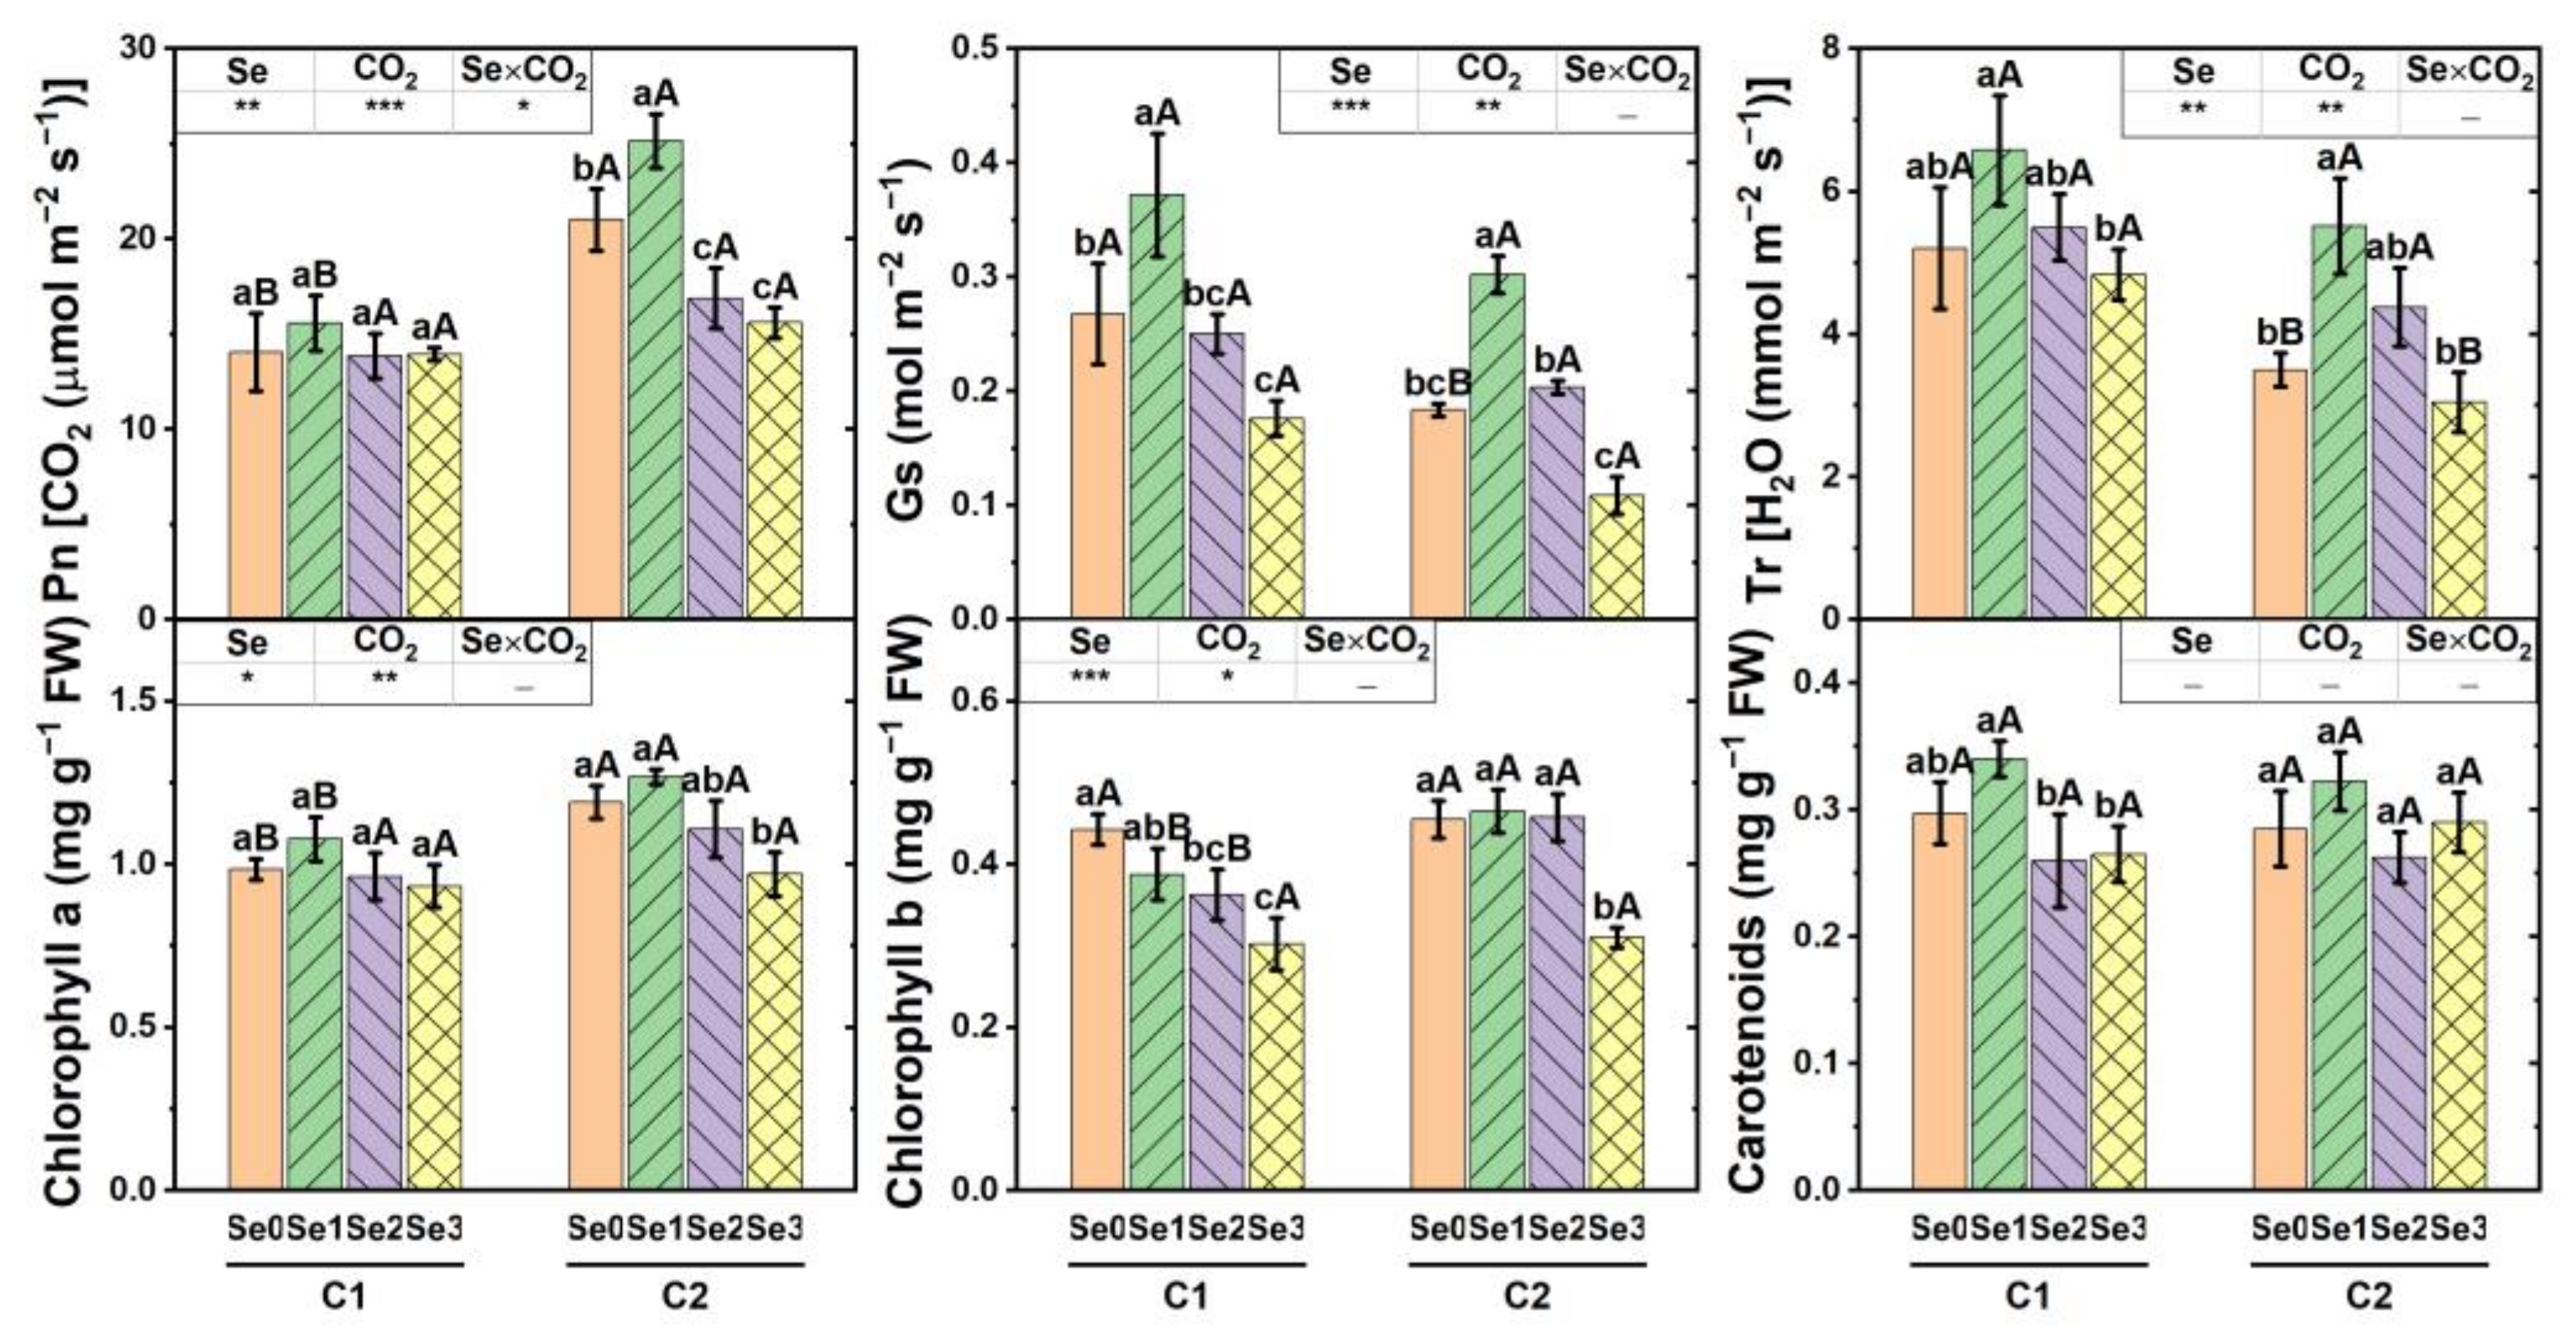
3.2. Gas Exchange Property and Pigment Concentration in Cucumber Leaf

Gas exchange properties of cucumber plants grown under different [CO2] and Se supply levels were investigated. As shown in Figure 2, both [CO2] and Se supply levels had significant effects (p < 0.01) on the Pn, Gs, and Tr. CO2 fertilization significantly increased the Pn of cucumber plants by 49.6% and 61.4% in Se0 and Se1 treatments, respectively. But CO2 fertilization also significantly decreased the Gs and Tr by 31.4% and 32.7% in Se0, respectively. However, the Gs and Tr were not significantly decreased by CO2 fertilization in Se1 and Se2 treatments. Under ambient [CO2], the highest Gs and Tr were found in Se1, but there were few differences in Pn among the four Se supply levels. Under CO2 fertilization, the highest Pn, Gs, and Tr were obtained in Se1, and the increase was 19.6%, 64.6%, and 57.6% compared with those without Se addition (Se0), respectively. Compared with those in Se1, the Pn, Gs, and Tr were significantly decreased by 37.9%, 64.0%, and 44.7%, respectively, in Se3.
The photosynthetic pigment concentrations in cucumber leaves under the corresponding [CO2] and Se supply levels were also analyzed (Figure 2). Both [CO2] and Se supply levels had significantly impacted the Chl a and b concentrations, but neither influenced carotenoid concentration. The Chl b and carotenoids concentrations under ambient [CO2] and the Chl a and b concentrations under elevated [CO2] were all lower at a high level of Se supply (Se3) than those in Se0 or Se1 treatments. From Se1 to Se3, the decrease was 21.9% and 22.1% in Chl b and carotenoid concentrations under ambient [CO2]. Similarly, the decrease was 23.5% and 33.3% in Chl a and b concentrations under elevated [CO2]. CO2 fertilization increased the Chl a concentration in Se0 and Se1 treatments and the Chl b concentration in Se1 and Se2 treatments but had no significant effect on all photosynthetic pigment concentrations in Se3 or on carotenoids concentrations in all Se supply treatments. Specifically, CO2 fertilization increased the Chl a and b concentrations by 17.6% and 20.0% in Se1, respectively.

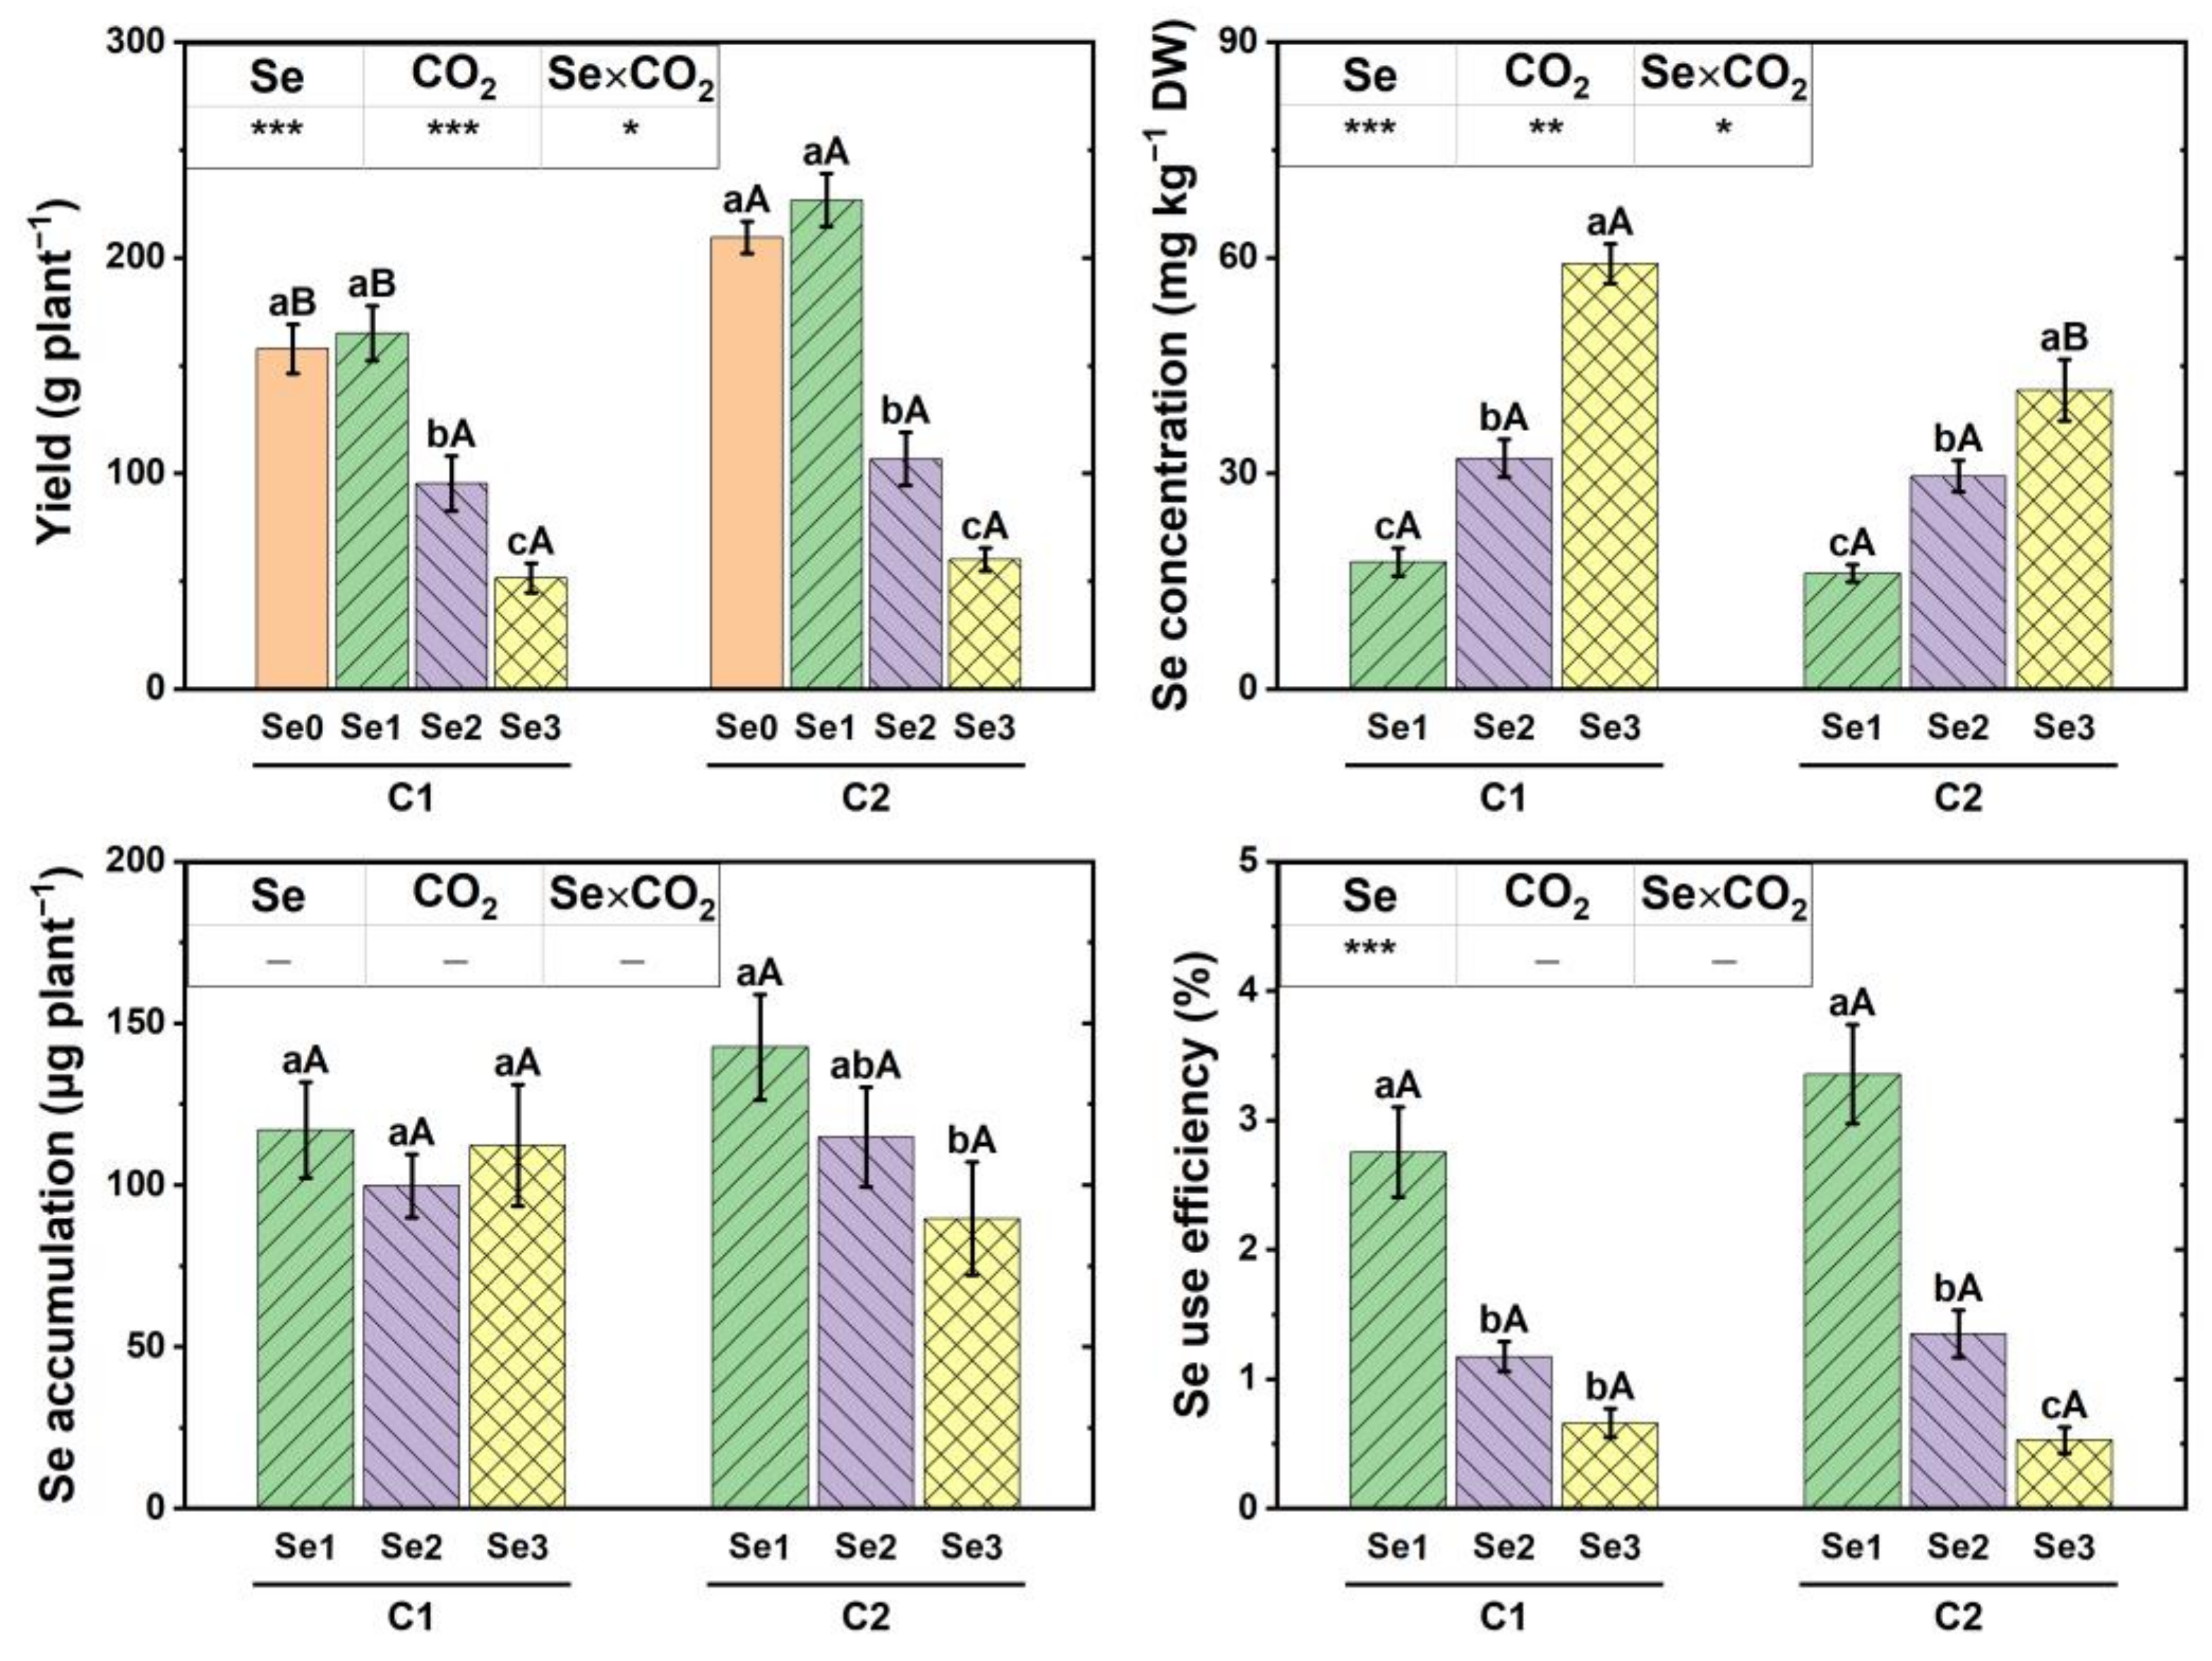
3.3. Yield and Se Biofortification of Cucumber Fruit

As shown in Figure 3, [CO2], Se supply levels, and their interaction all significantly affected the cucumber yield per plant. CO2 fertilization dramatically increased the yield by 32.7% and 37.4% in Se0 and Se1 treatments, respectively, but did not significantly change the yields in Se2 and Se3 treatments. Adding 0.125 mg Se L−1 in the nutrient solution (Se1) brought the highest cucumber yields of 165 and 227 g plant−1 under ambient and elevated [CO2], respectively. More Se supply resulted in a significant reduction in yield regardless of [CO2] levels. The cucumber yield was significantly decreased by 52.9% and 73.5% in Se2 and Se3 under ambient [CO2] compared with that in Se1, respectively, and decreased by 42.2% and 68.8% under elevated [CO2], respectively.
[Se] in cucumber fruits was remarkably increased as the Se supply increased and was increased from 17.64 mg kg−1 DW in Se1 to 59.18 mg kg−1 DW in Se3 under ambient [CO2], and was increased from 16.09 mg kg−1 DW in Se1 to 41.57 mg kg−1 DW in Se3 under elevated [CO2]. CO2 fertilization significantly decreased the [Se] in fruits by 29.8% only in Se3. The accumulation of Se in fruit was not influenced by either the Se supply levels under ambient [CO2] or the [CO2] levels in all three Se treatments. Se accumulation was significantly decreased by 37.2% from Se1 to Se3 under elevated [CO2]. SeUE was dramatically decreased as the Se supply increased, whereas [CO2] levels had little effect on it. Compared with Se1, SeUE in Se3 was significantly decreased by 76.0% and 84.3% under ambient and elevated [CO2], respectively.
Based on the [Se] in cucumber fruits on a DW basis and the water content of fruits, the [Se] in cucumber fruits on an FW basis was calculated (Table 1). Similar to the [Se] on a DW basis, the [Se] on an FW basis was also increased as the Se supply increased, ranging from 0.630 to 2.163 mg kg−1 FW. According to the RDA for adults set by the WHO, an intake of 77~87 g cucumber grown in Se1 or 25~37 g cucumber grown in Se3 every day could meet the RDA of 55 μg Se day−1. Moreover, consuming less than 560~635 g cucumber grown in Se1 or 185~270 g cucumber grown in Se3 per day could ensure the daily intake of Se is below the tolerable upper intake level (UL) of 400 μg Se day−1.

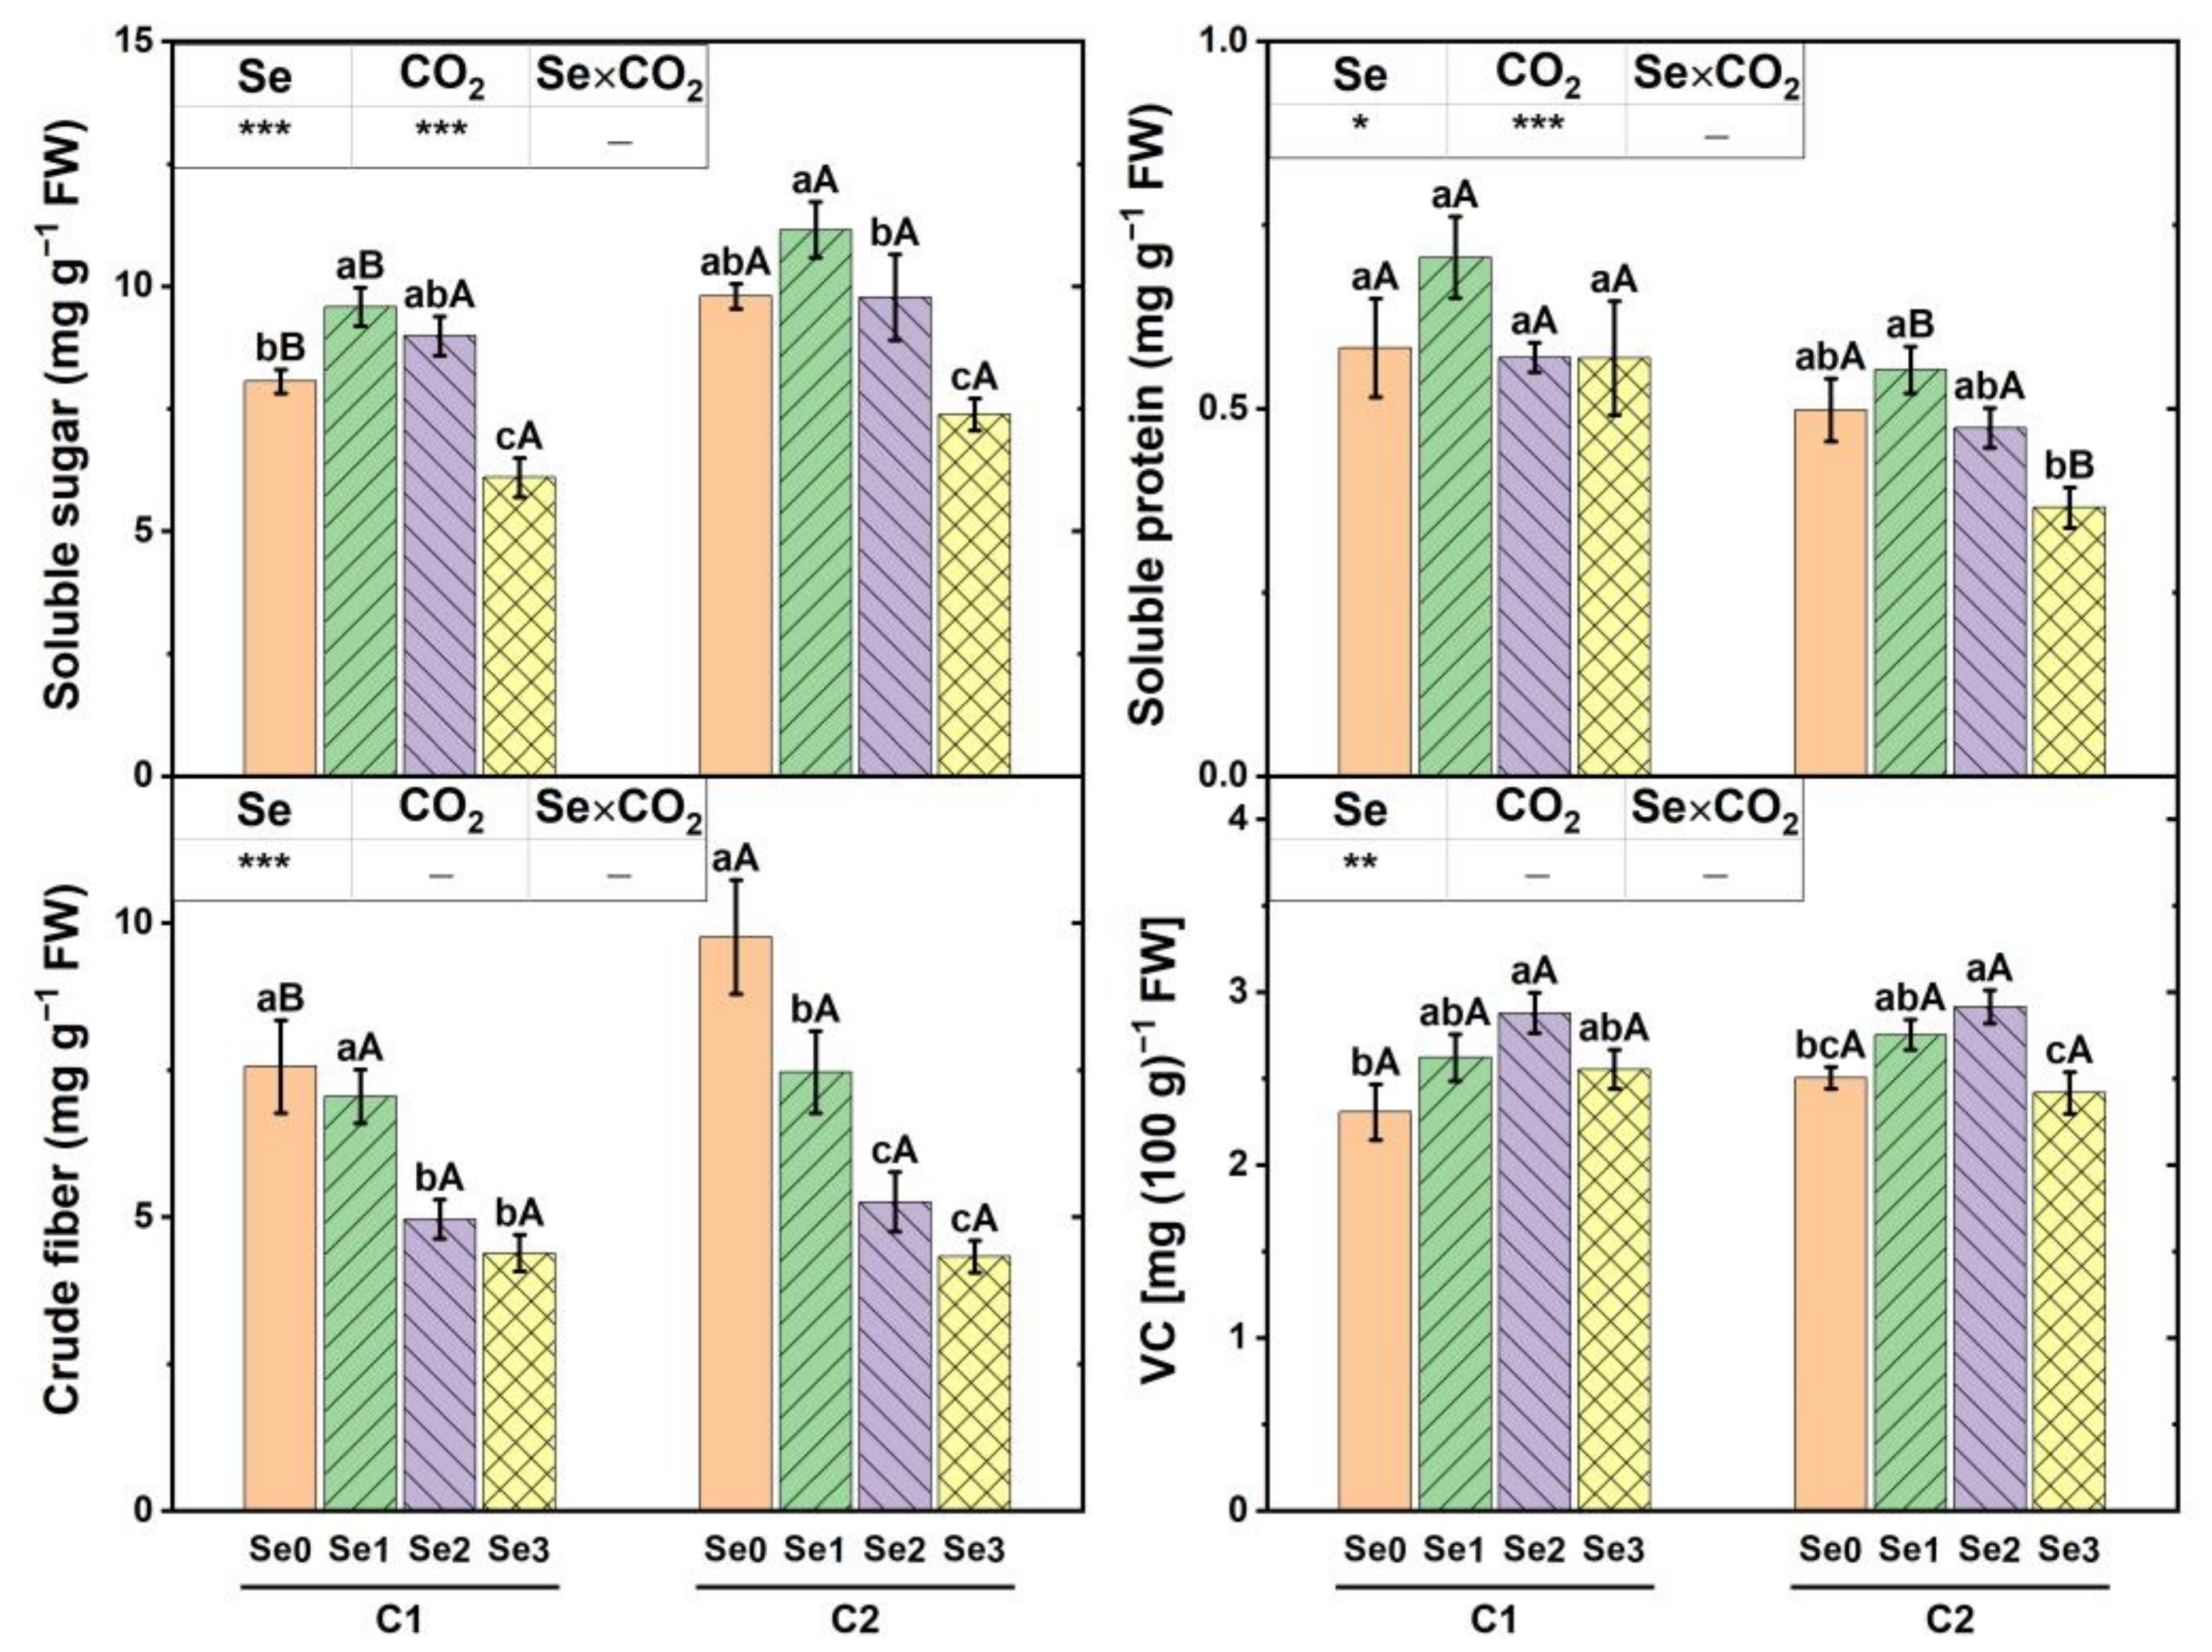
3.4. Organic Nutrients in Cucumber Fruit

Se supply levels had significant effects on the soluble sugar, soluble protein, crude fiber, and vitamin C (VC) concentrations in cucumber fruits, whereas [CO2] levels only greatly impacted the soluble sugar and soluble protein concentrations (Figure 4). A high level of Se supply (Se3) inhabited the soluble sugar accumulation in cucumber fruits. Compared with the highest soluble sugar concentration in Se2, the decrease was 36.4% and 33.8% in Se3 under ambient and elevated [CO2], respectively. CO2 fertilization significantly increased the soluble sugar concentration by 21.6% and 16.4% in Se0 and Se1 treatments, respectively, but did not have significant changes in the soluble sugar in Se2 and Se3 treatments. There were no significant differences in soluble protein concentrations in cucumber fruits among four Se supply levels under ambient [CO2]. However, the soluble protein concentration in Se3 was 33.9% lower than that in Se1 under elevated [CO2]. The crude fiber concentrations in cucumber fruits significantly decreased as the Se supply increased, and the decrease was 42.0% and 55.7% from Se0 to Se3 under ambient and elevated [CO2], respectively. CO2 fertilization only increased the crude fiber concentration by 29.1% in the Se0 treatment. The highest VC concentration in cucumber fruits was obtained in Se2 treatment under both ambient and elevated [CO2]. VC concentrations in cucumber fruits were not influenced by the [CO2] levels, regardless of Se supply levels.

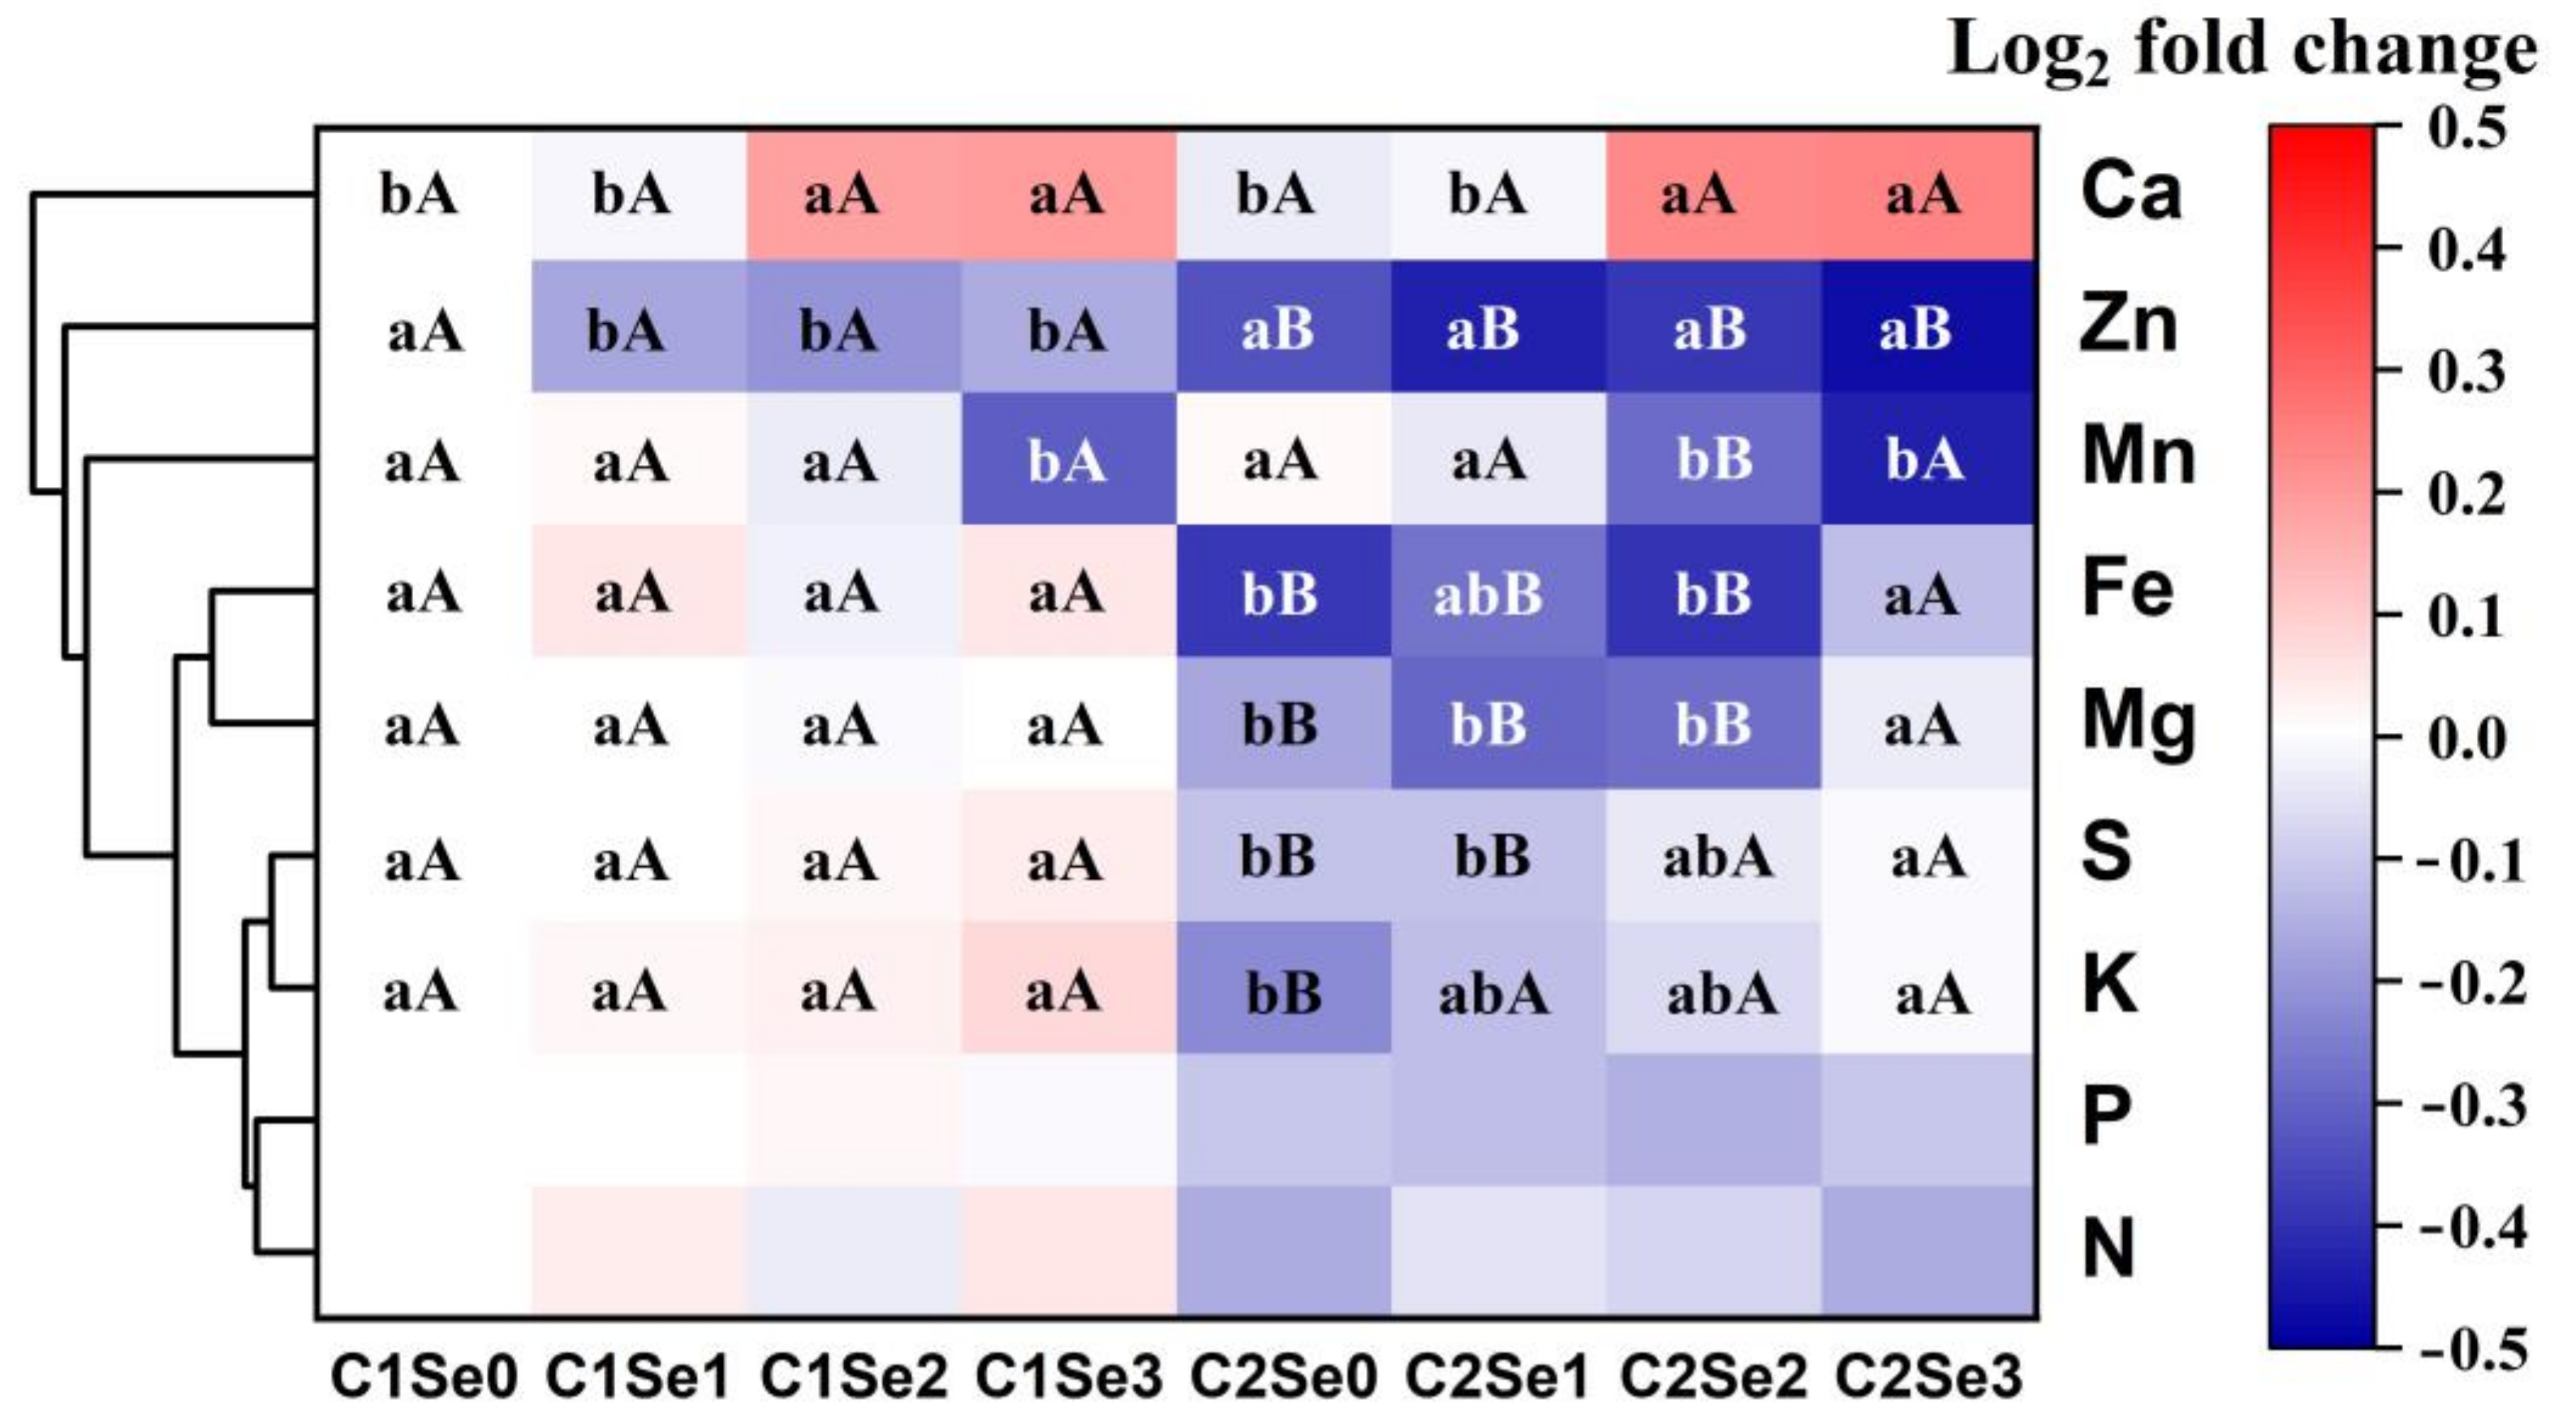
3.5. Inorganic Minerals in Cucumber Fruit

As shown in Table 2, the [CO2] levels had significant effects on [N], [P], [K], [Mg], [S], [Fe], [Mn], and [Zn] in cucumber fruits, whereas the Se supply levels had significant effects on [Ca], [Mg], [Mn], and [Zn]. According to the cluster analysis in Figure 5, the above nine mineral elements could be divided into six groups. [N] and [P] in cucumber fruits were not influenced by Se supply levels under ambient and elevated [CO2] and did not have a decreasing trend by CO2 fertilization. Se supply levels did not change [K], [Mg], [S], and [Fe] in cucumber fruits under ambient [CO2] but gradually increased them as the Se supply increased under elevated [CO2]. The increase of [K], [Mg], [S], and [Fe] in cucumber fruits was 25.2%, 15.4%, 12.0%, and 31.1% from Se0 to Se3 under elevated [CO2], respectively. CO2 fertilization dramatically decreased [K] in Se0; [S] in Se0 and Se1; [Mg] and [Fe] in Se0, Se1, and Se2, respectively. High levels of Se supply (Se3) inhabited [Mn] accumulation in cucumber fruits under both ambient and elevated [CO2], and the decrease was 27.0% and 36.0% from Se0 to Se3, respectively. CO2 fertilization decreased [Mn] by 22.8% in Se2. [Zn] in cucumber fruits was decreased by adding Se into the nutrient solutions under ambient [CO2], with a decrease ranging from 14.4% to 18.4% compared with Se0. CO2 fertilization significantly decreased [Zn] in all four Se levels. The decrease was 28.5%, 23.9%, 17.0%, and 26.8% in Se0, Se1, Se2, and Se3, respectively. In contrast to the other eight mineral elements, [Ca] in cucumber fruits was higher in Se2 and Se3 than that in Se0 and Se1 and had few differences between two [CO2] levels in the same Se supply level.

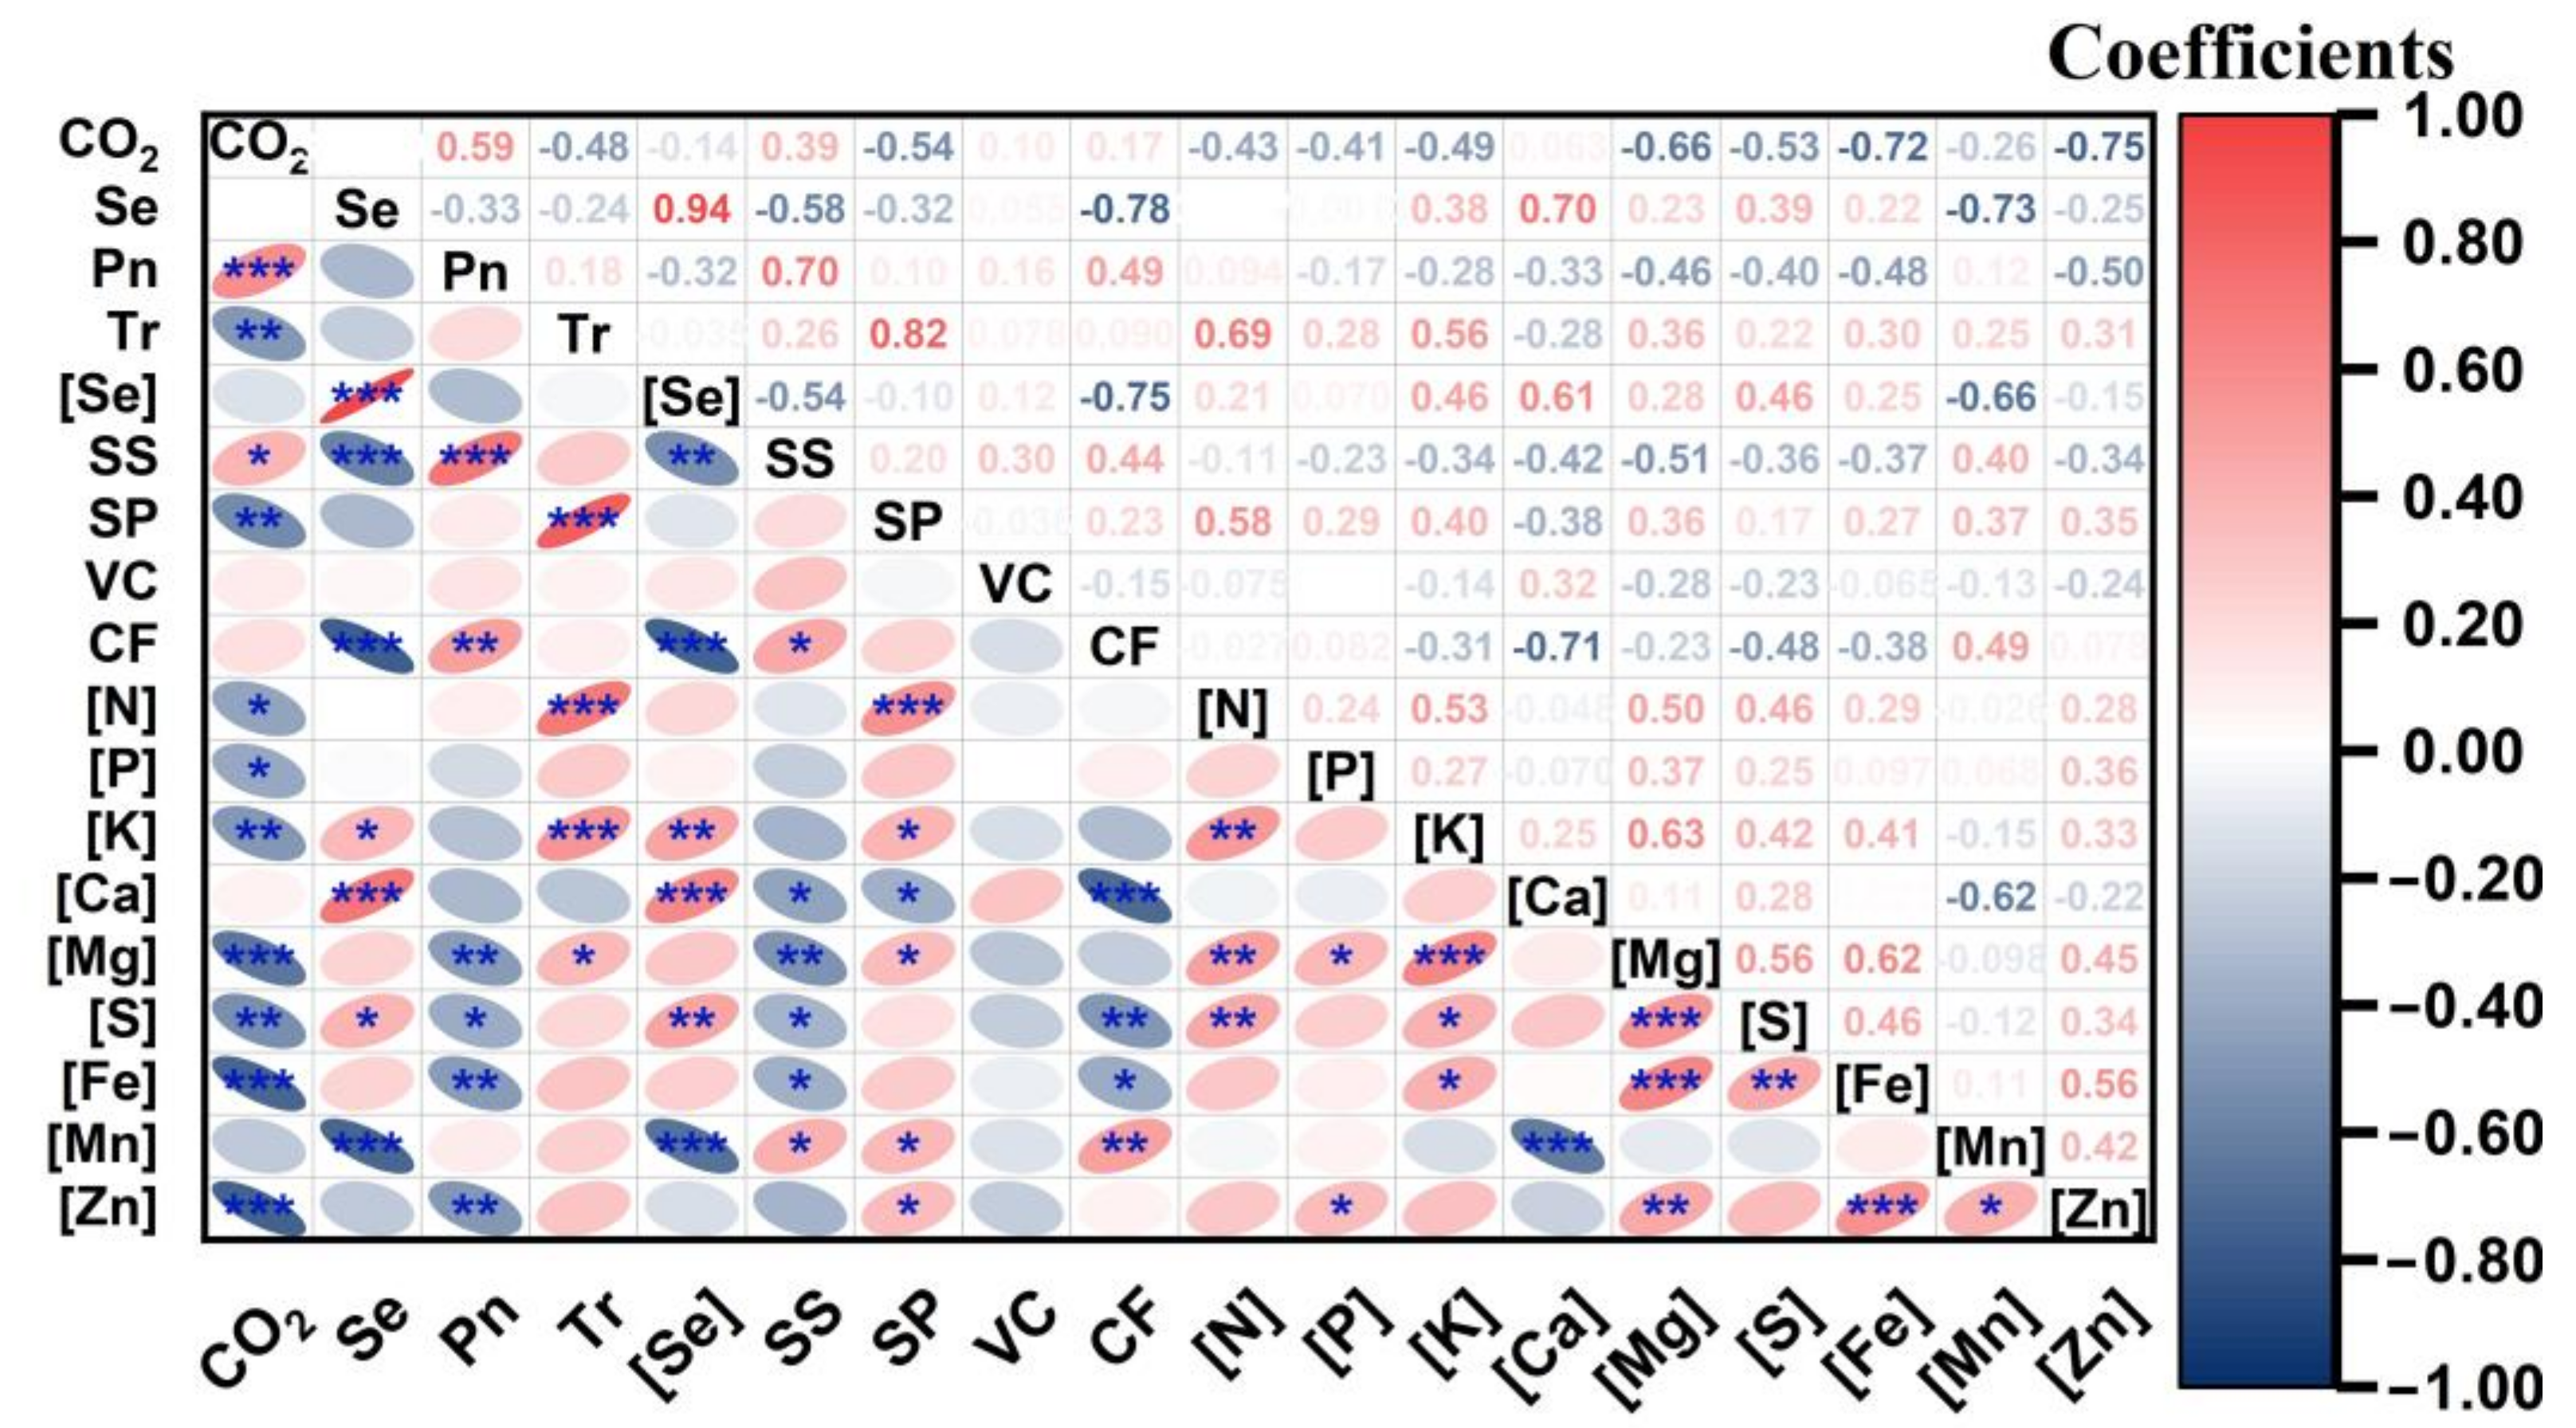
3.6. Correlations between [CO2], Se Supply and Nutritional Qualities of Cucumber Fruits

The Pearson correlation coefficient was calculated to evaluate the relationship between [CO2], Se supply, gas exchange property, and the nutritional qualities of cucumber fruits (Figure 6). Pn and soluble sugar were positively correlated to [CO2] with a correlation coefficient of 0.59 and 0.39, respectively. In contrast, Tr and soluble protein were negatively correlated to [CO2] with a correlation coefficient of −0.48 and −0.54, respectively. All the ten mineral element concentrations in cucumber fruits were negatively correlated to [CO2] except [Ca]. The negative correlation was significant between [N], [P], [K], [Mg], [S], [Fe], [Zn], and [CO2], with the corresponding correlation coefficients of −0.43, −0.41, −0.49, −0.66, −0.53, −0.72, and −0.75, respectively.
[Se], [K], [Ca], and [S] in cucumber fruits had significantly positive correlations to the Se supply level, and the correlation coefficients were 0.94, 0.38, 0.70, and 0.39, respectively. Soluble sugar, crude fiber, and [Mn] in cucumber fruits had significantly negative correlations to the Se supply level, and the correlation coefficients were −0.58, −0.78, and −0.73, respectively.
Soluble sugar and crude fiber in cucumber fruits were positively correlated to Pn with a correlation coefficient of 0.70 and 0.49, respectively. All the ten mineral element concentrations in cucumber fruits were negatively correlated to Pn except [N] and [Mn]. The negative correlation was significant between [Mg], [S], [Fe], [Zn], and [CO2], with the corresponding correlation coefficients of −0.46, −0.40, −0.48, and −0.50, respectively. Soluble sugar, protein, VC, crude fiber, and all the ten mineral element concentrations in cucumber fruits were positively correlated to Tr except [Ca]. The positive correlation was significant between soluble protein, [N], [K], [Mg], and Tr, with the corresponding correlation coefficients of 0.82, 0.69, 0.56, and 0.36, respectively.
The PCA plot was generated to further quantify and visualize the variation of the nutritional qualities of cucumber fruits responding to [CO2] and Se supply levels. The first two components accounted for 57.9% of the variation, as shown in the PCA plot (Figure 7). The results showed that Pn, soluble sugar, crude fiber, and VC concentrations in cucumber fruits were positively correlated to [CO2] levels. In contrast, Tr, soluble protein, [N], [P], [K], [Mg], [S], [Fe], and [Zn] were negatively correlated to [CO2] levels. In addition, [Se] and [Ca] in cucumber fruits were positively correlated to Se supply levels. In contrast, Pn, soluble sugar, crude fiber, and [Mn] in cucumber fruits were negatively correlated with Se supply levels.

4. Discussion

4.1. Effects of [CO2] and Se Supply Levels on the Growth and Gas Exchange Parameters of Cucumber Plants

It is well known that CO2 fertilization could significantly stimulate growth and increase the biomass accumulation of plants by enhancing the net photosynthetic rate [31,46,47]. In the present work, we observed a beneficial effect of CO2 fertilization on the DW and Pn, but only in the Se0 and Se1 treatments (Figure 1 and Figure 2). The ineffective CO2 fertilization on the DW and Pn in Se2 and Se3 treatments indicated it was dose dependent. For example, Hawrylak-Nowak et al. found that a selenite concentration of 10 μmol L−1 (0.79 mg Se L−1) significantly decreased the shoot and root FW of cucumber plants compared with that in 6 μmol L−1 selenite (0.47 mg Se L−1) treatment [36]. Similarly, Haghighi et al. found that a 4 and 6 mg Se L−1 selenite supply significantly inhibited the shoot DW of cucumber plants. The Pn had a declining trend in 6 mg Se L−1 selenite treatment compared to 2 mg Se L−1 selenite treatment [48]. Those studies showed that a high level of selenite supply could inhabit the Pn and promote the growth of cucumber plants, but the selenite toxicity thresholds were different. In the present work, the selenite toxicity threshold was between 0.125 and 0.250 mg Se L−1 (1.58~3.16 μmol L−1), lower than the previous works [36,48]. These differences may be caused by the more extended selenite treatment period (70 days) and different cucumber varieties used in the present work.
Stimulation on the root, stem, and total DW and Pn of cucumber plants at the low level of Se supply (Se1: 0.125 mg Se L−1) was found in this work (Figure 1 and Figure 2), especially under CO2 fertilization. Several potential reasons can contribute to this phenomenon. Firstly, an appropriate Se supply could protect the photosynthetic pigments and improve the Pn by enhancing the chloroplast antioxidant defense system (Figure 2), which could increase the tolerance to elevated [CO2] [49,50]. Secondly, increased Gs (Figure 2) was probably attributed to the Se-induced K+ inward currents and stomatal opening [51,52], which were conducive to exploiting the full potential of CO2 fertilization. Thirdly, the inhibition of Tr by high [CO2] was also alleviated due to the stomatal opening (Figure 2), so the uptake and transport of water and mineral nutrients through mass flow were improved [23]. Fourthly, low-dose selenite supply has been reported to shorten the primary root and increase lateral root initiation via hormonal and signaling processes and enhance root activities [35,53]. This facilitates the interception and uptake of mineral nutrients to match the enhanced CO2 fixation and avoid photosynthesis acclimation under CO2 fertilization [54].

4.2. Effects of [CO2] and Se Supply Levels on the Yield and Se Biofortification of Cucumber Fruits

Overall, the yield of cucumber was increased by CO2 fertilization, whereas the [Se] in cucumber fruits was decreased with [CO2] elevation due to the dilution effects. Therefore, there were few differences in the Se accumulation and use efficiency between the two [CO2] levels (Figure 3). Specifically, similar to the DW, the most significant cucumber fruit yield was obtained in low-dose selenite supply (Se1) under CO2 fertilization, mainly attributed to the enhanced Pn. [Se] in cucumber fruit, both on a DW and FW basis, was positively correlated to the Se supply level but was not significantly decreased by CO2 fertilization except for Se3 treatment (Figure 3, Figure 6, and Figure 7, Table 1). A possible reason was that the improved Tr and enhanced root activities induced by the low-dose selenite supply (Se1) increased the uptake of Se, which counteracted the dilution effects under CO2 fertilization. In contrast, high-dose selenite supply (Se3) produced toxic effects on the cucumber roots, which limited the uptake of Se and aggravated the reduction of [Se] under high [CO2] levels. This reason could also explain the higher Se accumulation and use efficiency in Se1 than in Se3 under CO2 fertilization [55].
Most vegetables are non-accumulator plants for Se with high water but low protein content, so [Se] is usually below 100 mg kg−1 DW [24]. In previous works, the [Se] in the edible parts could be accumulated to 0.5~35.8 mg kg−1 DW, 10.0~170 mg kg−1 DW, 7.86~150 mg kg−1 DW, and 15.5 mg kg−1 DW in biofortified tomato, lettuce, chicory, and spinach, respectively [20,21,22,23,24]. In the present work, [Se] in cucumber fruit could be enriched to 16.09~59.18 mg kg−1 DW or 0.630 to 2.163 mg kg−1 FW (Figure 3, Table 1), which was much higher than that grown in Se-enriched peat (8.30 to 173 μg kg−1 FW) or that foliar-sprayed with Se (0.03~0.08 mg kg−1 FW) [23,56]. Therefore, adding Se into the hydroponic system is a convenient and effective way to produce Se-biofortified vegetables due to the direct and active uptake of selenite or selenate through roots [57].
According to the dietary reference intakes from the WHO, the RDA and UL of Se were 55 μg day−1 and 400 μg day−1 for adults, respectively [25,26]. Therefore, an intake of 87.3 g of fresh cucumber fruit grown in C2Se1 can fully cover the RDA and is well consistent with people’s dietary habits, assuming an intake of 200~250 g of vegetables with three species per day [16]. On the other hand, the cucumber fruit grown in C1Se3 had the highest [Se] of 2.613 mg kg−1 FW, so intake of more than 185 g of fresh cucumber will dangerously exceed the UL, leading to a toxic risk for the consumer.

4.3. Effects of [CO2] and Se Supply Levels on the Nutritional Qualities of Cucumber Fruits

The organic and inorganic nutrients in the Se-enriched cucumber fruit were also important factors for the Se-biofortified foods. Because of the dilution effects, decreased mass flow and transpiration, and the changes in metabolism, the concentrations of protein, N, Zn, Fe, and Mg in the edible parts of vegetables all had a risk of declining under CO2 fertilization, leading to a deteriorated quality [32]. In this work, [K], [S], [Mg], [Fe], and [Zn] in cucumber fruit without Se supply (Se0) were significantly decreased by CO2 fertilization. All of them had significant negative correlations (p < 0.01) to [CO2] level (Figure 5, Figure 6 and Figure 7). [N] and [P] in cucumber fruit also had a decreasing trend in C2Se0 compared with those in C1Se0 and were negatively correlated (p < 0.05) to [CO2] level (Figure 5, Figure 6 and Figure 7). This decline in these seven elements under CO2 fertilization was mainly caused by the dilution effects [32,37]. Moreover, an increase of [K], [Mg], [S], and [Fe] in cucumber fruits as Se supply increased was observed under elevated [CO2]. This increase may be attributed to the stronger inhibitory effect on the fruits’ DW by high-dose Se supply than that on the uptake of these four elements.
Different from the findings in wheat and rice [58,59], [P] in cucumber fruit remained unaffected by adding selenite into the nutrient solution (Figure 5). Those works showed inhibition of P uptake under selenite supply, derived from the competition between phosphate and selenite due to their similar structures and transporter sharing [36,58]. In contrast, the unchanged [P] in selenite treatment was also reported in alfalfa, cherry tomato, and radish [35,60,61]. The possible explanation is that the phosphate supply (1 mol L−1) is sufficient for cucumber growth, so the uptake of phosphate is hardly affected by selenite [35,62].
Notably, the regulation of [Ca] in cucumber fruit by Se supply was quite different from other mineral elements (Figure 5). [Ca] in cucumber fruit had a significant positive correlation (p < 0.001) to the Se supply level (Figure 6 and Figure 7). The increase of [Ca] mediated by Se supply was also observed in Brassica oleracea, tomato, and maize [22,63,64]. Because Ca plays an essential role in the integrity of the cell membrane, the increase in [Ca] may be an indicator of the strengthening of the defense of the cell membrane or the rebuilding of the damaged cell membranes caused by Se toxicity [35,65]. Mn and Zn were the only elements whose concentrations in cucumber fruit were decreased when exposed to Se treatment and were negatively correlated to Se supply levels (Figure 5, Figure 6 and Figure 7). Similar phenomena were found in lettuce and rice grain [66,67], but the underlying mechanism is still unknown.
Concerning the organic nutrients in cucumber fruit, as photosynthates, the concentrations of soluble sugar and crude fiber were increased by CO2 fertilization in Se0 and positively correlated to [CO2] (Figure 4, Figure 6 and Figure 7). The concentration of soluble sugar was also Se dose-dependent, higher in low-dose Se supply and lower in high-dose, which agrees with previous studies [23,67,68]. The increase in soluble sugar was mainly attributed to the strengthened Pn by low-dose Se supply [2,50]. However, the concentration of crude fiber was continuously decreased as the Se supply increased, which is consistent with the results in Festuca arundinacea Schreb [69]. This decrease in structural carbohydrates associated with the increase of soluble sugar may be caused by the Se-induced regulation of carbohydrates’ metabolism [69]. The VC concentration in cucumber fruit was not significantly changed by CO2 fertilization but was Se dose dependent (Figure 4). Previous studies have revealed that Se aided in improving the activities of the enzymes involved in the biosynthesis and recycling of VC in plants, which was responsible for the increase in VC concentration under low-dose Se supply [10,70,71].
Soluble protein in cucumber fruit only had a decreasing trend in Se0 by CO2 fertilization but significantly decreased in Se1 and Se3 (Figure 4). A significantly negative correlation between soluble protein and [CO2] and a non-significantly negative correlation between soluble protein and Se were found (Figure 6 and Figure 7). However, the [N] in cucumber fruit was only negatively correlated to [CO2], and it was not significantly influenced by the Se supply level (Figure 5, Figure 6 and Figure 7). Therefore, the reason for the decline in soluble protein was not only the decreased [N] by CO2 fertilization but also the damaged secondary structure and thermal stability of proteins by Se toxicity [29,72].
Together, in the cucumber fruits grown in C2Se1, soluble sugar was increased; crude fiber, VC, [N], [P], [K], [Ca], and [Mn] were maintained; but soluble protein, [S], [Mg], [Fe], and [Zn] were decreased when compared with C1Se1. Likewise, soluble sugar, soluble protein, VC, [N], [P], [K], [Ca], [Mg], [S], [Fe], [Mn], and [Zn] were all maintained, but only crude fiber was decreased in C2Se1 when compared with C2Se0.

5. Conclusions

According to the present results, although [Se] in cucumber fruits was increased with the Se supply level, the Se supply level in the nutrient solution was not higher or better. Because the regulation of cucumber plant growth by Se is dose-dependent, low-dose Se supply (Se1: 0.125 mg Se L−1) protected the photosynthetic pigments and stimulated the stomatal opening, especially under CO2 fertilization (C2: 1200 μmol mol−1), and thus promoted Pn, Tr, and DW accumulation, which were all inhibited in high-dose Se supply (Se3: 0.500 mg Se L−1) due to the selenite toxicity. Consequently, the highest fruit yield, Se use efficiency, and soluble sugar concentration were obtained in Se1 under CO2 fertilization. Intake of 87.3 g of fresh cucumber fruit grown in C2Se1 can fully cover the RDA of 55 μg Se day−1 for adults and is well consistent with people’s dietary habits. Most organic and inorganic nutrients in Se-enriched cucumber (C2Se1) were maintained, with only a decrease in soluble protein, [S], [Mg], [Fe], and [Zn]. Therefore, better nutrient solution formulations for this hydroponic production of Se-enriched cucumber need to be developed in future studies to efficiently utilize the benefits of CO2 fertilization and produce biofortified vegetables with high qualities.

Author Contributions

Conceptualization, Z.W., Z.D. and X.L.; methodology, Z.W. and X.L.; investigation, Z.W. and D.L.; data curation, Z.W. and X.L.; writing—original draft preparation, Z.W. and X.L.; writing—review and editing, D.L., N.S.G. and C.Z.; funding acquisition, C.Z., Z.D. and X.L. All authors have read and agreed to the published version of the manuscript.

Funding

This research was funded by the Key-Area Research and Development Program of Guangdong Province (2020B0202010006), the Strategic Priority Research Program of the Chinese Academy of Science (XDA23020401), and the Guangxi Major Project of Science and Technique Innovation (Guike AA17202026-5).

Institutional Review Board Statement

Not applicable.

Informed Consent Statement

Not applicable.

Data Availability Statement

The data presented in this study are available on request from the corresponding author.

Conflicts of Interest

The authors declare no conflict of interest.

References

  1. Zhang, X.; He, H.; Xiang, J.; Yin, H.; Hou, T. Selenium-Containing Proteins/Peptides from Plants: A Review on the Structures and Functions. J. Agric. Food Chem. 2020, 68, 15061–15073. [Google Scholar] [CrossRef] [PubMed]
  2. Wen, D. Selenium in horticultural crops. Sci. Hortic. 2021, 289, 110441. [Google Scholar] [CrossRef]
  3. Zhao, M.; Luo, T.; Zhao, Z.; Rong, H.; Zhao, G.; Lei, L. Food Chemistry of Selenium and Controversial Roles of Selenium in Affecting Blood Cholesterol Concentrations. J. Agric. Food Chem. 2021, 69, 4935–4945. [Google Scholar] [CrossRef] [PubMed]
  4. Tapiero, H.; Townsend, D.M.; Tew, K.D. The antioxidant role of selenium and seleno-compounds. Biomed. Pharmacother. 2003, 57, 134–144. [Google Scholar] [CrossRef]
  5. Khatiwada, S.; Subedi, A. A Mechanistic Link Between Selenium and Coronavirus Disease 2019 (COVID-19). Curr. Nutr. Rep. 2021, 10, 125–136. [Google Scholar] [CrossRef]
  6. Liu, Q.; Zhao, X.; Ma, J.; Mu, Y.; Wang, Y.; Yang, S.; Wu, Y.; Wu, F.; Zhou, Y. Selenium (Se) plays a key role in the biological effects of some viruses: Implications for COVID-19. Environ. Res. 2021, 196, 110984. [Google Scholar] [CrossRef]
  7. Zhang, J.; Saad, R.; Taylor, E.W.; Rayman, M.P. Selenium and selenoproteins in viral infection with potential relevance to COVID-19. Redox Biol. 2020, 37, 101715. [Google Scholar] [CrossRef]
  8. Dinh, Q.T.; Wang, M.; Tran, T.A.T.; Zhou, F.; Wang, D.; Zhai, H.; Peng, Q.; Xue, M.; Du, Z.; Bañuelos, G.S.; et al. Bioavailability of selenium in soil-plant system and a regulatory approach. Crit. Rev. Environ. Sci. Technol. 2018, 49, 443–517. [Google Scholar] [CrossRef]
  9. White, P.J. Selenium accumulation by plants. Ann. Bot. 2016, 117, 217–235. [Google Scholar] [CrossRef] [Green Version]
  10. Kowalska, I.; Smoleń, S.; Czernicka, M.; Halka, M.; Kęska, K.; Pitala, J. Effect of Selenium Form and Salicylic Acid on the Accumulation of Selenium Speciation Forms in Hydroponically Grown Lettuce. Agriculture 2020, 10, 584. [Google Scholar] [CrossRef]
  11. Malagoli, M.; Schiavon, M.; dall’Acqua, S.; Pilon-Smits, E.A. Effects of selenium biofortification on crop nutritional quality. Front. Plant Sci. 2015, 6, 280. [Google Scholar] [CrossRef] [Green Version]
  12. Raina, M.; Sharma, A.; Nazir, M.; Kumari, P.; Rustagi, A.; Hami, A.; Bhau, B.S.; Zargar, S.M.; Kumar, D. Exploring the new dimensions of selenium research to understand the underlying mechanism of its uptake, translocation, and accumulation. Physiol. Plant 2021, 171, 882–895. [Google Scholar] [CrossRef]
  13. Gruda, N. Impact of Environmental Factors on Product Quality of Greenhouse Vegetables for Fresh Consumption. Crit. Rev. Plant Sci. 2005, 24, 227–247. [Google Scholar] [CrossRef]
  14. Gruda, N.; Savvas, D.; Colla, G.; Rouphael, Y. Impacts of genetic material and current technologies on product quality of selected greenhouse vegetables—A review. Eur. J. Hortic. Sci. 2018, 83, 319–328. [Google Scholar] [CrossRef]
  15. Rayman, M.P. Selenium and human health. Lancet 2012, 379, 1256–1268. [Google Scholar] [CrossRef]
  16. Herforth, A.; Arimond, M.; Alvarez-Sanchez, C.; Coates, J.; Christianson, K.; Muehlhoff, E. A Global Review of Food-Based Dietary Guidelines. Adv. Nutr. 2019, 10, 590–605. [Google Scholar] [CrossRef] [Green Version]
  17. Miller, V.; Yusuf, S.; Chow, C.K.; Dehghan, M.; Corsi, D.J.; Lock, K.; Popkin, B.; Rangarajan, S.; Khatib, R.; Lear, S.A.; et al. Availability, affordability, and consumption of fruits and vegetables in 18 countries across income levels: Findings from the Prospective Urban Rural Epidemiology (PURE) study. Lancet Glob. Health 2016, 4, e695–e703. [Google Scholar] [CrossRef] [Green Version]
  18. Boeing, H.; Bechthold, A.; Bub, A.; Ellinger, S.; Haller, D.; Kroke, A.; Leschik-Bonnet, E.; Muller, M.J.; Oberritter, H.; Schulze, M.; et al. Critical review: Vegetables and fruit in the prevention of chronic diseases. Eur. J. Nutr. 2012, 51, 637–663. [Google Scholar] [CrossRef] [Green Version]
  19. Gruda, N. Assessing the impact of environmental factors on the quality of greenhouse produce. In Achieving Sustainable Greenhouse Cultivation; Marcelis, L., Heuvelink, E., Eds.; Burleigh Dodds Science Publishing Limited: Cambridge, UK, 2019. [Google Scholar] [CrossRef]
  20. Puccinelli, M.; Malorgio, F.; Terry, L.A.; Tosetti, R.; Rosellini, I.; Pezzarossa, B. Effect of selenium enrichment on metabolism of tomato (Solanum lycopersicum) fruit during postharvest ripening. J. Sci. Food Agric. 2019, 99, 2463–2472. [Google Scholar] [CrossRef] [Green Version]
  21. Funes-Collado, V.; Morell-Garcia, A.; Rubio, R.; López-Sánchez, J.F. Selenium uptake by edible plants from enriched peat. Sci. Hortic. 2013, 164, 428–433. [Google Scholar] [CrossRef] [Green Version]
  22. Rahim, F.P.; Rocio, C.G.; Adalberto, B.M.; Lidia Rosaura, S.C.; Maginot, N.H. Agronomic Biofortification with Selenium in Tomato Crops (Solanum lycopersicon L. Mill). Agriculture 2020, 10, 486. [Google Scholar] [CrossRef]
  23. Hu, W.; Su, Y.; Zhou, J.; Zhu, H.; Guo, J.; Huo, H.; Gong, H. Foliar application of silicon and selenium improves the growth, yield and quality characteristics of cucumber in field conditions. Sci. Hortic. 2022, 294, 110776. [Google Scholar] [CrossRef]
  24. Puccinelli, M.; Malorgio, F.; Pezzarossa, B. Selenium Enrichment of Horticultural Crops. Molecules 2017, 22, 933. [Google Scholar] [CrossRef] [PubMed]
  25. Johnson, L.J.; Meacham, S.L.; Kruskall, L.J. The antioxidants-vitamin C, vitamin E, selenium, and carotenoids. J. Agromedicine 2003, 9, 65–82. [Google Scholar] [CrossRef] [PubMed]
  26. Monsen, E.R. Dietary reference intakes for the antioxidant nutrients: Vitamin C, vitamin E, selenium, and carotenoids. J. Am. Diet. Assoc. 2000, 100, 637–640. [Google Scholar] [CrossRef]
  27. Higgs, D.J.; Morris, V.C.; Levander, O.A. Effect of cooking on selenium content of foods. J. Agric. Food Chem. 1972, 20, 678–680. [Google Scholar] [CrossRef]
  28. Dong, Z.; Liu, Y.; Dong, G.; Wu, H. Effect of boiling and frying on the selenium content, speciation, and in vitro bioaccessibility of selenium-biofortified potato (Solanum tuberosum L.). Food Chem. 2021, 348, 129150. [Google Scholar] [CrossRef]
  29. Gupta, M.; Gupta, S. An Overview of Selenium Uptake, Metabolism, and Toxicity in Plants. Front. Plant Sci. 2016, 7, 2074. [Google Scholar] [CrossRef] [Green Version]
  30. Bisbis, M.B.; Gruda, N.; Blanke, M. Potential impacts of climate change on vegetable production and product quality—A review. J. Clean. Prod. 2018, 170, 1602–1620. [Google Scholar] [CrossRef]
  31. Dong, J.; Gruda, N.; Li, X.; Tang, Y.; Zhang, P.; Duan, Z. Sustainable vegetable production under changing climate: The impact of elevated CO2 on yield of vegetables and the interactions with environments-A review. J. Clean. Prod. 2020, 253, 119920. [Google Scholar] [CrossRef]
  32. Dong, J.; Gruda, N.; Lam, S.K.; Li, X.; Duan, Z. Effects of elevated CO2 on nutritional quality of vegetables: A review. Front. Plant Sci. 2018, 9, 924. [Google Scholar] [CrossRef]
  33. Li, X.; Dong, J.; Gruda, N.; Chu, W.; Duan, Z. Does the short-term fluctuation of mineral element concentrations in the closed hydroponic experimental facilities affect the mineral concentrations in cucumber plants exposed to elevated CO2? Plant Soil 2021, 465, 125–141. [Google Scholar] [CrossRef]
  34. Sardans, J.; Grau, O.; Chen, H.Y.H.; Janssens, I.A.; Ciais, P.; Piao, S.; Penuelas, J. Changes in nutrient concentrations of leaves and roots in response to global change factors. Glob. Chang Biol. 2017, 23, 3849–3856. [Google Scholar] [CrossRef] [Green Version]
  35. Bai, B.; Wang, Z.; Gao, L.; Chen, W.; Shen, Y. Effects of selenite on the growth of alfalfa (Medicago sativa L. cv. Sadie 7) and related physiological mechanisms. Acta Physiol. Plant. 2019, 41, 78. [Google Scholar] [CrossRef]
  36. Hawrylak-Nowak, B.; Matraszek, R.; Pogorzelec, M. The dual effects of two inorganic selenium forms on the growth, selected physiological parameters and macronutrients accumulation in cucumber plants. Acta Physiol. Plant. 2015, 37, 41. [Google Scholar] [CrossRef] [Green Version]
  37. Li, X.; Dong, J.; Gruda, N.S.; Chu, W.; Duan, Z. Interactive effects of the CO2 enrichment and nitrogen supply on the biomass accumulation, gas exchange properties, and mineral elements concentrations in cucumber plants at different growth stages. Agronomy 2020, 10, 139. [Google Scholar] [CrossRef] [Green Version]
  38. Yamazaki, K. Nutrient Solution Culture; Pak-Kyo, Co.: Tokyo, Japan, 1982; p. 251. [Google Scholar]
  39. Lichtenthaler, H.K.; Wellburn, A.R. Determinations of total carotenoids and chlorophylls a and b of leaf extracts in different solvents. Biochem. Soc. Trans. 1983, 11, 591–592. [Google Scholar] [CrossRef] [Green Version]
  40. Dubois, M.; Gilles, K.A.; Hamilton, J.K.; Rebers, P.A.; Smith, F. Colorimetric Method for Determination of Sugars and Related Substances. Anal. Chem. 1956, 28, 350–356. [Google Scholar] [CrossRef]
  41. Bradford, M.M. A rapid and sensitive method for the quantitation of microgram quantities of protein utilizing the principle of protein-dye binding. Anal. Biochem. 1976, 72, 248–254. [Google Scholar] [CrossRef]
  42. Van Soest, P.J. Use of detergents in the analysis of fibrous feeds. 2. A rapid method for the determination of fiber and lignin. J. Assoc. Off. Agric. Chem. 1963, 46, 829–835. [Google Scholar] [CrossRef]
  43. Nelson, W.L.; Somers, G.F. Determination of Ascorbic Acid—Application of the Indophenol-Xylene Extraction Method to Determination in Large Numbers of Tomato and Tomato Juice Samples. Ind. Eng. Chem. 1945, 17, 754–756. [Google Scholar] [CrossRef]
  44. Zhao, F.; McGrath, S.P.; Crosland, A.R. Comparison of three wet digestion methods for the determination of plant sulphur by inductively coupled plasma atomic emission spectroscopy (ICP-AES). Commun. Soil Sci. Plant Anal. 1994, 25, 407–418. [Google Scholar] [CrossRef]
  45. Zhang, M.; Tang, S.; Huang, X.; Zhang, F.; Pang, Y.; Huang, Q.; Yi, Q. Selenium uptake, dynamic changes in selenium content and its influence on photosynthesis and chlorophyll fluorescence in rice (Oryza sativa L.). Environ. Exp. Bot. 2014, 107, 39–45. [Google Scholar] [CrossRef]
  46. Van der Kooi, C.J.; Reich, M.; Löw, M.; De Kok, L.J.; Tausz, M. Growth and yield stimulation under elevated CO2 and drought: A meta-analysis on crops. Environ. Exp. Bot. 2016, 122, 150–157. [Google Scholar] [CrossRef]
  47. Mortensen, L.M. Review: CO2 enrichment in greenhouses. Crop responses. Sci. Hortic. 1987, 33, 1–25. [Google Scholar] [CrossRef]
  48. Haghighi, M.; Sheibanirad, A.; Pessarakli, M. Effects of selenium as a beneficial element on growth and photosynthetic attributes of greenhouse cucumber. J. Plant Nutr. 2015, 39, 1493–1498. [Google Scholar] [CrossRef] [Green Version]
  49. Jozwiak, W.; Mleczek, M.; Politycka, B. The effect of exogenous selenium on the growth and photosynthetic pigments content of cucumber seedlings. Fresenius Environ. Bull. 2016, 25, 142–152. [Google Scholar]
  50. Feng, R.; Wei, C.; Tu, S. The roles of selenium in protecting plants against abiotic stresses. Environ. Exp. Bot. 2013, 87, 58–68. [Google Scholar] [CrossRef]
  51. Balal, R.M.; Shahid, M.A.; Javaid, M.M.; Iqbal, Z.; Anjum, M.A.; Garcia-Sanchez, F.; Mattson, N.S. The role of selenium in amelioration of heat-induced oxidative damage in cucumber under high temperature stress. Acta Physiol. Plant. 2016, 38, 158. [Google Scholar] [CrossRef]
  52. Hajiboland, R.; Sadeghzade, N. Effect of selenium on CO2 and NO3 assimilation under low and adequate nitrogen supply in wheat (Triticum aestivum L.). Photosynthetica 2014, 52, 501–510. [Google Scholar] [CrossRef]
  53. Lehotai, N.; Kolbert, Z.; Peto, A.; Feigl, G.; Ordog, A.; Kumar, D.; Tari, I.; Erdei, L. Selenite-induced hormonal and signalling mechanisms during root growth of Arabidopsis thaliana L. J. Exp. Bot. 2012, 63, 5677–5687. [Google Scholar] [CrossRef] [Green Version]
  54. Li, D.; Dong, J.; Gruda, N.S.; Li, X.; Duan, Z. Elevated root-zone temperature promotes the growth and alleviates the photosynthetic acclimation of cucumber plants exposed to elevated [CO2]. Environ. Exp. Bot. 2022, 194, 104694. [Google Scholar] [CrossRef]
  55. De Almeida, H.J.; Carmona, V.V.; Dutra, A.F.; Cecílio Filho, A.B. Growth and physiological responses of cabbage cultivars biofortified with inorganic selenium fertilizers. Sci. Hortic. 2022, 302, 111154. [Google Scholar] [CrossRef]
  56. Businelli, D.; D’Amato, R.; Onofri, A.; Tedeschini, E.; Tei, F. Se-enrichment of cucumber (Cucumis sativus L.), lettuce (Lactuca sativa L.) and tomato (Solanum lycopersicum L. Karst) through fortification in pre-transplanting. Sci. Hortic. 2015, 197, 697–704. [Google Scholar] [CrossRef]
  57. Zhou, X.; Yang, J.; Kronzucker, H.J.; Shi, W. Selenium Biofortification and Interaction with other Elements in Plants: A Review. Front. Plant Sci. 2020, 11, 586421. [Google Scholar] [CrossRef]
  58. Li, H.F.; McGrath, S.P.; Zhao, F.J. Selenium uptake, translocation and speciation in wheat supplied with selenate or selenite. New Phytol. 2008, 178, 92–102. [Google Scholar] [CrossRef]
  59. Zhang, L.; Hu, B.; Li, W.; Che, R.; Deng, K.; Li, H.; Yu, F.; Ling, H.; Li, Y.; Chu, C. OsPT2, a phosphate transporter, is involved in the active uptake of selenite in rice. New Phytol. 2014, 201, 1183–1191. [Google Scholar] [CrossRef] [Green Version]
  60. Sabatino, L.; La Bella, S.; Ntatsi, G.; Iapichino, G.; D’Anna, F.; De Pasquale, C.; Consentino, B.B.; Rouphael, Y. Selenium biofortification and grafting modulate plant performance and functional features of cherry tomato grown in a soilless system. Sci. Hortic. 2021, 285, 110095. [Google Scholar] [CrossRef]
  61. Cipriano, P.E.; Siueia Júnior, M.; de Souza, R.R.; da Silva, D.F.; da Silva, R.F.; Faquin, V.; de Souza Silva, M.L.; Guilherme, L.R.G. Macronutrients content of radishes and the influence of biofortification with selenium. Sci. Hortic. 2022, 296, 110908. [Google Scholar] [CrossRef]
  62. Peng, Q.; Zhang, Z.; Su, R.; Zhang, X.; Lambers, H.; He, H. Phosphorus and selenium uptake, root morphology, and carboxylates in the rhizosheath of alfalfa (Medicago sativa) as affected by localised phosphate and selenite supply in a split-root system. Funct. Plant Biol. 2021, 48, 1161–1174. [Google Scholar] [CrossRef]
  63. Kopsell, D.A.; Randle, W.M.; Mills, H.A. Nutrient accumulation in leaf tissue of rapid-cyclingbrassuca oleracearesponds to increasing sodium selenate concentrations. J. Plant Nutr. 2000, 23, 927–935. [Google Scholar] [CrossRef]
  64. Hawrylak-Nowak, B. Effect of selenium on selected macronutrients in maize plants. J. Elementol. 2008, 13, 513–519. [Google Scholar]
  65. Guerrero, B.; Llugany, M.; Palacios, O.; Valiente, M. Dual effects of different selenium species on wheat. Plant Physiol. Biochem. 2014, 83, 300–307. [Google Scholar] [CrossRef] [PubMed]
  66. Abdalla, M.A.; Wick, J.E.; Famuyide, I.M.; McGaw, L.J.; Mühling, K.H. Selenium Enrichment of Green and Red Lettuce and the Induction of Radical Scavenging Potential. Horticulturae 2021, 7, 488. [Google Scholar] [CrossRef]
  67. Teixeira, L.S.; Pimenta, T.M.; Brito, F.A.L.; Malheiros, R.S.P.; Arruda, R.S.; Araujo, W.L.; Ribeiro, D.M. Selenium uptake and grain nutritional quality are affected by nitrogen fertilization in rice (Oryza sativa L.). Plant Cell Rep. 2021, 40, 871–880. [Google Scholar] [CrossRef]
  68. Huang, S.; Yu, K.; Xiao, Q.; Song, B.; Yuan, W.; Long, X.; Cai, D.; Xiong, X.; Zheng, W. Effect of bio-nano-selenium on yield, nutritional quality and selenium content of radish. J. Food Compos. Anal. 2023, 115, 104927. [Google Scholar] [CrossRef]
  69. Gonzalez-Lemus, U.; Medina-Perez, G.; Espino-Garcia, J.J.; Fernandez-Luqueno, F.; Campos-Montiel, R.; Almaraz-Buendia, I.; Reyes-Munguia, A.; Urrutia-Hernandez, T. Nutritional Parameters, Biomass Production, and Antioxidant Activity of Festuca arundinacea Schreb. Conditioned with Selenium Nanoparticles. Plants 2022, 11, 2326. [Google Scholar] [CrossRef]
  70. Lu, N.; Wu, L.; Zhang, X.; Zhang, Y.; Shan, C. Selenium improves the content of vitamin C in the fruit of strawberry by regulating the enzymes responsible for vitamin C metabolism. Plant Soil Environ. 2022, 68, 205–211. [Google Scholar] [CrossRef]
  71. Handa, N.; Kohli, S.K.; Sharma, A.; Thukral, A.K.; Bhardwaj, R.; Abd_Allah, E.F.; Alqarawi, A.A.; Ahmad, P. Selenium modulates dynamics of antioxidative defence expression, photosynthetic attributes and secondary metabolites to mitigate chromium toxicity in Brassica juncea L. plants. Environ. Exp. Bot. 2019, 161, 180–192. [Google Scholar] [CrossRef]
  72. Luo, L.; Zhang, J.; Zhang, K.; Wen, Q.; Ming, K.; Xiong, H.; Ning, F. Peanut selenium distribution, concentration, speciation, and effects on proteins after exogenous selenium biofortification. Food Chem. 2021, 354, 129515. [Google Scholar] [CrossRef]
Figure 1. The root, stem, leaf, fruit, and whole plant dry weight (DW), and the root/shoot ratio of cucumber plants grown under different [CO2] and Se supply levels (n = 4). Bars represent standard errors. [CO2] levels: C1: ambient [CO2] (412 µmol mol−1); C2: elevated [CO2] (1196 µmol mol−1). Se supply levels: Se0, Se1, Se2, and Se3: 0, 0.125, 0.250, and 0.500 mg Se L−1. Means not followed by the same lower-case letters are significantly different among different Se supply levels in the same [CO2] level, and not followed by the same upper-case letters are significantly different between different [CO2] levels in the same Se supply level, according to Fisher LSD test at p < 0.05. In the internal table, CO2: [CO2] level; Se: Se supply level. Asterisks (*) indicate significant differences (*: p < 0.05, **: p < 0.01, ***: p < 0.001); − indicates non-significant differences (p ≥ 0.05).
Agronomy 13 00922 g001
Figure 2. The net photosynthesis rate (Pn), stomatal conductance (Gs), transpiration rate (Tr), and photosynthetic pigment concentrations of cucumber leaves under different [CO2] and Se supply levels (n = 12 for gas exchange properties and n = 4 for pigment concentrations). Bars represent standard errors. [CO2] levels: C1: ambient [CO2] (412 µmol mol−1); C2: elevated [CO2] (1196 µmol mol−1). Se supply levels: Se0, Se1, Se2, and Se3: 0, 0.125, 0.250, and 0.500 mg Se L−1. Means not followed by the same lower-case letters are significantly different among different Se supply levels in the same [CO2] level, and not followed by the same upper-case letters are significantly different between different [CO2] levels in the same Se supply level, according to Fisher LSD test at p < 0.05. In the internal table, CO2: [CO2] level; Se: Se supply level. Asterisks (*) indicate significant differences (*: p < 0.05, **: p < 0.01, ***: p < 0.001); − indicates non-significant differences (p ≥ 0.05).
Agronomy 13 00922 g002
Figure 3. The yield, Se concentration, Se accumulation, and Se use efficiency of cucumber fruits under different [CO2] and Se supply levels (n = 4). Bars represent standard errors. [CO2] levels: C1: ambient [CO2] (412 µmol mol−1); C2: elevated [CO2] (1196 µmol mol−1). Se supply levels: Se0, Se1, Se2, and Se3: 0, 0.125, 0.250, and 0.500 mg Se L−1. Means not followed by the same lower-case letters are significantly different among different Se supply levels in the same [CO2] level, and not followed by the same upper-case letters are significantly different between different [CO2] levels in the same Se supply level, according to Fisher LSD test at p < 0.05. In the internal table, CO2: [CO2] level; Se: Se supply level. Asterisks (*) indicate significant differences (*: p < 0.05, **: p < 0.01, ***: p < 0.001); − indicates non-significant differences (p ≥ 0.05).
Agronomy 13 00922 g003
Figure 4. The soluble sugar, soluble protein, crude fiber, and vitamin C (VC) concentrations in cucumber fruits under different [CO2] and Se supply levels (n = 4). Bars represent standard errors. [CO2] levels: C1: ambient [CO2] (412 µmol mol−1); C2: elevated [CO2] (1196 µmol mol−1). Se supply levels: Se0, Se1, Se2, and Se3: 0, 0.125, 0.250, and 0.500 mg Se L−1. Means not followed by the same lower-case letters are significantly different among different Se supply levels in the same [CO2] level, and not followed by the same uppercase letters are significantly different between different [CO2] levels in the same Se supply level, according to Fisher LSD test at p < 0.05. In the internal table, CO2: [CO2] level; Se: Se supply level. Asterisks (*) indicate significant differences (*: p < 0.05, **: p < 0.01, ***: p < 0.001); − indicates non-significant differences (p ≥ 0.05).
Agronomy 13 00922 g004
Figure 5. Heat map of changes in the mineral element concentrations in cucumber fruits relative to the mean value in C1Se0 treatment under different [CO2] and Se supply levels (n = 4). [CO2] levels: C1: ambient [CO2] (412 µmol mol−1); C2: elevated [CO2] (1196 µmol mol−1). Se supply levels: Se0, Se1, Se2, and Se3: 0, 0.125, 0.250, and 0.500 mg Se L−1. Means not followed by the same lower-case letters are significantly different among different Se supply levels in the same [CO2] level, and not followed by the same uppercase letters are significantly different between different [CO2] levels in the same Se supply level, according to Fisher LSD test at p < 0.05. No letter indicates non-significant differences (p ≥ 0.05).
Agronomy 13 00922 g005
Figure 6. Pearson correlations between [CO2] level, Se supply level, gas exchange property, Se concentration, organic nutrient concentration, and mineral concentrations in cucumber fruits under different [CO2] and Se supply levels (n = 4). CO2: [CO2] level; Se: Se supply level; Pn: net photosynthesis rate; Tr: transpiration rate; SS: soluble sugar concentrations; SP: soluble protein concentrations; VC: vitamin C concentrations; CF: crude fiber concentrations. Asterisks (*) indicate significant levels (*: p < 0.05, **: p < 0.01, ***: p < 0.001).
Agronomy 13 00922 g006
Figure 7. Principal components analysis of [CO2] level, Se supply level, gas exchange property, Se concentration, organic nutrient concentration, and mineral concentrations in cucumber fruits under different [CO2] and Se supply levels (n = 4). CO2: [CO2] level; Se: Se supply level; Pn: net photosynthesis rate; Tr: transpiration rate; SS: soluble sugar concentrations; SP: soluble protein concentrations; VC: vitamin C concentrations; CF: crude fiber concentrations. [CO2] levels: C1: ambient [CO2] (412 µmol mol−1); C2: elevated [CO2] (1196 µmol mol−1). Se supply levels: Se0, Se1, Se2, and Se3: 0, 0.125, 0.250, and 0.500 mg Se L−1.
Agronomy 13 00922 g007
Table 1. The Se concentration of cucumber fruits on a fresh weight (FW) basis, and the recommended daily allowances (RDA: 55 μg Se day−1) and the tolerable upper intake levels (UL: 400 μg Se day−1) of fresh cucumber fruits produced under different [CO2] and Se supply levels.
Treatments 1[Se] (mg kg−1 FW)RDA (g day−1)UL (g day−1)
C1Se10.714 77.03560.2
C1Se21.067 51.55374.9
C1Se32.163 25.43184.9
C2Se10.630 87.30634.9
C2Se21.073 51.26372.8
C2Se31.480 37.16270.3
1 [CO2] levels: C1: ambient [CO2] (412 µmol mol−1); C2: elevated [CO2] (1196 µmol mol−1). Se supply levels: Se0, Se1, Se2, and Se3: 0, 0.125, 0.250, 0.500 mg Se L−1.
Table 2. ANOVA testing the effects of [CO2] and Se supply levels and their combination on the mineral element concentrations in cucumber fruits.
Factor 1[N][P][K][Ca][Mg][S][Fe][Mn][Zn]
CO2* 2***NS************
SeNS 3NSNS****NSNS****
CO2 × SeNSNSNSNSNSNSNSNSNS
1 CO2: [CO2] level; Se: Se supply level. 2 Asterisks (*) indicate significant differences (*: p < 0.05, **: p < 0.01, ***: p < 0.001). 3 NS indicates non-significant differences (p ≥ 0.05).
Disclaimer/Publisher’s Note: The statements, opinions and data contained in all publications are solely those of the individual author(s) and contributor(s) and not of MDPI and/or the editor(s). MDPI and/or the editor(s) disclaim responsibility for any injury to people or property resulting from any ideas, methods, instructions or products referred to in the content.

