Article

Properties of Biochar Obtained from Tropical Crop Wastes Under Different Pyrolysis Temperatures and Its Application on Acidic Soil

1
College of Natural Resources and Environment, South China Agricultural University, Guangzhou 510642, China
2
Key Laboratory of Tropical Crops Nutrition of Hainan Province, South Subtropical Crops Research Institute, Chinese Academy of Tropical Agricultural Sciences, Zhanjiang 524091, China
3
Key Laboratory of Tobacco Biology and Processing, Ministry of Agriculture and Rural Affairs, Tobacco Research Institute of Chinese Academy of Agricultural Sciences, Qingdao 266101, China
*
Author to whom correspondence should be addressed.
These authors contributed equally to this work.
Agronomy 2023, 13(3), 921; https://doi.org/10.3390/agronomy13030921
Submission received: 28 February 2023 / Revised: 14 March 2023 / Accepted: 15 March 2023 / Published: 20 March 2023

Abstract

:
When biochars are produced, feedstock is a crucial factor that determines their physicochemical properties. However, the characteristics of tropical crop waste-derived biochar have not been described and limit its availability. In this study, pineapple leaf (PAL), banana stem (BAS), sugarcane bagasse (SCB) and horticultural substrate (HCS), were used to prepare biochar at 300, 500 and 700 °C. Properties of biochars and their applications were analysed. The results indicated that hydrophobicity, nonpolarity and aromaticity of SCB biochar (SCBB) were higher than other biochars due to the loss of H (hydrogen), O (oxygen), and N (nitrogen). The pH of PAL biochar (PALB) and BAS biochar (BASB) ranged from 9.69 to 10.30 higher than that of SCBB and HCS biochar (HCSB) with 7.17–9.77. In PALB and BASB, sylvite was the dominant crystal structure. With temperature rising, C–H stretching, C=C stretching and H–O in alcohol groups decreased, and Si–O stretching in HCSB and SCBB strengthened. Biochars obtained at 500 °C, especially SCBB and HCSB, significantly promoted the growth of maize. The PALB and BASB greatly increased the soil pH/EC to 6.90–7.35 and 0.67–0.95 ms/cm, while those of SCBB and HCSB were 5.97–6.74 and 0.23–0.45 ms/cm. The application of the biochars to the soil increased soil pH, reducing the acidic soil stress in maize growth, especially PAL and BAS biochars prepared at 300 °C. Biochar prepared at lower temperature will greatly reduce energy consumption and increase the utilization efficiency of tropical agricultural waste resources.

1. Introduction

Large amounts of pineapple leaf (PAL), banana stem (BAS), sugarcane bagasse (SCB) are generated and subsequently abandoned after the fruit harvest in tropical and subtropical regions worldwide [1,2]. These residues are major products of the farming process and they are treated as waste likely because of poor understanding of their economic values [3]. Most of agricultural waste, especially tropical crop waste, is composed of cellulose, hemicellulose and lignin [4]. The traditional horticultural substrates (HCS) have fast decomposition, poor water holding capacity, and improper C/N. The management of agricultural and forestry waste is still one of the main environmental concerns. The traditional horticultural substrates (HCS) will pollute the environment if not handled properly. Their recycling and recovery are considered as the most economically viable sustainable options.
Simple and innovative techniques have been developed and reported for enhancing the value of locally available agricultural biomass residues. These techniques include the processing of biomass materials into cost-effective animal feed raw materials or additives; bio-fuel productions (e.g., alcohol, biogas, briquettes, and diesel); production of food and feed-grade ash minerals, biochar, and activated charcoal, which are used to remediate polluted agricultural soil; organic fertilizer production via composting; and using them as substrates to produce mushrooms [3,5,6,7,8,9]. The use of biomass residues as feedstock for sustainable energy and its innovation have become challenging research topics.
The use of biochar as a soil amendment has catalyzed recent global enthusiasm [10]. Converting agricultural waste into biochar can sequester carbon and retain most mineral nutrients [11,12,13]. Biochar is a renewable resource and predominantly comprises stable black carbon produced in a partially or totally anoxic environment in a pyrolysis temperature range of 300–700 °C [14,15]. Biochar characteristics depend on the pyrolysis temperature and feedstock. Feedstocks have significantly distinctive physicochemical properties, owing to variations in elemental and structural compositions, and respond in different ways to specific pyrolysis conditions [16,17,18]. Some researchers have found that biochar pH, surface areas, ash content, and hydrophobicity increased, while hydrophilicity, biochar yield, O/C, and H/C decreased with increasing pyrolysis temperature [17,19]. However, pyrolysis temperature did not produce substantial changes in electrical conductivity, water-soluble nutrients and total elemental contents, and cation exchange capacity (CEC) in industrial waste [11]. Pariyar et al. [12] observed that the pH values of sawdust and rice husk biochar were found to increase from 5.75 to 6.84 and from 6.41 to 7.97, respectively. In recent years, the application of biochar has increased significantly for improving soil fertility and, accordingly, agricultural productivity. It also enhances the chemical and physical properties of soil. In particular, biochar improves ion exchange capacity, pH and enhances soil carbon sequestration, whereas biochars with high pH could be used as acidic soils amendment [11,12]. The BET surface areas of poultry litter and paper sludge biochar increased from 1.75 to 25.33 m2 g−1 and from 3.19 to 87.18 m2 g−1, respectively, while the CEC decreased with increasing temperature. For example, paper sludge and poultry litter biochars had a higher CEC (54.31 and 67.23 Cmol kg−1, respectively) at 350 °C than they did under higher temperature of 450, 550, and 650 °C [12].
Currently, biochar derived from typical tropical crop waste has not been characterized, which limits the use of their potential capabilities. The focus of this study was to investigate the effects of the pyrolysis temperature (300–700 °C) on biochar produced from pineapple leaves, banana stems, sugarcane bagasse, and horticultural substrate. We hypothesized that the biochar derived from the three tropical agricultural wastes and a horticultural substrate at different pyrolysis temperatures would have different characteristics and potential values as soil conditioners. The biochar obtained herein was characterized using various analytical techniques, including Fourier transform infrared spectroscopy (FT-IR), BET analysis, and X-ray diffraction (XRD) to evaluate their potential value.

2. Materials and Methods

2.1. Residue Sources

Three different agricultural wastes including, pineapple leaves (PAL), banana stems (BAS), sugarcane bagasse (SCB) and horticultural substrate (HCS) were used in the present study. These feedstock materials were obtained from an experimental field at the South Subtropical Crops Research Institute of the Chinese Academy of Tropical Agricultural Sciences in Zhanjiang, Guangdong Province, China. The HCS was produced via composting and fermenting with manure, sugarcane leaves and sugarcane bagasse. The samples were dried at ~30–35 °C for 1 week, ground using a comminuting machine (Xinnuo DFT-100, Shanghai, China) and passed through a 2 mm sieve.

2.2. Biochar Preparation

The biochar was prepared at 300, 500, and 700 °C. The pyrolysis heating rate was 5 °C /min. For each material, the process was continued up to 2 h after the highest temperature reached. The biochar that remained in the reactor (SK3-4-10-10-10, Zhuochi, Hangzhou, China) was collected after pyrolysis, sieved and stored in a desiccator until further use.

2.3. pH, Composition

A 1 g sample of dry biochar was dispersed in 10 mL of deionized water. The pH of the suspensions was measured using a digital pH meter (PHS-3C, Leici, Shanghai, China). The elemental carbon (C), nitrogen (N), and sulfur (S) were determined using an elemental analyzer (Elementar Vario UNICUBE, Elementar, Shanghai, China). The phosphorus (P) content was determined using a sulfuric acid digestion-spectrophotometer (UV2700, SHIMADZU, Japan). Magnesium (Mg), calcium (Ca), iron (Fe), and aluminum (Al) contents were determined using a nitric acid digestion inductively coupled plasma mass spectrometer (ICP-MS) (Agilent Technologies 7850, Santa Clara, CA, USA).
The pyrolysis yields (PYs) were determined as the ratio of the weight of the produced biochar (wBC) to the dry weight of the feedstock (wF), where PY [%] = wBC/wF × 100%. The percent ash content of the residue was determined by combusting the dry samples at 760 °C for 6 h and analyzing the residue that remained after heating [20].

2.4. Surface Properties

The BET (Brunauer, Emmettand Teller) surface area was determined using N2 sorption analysis at 77.3K with a Micromeritics ASAP-2420 system (Micromeritics Instru-ments, Norcross, GA, USA). Biochar samples weighting between 0.1 and 0.3 g were vacuum degassed at 300 °C for 2 h before analysis. BET surface area output was obtained using the automated Micromeritics ASAP-2460 automated software Version 3.01 with the BET equation.

2.5. Crystallography

The crystalline structures present in the biochar samples were analyzed using an Empyrean (Rigaku SmartLab 9 kw, Tokyo, Japan) X-ray diffractometer. The XRD analyses were conducted using standard powder diffraction procedures.

2.6. Fourier Transform Infrared Spectroscopy

FT-IR analyses were used to examine the functional groups on the surfaces of the resulting biochars. To obtain the observable spectra, the biochar sample was mixed to approximately 1.0 wt% with spectroscopic grade KBr, and ground further with an agate mortar for dilution and homogenization. The spectra were obtained using an FT-IR spectrophotometer (SHIMADZU, IRTrace-100, Kyoto, Japan). The FT-IR measurements were recorded in a range of 400–4000 cm−1, with a resolution of 2.0. Interferograms of 1024 scans were averaged for each spectrum.

2.7. Pot Experiment

A 21d-pot experiment, growing maize in soil with biochar addition, was conducted to test the effect of biochars on fruit maize growth. Soil (latosols) with pH 5.30 was collected from wasteland at the South Subtropical Crops Research Institute of the Chinese Academy of Tropical Agricultural Sciences. After collection, the soil was air-dried and passed through a 2 mm sieve for test. The pot experiment was performed in triplicate, and each pot (10 cm height and 7.5 cm diameter) was filled with 150 g of soil and 4.5 g biochar. Biochars were pre-inoculated into the soil 15 days prior to maize cultivation. The experiment used 12 treatments, PALB300, PALB500, PALB700, BASB300, BASB500, BASB700, SCBB300, SCBB500, SCBB700, HCS300, HCS500 and HCS700. A pot with 150 g of soil alone was the control treatment (ck). The fruit maize (Longyu 1 hao certified by the Agricultural Crop Variety Certification Commission of Shanxi in 2014) was chosen as the tested crops. Seeds were surface-sterilized in 15%(v/v) H2O2 for 15 min and soaked in deionized water overnight and then put on the wet filter papers in petri dishes at 25 °C in darkness for 24 h. Germinated seeds were transferred to the clean quartz sand to grow for 7 days. Seedlings at the two-leaf stage were transplanted into the pot. The soils were watered quantitatively every day. Plants were harvested after growing in the growth chamber for 21 days. In addition, the fresh weight, height and chlorophyll of plant were measured. Soil were aired and passed through a 2 mm sieve to determinate pH (PHS-3C, Leici, Shanghai, China) and EC (DDS-307A, Leici, Shanghai, China).

2.8. Statistical Analysis

Data corresponding to pH, yield, fresh weight, height and the chlorophyll of the plant, as well as the contents (%) of ash, C, H, N and O are shown as mean values ± Standard Error (SE) of triplicate measurements. All significance analysis was performed at 95% (p < 0.05) confidence level using SPSS version 19.0.

3. Results and Discussion

3.1. pH, Elemental Composition

Increasing the pyrolysis temperature increased the pH of SCB biochar (SCBB) and HCS biochar (HCSB), from 7.17 to 7.51, and from 8.89 to 9.77, respectively (Table 1). The pH value of PAL biochar (PALB) and BAS biochar (BASB) were approximately 9.82 and 10.25, respectively. The pH value of SCBB is associated with the alkali elements in the biochar [20,21]. Tomczyk et al. [22] found that pH values of biochar obtained from sugarcane bagasse at 400 and 600 °C were 7.0 and 7.5, respectively. The basic elemental contents of sugarcane bagasse are low (as shown in Table S1); thus, its pH value is lower than that of the other materials. Increases in pH occur as a result of the separation of alkali salts from organic materials because of the increased pyrolysis temperature [23,24].
Higher pyrolysis temperature did not have a substantial effect on the pH of BASBs and PALBs, likely due to their similar ash contents (8.10–9.30%). This finding also indicates that the total alkaline mineral elements in the ash largely determine the soil pH [20,25,26].
The ash contents of the biochar produced from SCBB and HCSB increased with pyrolysis temperature (Table 1). Yields of biochars ranged from 34.7% to 50.8%, 27.8% to 39.8% and 18.4% to 35.3% at pyrolysis temperatures of 300, 500, and 700 °C, respectively. Thus, the pyrolysis yields were ranked in the following decreasing order: HCSB > SCBB ≈ PALB > BASB. Among the PALB, BASB and SCBB, the biochar yields increased with the content of lignin which is difficult to decompose. On average, biochar yields decreased by 16.07% and 34.03% when pyrolyzed at 500 and 700 °C, respectively, compared with the yield when pyrolyzed at 300 °C. The biochar yield decreased gradually with increasing pyrolysis temperature [27,28]. Such decreases in biochar yields with increasing pyrolysis temperatures have been observed previously [29,30], presumably owing to vigorous releases of volatile organic matter that forms more aromatic compounds as a result of the thermal breakdown of biomass that occurs at 700 °C [30,31]. Specifically, large amounts of carbon dioxide (CO2), carbon monoxide (CO), and oxynitride (NOX) are lost at higher temperatures, thereby causing a substantial reduction in organic matter [32].
The C content of SCBB (73.7–79.1%) was the highest, followed by that of PALB (59.9%), while those of BASB and HCSB were the lowest and decreased gradually with increasing pyrolysis temperature. The changes in C content occurred concurrently with the H and O losses. More than 50% of the mass of H was removed from the original feedstocks when pyrolyzing at lower temperature. Thus, the total H content of the biochar decreased from 3.00–4.13% to 0.91–1.98% as the temperature increased from 300 to 700 °C. These results indicated that both the pyrolysis temperature and feedstock have a strong influence on biochar compositions. Pyrolysis produced substantial increases in biochar C content, which were associated with the loss of –OH functional surface groups caused by dehydration in PALB and SCBB [33,34,35]. Furthermore, when pyrolyzing at higher temperatures, C resulted in total H mass losses that exceeded 85% [36,37]. These findings are consistent with those reported by Stefaniuk and Oleszczuk [20] and Cantrell et al. [37]. The C decrease can be due to declining degree of carbonization [35]. Another explanation is that biochar formation is due to the decomposition of lignin with the quick release of H2, CH4 and aromatic condensation reactions as the temperature increases; thus, there may be more CH4–C loss in high-temperature conditions [38]. The hydrogen, oxygen and nitrogen content of biochar decreased gradually with increasing pyrolysis temperature mainly because of the volatilization of functional group structures [35,38]. Similarly, total N losses may be accounted for through emissions of NH4+-N and other N-containing volatile organic compounds during pyrolysis [39]. C, H, and N contents have consistently been reported to have decreased as temperature increased from 300 to 500 °C, owing to increasing volatilization of these elements during carbonization [40]. The total concentration of Ca, Mg, Fe, and Al in the ash that remained in the biochar increased with increasing pyrolysis temperature [21,28,41].
With the increase of O/C, (O+N)/C and H/C, the hydrophilicity and polarity increased while aromaticity decreased [42]. So, the hydrophobicity, nonpolarity and aromaticity of SCBB with lower O/C, (O+N)/C and H/C were higher than other biochars in this study. The hydrophobicity, nonpolarity and aromaticity of biochar increased with the temperature rising except for BASB. Under higher temperature, the C content decreased and the O/C increased, this might be caused by the higher potassium compounds. Potassium (K) could reduce the activation energy of the reaction, and this process could be accompanied with a loss of carbon [42]. Conversely, a larger percentage of inorganic components accumulate at higher pyrolysis temperatures. The Ca contents ranked as HCSB (6.63–9.20%) > BASB (1.56–3.61%) > PALB (0.62–0.84%) > SCBB (0.18–0.30%). While, the Mg contents decreased in the order of BASB (1.83–4.01%) > HCSB (1.17–1.52%) > PALB (0.40–0.55%) > SCBB (0.08–0.13%). In addition, the Fe, Al, P, and S contents of biochar produced from HCS were higher than those in biochar produced from the other organic residues (Table S1). Inorganic components might increase the pH value of biochar [33,34].

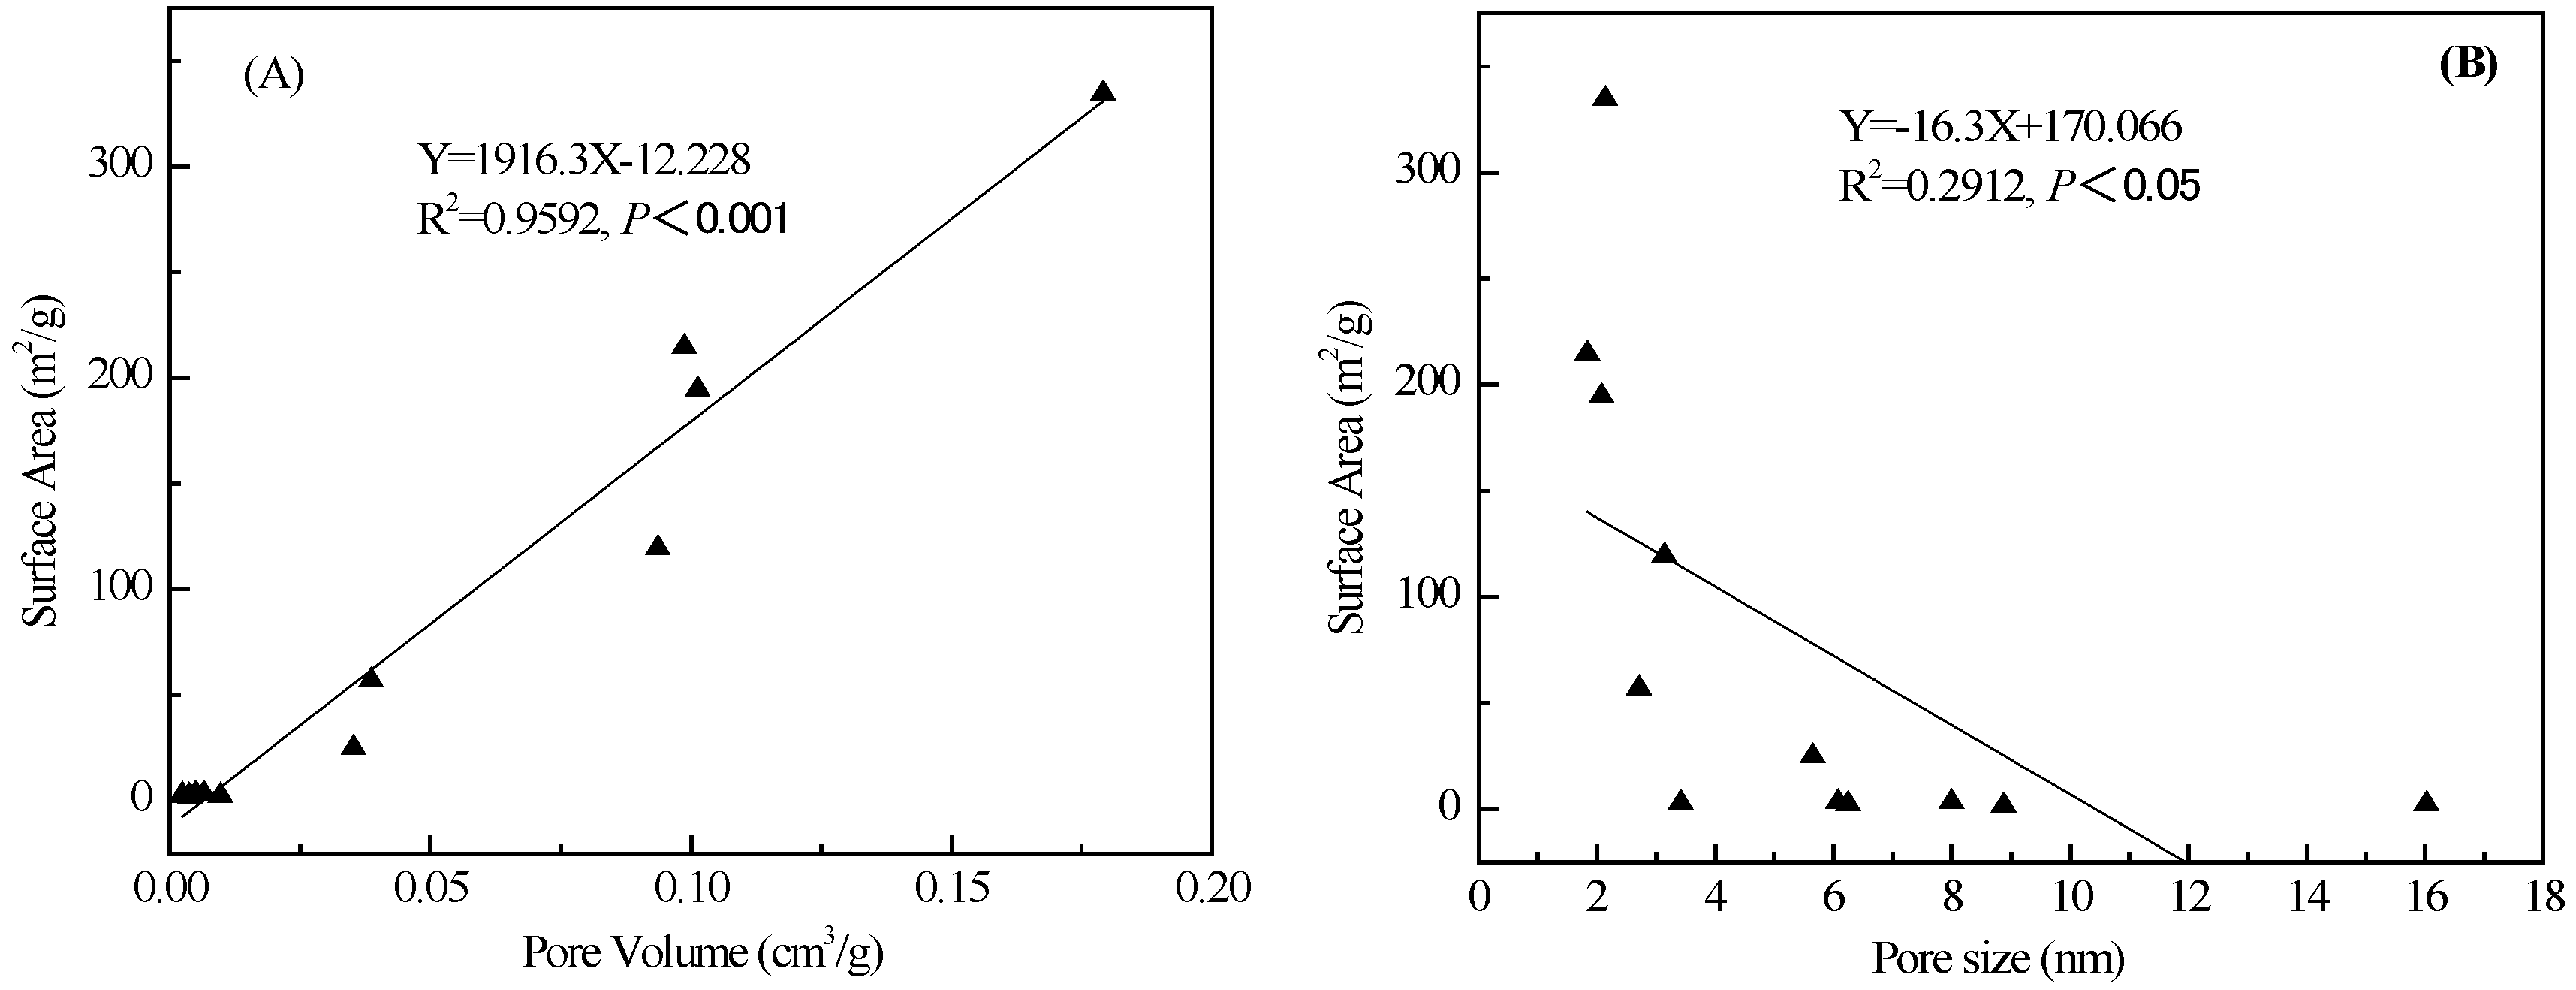
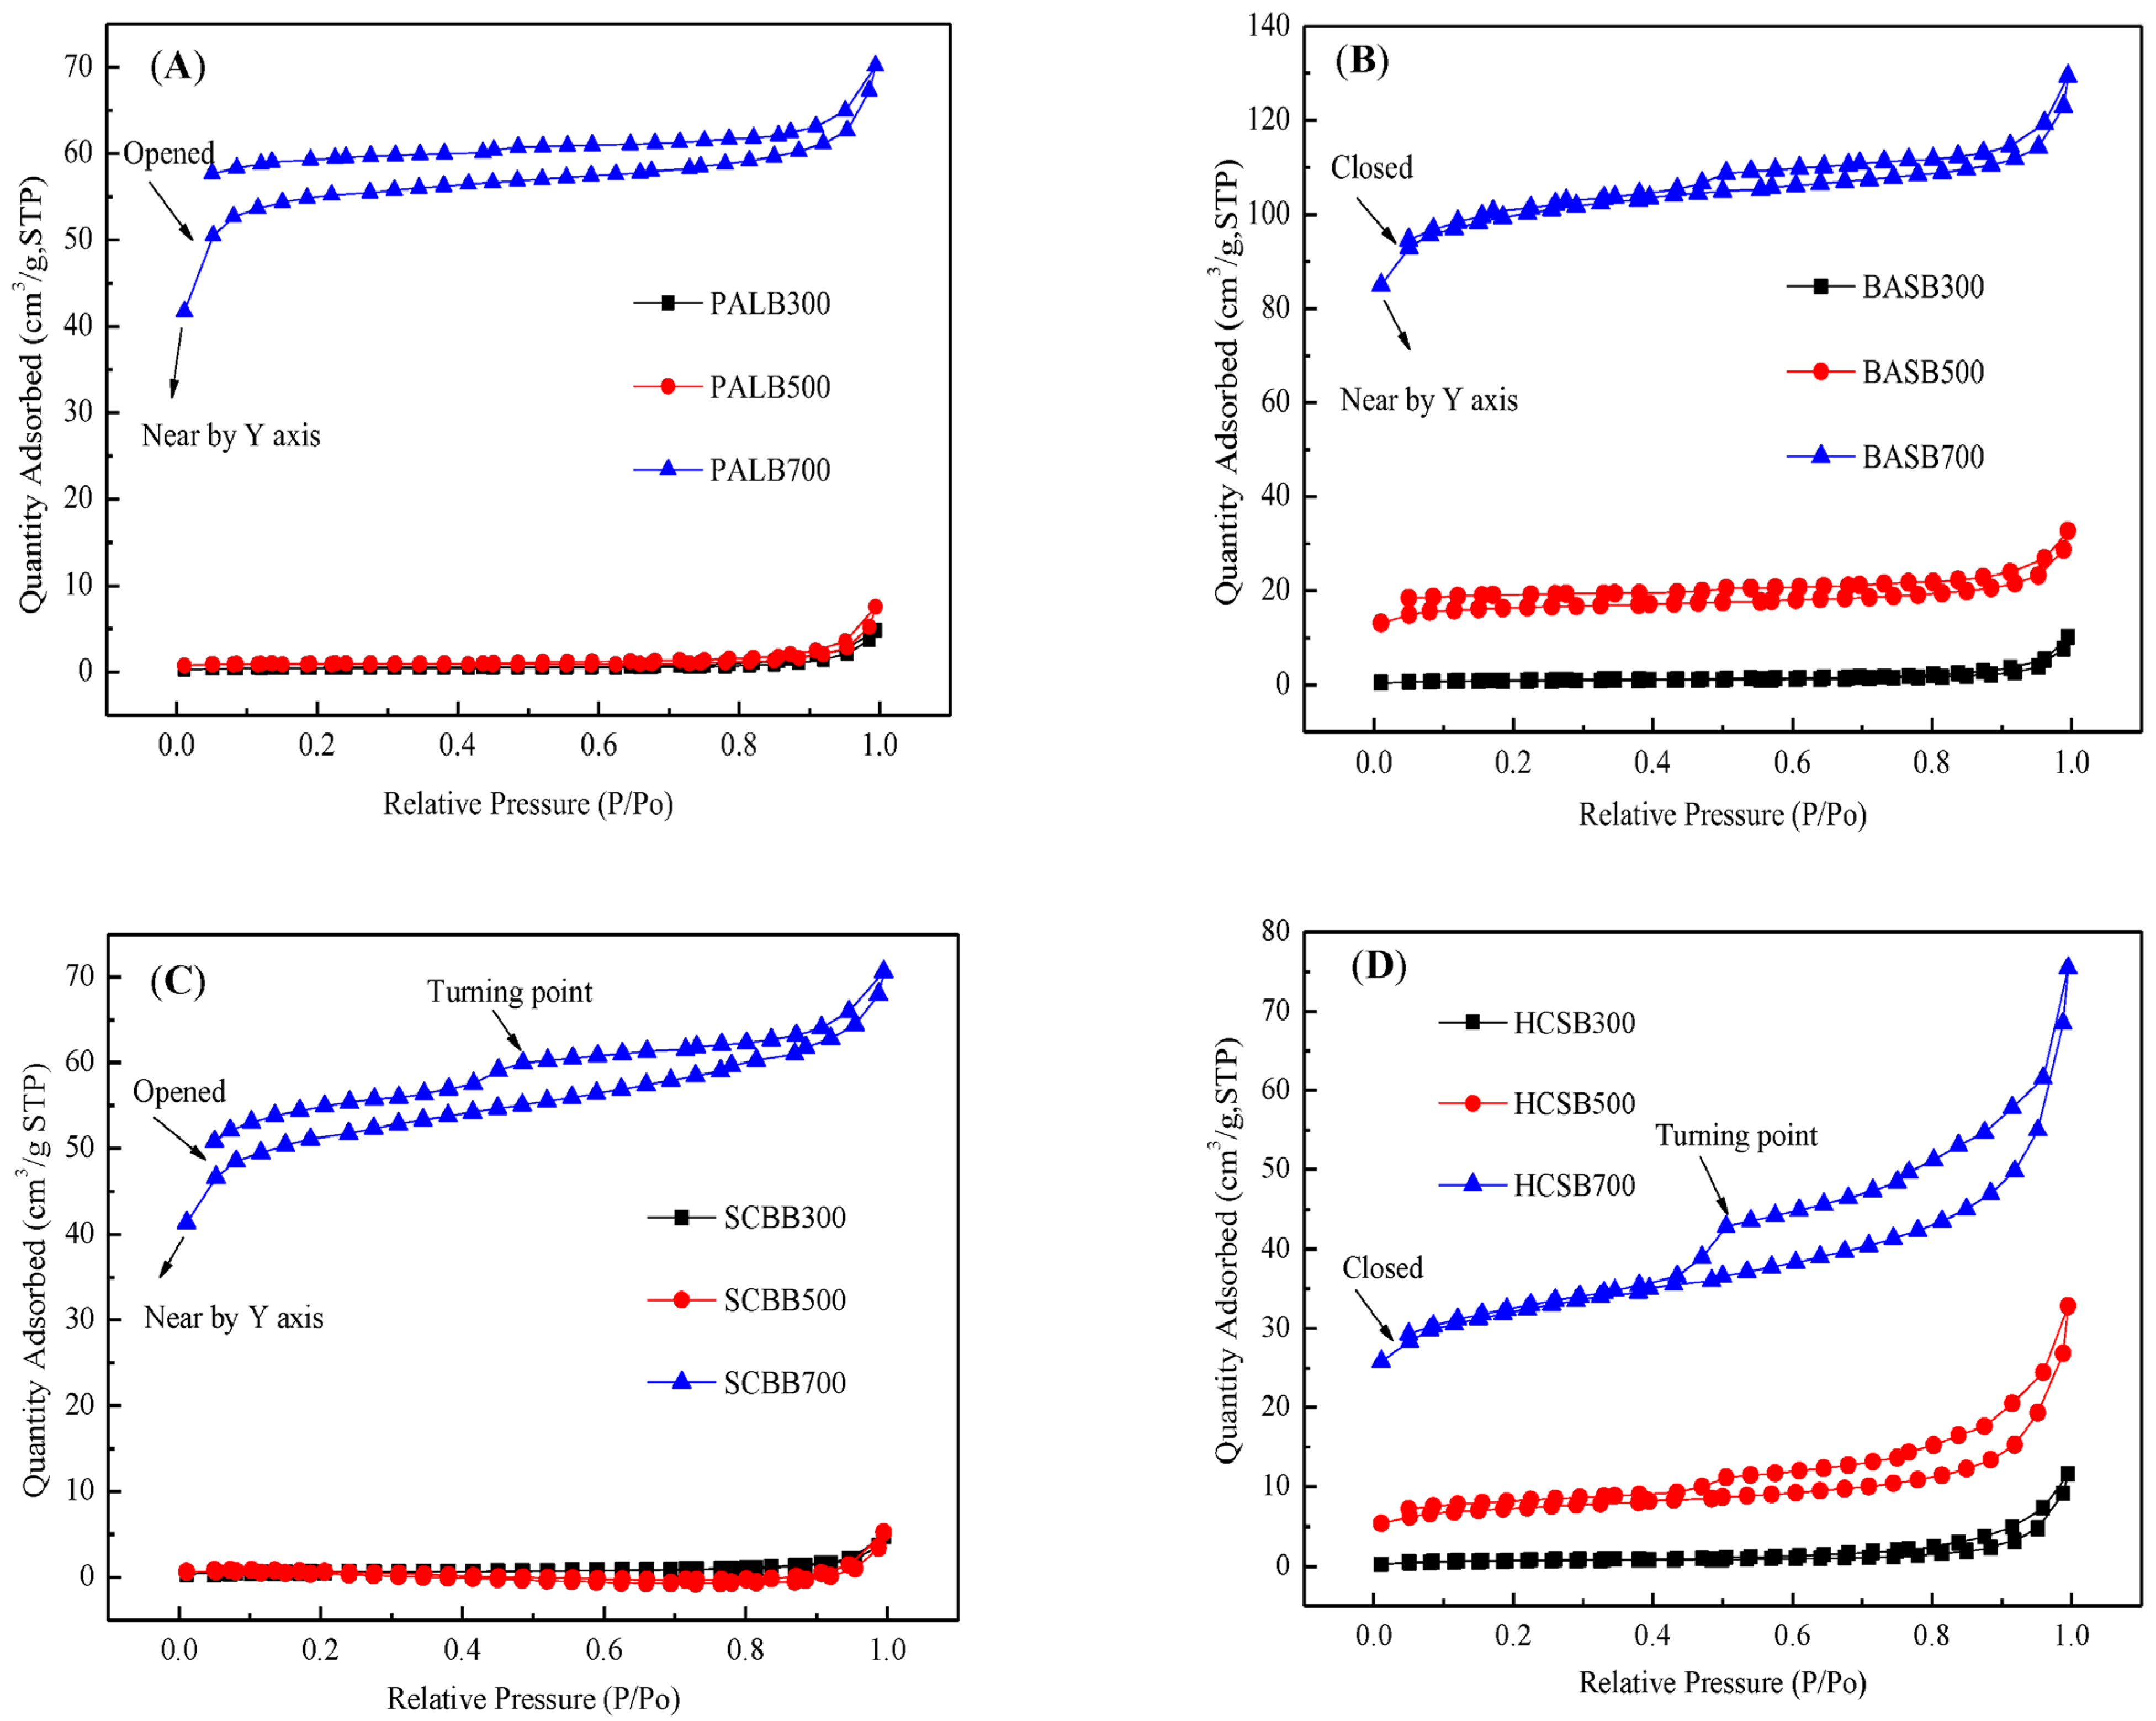
3.2. Analysis of Pore Structure Characteristics of Biochar

For pyrolysis at 500 °C, the surface area of PALB, BASB, SCBB, and HCSB increased from 1.80 to 3.30, 3.26 to 56.92, 2.38 to 2.77 and 2.44 to 24.96 m2 g−1, respectively, compared with pyrolysis at 300 °C (Table 2). In addition, for pyrolysis at 700 °C, the surface area of PALB, BASB, SCBB, and HCSB increased by 65.06, 5.88, 70.18, and 4.79 times, respectively, compared with pyrolysis at 500 °C. In turn, pore volumes exhibited similar change trends as those of the surface areas. Pore sizes also decreased with increasing temperature. Biochar prepared at high temperature contains many micropores and mesopores mainly distributed at ~3 nm (major peak) (Figure S1) owing to the decomposition of lignin in the biochar samples at high temperature. A significant, positive linear regression was observed between pore volumes and specific surface area (Y = 1916.3X − 12.228; R2 = 0.9592, n = 12). At the same time, the linear equation for the regression between pore diameter and specific surface area was Y = −16.3X + 170.066 (R2 = 0.2912, n = 12) (Figure 1). The pyrolysis temperature had different effects on the biochar surface areas through progressive degradation of organic material (cellulose and lignin), which increased considerably with increasing temperature [38,43]. El-Gamal et al. [44] observed that sugarcane biochar had a higher specific surface area (185.6 m2 g−1) than rice husk biochar (154.7 m2 g−1). This indicated that different materials have different surface properties. During the pyrolysis process, the weight loss of hemicellulose mainly happened at 220–315 °C and that of cellulose occurred quickly at 315–400 °C. However, lignin was different, being slow to decompose. Its weight loss happened within a wide temperature range (160–900 °C) [45]. The increases in the surface areas of PALB and SCBB were particularly remarkable, likely due to the feedstock properties (i.e., hemicellulose, cellulose, lignin composition) [44,46]. Thus, at 300 and 500 °C, glycolipids, hemicellulose, and cellulose were mainly decomposed, whereas at 700 °C, lignin was decomposed to the largest extent [47]. These results were in agreement with those obtained by Cao et al. [48], Zhu et al. [42], Wu et al. [49], and Tomczyk et al. [22].
Greater N2 adsorption and desorption by biochar were observed at different pyrolysis temperatures (Figure 2), which indicates that the specific surface areas and pore volumes of biochar prepared at high temperatures are large (Table 2). The N2 adsorption and desorption curves overlapped (except for those of HCSB), which indicates that the micropores were absent or closed at one end when pyrolysis occurred at 300 or 500 °C [50,51]. In contrast, the N2 adsorption and desorption curves were clearly separated, indicating the presence of open cylindrical pores in the biochar, particularly HCSB prepared at 700 °C. However, at relative pressures <0.1, the adsorption curves tended to shift towards the Y axis, indicating that slit-like pores were present when pyrolysis occurred at 700 °C [50]. Further, the turning point of the desorption curves for SCBB700 and HCSB700 indicate the presence of open pores or “inkwell shaped” pores in these biochar samples [52]. The PALB700 and SCBB700 isotherms did not close at low pressures owing to capillary condensation that occurred in some micropores and minor mesopores (1.84–2.08 nm, Table 2) [53].

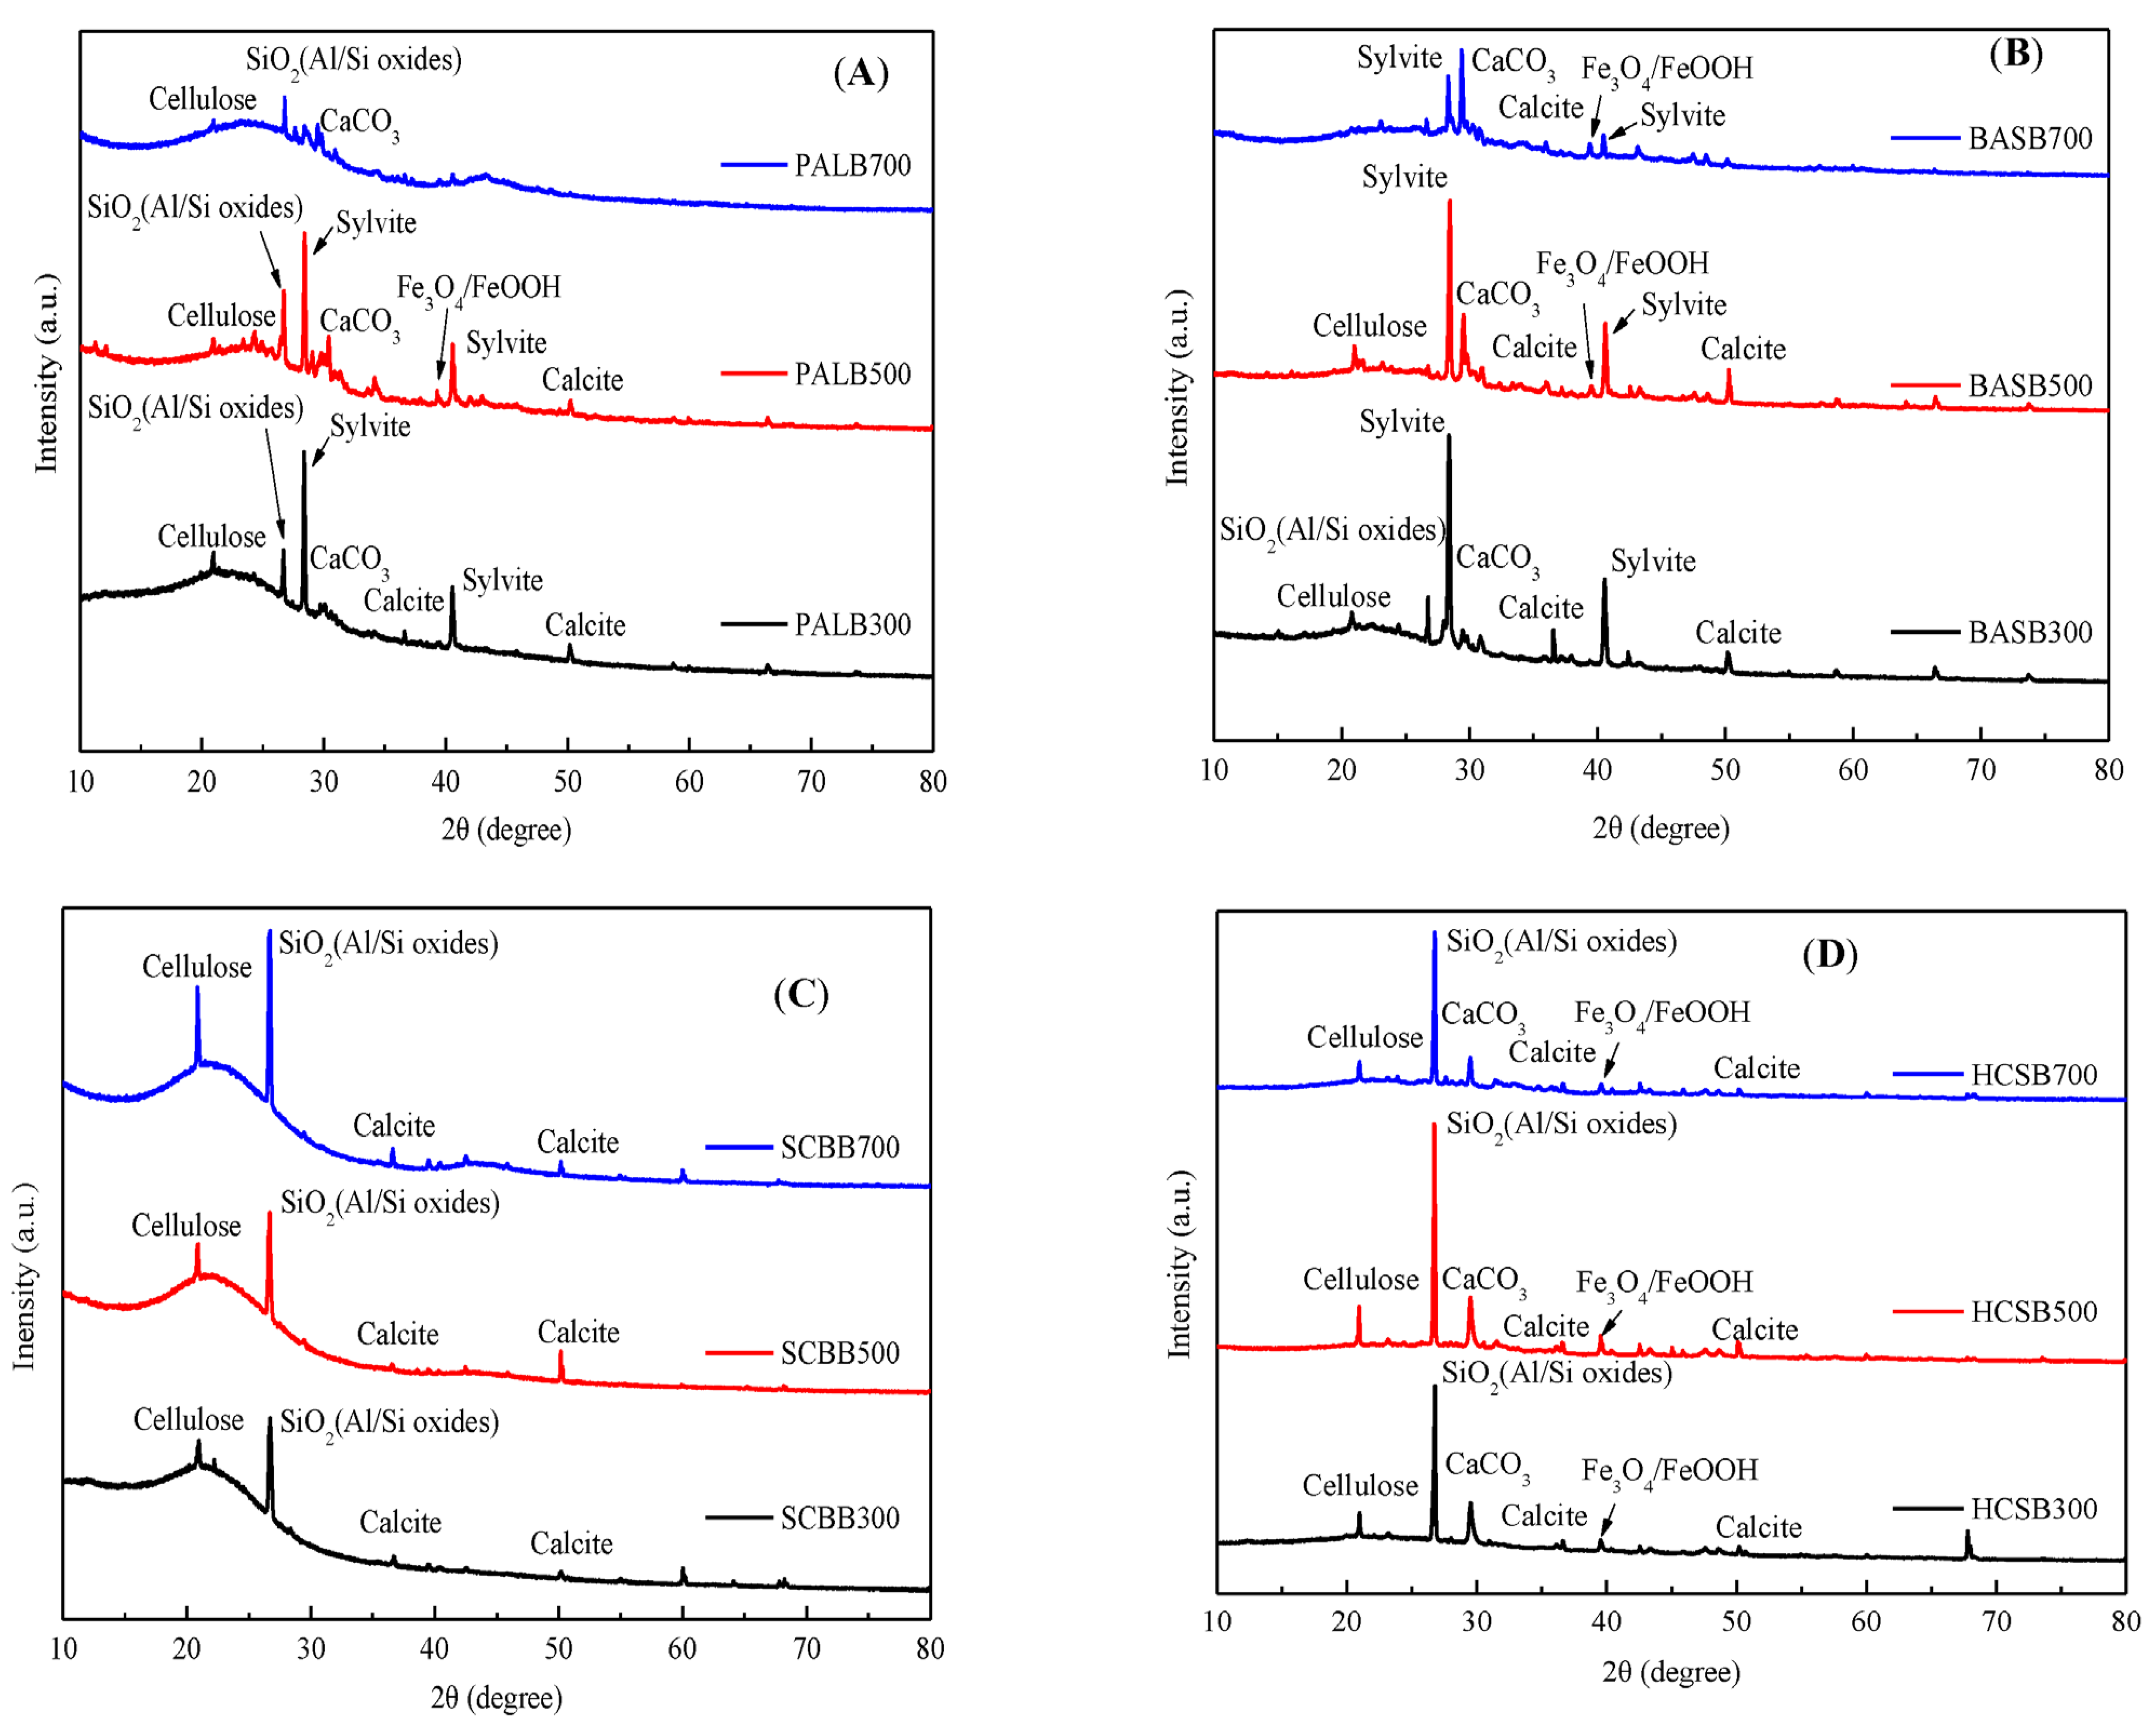
3.3. Crystallographic Structures

XRD analyses were used to determine the presence of different crystalline materials that can influence biochar properties, and thereby its applications. All of the biochar samples exhibited sharp XRD peaks, indicating that the biochar had good crystallinity [54,55]. Inorganic minerals were observed in all biochar samples (Figure 3). In addition, sylvite peaks were present at 28.3° and 40.5° in PALB and BASB. The peaks at 2θ values of 22.6° were a crystallographic plane of cellulose observed in biochar samples except for BASB700 and PALB700. In PALBs and BASBs, the intensity of cellulose decreased with the increasing temperature. The crystallographic plane of cellulose decreased in BASB700 and PALB700, which might because that, under higher temperature, K reacted with glycosidic linkages of cellulose polysaccharide units and changed the cellulose structure [42]. There was a broad hump at 2θ from 15 to 25° which indicated the structure of amorphous and crystalline cellulose [12]. Similar inorganic mineral structures, including those of SiO2 and Al/Si oxides (2θ = 21.0°, 26.7° respectively) were observed in PAL, BAS, SCH and HCS biochar samples. A calcite peak (29.5°, 35.9°) was observed in BASB and HCSB, and the peaks observed at 30.1° and 39.5° in all biochars were signals corresponding to Fe3O4, and FeOOH, respectively, while signals at 36.7° and 50.2° corresponded to Mg and were observed in all biochar samples. The peak observed at 43.3° in BASB corresponds to the crystal structure of graphite. Peaks with the highest intensities were observed at 2θ = 26.7°, related to the presence of quartz compound, especially in SCBBs and HCSBs. This indicated that more SiO2 or Al/Si oxides existed in SCBB and HCSBs [56,57]. Except for the SCBBs, the intensity of the peak in biochars decreases along with the increase in temperature indicating the decomposition of crystal [12]. So, it is found that the sylvite, SiO2 or Al/Si oxides and CaCO3 in PALBs and BASBs were the major predominant crystalline phase. Sylvite could cause cellulose decomposition at high temperature. In SCBBs and HCSBs, cellulose, SiO2 or Al/Si oxides and calcite were observed. Cellulose in SCBBs existed in crystallized and amorphous forms.

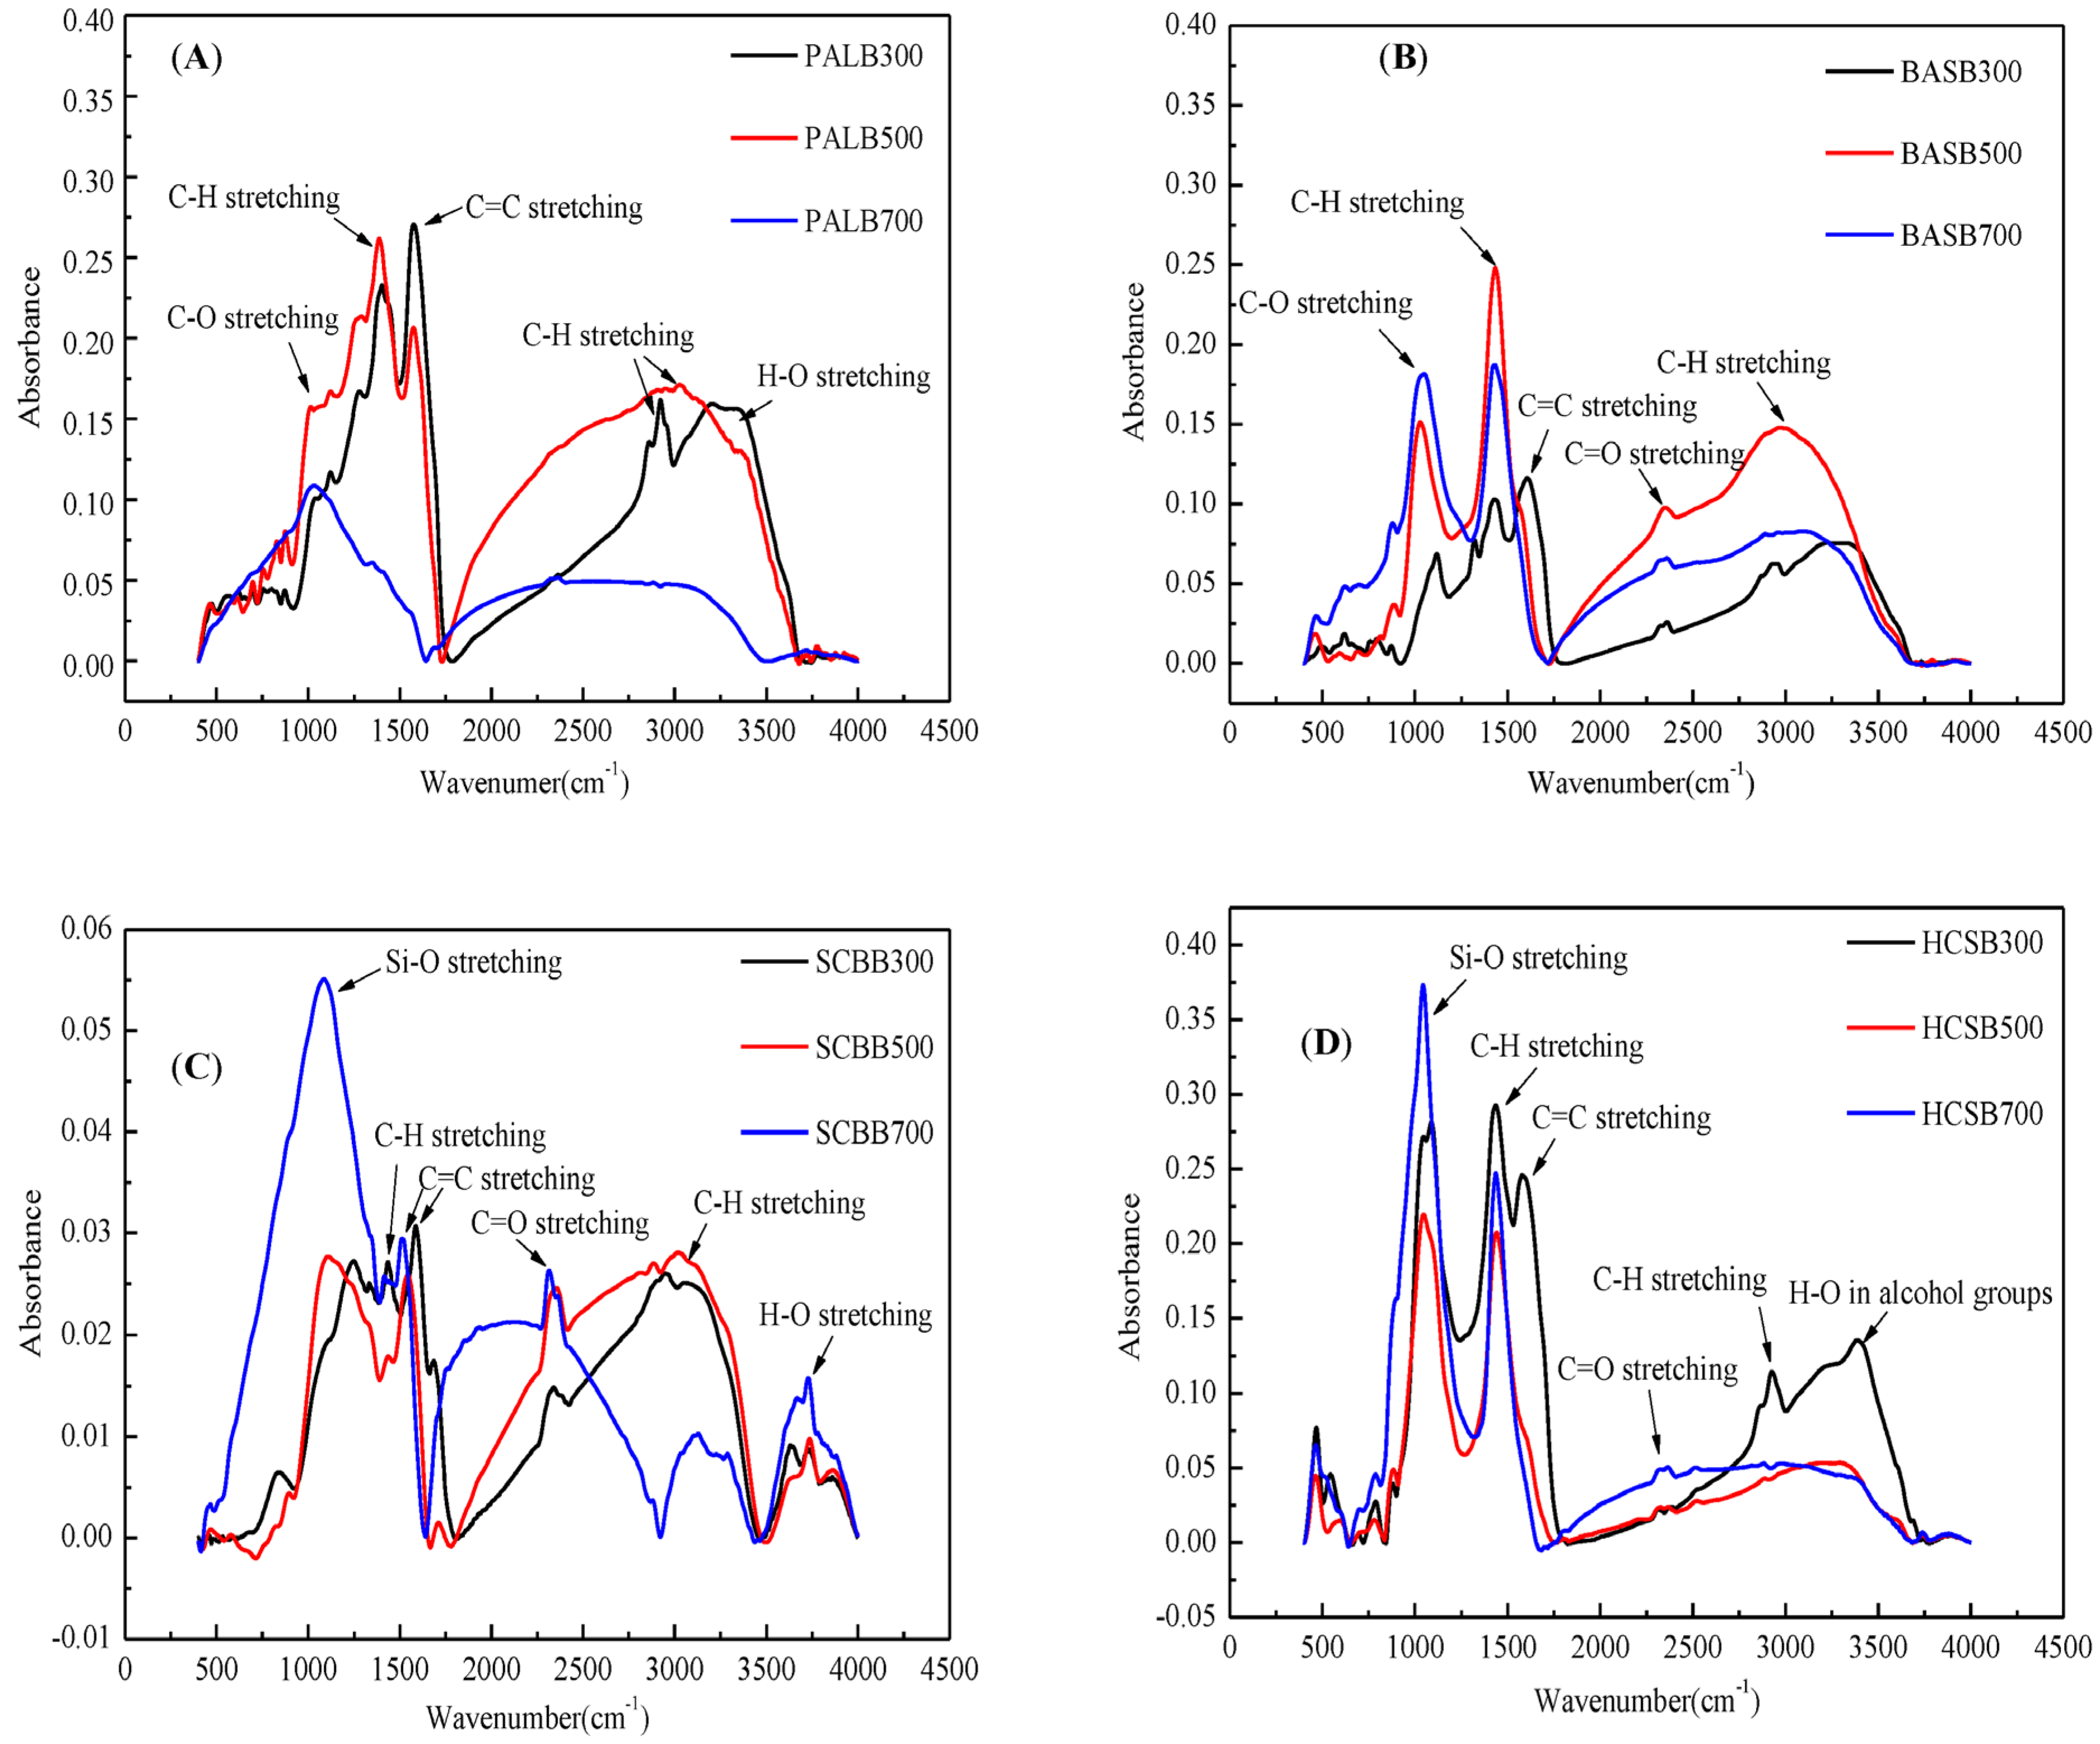
3.4. FT-IR Spectroscopy Analysis

The FT-IR analyses were used to verify the effect of pyrolysis temperature on the surface functional groups of the experimental biochar samples (Figure 4). Six distinct regions were observed, corresponding to: (1) Si–O stretching at 1038 cm−1; (2) C–O stretching at 1085–1116 cm−1, representing cellulose and hemicellulose compounds; (3) C–H deformation at 1386–1440 cm−1 and 2922–3331 cm−1, representing hemicellulose and cellulose; (4) C=C stretching at 1512–1604 cm−1, representing the presence of hemicellulose; (5) C=O stretching at 2314–2360 cm−1 in ketene groups; and (6) H–O stretching at 3201–3718 cm−1 in alcohol groups and other organic structures. The functional groups in BASB and SCBB were relatively stable, and did not change greatly with the increase of temperature. The number of functional groups in BASB and SCBB is more than that in PALB and HCSB. The functional groups of Si–O stretching increased with the increasing of reaction temperature, except for PALB.
Several peaks also disappeared or became substantially smaller when pyrolysis was performed at high temperatures, such as the C–H deformation in hemicellulose and cellulose, C=C stretching in hemicellulose, and H–O in alcohol groups in PALB, indicating the formation and subsequent disappearance of transformation products [37]. The functional groups of C–H stretching, C=O stretching in BASB strengthened at 500 °C. At the same time, these functional groups decreased as temperature rose to 700 °C. In addition, most of the functional groups in HCSB, including C=C stretching in hemicellulose, C–H bond stretching in aliphatic formation, and H–O in alcohol groups disappeared when the pyrolysis temperature was 500 or 700 °C. However, the contents of H– and O– containing functional groups were lower owing to dehydration and deoxygenation of the biomass [58,59,60].

3.5. Application of Biochars on Acidic Soils

Chlorophylls are abundant in plant for photosynthesis, which can indicate plant growth. Soil acidification inhibits maize growth. The biochars significantly increased the plant height, fresh weight and chlorophyll content of maize [61,62]. The fresh weight, height and chlorophyll content of the plant under application of biochar obtained at 500 °C was significantly better than that of biochars prepared at 300 and 700 °C (Table 3). Two-way ANOVA showed that biochar and temperature had very significant effects on plant height, fresh weight, chlorophyll content, soil pH and electrical conductivity (p < 0.001). The interaction between biochar and temperature significantly affected the growth of maize plants (p < 0.05), and significantly affected soil PH and conductivity (p < 0.001). Maize growth with application of SCBB and HCSB was better than application of PALB and BASB. This may be that PALB and BASB had higher pH than SCBB and HCSB (as shown in Table 1). As shown in Table 3, the pH and EC of soil with PALB and BASB application ranged from 6.90 to 7.37 and 0.67 to 0.95 ms/cm, which were not optimize to the growth of maize [63]. However, those of SCBB and HCSB were 5.97–6.74 and 0.23–0.45 ms/cm. Kammann et al. [64] observed that quinoa growth reduced with application rates from 6.7% to 13.3%. Sun et al. [62] found that maize straw biochar (pH 8.79) application at rates from 1% to 5% caused growth and physiological changes of maize plants. In our study, the biochar application rate was 3%, which are consistent with the results of Sun et al. [62].

4. Conclusions

Pyrolysis temperature has a great impact on the physicochemical properties of biochars derived from tropical agricultural waste (PAL, BAS, SCB) and horticultural substrate (HCS). The application of biochars obtained at 300 °C and 500 °C can significantly promote maize growth and increase the soil pH. The biochar surface areas increased with the increasing pyrolysis temperature from 1.80–3.26 to 119.45–334.67 m2 g−1. More inorganic minerals such as SiO2(Al/Si oxides), CaCO3, Sylvite, Calcite and Fe3O4/FeOOH were observed in PALB, BASB and HCSB. In SCBB, SiO2(Al/Si oxides) was the main compound, and small amounts of calcite were also found. PALB and BASB have higher potential value as acidic soil conditioners, controlled-release coating fertilizer materials or substrate fermentation material. Considering the energy saving and the efficiency of tropical agricultural waste resources, 300 °C is the recommended temperature.

Supplementary Materials

The following supporting information can be downloaded at: https://www.mdpi.com/article/10.3390/agronomy13030921/s1, Figure S1: Distribution of pores; Table S1: Inorganic elemental contents of biochar prepared at different temperatures.

Author Contributions

S.S. and P.C.: methodology, formal analysis, investigation, data curation, writing—original draft, visualization. C.W. and S.L.: investigation, data curation, visualization. C.Z., Z.H., Y.L.: investigation, methodology, formal analysis. P.L.: Validation, formal analysis, data curation, writing—review and editing, visualization, supervision, project administration, funding acquisition. Z.Y.: Validation, formal analysis, writing-review and editing. All authors have read and agreed to the published version of the manuscript.

Funding

This research was funded by Hainan Provincial Natural Science Foundation of China (320QN324, 322MS119, 320MS090, 421MS078) and the Provincial Natural Science Foundation of Shandong (ZR2021QD036).

Institutional Review Board Statement

Not applicable.

Informed Consent Statement

Not applicable.

Data Availability Statement

Not applicable.

Acknowledgments

The authors are grateful to Hainan Provincial Natural Science Foundation of China (320QN324, 322MS119, 320MS090, 421MS078) and the Provincial Natural Science Foundation of Shandong (ZR2021QD036) which supported this work.

Conflicts of Interest

The authors declare that they have no known competing financial interests or personal relationships that could have appeared to influence the work reported in this paper.

References

  1. Williams, P.T.; Nugranad, N. Comparison of products from the pyrolysis and catalytic pyrolysis of rice husks. Energy 2000, 25, 493–513. [Google Scholar] [CrossRef]
  2. Ali, M.M.; Hashim, N.; Aziz, S.A.; Lasekan, O.O. Pineapple (Ananas comosus): A comprehensive review of nutritional values, volatile compounds, health benefits, and potential food products. Food Res. Int. 2020, 137, 109675. [Google Scholar] [CrossRef]
  3. Garba, M.U.; Gambo, S.U.; Musa, U.; Tauheed, K.; Alhassan, M.; Adeniyi, O.D. Impact of torrefaction on fuel property of tropical biomass feedstocks. Biofuels 2018, 9, 369–377. [Google Scholar] [CrossRef]
  4. Biswas, B.; Pandey, N.; Bisht, Y.; Singh, R.; Kumar, J.; Bhaskar, T. Pyrolysis of agricultural biomass residues: Comparative study of corn cob, wheat straw, rice straw and rice husk. Bioresour. Technol. 2017, 237, 57–63. [Google Scholar] [CrossRef] [PubMed]
  5. Avcıoğlu, A.O.; Dayıoğlu, M.A.; Türker, U. Assessment of the energy potential of agricultural biomass residues in Turkey. Renew. Energy 2019, 138, 610–619. [Google Scholar] [CrossRef]
  6. Caipang, C.M.A.; Mabuhay-Omar, J.; Gonzales-Plasus, M.M. Plant and fruit waste products as phytogenic feed additives in aquaculture. Aquac. Aquar. Conserv. Legis. 2019, 12, 261–268. Available online: http://www.bioflux.com.ro/aacl (accessed on 1 January 2019).
  7. Chai, Y.H.; Yusup, S.; Kadir, W.N.A.; Wong, C.Y.; Rosli, S.S.; Ruslan, M.S.H.; Chin, B.L.F.; Yiin, C.L. Valorization of tropical biomass waste by supercritical fluid extraction technology. Sustainability 2020, 13, 233. [Google Scholar] [CrossRef]
  8. Kamal Baharin, N.S.; Koesoemadinata, V.C.; Nakamura, S.; Azman, N.F.; Muhammad Yuzir, M.A.; Md Akhir, F.N.; Iwamoto, K.; Yahya, W.J.; Othman, N.A.; Hara, H. Production of Bio-Coke from spent mushroom substrate for a sustainable solid fuel. Biomass Convers. Biorefinery 2020, 12, 4095–4104. [Google Scholar] [CrossRef]
  9. Marques, O.F.C.; de Sales, E.C.J.; Monção, F.P.; Silva, A.F.; Rigueira, J.P.S.; de Assis Pires, D.A.; de Almeida Rifino, L.D.; Durães, H.F. Potential for using dehydrated banana peel as an additive in grass silage. Cad. Ciências Agrárias 2021, 13, 1–8. [Google Scholar] [CrossRef]
  10. Novak, J.; Ro, K.; Ok, Y.S.; Sigua, G.; Spokas, K.; Uchimiya, S.; Bolan, N. Biohars multifunctional role as a novel technology in the agricultural, environmental, and industrial sectors. Chemosphere 2016, 142, 1–3. [Google Scholar] [CrossRef]
  11. Campos, P.; Miller, A.Z.; Knicker, H.; Costa-Pereira, M.F.; Merino, A.; de la Rosa, J.M. Chemical, physical and morphological properties of biochars produced from agricultural residues: Implications for their use as soil amendment. Waste Manag. 2020, 105, 256–267. [Google Scholar] [CrossRef]
  12. Pariyar, P.; Kumari, K.; Jain, M.K.; Jadhao, P.S. Evaluation of change in biochar properties derived from different feedstock and pyrolysis temperature for environmental and agricultural application. Sci. Total Environ. 2020, 713, 136433. [Google Scholar] [CrossRef]
  13. Huang, M.; Li, Z.; Wen, J.; Ding, X.; Zhou, M.; Cai, C.; Shen, F. Molecular insights into the effects of pyrolysis temperature on composition and copper binding properties of biochar-derived dissolved organic matter. J. Hazard. Mater. 2021, 410, 124537. [Google Scholar] [CrossRef]
  14. Irfan, M.; Chen, Q.; Yue, Y.; Pang, R.; Lin, Q.; Zhao, X.; Chen, H. Co-production of biochar, bio-oil and syngas from halophyte grass (Achnatherum splendens L.) under three different pyrolysis temperatures. Bioresour. Technol. 2016, 211, 457–463. [Google Scholar] [CrossRef]
  15. Xing, X.; Fan, F.; Jiang, W. Characteristics of biochar pellets from corn straw under different pyrolysis temperatures. R. Soc. Open Sci. 2018, 5, 172346. [Google Scholar] [CrossRef] [Green Version]
  16. Chen, X.; Lin, Q.; Rizwan, M.; Zhao, X.; Li, G. Steam explosion of crop straws improves the characteristics of biochar as a soil amendment. J. Integr. Agric. 2019, 18, 1486–1495. [Google Scholar] [CrossRef]
  17. Hassan, M.; Liu, Y.; Naidu, R.; Parikh, S.J.; Du, J.; Qi, F.; Willett, I.R. Influences of feedstock sources and pyrolysis temperature on the properties of biochar and functionality as adsorbents: A meta-analysis. Sci. Total Environ. 2020, 744, 140714. [Google Scholar] [CrossRef]
  18. Muhammad, J.M.; Abdul, R.M. Wheat straw optimization via its efficient pretreatment for improved biogas production. Civ. Eng. J. 2020, 6, 1056–1063. [Google Scholar] [CrossRef]
  19. Rodriguez, J.A.; Lustosa Filho, J.F.; Melo, L.C.A.; de Assis, I.R.; de Oliveira, T.S. Influence of pyrolysis temperature and feedstock on the properties of biochars produced from agricultural and industrial wastes. J. Anal. Appl. Pyrolysis 2020, 149, 104839. [Google Scholar] [CrossRef]
  20. Stefaniuk, M.; Oleszczuk, P. Characterization of biochars produced from residues from biogas production. J. Anal. Appl. Pyrolysis 2015, 115, 157–165. [Google Scholar] [CrossRef]
  21. Domingues, R.R.; Trugilho, P.F.; Silva, C.A.; de Melo, I.C.N.A.; Melo, L.C.A.; Magriotis, Z.M.; Sa´nchez-Monedero, M.A. Properties of biochar derived from wood and high-nutrient biomasses with the aim of agronomic and environmental benefits. PLoS ONE 2017, 12, 0176884. [Google Scholar] [CrossRef] [PubMed] [Green Version]
  22. Tomczyk, A.; Sokołowska, Z.; Boguta, P. Biochar physicochemical properties: Pyrolysis temperature and feedstock kind effects. Rev. Environ. Sci. Bio/Technol. 2020, 19, 191–215. [Google Scholar] [CrossRef] [Green Version]
  23. Yuan, J.H.; Xu, R.K.; Zhang, H. The forms of alkalis in the biochar produced from crop residues at different temperatures. Bioresour. Technol. 2011, 102, 3488–3497. [Google Scholar] [CrossRef] [PubMed]
  24. Ding, W.; Dong, X.; Ime, I.M.; Gao, B.; Ma, L.Q. Pyrolytic temperatures impact lead sorption mechanisms by bagasse biochars. Chemosphere 2014, 105, 68–74. [Google Scholar] [CrossRef]
  25. Ronsse, F.; van Hecke, S.; Dickinson, D.; Prins, W. Production and characterization of slow pyrolysis biochar: Influence of feedstock type and pyrolysis conditions. Glob Chang. Biol Bioenergy 2012, 5, 104–115. [Google Scholar] [CrossRef]
  26. Spokas, K.A.; Cantrell, K.B.; Novak, J.M.; Archer, D.W.; Ippolito, J.A.; Collins, H.P.; Boateng, A.A.; Lima, I.M.; Lamb, M.C.; McAloon, A.J.; et al. Biochar: A synthesis of its agronomic impact beyond carbon sequestration. J. Environ. Qual. 2012, 41, 973–989. [Google Scholar] [CrossRef] [Green Version]
  27. Rafiq, M.K.; Bachmann, R.T.; Rafiq, M.T.; Shang, Z.; Joseph, S.; Long, R. Influence of pyrolysis temperature on physicochemical properties of corn stover (Zea mays L) biochar and feasibility for carbon capture and energy balance. PLoS ONE 2016, 11, 0156894. [Google Scholar] [CrossRef] [Green Version]
  28. Zama, E.F.; Zhu, Y.G.; Reid, B.J.; Sun, G.X. The role of biochar properties in i-nfluencing the sorption and desorption of Pb (II), Cd (II), and As(III) in aqueous solution. J. Clean. Prod. 2017, 148, 127–136. [Google Scholar] [CrossRef] [Green Version]
  29. Zhang, X.X.; Zhang, P.Z.; Yuan, X.R.; Li, Y.F.; Han, L.J. Effect of pyrolysis temperature and correlation analysis on the yield and physicochemical properties of crop residue biochar. Bioresour. Technol. 2020, 296, 122318. [Google Scholar] [CrossRef]
  30. Swapna, S.S.; Virendra, K.V.; Ram, C.; Kumar, H. Production and characterization of biochar produced from slow pyrolysis of pigeon pea stalk and bamboo. Clean. Eng. Technol. 2021, 3, 100101. [Google Scholar] [CrossRef]
  31. Zhang, A.; Cheng, G.; Hussain, Q.; Zhang, M.; Feng, H.; Dyck, M.; Wang, X. Contrasting effects of straw and straw-derived biochar application on net global warming potential in the Loess Plateau of China. Field Crop Res. 2017, 205, 45–54. [Google Scholar] [CrossRef]
  32. McHenry, M.P. Agricultural bio-char production, renewable energy generate-on and farm carbon sequestration in Western Australia: Certainty, uncertainty and risk. Agric. Ecosyst. Environ. 2009, 129, 1–7. [Google Scholar] [CrossRef] [Green Version]
  33. Palamanit, A.; Khongphakdi, P.; Tirawanichakul, Y.; Phusunti, N. Investigation of yields and qualities of pyrolysis products obtained from oil palm biomass using an agitated bed pyrolysis reactor. Biofuel Res. J. 2019, 6, 1065. [Google Scholar] [CrossRef] [Green Version]
  34. Ahmed, A.; Bakar, M.S.A.; Hamdani, R.; Park, Y.K.; Lam, S.S.; Sukri, R.S.; Hussain, M.; Majeed, K.; Phusunti, N.; Jamil, F.; et al. Valorization of underutilized waste biomass from invasive species to produce biochar for energy and other value-added applications. Environ. Res. 2020, 186, 109596. [Google Scholar] [CrossRef]
  35. Claoston, N.; Samsuri, A.W.; Ahmad Husni, M.H.; Mohd Amran, M.S. Effects of pyrolysis temperature on the physicochemical properties of empty fruit bunch and rice husk biochars. Waste Manag. Res. 2014, 32, 331–339. [Google Scholar] [CrossRef]
  36. Antal Jr, M.J.; Grønli, M. The art, science, and technology of charcoal production. Ind. Eng. Chem. Res. 2003, 42, 1619–1640. [Google Scholar] [CrossRef]
  37. Cantrell, K.B.; Hunt, P.G.; Uchimiya, M.; Novak, J.M.; Ro, K.S. Impact of pyrolysis temperature and manure source on physicochemical characteristics of biochar. Bioresour. Technol. 2012, 107, 419–428. [Google Scholar] [CrossRef]
  38. Zhao, S.X.; Na, T.; Wang, X.D. Effect of temperature on the structural and physicochemical properties of biochar with apple tree branches as feedstock material. Energies 2017, 10, 1293. [Google Scholar] [CrossRef] [Green Version]
  39. Antonangelo, J.A.; Zhang, H.; Sun, X.; Kumar, A. Physicochemical properties and morphology of biochars as affected by feedstock sources and pyrolysis temperatures. Biochar 2019, 1, 12. [Google Scholar] [CrossRef] [Green Version]
  40. Chia, C.H.; Gong, B.; Joseph, S.D.; Marjo, C.E.; Munroe, P.; Rich, A.M. Imaging of mineral-enriched biochar by FT-IR, Raman and SEM–EDX. VibSpectrosc 2012, 62, 248–257. [Google Scholar] [CrossRef]
  41. Saletnik, B.; Bajcar, M.; Zaguła, G.; Czernicka, M.; Puchalski, C. Impact of the biomass pyrolysis parameters on the quality of biocarbon obtained from rape straw, rye straw and willow chips. Econtechmod: Int. Q. J. Econ. Technol. Model. Process. 2016, 5, 129–134. [Google Scholar]
  42. Zhu, L.; Zhao, N.; Tong, L.; Lv, Y. Structural and adsorption characteristics of potassium carbonate activated biochar. RSC Adv. 2018, 8, 21012–21019. [Google Scholar] [CrossRef] [PubMed] [Green Version]
  43. Li, X.; Shen, Q.; Zhang, D.; Mei, X.; Ran, W.; Xu, Y.; Yu, G.; Motta, A. Function-al groups determine biochar properties (pH and EC) as studied by two-dimensional 13C NMR correlation spectroscopy. PLoS ONE 2013, 8, e65949. [Google Scholar] [CrossRef] [Green Version]
  44. El-Gamal, E.; Saleh, M.; Elsokkary, I.; Rashad, M.; Abd El-Latif, M.M. Comparison between properties of biochar produced by traditional and controlled pyrolysis. Alex. Sci. Exch. J. 2017, 38, 413–424. [Google Scholar]
  45. Yang, H.; Yan, R.; Chen, H.; Lee, D.H.; Zheng, C. Characteristics of hemicellu-lose, cellulose and lignin pyrolysis. Fuel 2007, 86, 1787–1788. [Google Scholar] [CrossRef]
  46. Rauber, D.; Dier, T.K.F.; Volmer, D.A.; Hempelmann, R. Electrochemical lignin degradation in ionic liquids on ternary mixed metal electrodes. Z. Phys. Chem. 2018, 232, 189–208. [Google Scholar] [CrossRef]
  47. Cárdenas-Aguiar, E.; Gascó, G.; Paz-Ferreiro, J.; Me´ndez, A. The effect of biochar and compost from urban organic waste on plant biomass and properties of an artificially copper polluted soil. Int. Biodeterior Biodegrad. 2017, 124, 223–232. [Google Scholar] [CrossRef] [Green Version]
  48. Cao, T.; Chen, F.W.; Meng, J. Influence of pyrolysis temperature and residence time on available nutrients for biochars derived from various biomass. Energy Sources Part A Recovery Util. Environ. Eff. 2018, 40, 413–419. [Google Scholar] [CrossRef]
  49. Wu, Q.; Xian, Y.; He, Z.; Zhang, Q.; Wu, J.; Yang, G.; Zhang, X.; Qi, H.; Ma, J.; Xiao, Y.; et al. Adsorption characteristics of Pb (II) using biochar derived from spent mushroom substrate. Sci. Rep. 2019, 9, 15999. [Google Scholar] [CrossRef] [Green Version]
  50. Kuila, U.; Prasad, M. Specific surface area and pore-size distribution in clays and shales. Geophys. Prospect. 2013, 61, 341–362. [Google Scholar] [CrossRef]
  51. Zhang, J.; Wang, Q. Sustainable mechanisms of biochar derived from brewers’ spent grain and sewage sludge for ammonia–nitrogen capture. J. Clean. Prod. 2016, 112, 3927–3934. [Google Scholar] [CrossRef]
  52. Zhang, Z.G. Study on Characteristics of adsorption/desorption-induced deformation and its influencing factors. ChongQing Univ. 2015. (In Chinese) [Google Scholar]
  53. Xia, D.; Tan, F.; Zhang, C.; Jiang, X.; Chen, Z.; Li, H.; Zheng, Y.; Li, Q.; Wang, Y. ZnCl2-activated biochar from biogas residue facilitates aqueous As(III) removal. Appl. Surf. Sci. 2016, 377, 361–369. [Google Scholar] [CrossRef]
  54. Ma, Q.; Song, W.; Wang, R.; Zou, J.; Yang, R.; Zhang, S. Physicochemical properties of biochar derived from anaerobically digested dairy manure. Waste Manag. 2018, 79, 729–734. [Google Scholar] [CrossRef]
  55. Fancello, D.; Scalco, J.; Medas, D.; Rodeghero, E.; Martucci, A.; Meneghini, C.; de Giudici, G. XRD-thermal combined analyses: An approach to evaluate the potential of phytoremediation, phytomining, and biochar production. Int. J. Environ. Res. Public Health 2019, 16, 1976. [Google Scholar] [CrossRef] [Green Version]
  56. Zhou, D.; Liu, D.; Gao, F.; Li, M.; Luo, X. Effects of biochar-derived sewage sludge on heavy metal adsorption and immobilization in soils. Int. J. Environ. Res. Public Health 2017, 14, 681. [Google Scholar] [CrossRef]
  57. Santhosh, C.; Daneshvar, E.; Tripathi, K.M.; Baltrnas, P.; Bhatnagar, A. Synthesis and characterization of magnetic biochar adsorbents for the removal of Cr(VI) and Acid orange 7 dye from aqueous solution. Environ. Sci. Pollut. Res. 2020, 27, 32874–32887. [Google Scholar] [CrossRef]
  58. Reza, M.S.; Afroze, S.; Bakar, M.S.; Saidur, R.; Aslfattahi, N.; Taweekun, J.; Azad, A.K. Biochar characterization of invasive Pennisetum purpureum grass: Effect of pyrolysis temperature. Biochar 2020, 2, 3. [Google Scholar] [CrossRef]
  59. Uchimiya, M.; Chang, S.; Klasson, K.T. Screening biochars for heavy metal retention in soil: Role of oxygen functional groups. J. Hazard Mater 2011, 190, 432–441. [Google Scholar] [CrossRef]
  60. Ahmad, M.; Lee, S.S.; Lim, J.E.; Lee, S.E.; Cho, J.S.; Moon, D.H.; Hashimoto, Y.; Ok, Y.S. Speciation and phytoavailability of lead and antimony in a small arms range soil amended with mussel shell, cow bone and biochar: EXAFS spectroscopy and chemical extractions. Chemosphere 2014, 95, 433–441. [Google Scholar] [CrossRef]
  61. Aghajani, S.D.; Alavifazel, M.; Nurmohammadi, G.; Ardakani, M.R.; Sarajughi, M. Soil respiration, root traits and dry matter yield of sorghum (Sorghum bicolor L.) as affected by biochar application under different cropping patterns and irrigation method. Int. Agrophysics 2020, 34, 4. [Google Scholar] [CrossRef]
  62. Sun, C.X.; Chen, X.; Cao, M.; Zhang, Y. Growth and metabolic responses of maize roots to straw biochar application at different rates. Plant Soil 2017, 416, 487–502. [Google Scholar] [CrossRef]
  63. Zhang, J.; Wang, S.; Song, S.; Xu, F.; Pan, Y.; Wang, H. Transcriptomic and proteomic analyses reveal new insight into chlorophyll synthesis and chloroplast structure of maize leaves under zinc deficiency stress. J. Proteom. 2019, 199, 123–134. [Google Scholar] [CrossRef] [PubMed]
  64. Kammann, C.I.; Linsel, S.; Göessling, J.W.; Koyro, H.W. Influence of biochar on drought tolerance of Chenopodium quinoa willd and on soil–plant relations. Plant Soil 2011, 345, 195–210. [Google Scholar] [CrossRef]
Figure 1. Linear regression of pore volume vs. surface area (A), and pore size vs. surface area (B).
Agronomy 13 00921 g001
Figure 2. N2 adsorption-desorption isotherms of biochars obtained from troptical crop wastes. (A) PAL biochar, (B) BAS biochar, (C) SCB biochar, (D) HCS biochar.
Agronomy 13 00921 g002
Figure 3. XRD characterization of PAL biochar (A), BAS biochar (B), SCB biochar (C), HCS biochar (D).
Agronomy 13 00921 g003
Figure 4. FT−IR spectra of PAL biochar (A), BAS biochar (B), SCB biochar (C), HCS biochar (D).
Agronomy 13 00921 g004
Table 1. Chemical characteristics of biochar prepared at different temperatures.
HOCNO/CH/C(O+N)/CpHYieldAsh
%%
PALB3004.13 ± 0.03 a19.72 ± 0.08 a58.85 ± 0.36 c1.11 ± 0.01 a0.34 ± 0.02 a0.07 ± 0.01 a0.35 ± 0.01 a9.94 ± 0.04 a36.888.50 ± 0.01 b
PALB5002.77 ± 0.01 b15.34 ± 0.22 b60.79 ± 0.59 a0.91 ± 0.01 b0.25 ± 0.01 b0.05 ± 0.02 b0.27 ± 0.01 b9.69 ± 0.01 c33.009.10 ± 0.02 a
PALB7001.98 ± 0.01 c15.01 ± 0.46 b60.12 ± 0.01 b0.61 ± 0.01 c0.25 ± 0.01 b0.03 ± 0.01 c0.26 ± 0.01 b9.84 ± 0.05 b26.469.30 ± 0.03 a
BASB3003.40 ± 0.01 a20.69 ± 0.06 b51.39 ± 0.16 a0.65 ± 0.01 a0.40 ± 0.01 b0.07 ± 0.01 a0.42 ± 0.02 b10.30 ± 0.05 a34.678.10 ± 0.03 b
BASB5002.00 ± 0.02 b19.39 ± 0.28 c47.61 ± 0.59 b0.41 ± 0.01 b0.41 ± 0.02 b0.04 ± 0.01 b0.42 ± 0.01 b10.26 ± 0.04 a27.849.20 ± 0.01 a
BASB7001.98 ± 0.02 b22.60 ± 0.12 a41.89 ± 0.27 c0.37 ± 0.01 c0.54 ± 0.01 a0.05 ± 0.01 b0.55 ± 0.01 a10.18 ± 0.01 b18.369.00 ± 0.01 a
SCBB3003.87 ± 0.02 a15.99 ± 0.03 a73.70 ± 0.12 c0.78 ± 0.01 a0.22 ± 0.01 a0.05 ± 0.01 a0.23 ± 0.01 a7.17 ± 0.03 b37.081.60 ± 0.02 b
SCBB5001.90 ± 0.01 b8.61 ± 0.01 b77.16 ± 0.07 b0.68 ± 0.01 b0.11 ± 0.01 b0.03 ± 0.01 b0.12 ± 0.01 b7.19 ± 0.04 b33.202.30 ± 0.01 a
SCBB7001.24 ± 0.03 c6.29 ± 0.13 c79.05 ± 0.12 a0.57 ± 0.01 c0.08 ± 0.01 c0.02 ± 0.01 b0.09 ± 0.01 c7.51 ± 0.03 a25.042.60 ± 0.01 a
HCSB3003.00 ± 0.04 a19.31 ± 0.06 a35.50 ± 0.18 a2.75 ± 0.05 a0.54 ± 0.01 a0.08 ± 0.01 a0.62 ± 0.01 a8.89 ± 0.02 c50.8012.20 ± 0.01 b
HCSB5001.38 ± 0.01 b15.07 ± 0.19 b29.56 ± 0.05 b1.66 ± 0.01 b0.51 ± 0.01 b0.05 ± 0.01 b0.57 ± 0.01 b9.54 ± 0.01 b39.7713.10 ± 0.02 a
HCSB7000.91 ± 0.01 c11.77 ± 0.33 c25.61 ± 0.34 c0.57 ± 0.01 c0.46 ± 0.02 c0.04 ± 0.02 b0.48 ± 0.02 c9.77 ± 0.03 a35.3213.90 ± 0.02 a
PALB300, PALB500, PALB700: biochar from pineapple leaves at 300 °C, 500 °C, 700 °C, respectively; BASB300, BASB500, BASB700: biochar from banana stems at 300 °C, 500 °C, 700 °C, respectively; SCBB300, SCBB500, SCBB700: biochar from sugarcane bagasse at 300 °C, 500 °C, 700 °C, respectively. HCSB300, HCSB500, HCSB700: biochar from horticultural substrate at 300 °C, 500 °C, 700 °C, respectively. The different lower-case letters in the same line represent the significant difference at p < 0.05 among the different biochars, n = 3. The same below.
Table 2. Biochar surface areas, pore volumes, and pore diameters.
Surface AreaPore VolumePore Size
m2 g−1cm3 g−1nm
PALB3001.800.018.88
PALB5003.300.016.08
PALB700214.670.101.84
BASB3003.260.018.00
BASB50056.920.042.71
BASB700334.670.182.14
SCBB3002.380.016.25
SCBB5002.770.013.42
SCBB700194.560.102.08
HCSB3002.440.0116.03
HCSB50024.960.045.65
HCSB700119.450.093.14
Table 3. The growth of maize and soil property with biochars added.
PlantSoil
Plant Height (cm/plant)Fresh weight (g/plant)Content of Chlorophyll (mg/g)pHEC (ms/cm)
PALB30014.50 ± 0.89 b0.43 ± 0.14 b1.40 ± 0.01 b7.34 ± 0.01 a0.74 ± 0.01 b
PALB50019.37 ± 2.10 a0.62 ± 0.01 a1.70 ± 0.02 a7.15 ± 0.01 b0.85 ± 0.02 a
PALB70015.67 ± 0.86 b0.47 ± 0.05 b1.37 ± 0.02 b6.90 ± 0.02 c0.67 ± 0.01 c
ck5.70 ± 0.36 c0.19 ± 0.01 c1.22 ± 0.03 c5.31 ± 0.04 d0.25 ± 0.02 d
BASB30010.03 ± 1.45 b0.29 ± 0.06 b1.39 ± 0.07 b7.07 ± 0.03 c0.90 ± 0.02 b
BASB50018.00 ± 4.36 a0.52 ± 0.06 a1.74 ± 0.04 a7.27 ± 0.01 b0.95 ± 0.01 a
BASB70016.67 ± 2.15 a0.46 ± 0.03 a1.43 ± 0.06 b7.35 ± 0.02 a0.86 ± 0.01 c
ck5.70 ± 0.36 b0.19 ± 0.01 c1.22 ± 0.10 c5.31 ± 0.04 d0.25 ± 0.01 d
SCBB30024.17 ± 1.04 a0.66 ± 0.07 b1.84 ± 0.09 b6.39 ± 0.01 a0.37 ± 0.01 b
SCBB50023.87 ± 0.78 a0.81 ± 0.06 a2.15 ± 0.05 a6.07 ± 0.01 b0.39 ± 0.01 a
SCBB70022.30 ± 0.69 b0.57 ± 0.04 b1.77 ± 0.07 b5.97 ± 0.01 c0.23 ± 0.01 d
ck5.70 ± 0.36 c0.19 ± 0.01 c1.22 ± 0.10 c5.31 ± 0.04 d0.25 ± 0.02 c
HCSB30020.67 ± 2.08 b0.70 ± 0.11 b2.24 ± 0.03 b6.06 ± 0.04 c0.36 ± 0.01 c
HCSB50026.33 ± 0.29 a1.12 ± 0.30 a2.54 ± 0.10 a6.50 ± 0.03 b0.43 ± 0.01 b
HCSB70024.43 ± 2.41 a0.55 ± 0.06 b2.33 ± 0.10 b6.74 ± 0.02 a0.45 ± 0.01 a
ck5.70 ± 0.36 c0.19 ± 0.01 c1.22 ± 0.10 c5.31 ± 0.04 d0.25 ± 0.01 d
B0.000 ***0.000 ***0.000 ***0.000 ***0.000 ***
T0.000 ***0.000 ***0.000 ***0.001***0.000 ***
B×T0.011 *0.015 *0.014 *0.000 ***0.000 ***
Note: The different lower-case letters in the same line represent the significant difference at p < 0.05 among the different biochars, n = 3. ck was control treatment with 150 g of soil alone. B: biochar, T: Temperature. * p < 0.05, *** p < 0.001.
Disclaimer/Publisher’s Note: The statements, opinions and data contained in all publications are solely those of the individual author(s) and contributor(s) and not of MDPI and/or the editor(s). MDPI and/or the editor(s) disclaim responsibility for any injury to people or property resulting from any ideas, methods, instructions or products referred to in the content.

