Article

Genetic Diversity in Oilseed and Vegetable Mustard (Brassica juncea L.) Accessions Revealed by Nuclear and Mitochondrial Molecular Markers

State Key Laboratory of Crop Stress Biology in Arid Areas, College of Agronomy, Northwest A&F University, Yangling 712100, China
*
Author to whom correspondence should be addressed.
Agronomy 2023, 13(3), 919; https://doi.org/10.3390/agronomy13030919
Submission received: 9 January 2023 / Revised: 14 March 2023 / Accepted: 18 March 2023 / Published: 20 March 2023
(This article belongs to the Special Issue Application of Molecular Marker Technology in Crop Breeding)

Abstract

:
Genetic diversity analysis is a fundamental work for effective management and utilization of plant germplasm. Brassica juncea is an economically important crop, including both oilseed and vegetable types. In the present study, a total of 99 accessions of Brassicaceae family, including 84 mustard (50 oilseed and 34 vegetable types) in China and 15 other Brassicaceae accessions were evaluated for their genetic diversity using nuclear and mitochondrial molecular markers. All accessions were evaluated using 18 simple sequence repeats, 20 sequence related amplified polymorphisms, and 7 intron-exon splice junction primers, and in total, 232 polymorphic fragments were obtained. The unweighted pair-group method with arithmetic mean cluster analysis indicated that all accessions could be divided into three major clusters, with cluster I including all 50 oilseed mustard, cluster II including 34 vegetable mustard, and cluster III containing 15 other Brassicaceae accessions. The results of principal component analysis and population structure analysis were in accordance with the cluster result. Molecular variance analysis revealed that the genetic variation was 34.07% among populations and 65.93% within Brassica species, which indicates existence of considerable genetic variation among oilseed and vegetable B. juncea species. Based on an InDel and a SNP locus reported in B. juncea mitochondrial genome, all the 84 B. juncea mitochondrial genomes were divided into three mitotypes (MTs1-3), 22 accessions of MT1, 20 accessions of MT2, and 42 accessions of MT3. In addition, the results of the modified multiplex PCR, Indel and SNP could identify pol-, cam-, nap- (or MT4), Bol-, Bni-, Esa-, and In-cytoplasmic types in 15 other Brassicaceae accessions. Together, oilseed and vegetable B. juncea can be used for broadening the genetic background for each other.

1. Introduction

Allopolyploid mustard (Brassica juncea L., 2n = 36, AABB genome) is an economically important crop in the U triangle model, which describes the relationship among three diploid species B. rapa (2n = 20, AA), B. nigra (2n = 16, BB), and B. oleracea (2n = 18, CC), and three allopolyploid species B. napus (2n = 38, AACC), B. juncea (2n = 36, AABB), and B. carinata (2n = 34, BBCC) [1]. B. juncea group contains both oilseed and vegetable types [2,3,4]. Oilseed B. juncea is mainly distributed in the Indian subcontinent, China, Canada, and Australia [4]. India has around six million hectares of land under oilseed mustard, and Canada is currently the second mustard producer after India. Vegetable B. juncea is widely distributed in China, and the degree of its variation and differentiation exceeds the B. rapa and B. oleracea of the Brassica genus [5]. Based on crop usage and morphology, B. juncea is mainly classified into four subspecies, namely, juncea (seed mustard), integrifolia (leaf mustard), napiformis (root mustard), and tumida (stem mustard) [6], and these four subspecies are further divided into 16 varieties [5,7].
The genome size of B. juncea is approximately 1068 Mbp [3,8,9], B. rapa is 529 Mbp [10], and B. nigra is 632 Mbp [11]. The complement of genome sequencing of B. juncea and its diploid progenitor species B. rapa and B. nigra provides a good platform for basic research in these crops. Analysis of chloroplast and mitochondria DNA has shown B. rapa to be the donor of cytoplasm to B. juncea [8,12,13,14]. Two hypotheses have been proposed on the issues of origin center of B. juncea, monophyletic and polyphyletic origin. A polyphyletic origin was proposed by various investigations implementing chemotaxonomy [15], nuclear DNA markers [16,17], and chloroplast genomic markers [18]. In contrast, Vavilov [19] proposed Central Asia (Afghanistan and its contiguous regions) as the primary center of the origin of B. juncea, and Asia Minor, central/western China, and eastern India as secondary centers of diversity. Recently, the hypothesis of single origin was strongly supported and updated on the basis of whole genome re-sequencing of B. juncea accessions in the world [3,4,8]. In addition, Kang et al. [8] proposed that B. juncea most likely has a single origin in West Asia (the Middle East), 8000–14,000 years ago, via interspecific hybridization via nuclear and organelle phylogenies of 480 accessions worldwide.
Genetic diversity analysis is of prime importance for plant breeding [20,21]. Various molecular techniques, including isozyme markers, restriction fragment length polymorphism (RFLP), random amplified polymorphic DNA (RAPD), amplified fragment length polymorphisms (AFLPs), simple sequence repeat polymorphism (SSRs), sequence related amplified polymorphism (SRAP), and whole genome sequencing technology have been used to assess genetic variation and diversity in B. juncea [4,16,17,22,23,24,25,26,27,28,29]. Extensive phenotypic and molecular marker-based studies on oilseed type of B. juncea have identified two major divergent gene pools, the gene pool of central and western India and eastern China, and the gene pool of central and western China, northern and eastern India, Europe, and Australia [17,18,22,24,30]. Studies on oilseed B. juncea accessions in southwestern, western, and Tibet of China showed high levels of molecular genetic diversity, these results were related to agro-ecological adaptations, geological and biological conditions [31,32,33,34,35]. Chinese vegetable mustard accessions were also shown to possess considerable genetic diversity assessed by RAPDs, AFLPs, SSR, SRAP, and inter-simple sequence repeat (ISSR) markers. However, cluster results based on molecular marker data were not fully in accordance with the traditional classification that was based on different edible organs of vegetable mustards and geographical origin of the tested accessions [25,28,36,37,38,39,40]. Sharma et al. [41] revealed a significant variation among 59 accessions of Indian leafy mustard in both qualitative and quantitative agro-morphological traits and molecular level. However, a few studies on the genetic relationships between oilseed and vegetable mustards have been conducted. Rabbani et al. [23] analyzed the genetic diversity and the relationships among a pane of mustard germplasm, including forty-one accessions collected from Pakistan, six oilseed cultivars/lines, and five Japanese vegetable cultivars and indicated that the clusters formed by the oilseed accessions were distinct from those by the vegetable accessions. Wu et al. [26] analyzed the genetic diversity of a collection of 95 accessions of B. juncea, which represented oil and vegetable mustards from China, France, India, Pakistan, and Japan by SRAP markers. They indicated that the level of genetic diversity within vegetable mustard was considerably higher than the level within oil mustard, and winter oil mustards were genetically more diverse than spring oil mustards. There are abundant mustard genetic resources in China, which are necessary to be characterized by more molecular markers.
In the present study, a collection of 99 accessions of Brassicaceae family, which included 84 mustard (50 oilseed and 34 vegetable types) from 14 provinces in China, and 15 other Brassicaceae accessions as references, were genetically characterized by nuclear and mitochondrial molecular markers. Our results indicated that there existed considerable genetic variation within and among oilseed and vegetable B. juncea species in China. Genetic exchange between oilseed type and vegetable type mustard promotes a high reward for the breeding of both oil and vegetable mustards. The findings will provide important scientific value for B. juncea genetic analysis and breeding.

2. Materials and Methods

2.1. Plant Samples

A total of 99 accessions from Brassicaceae family, including 84 mustard and 15 reference accessions (Table S1), were used for evaluation of their nuclear and cytoplasmic genetic diversity in the present study. These 84 mustard accessions were from 14 provinces in China and included 50 oilseed and 34 vegetable types. The 50 oilseed accessions contained 18 yellow- and 32 dark-seeded accessions. The 34 vegetable accessions included the most eight popular varieties of three subspecies (Table S1). For analysis of cytoplasmic diversity, six other accessions with known cytoplasm types were also included as references, hau CMS (B. juncea), nap cytoplasm (B. napus), pol cytoplasm (B. napus), ogu CMS (B. napus), ogu-NWSUAF CMS (B. napus), and cam cytoplasm (B. napus) [42,43]. All plant materials were provided by Rapeseed Research Center of Northwest A&F University, except for hau CMS, which was kindly provided by Prof. Jinxiong Shen, Huazhong Agricultural University. All the accessions were planted in the experimental field station of Northwest A&F University at Yangling, Shaanxi, China, on September 2019. Leaf samples were harvested from 15 seedlings and stored at –80 °C for later use.

2.2. Genomic DNA Extraction

Genomic DNA was isolated from young leaves by the cetyltrimethylammonium bromide (CTAB) method as described previously [44], the DNA pellet was dissolved in 50 μL TE buffer. To estimate the integrity and quality of the DNA samples, 2 μL DNA of each sample was loaded on 0.8% agarose gel for electrophoresis and observed under ultra violet (UV) light. The concentration of the DNA samples was measured using Epoch Microplate Spectrophotometer (Epoch, VT, USA) and diluted to 100 ng µL−1 before use.

2.3. Sequence Related Amplified Polymorphism (SRAP) Analysis

Twenty pairs of SRAP primers (Table S2) were chosen to analyze the tested accessions based on our laboratory’s previous work [45], and these primers were synthesized by Tsingke (Xi’an, China). PCR was performed in a 10 μL volume, including 1.5 μL DNA (100 ng µL−1) template, 1 μL (10 μM) of each primer, 5 μL 2× Taq PCR Master (Vazyme, Nanjing, China), and 1.5 μL ddH2O. The amplification program was performed in C1000 thermal cycler (Bio-Rad Co. Ltd., USA) following these steps: 5 min at 94 °C; 30 s at 94 °C, 60 s at 56 °C, 45 s at 72 °C, 40 cycles; and a final extension at 72 °C for 5 min. PCR products were run on 8% polyacrylamide (w/v) denaturing gel in 1× Tris-borate-ethylene diaminetetraacetic acid (EDTA) (TBE) and visualized by silver staining.

2.4. Simple Sequence Repeats (SSR) Analysis

SSR analysis was performed by PCR with 18 pairs of SSR primers (Table S3) [45]. The primers were selected based on high polymorphism and easy scoring. The SSR reaction system and its PCR product detection were the same as described for SRAP experiment. The PCR reaction was performed as follows: 1 min at 95 °C; 1 min at 94 °C, 1 min at 35 °C, 1 min at 72 °C, 5 cycles; 1 min at 94 °C, 1 min at 50 °C, 1 min at 72 °C, 34 cycles; and a final incubation at 72 °C for 7 min.

2.5. Intron-Exon Splice Junction (ISJ) Analysis

ISJ analysis was performed by PCR with seven pairs of ISJ primers (Table S4) [46]. The ISJ reaction system and detection were the same as in the previous study [46]. The PCR products were analyzed on 3% agarose gels and visualized under UV light.

2.6. Analysis of Differentiation of Mitochondrial Genomes

Mitochondrial genomes of the tested accessions were analyzed on the basis of mitochondrial molecular markers, which included cytoplasmic male sterility (CMS) genes-associated markers, Indel and SNP markers reported previously. First, an improved multiplex PCR detection method was used to detect CMS-related genes orf138 [47,48], orf222 [49], orf224 [50,51], and orf288 [52]. This method was modified from the original one [42], and included four pairs of primers, three of them from Zhao et al. [42], and one from Heng et al. [43]. These primers (Table S5) were synthesized by Tsingke (Xi’an, China). The PCR amplifications were carried out in a 20 μL volume, including 3 μL (100 ng µL−1) genomic DNA, 10 μL 2× Taq PCR Master (Vazyme, China), 0.8 μL (10 μM) of each primer, 0.6 μL ddH2O. The cycling condition for PCR was as follows: 94 °C for 5 min; 25 cycles of 94 °C for 30 s, 54 °C for 50 s, 72 °C for 45 s; and 72 °C for 10 min. The PCR products were analyzed on 1.5% agarose gels and visualized under UV light.
Previously, based on an InDel and a SNP locus in B. juncea mitochondrial genome, the B. juncea mitochondrial genomes were divided into three types (MTs1-3) [8,53]. All the accessions were detected for the 31 bp InDel by the PCR with the primer pair (Indel-F and Indel-R; Tsingke, Xi’an, China) (Table S6) according to the method described by Kang et al. [8]. The DNA containing the SNP site [53] was amplified by the PCR with the primer pair (SNP-F and SNP-R) (Table S6), and the SNP site (C-79573-A, according to JF920288) was detected by sequencing the target PCR fragment.

2.7. Data Collection and Analysis

All the experiments were carried out in two technical replications, and the strong, reproducible, and clearly distinguished bands for each sample were recorded in both replications.
For SRAP, SSR, and ISJ molecular marker analysis, in the case of the same position, presence is “1”, absence is “0”, and miss information is “9”. These data were used to construct a 0–1 matrix, and simple matching coefficients (SMC) were calculated from the matrix, SMC = a/(n − d), where a is the number of bands in common between two accessions, n is the number of bands in the matrix, and d is the number of bands absent in both accessions [54]. SMC was used to construct a dendrogram by the unweighted pair-group method with arithmetic mean (UPGMA) using DPS 7.5 [55] and MEGA-X [56]. For MEGA-X analysis, we set the parameters for tree construction by selecting Construct phylogeny program under Phylogeny in the menu of the main program interface, clicking the UPGMA method, and achieving the evolution tree diagram after confirmation [56,57]. The obtained cluster analysis map was further modified by the online iTOL software (https://itol.embl.de/ (accessed on 14 August 2021)). Principal component analysis (PCA) was performed with Dcenter and Eigen program in NTSYS-pc2.10 software (Exeter Software, Setauket, NY, USA) [58]. Population structure analysis was performed using software STRUCTURE version 2.3.4, and the application of recessive allelic model and hybrid model was used. The Markov chain Montecarlo after a length of burn-in period was set to 10,000 times, the number of population groups K was 1 to 10, and the number of iterations was 1 [59]. Analysis of molecular variance (AMOVA) was conducted using ARLEQUIN version 3.5 [60] to partition the total variation and test significance among and within populations. POPGENE version 1.32 software [61] was used to calculate the genetic parameters of each locus, including the observed number of alleles (NA), effective number of alleles (NE), Nei’s gene diversity (H), and Shannon’s information index (I).

3. Results

3.1. Level of Polymorphism

The selected twenty pairs of SRAP primers, eighteen pairs of SSR primers, and seven ISJ primers were used to genotype the ninety-nine Brassicaceae accessions in the present study. In total, 232 polymorphic bands were obtained by the three kinds of molecular markers. The 20 pairs of SRAP primers amplified 87 polymorphic bands. The mean of NA for SRAP was 1.702, with NA of the primer Em15Me8 being the highest (2.000), and the primer Em5Me24 being the lowest (1.303). The mean of NE was 1.476, with the highest of the primer Em10Me9 (1.777), and the lowest of the primer Em5Me24 (1.246). The means of PIC, H, and I were 0.667, 0.266, and 0.389, respectively (Table S2, Figure S1). The 18 pairs of SSR primers produced 101 polymorphic bands. The mean of NA for SSR was 1.673, with the primers BrgMS217 and BrgMS318 being the highest (1.980), the primer BrgMS343 being the lowest (1.131). The mean of NE was 1.673, with the highest of the primer BrgMS13 (1.850) and the lowest of the primer BrgMS343 (1.099). The means of PIC, H, and I were 0.747, 0.333, and 0.496, respectively (Table S3, Figure S2). The seven ISJ primers yielded 44 polymorphic bands. The mean of NA for ISJ was 1.689, with NA of the primer R2 being the highest (2.000), and the primer E2 being the lowest (0.197). The mean of NE was 1.669, with the highest for the primer R5 (1.796) and the lowest for the primer R4 (1.554). The means of PIC, H, and I were 0.768, 0.379, and 0.553, respectively (Table S4, Figure S3). The three types of molecular markers could effectively detect the genetic differences among the tested accessions, with the ISJ markers being the most powerful ones in terms of PIC, NE, H, and I parameters (Tables S2–S4).

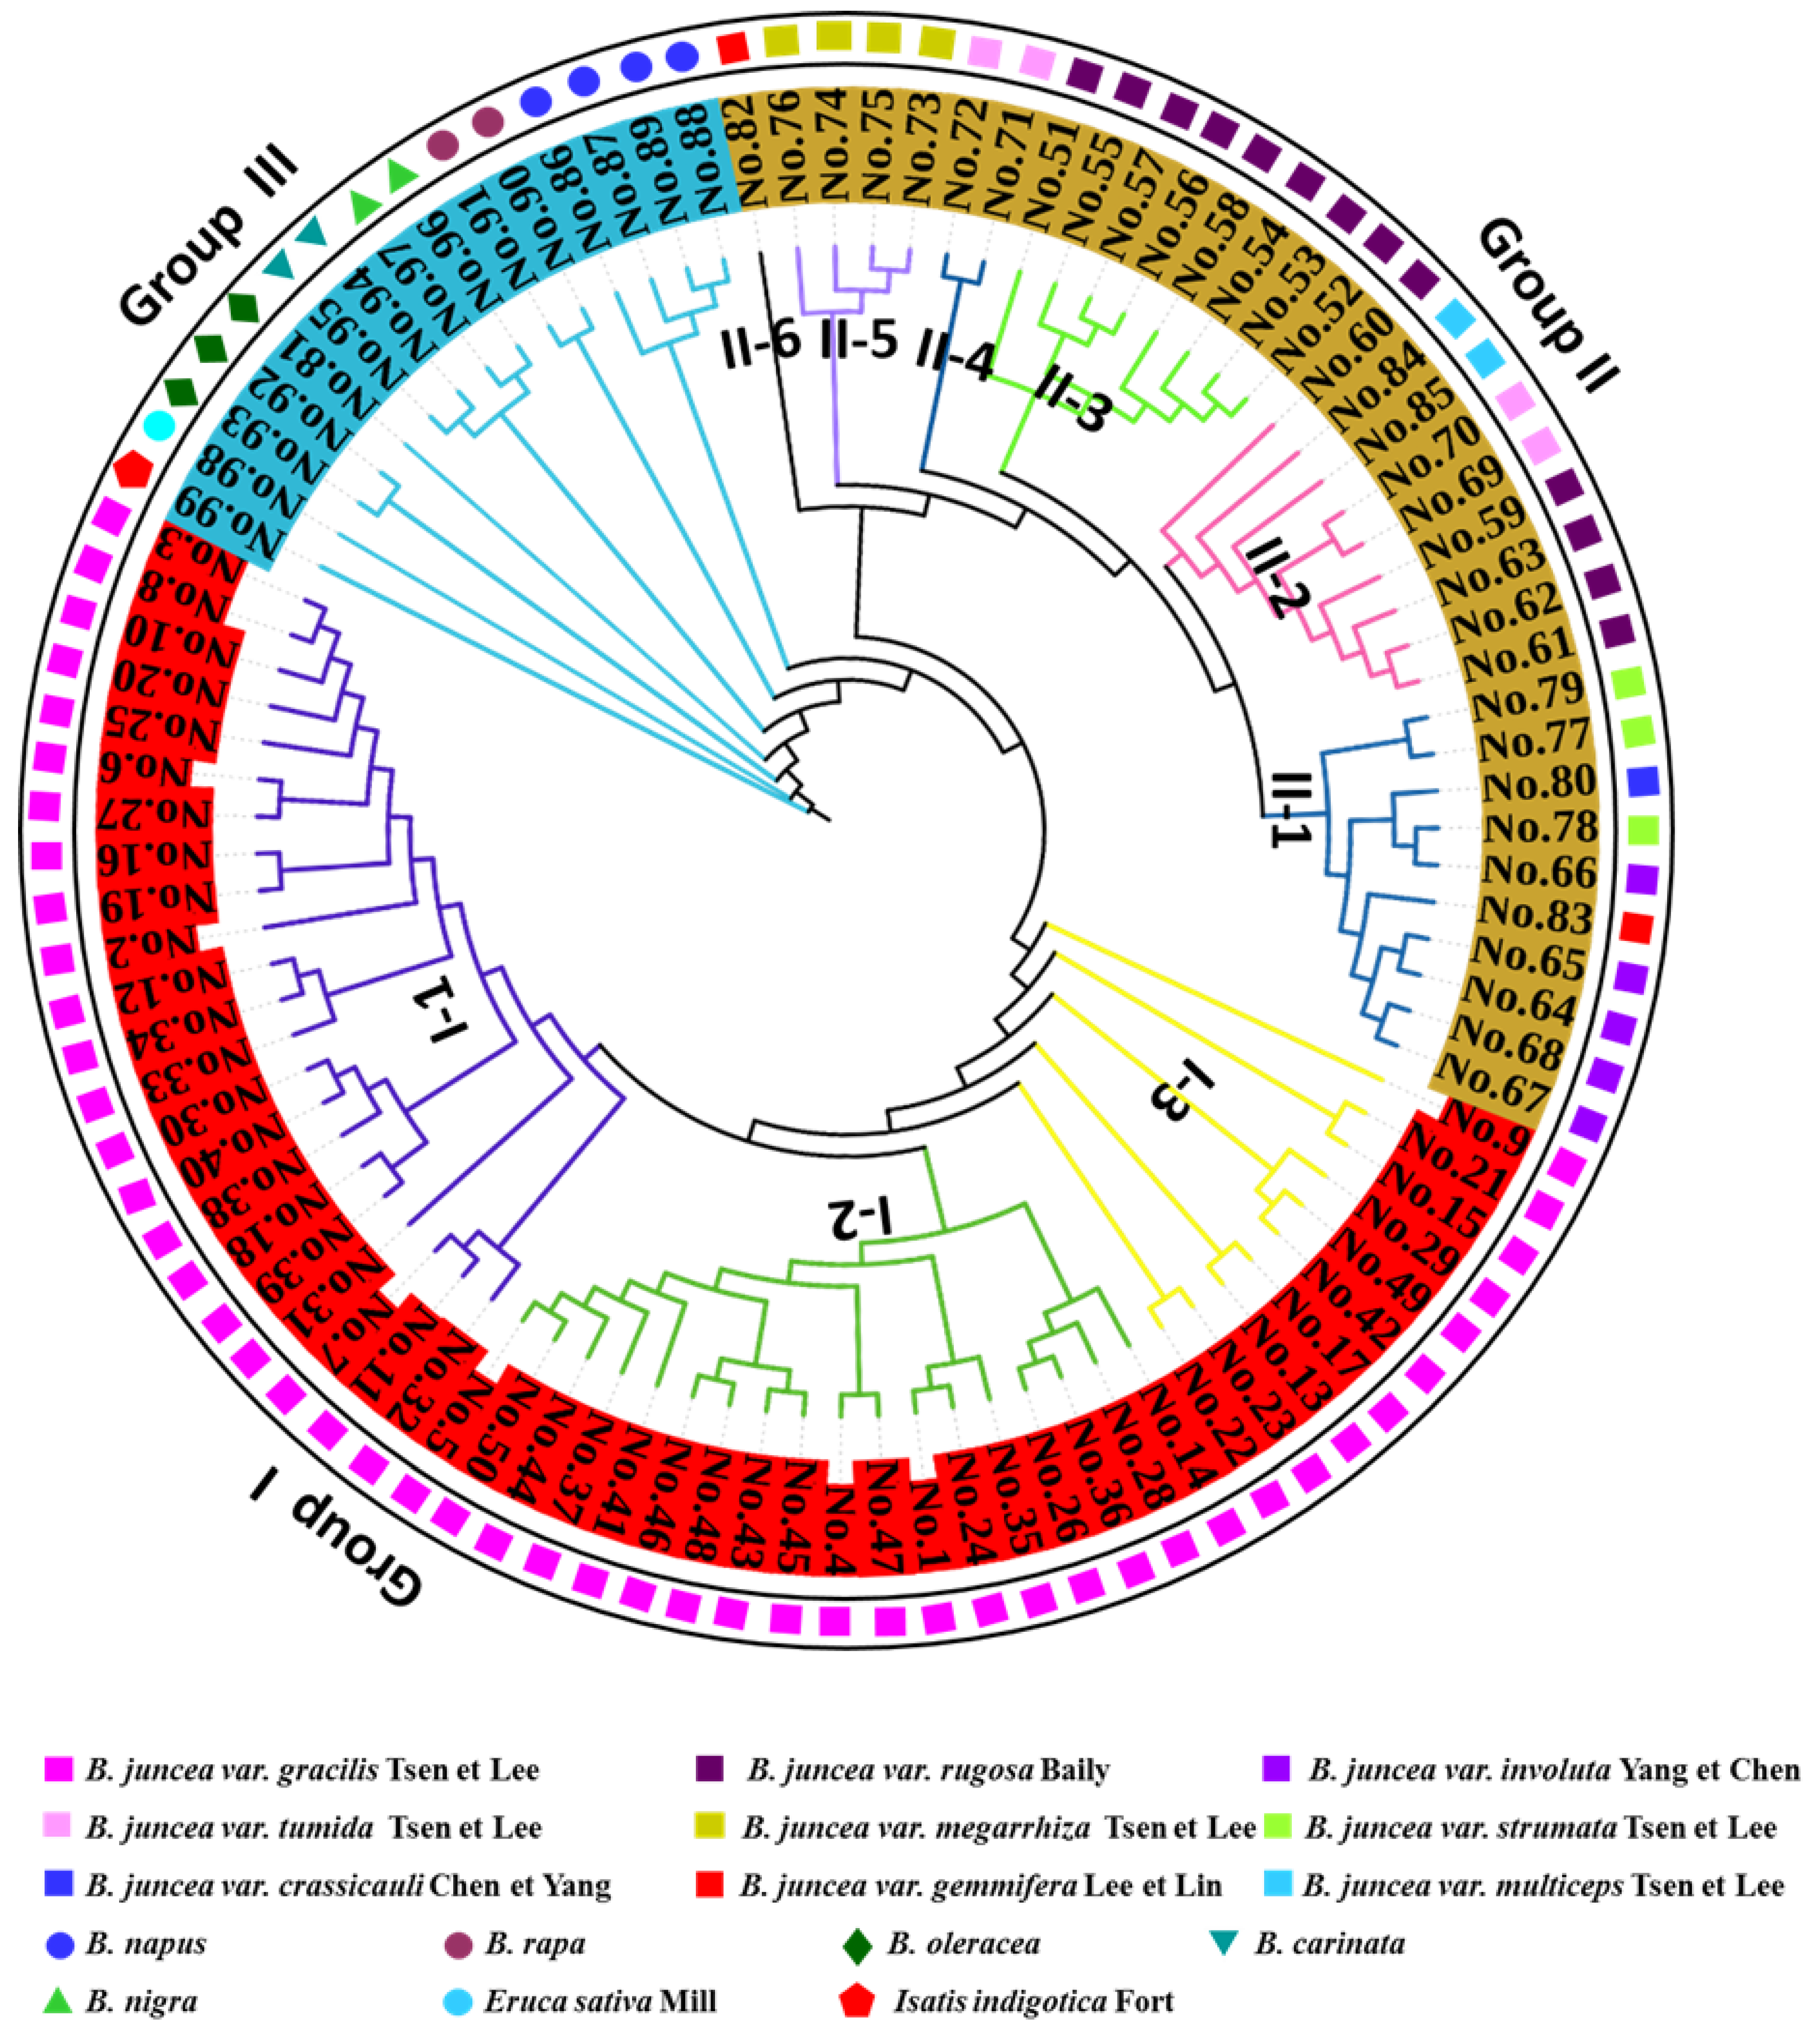
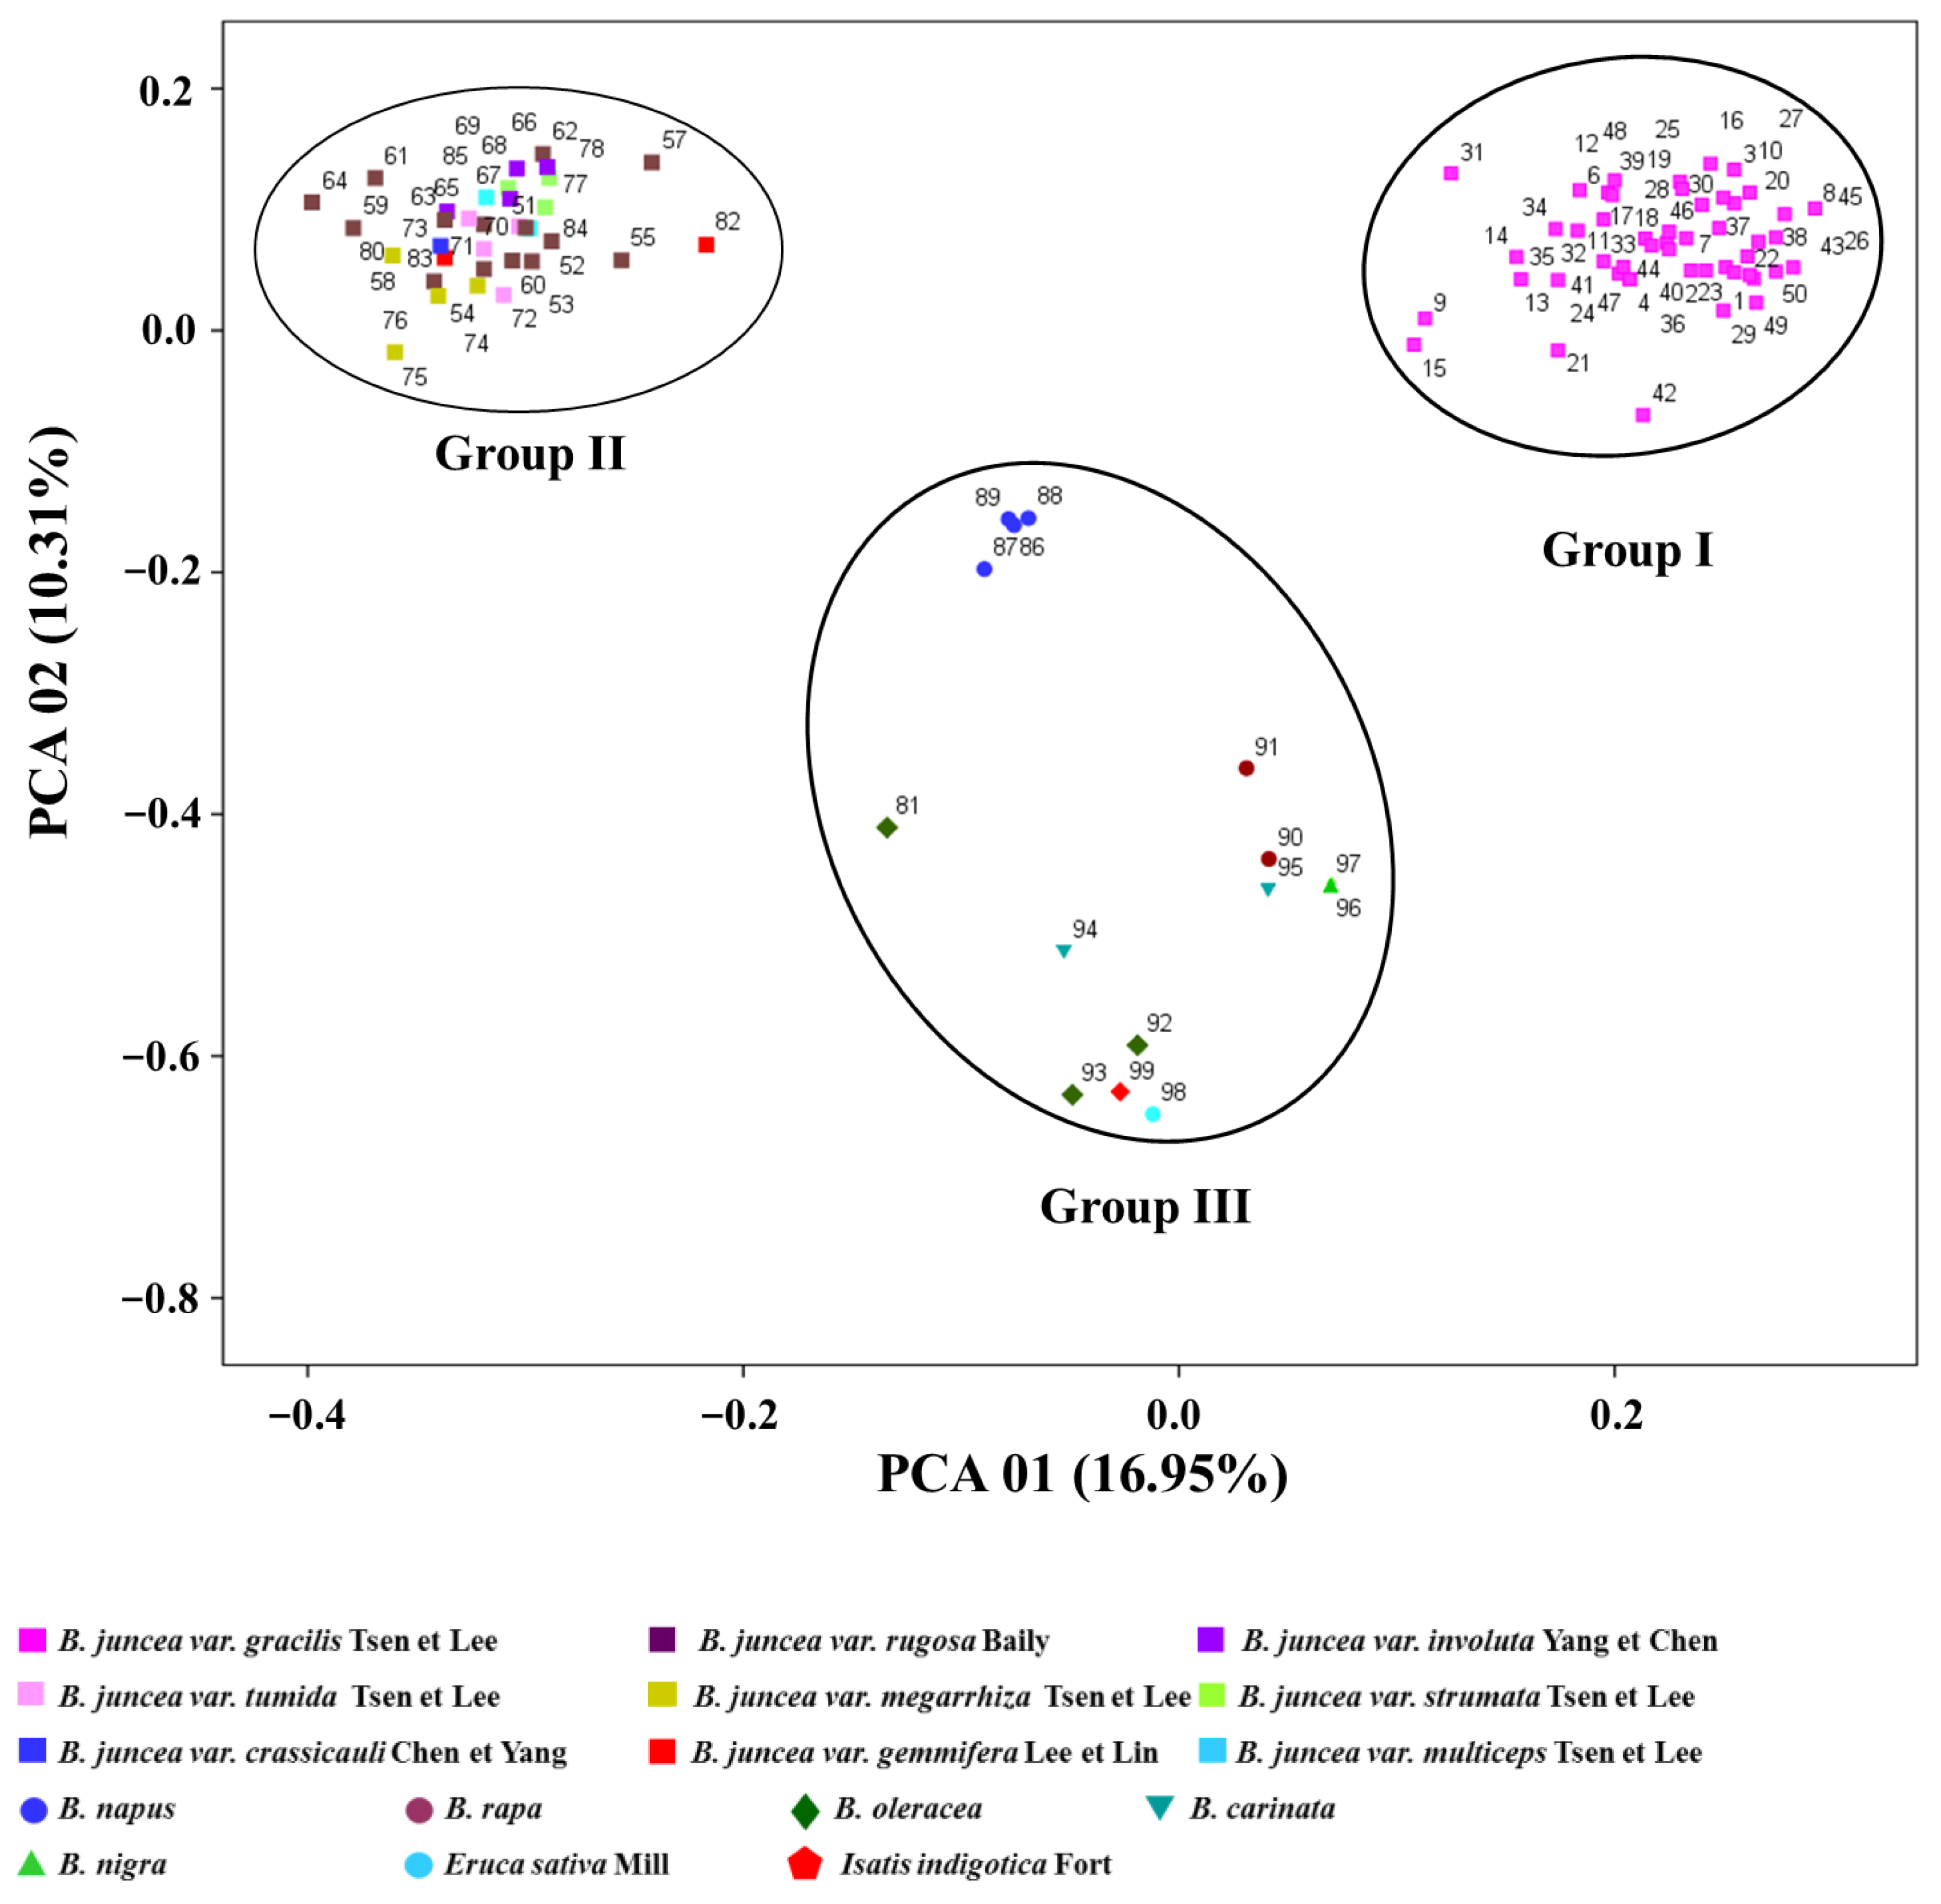
3.2. Cluster Analysis

Based on the molecular marker data of 232 polymorphic bands produced by the SRAP, SSR, and ISJ primers, a dendrogram was generated using UPGMA method (Figure 1). As a result, the tested accessions in the present study were divided into three major clusters. Cluster I included 50 oilseed mustards, 18 of them were yellow seeded accessions. Cluster II included 34 vegetable-used mustards, all of them were dark seeded accessions. Cluster III included the 15 reference accessions (four B. napus, three B. oleracea, two each of B. rapa, B. carinata, and B. nigra, and one each of E. sativa and I. indigotica accession), one B. carinata accession (No. 94) was yellow seed (Figure 1, Table S1). The cluster I could be further divided into three subclusters. Subcluster I-1 included 22 oilseed mustard accessions, 11 of them were yellow seed; I-2 included 18 accessions, three of them were yellow seed; and I-3 contained 10 accessions, four of them were yellow seed (Table S1). Oilseed mustard accessions were basically classified according to their resource, but selection had a certain effect, and the same material was differentiated. For example, nine accessions (Nos. 4, 38, 39, 40, 41, 43, 44, 45, and 46), which were derived from the same original material, were clustered into two subclusters, with subcluster I-1 including three accessions (Nos. 38, 39, and 40) and subcluster I-2 possessing six other accessions (Nos. 4, 41, 43, 44, 45, and 46). Similarly, seven accessions (Nos. 25, 26, 27, 28, 29, 42, and 49) from the same original material were clustered into three subclusters, with subcluster I-1 including two accessions (Nos. 25 and 27), subcluster I-2 including two accessions (Nos. 26 and 28), and subcluster I-3 possessing three accessions (Nos. 29, 42, and 49). The cluster II could be further divided into six subclusters. Subcluster II-1 included ten accessions, eight of leaf type (B. juncea var. involuta and B. juncea var. strumata) and two of stem type (B. juncea var. tumida) accessions. Subcluster II-2 included nine accessions, seven of leaf type (B. juncea var. rugose and B. juncea var. multiceps) and two of stem type (B. juncea var. tumida) accessions. Subcluster II-3 contained eight accessions of leaf type (B. juncea var. rugose) accessions. Subcluster II-4 contained two accessions of stem mustards (B. juncea var. tumida). Subcluster II-5 included four accessions of root mustard (B. juncea var. megarrhiza). Subcluster II-6 included one accession of stem mustard (B. juncea var. gemmifera). Vegetable type mustards were roughly classified according to their edible organs, with some exceptions. For example, four accessions (Nos. 69–72) of B. juncea var. tumida were clustered into two subclusters, with two accessions (Nos. 69 and 70) in subcluster II-2, and two accessions (Nos. 71 and 72) in subcluster II-4. Similarly, two accessions of B. juncea var. gemmifera were clustered into two subclusters, with one accession (No. 83) in subcluster II-1, and one accession (No. 82) in subcluster II-6.
Principal component analysis (PCA) was carried out from the similarity matrix calculated from 232 SSR, SRAP, and ISJ molecular markers data. As a result, the first two principal components explained 16.95% and 10.31% of the total variations, respectively. The PCA result was generally similar to the cluster analysis (Figure 2). The PCA results divided the 99 accessions into three groups. Group I included 50 oilseed mustard accessions, group II 34 the vegetable-type mustards, and group III the 15 other Brassicaceae accessions.

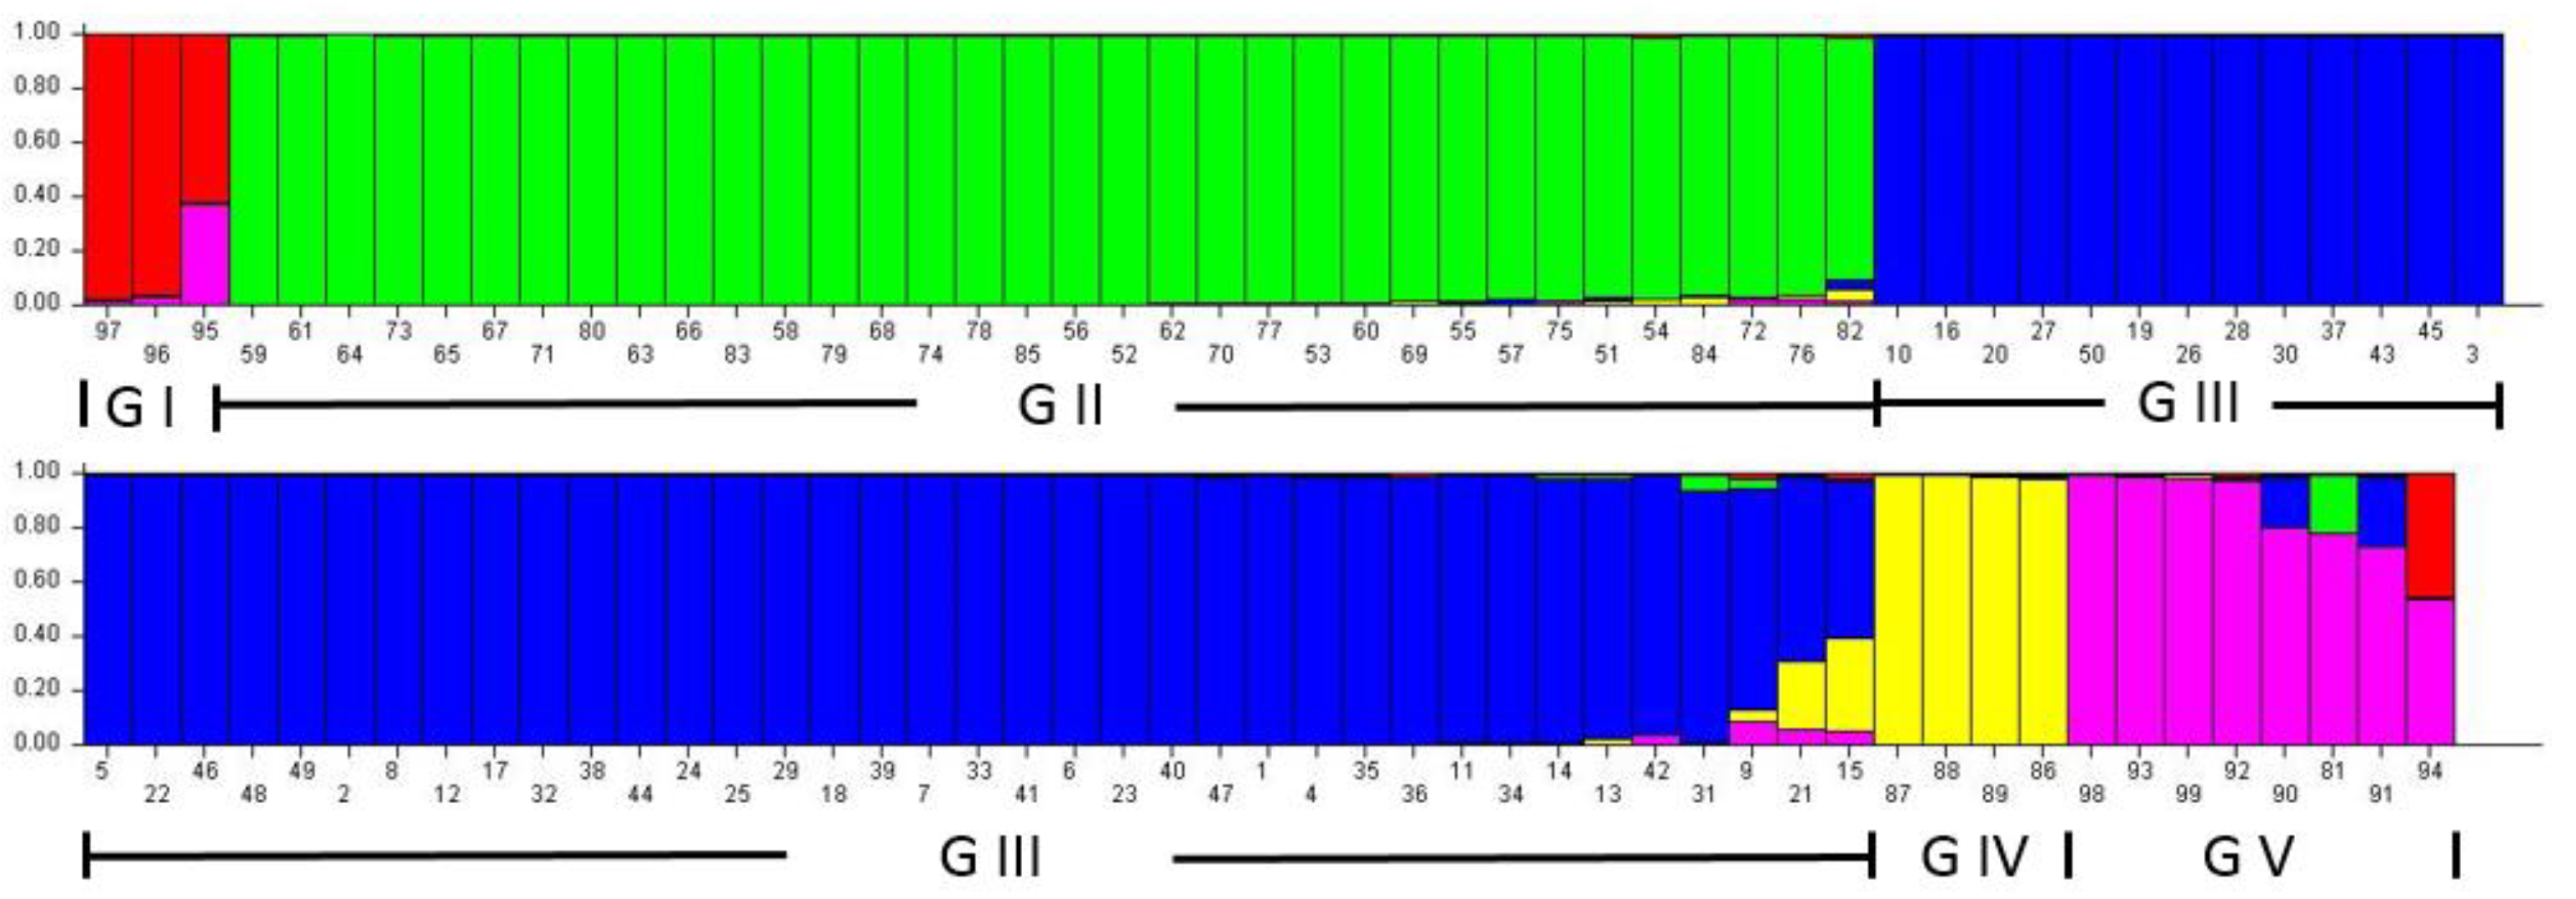
3.3. Population Structure Analysis

Population genetic structure can represent the subgroup of a population. In the present study, the break point of the estimated Ln probability of data [Ln P (D)] was obtained when the K = 5 (Figure S4), thus, the 99 accessions were classified into five groups (G I–G V) with the highest reliability (Figure 3). G I included three accessions, one of B. carinata (No. 95) and two of B. nigra (Nos. 96 and 97). G II included 34 accessions of vegetable mustards. G III included 50 accessions of oilseed mustards. G IV included four accessions of B. napus. G V included eight accessions, three of B. oleracea, two of B. rapa, one each of B. carinata, E. sativa, and I. indigotica. In general, the structure diagrams of G II and G III were consistent with clustering and PCA results.

3.4. Analysis of Molecular Variance

On the basis of Brassicaceae accessions type, all the 99 accessions examined were classified into three groups, oilseed mustard (50), vegetable mustard (34), and other Brassicaceae accessions (15), for AMOVA. The results showed that 34.07% of the total variation was due to differences among populations and 65.93% variation was due to differences within populations, indicating that the major genetic variation of the species originated from the individuals within the population (Table S7). Analysis on the pairwise differences indicated that difference values within populations were greater than those between populations, that pairwise difference values within oilseed mustard (59.62041) were larger than within vegetable mustard (52.81462), and that the other Brassicaceae accession group (105.84762) was larger than the former two, for the 15 accessions in this group, including six different species of Brassicaceae family. Pairwise differences between three groups were similar, with a slightly larger difference (35.97280) between the vegetable mustard and other Brassicaceae groups (Table 1).

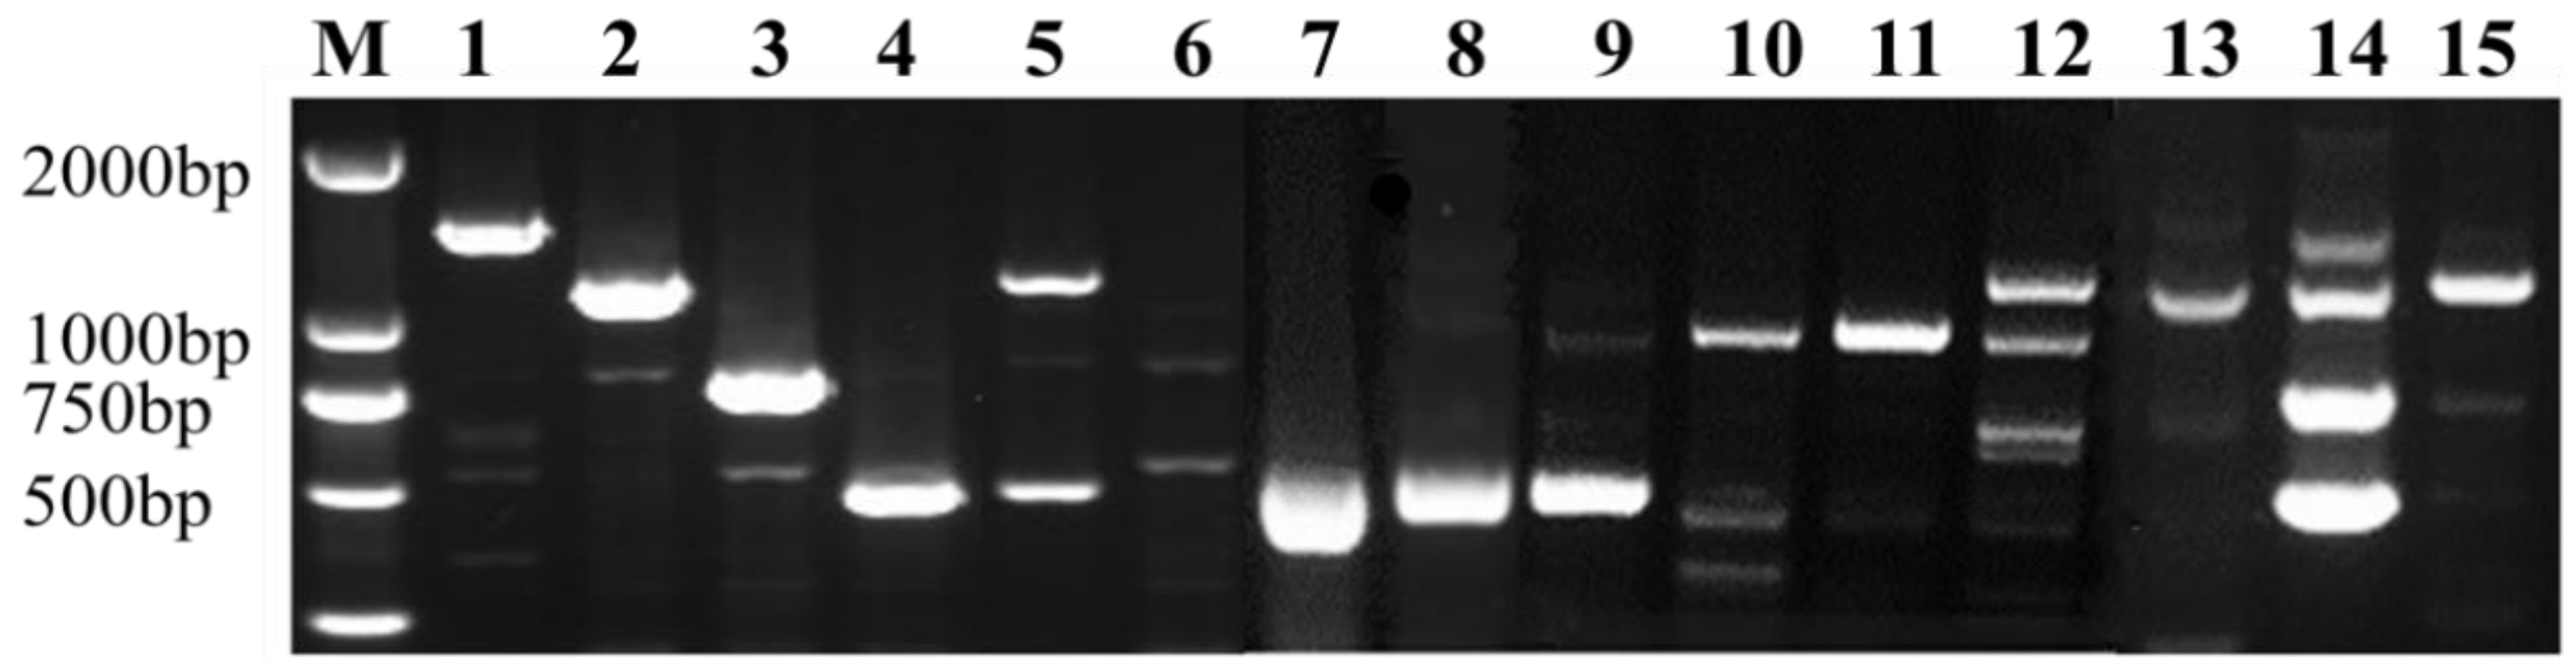
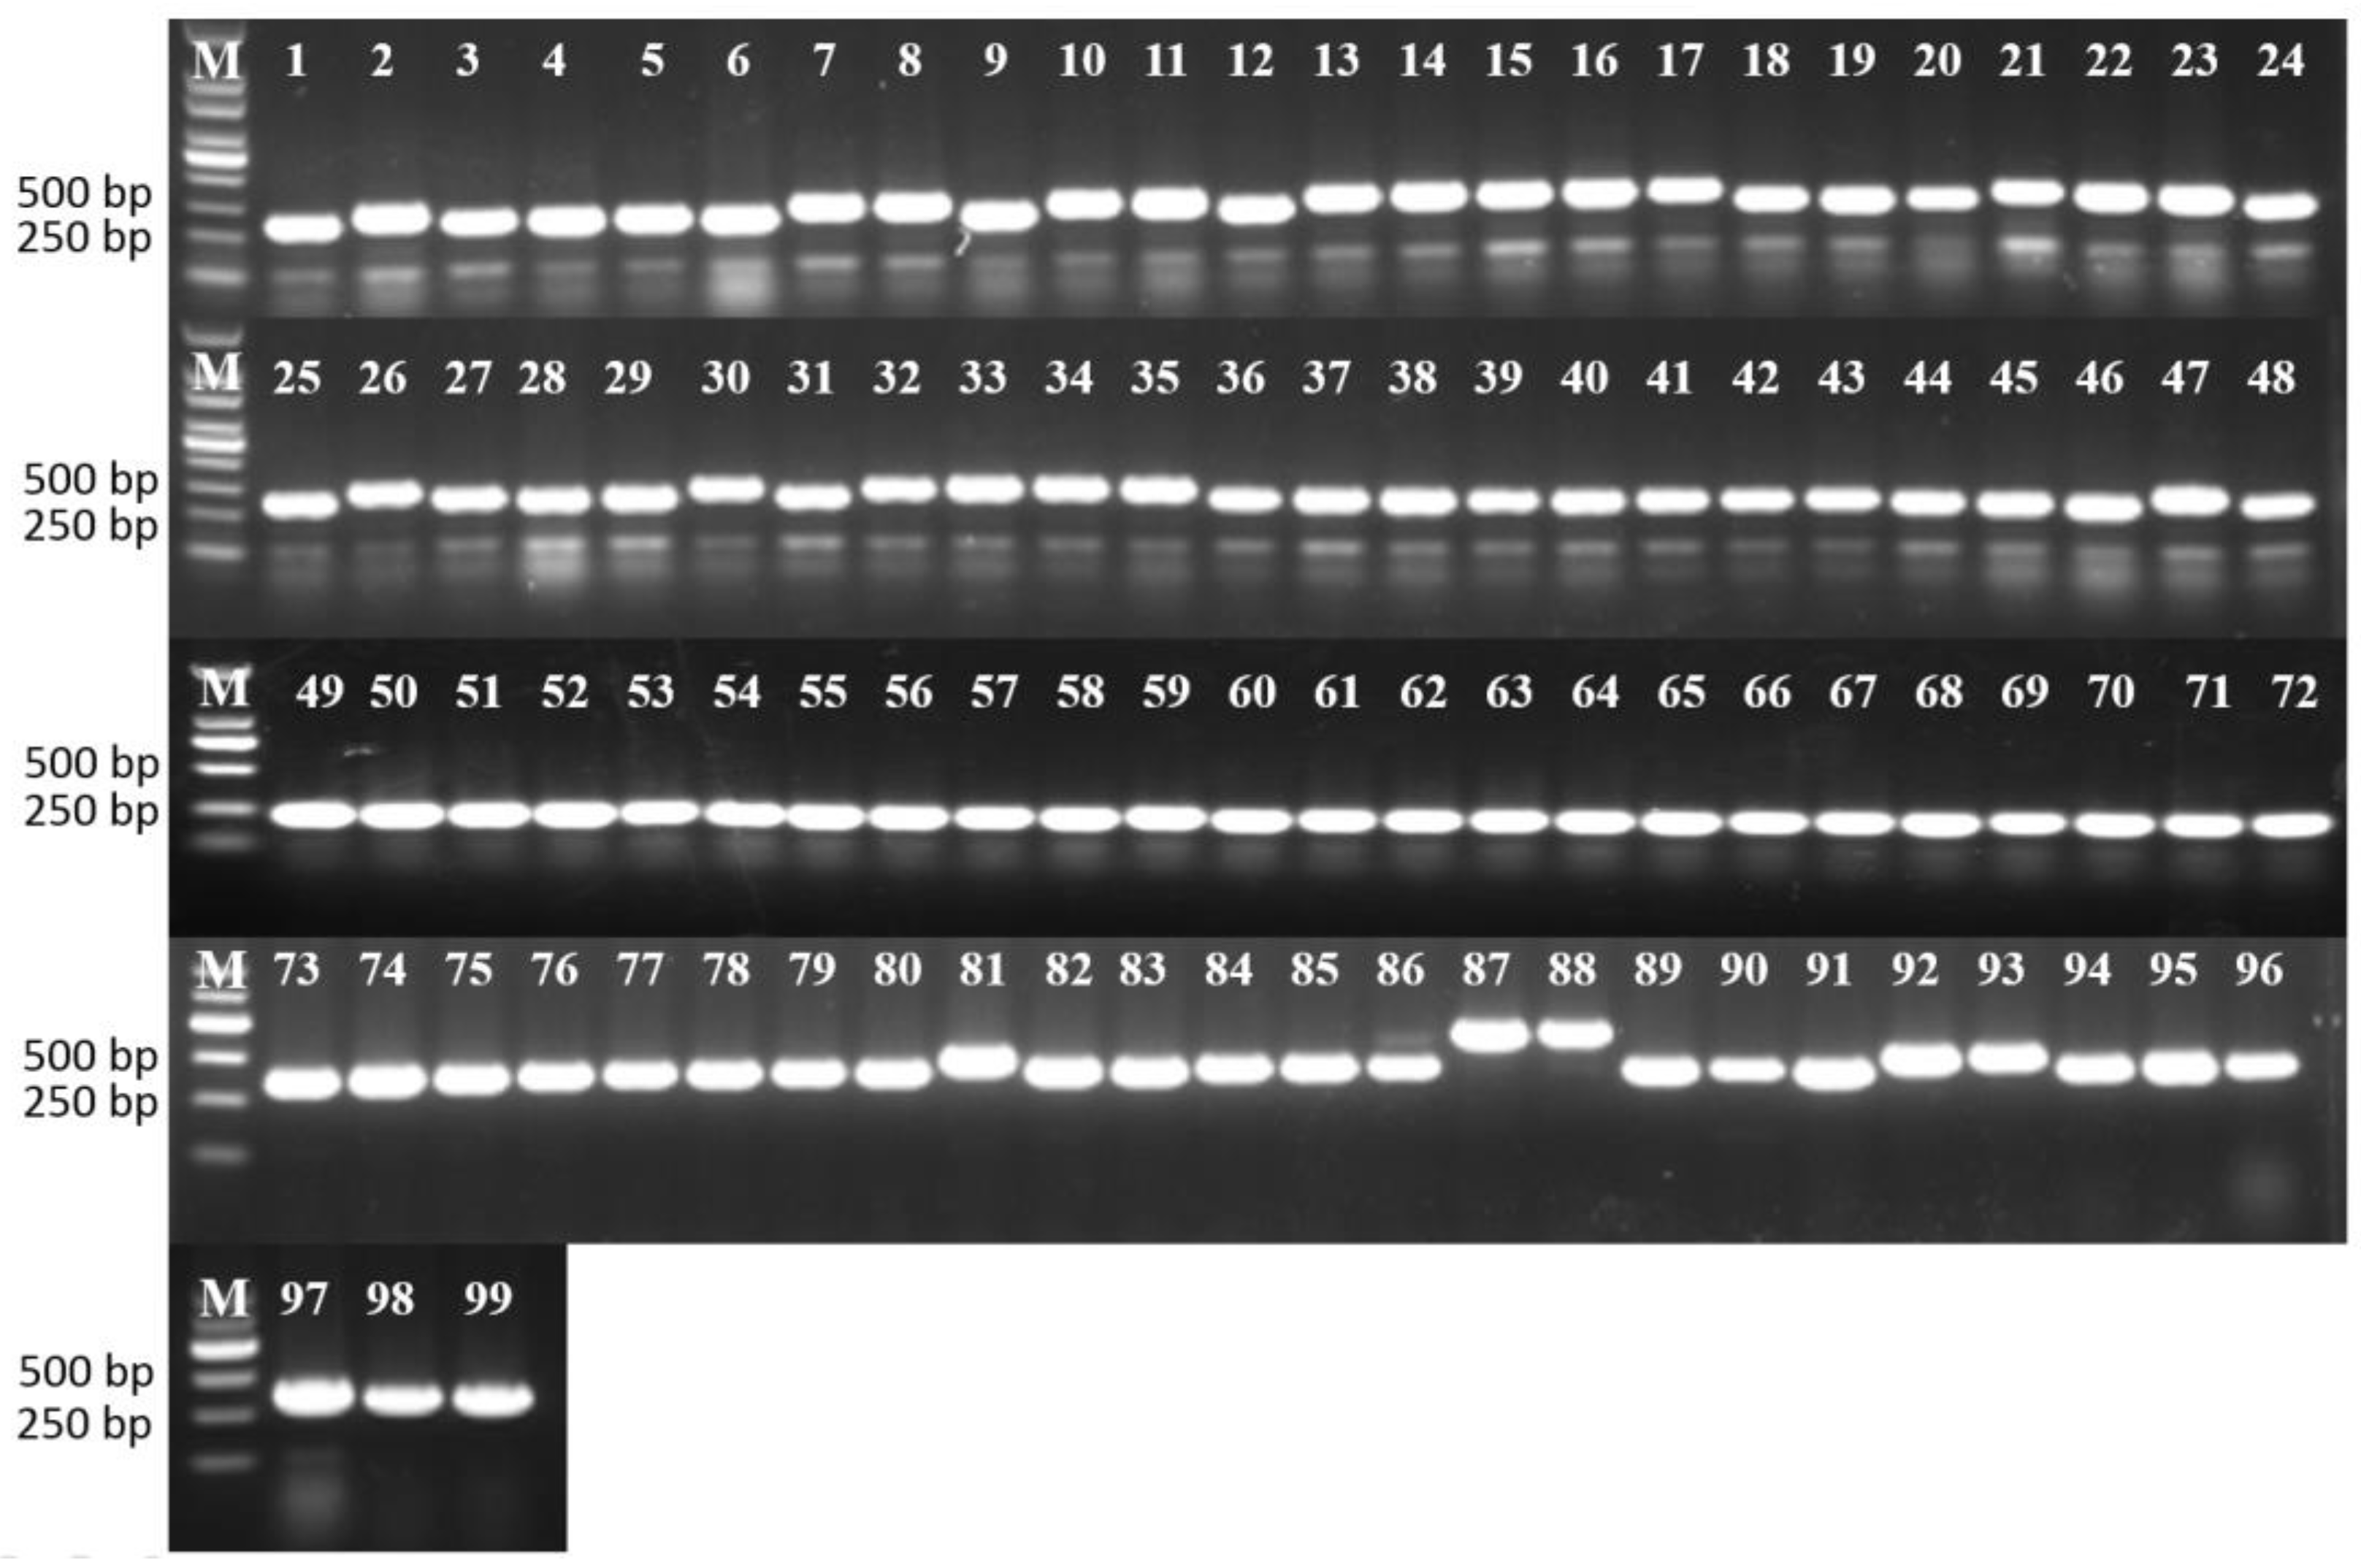
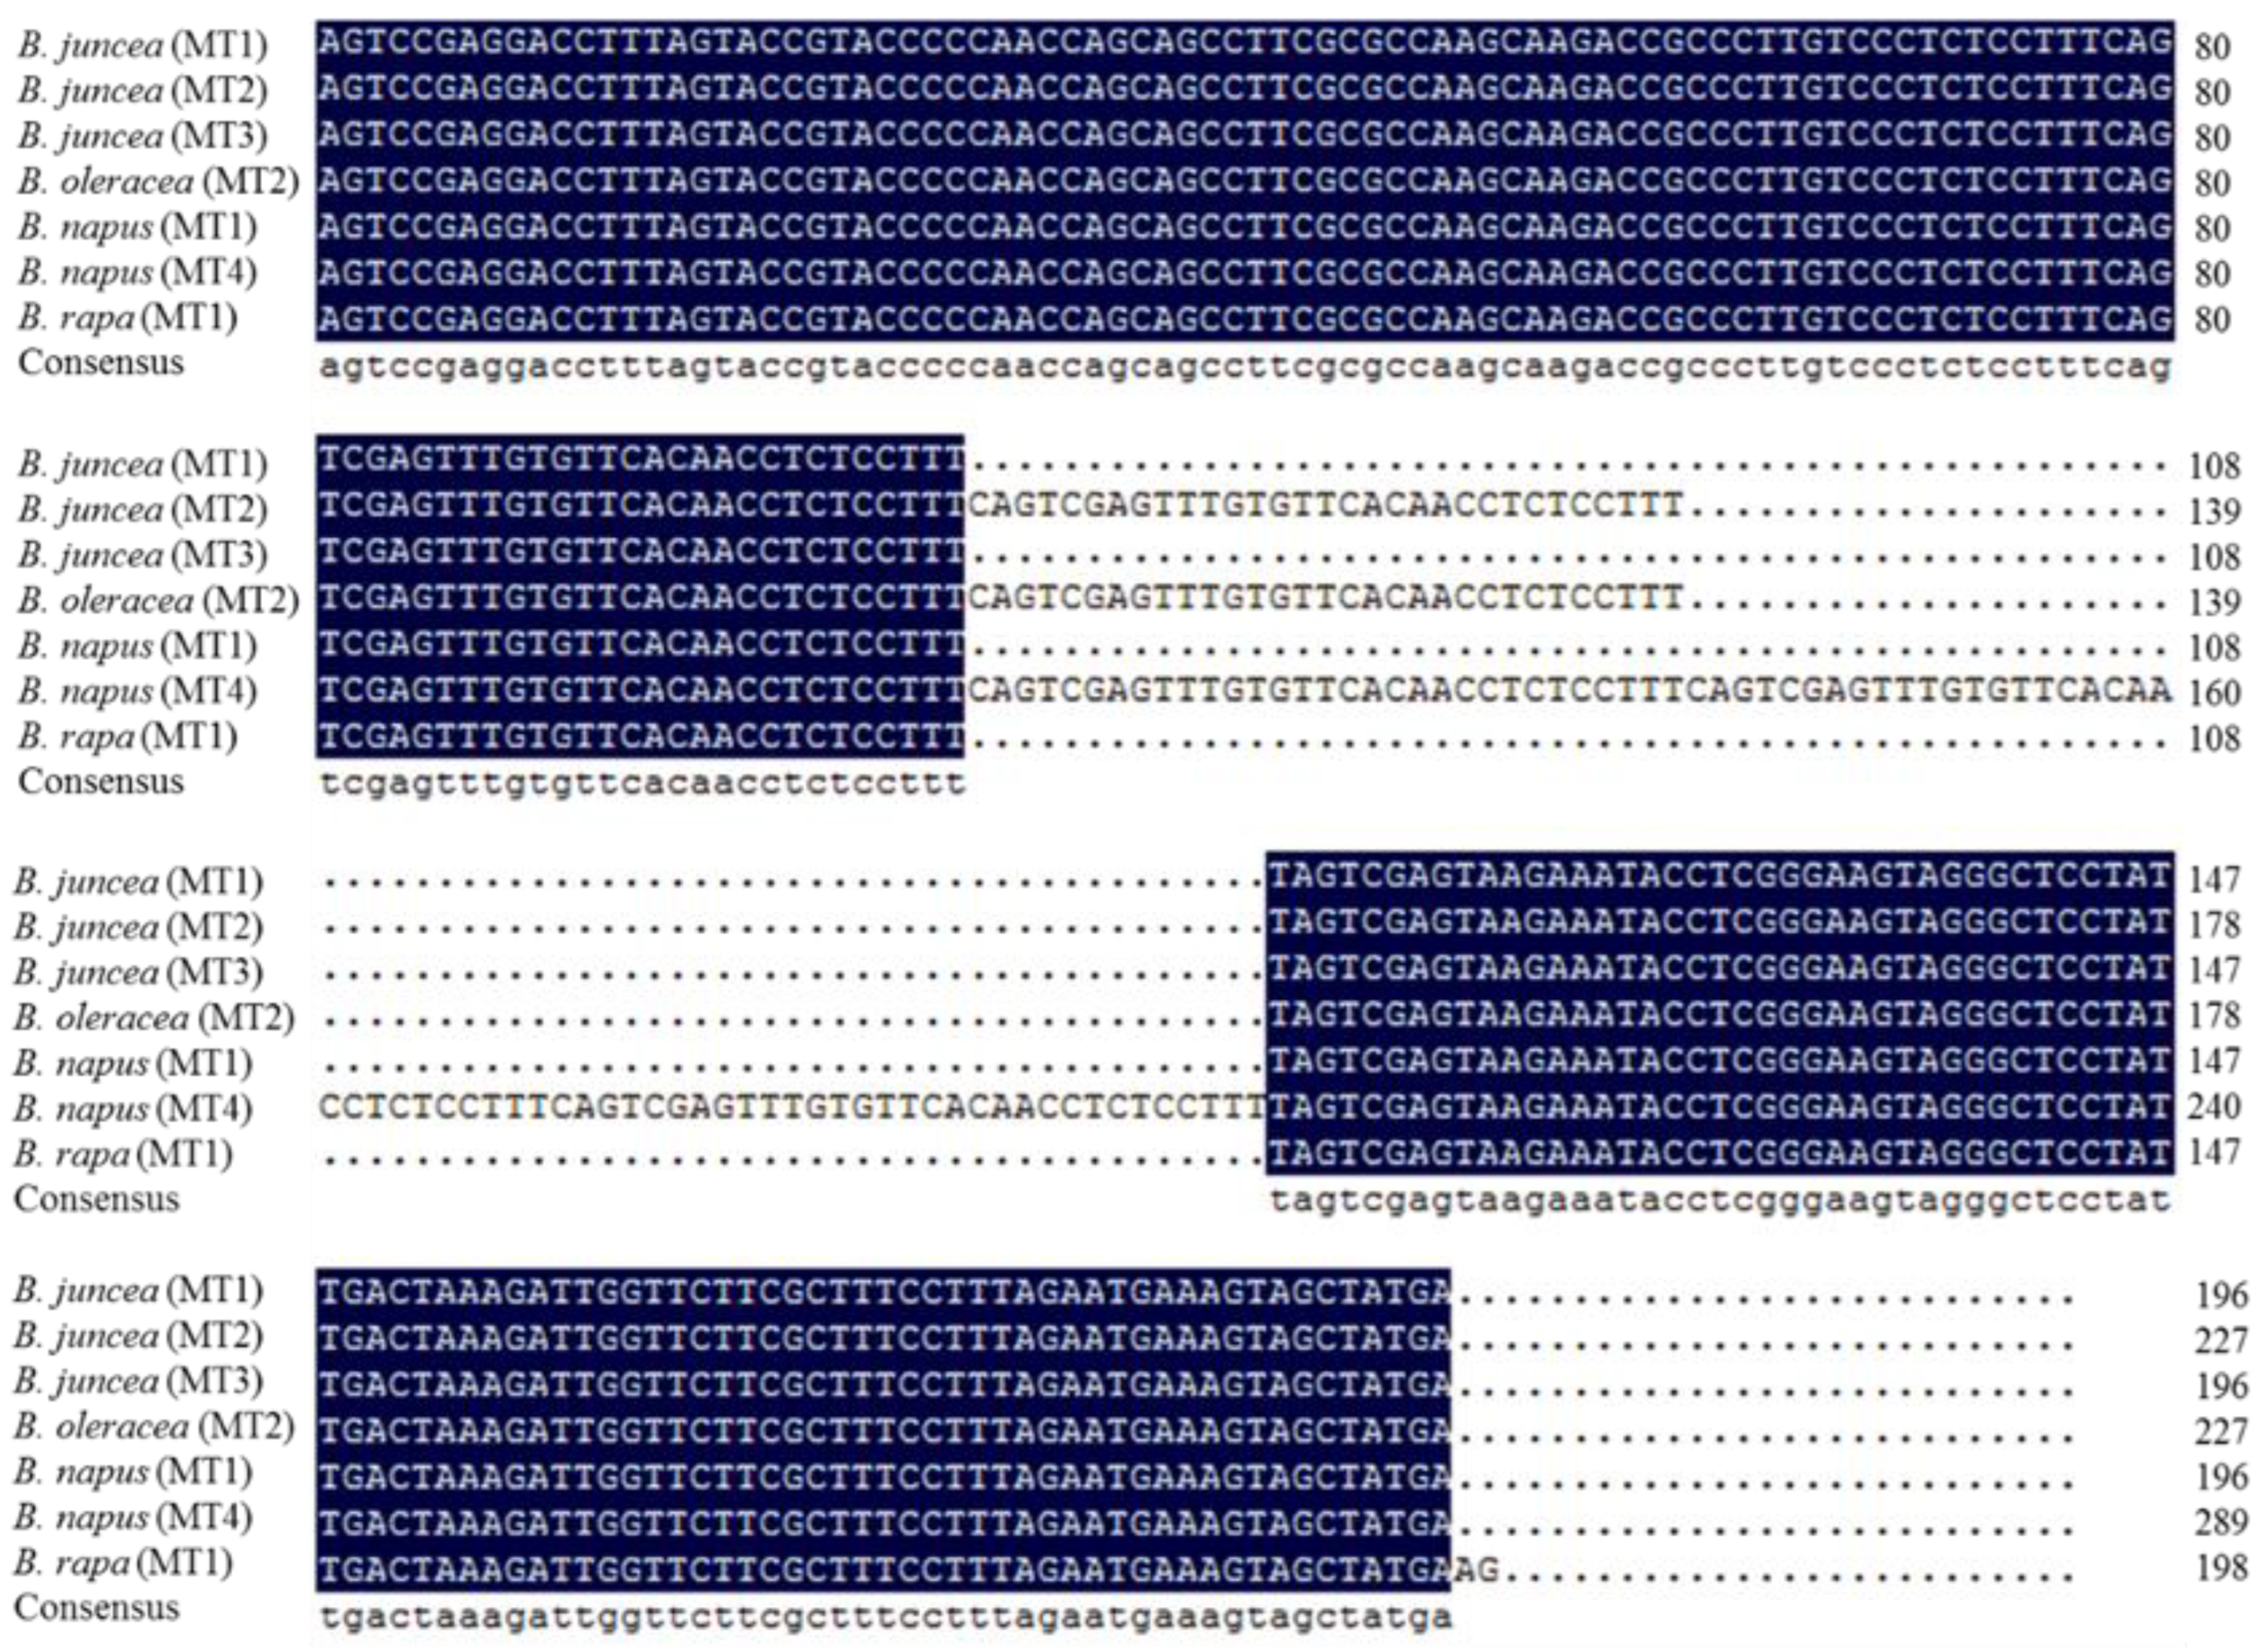
3.5. Analysis of the Cytoplasm Types by Mitochondrial Markers

Cytoplasm types of the tested accessions were analyzed on the basis of CMS-associated genes, Indel, and SNP located in the mitochondrial genome reported previously. In the first step, the improved multiplex PCR detection method, which included four pairs of primers (Table S5), was used to detect the cytoplasm type based on CMS-associated genes. As a result, the given cytoplasm type was associated with a specific combination of the respective PCR products (Figure 4) as previously reported [42,43]. Therefore, the modified multiplex PCR method could detect six cytoplasmic types (nap with orf222, pol A/Shaan 2A with orf224, ogu with orf138, ogu-NWSUAF with both orf222 and orf224, hau with orf288, and cam with a combination of 800- and 500-bp band) in one PCR reaction (Figure 4). The results showed that all the 84 B. juncea accessions had cam cytoplasm type. Among four accessions of B. napus, one (No. 86) had pol, one (No. 86) had cam, and two (Nos. 87 and 88) had nap type. Two accessions of B. rapa (Nos. 90 and 91) had cam type. Furthermore, the modified multiplex PCR method could detect unique band patterns in the tested B. oleracea, B. carinata, B. nigra, E. sativa, and I. indigotica accessions (Table S1, Figure S5).
In the second step, the mitotypes of the tested accessions were detected based on the InDel and SNP locus in B. juncea mitochondrial genome as reported previously [8,53]. First, the primer pair Indel-F/Indel-R (Table S6) amplified three different target bands of 251 bp (MT1/MT3), 282 bp (MT2), and 344 bp (MT4) in the tested materials (Figure 5). PCR products of some typical materials were sequenced and their sequences were aligned (Appendix S1, Figure 6).
Second, the primer pair SNP-F/SNP-R (Table S6) was used to amplify the materials with 251 bp (MT1/MT3) products in the above experiment. As a result, all these materials could amplify a band of 335 bp in length. Then, all the PCR products were subjected to sequencing to confirm the C-79573-A SNP locus (Appendix S1), with MT1 having C-79573, and MT3 having A-79573 [8]. The results showed that the oilseed mustard contained all three mitotypes, with 14 accessions having MT1, 20 accessions having MT2, and 16 accessions having MT3. Among the thirty four vegetable-type mustard accessions, eight accessions carried MT1, and twenty six accessions carried MT3. Except for the four root type accessions that carried MT1, and four leaf type accessions (Nos. 51–54, var. rugosa) that carried MT1 (Table S1 and Table 2).
In addition, the primer pair (Indel-F/Indel-R) could detect a unique band with 344 bp (MT4) in two B. napus accessions (Nos. 87 and 88) of nap cytoplasm, a band with 282 bp (MT2) in three B. oleracea accessions (Nos. 81, 93, and 94), and a band with 251 bp (MT1) in the remaining 10 Brassicaceae accessions (Figure 5 and Figure 6). Based on the results of the modified multiplex PCR, Indel, and SNP, among the four B. napus accessions, two (Nos. 87 and 88) had nap type (or MT4), one (No. 86) had pol type, and one (No. 86) had cam type. The two accessions of B. rapa (Nos. 90 and 91) had cam type. The three B. oleracea accessions (Nos. 81, 93, and 94) had Bol type. The two B. carinata and two B. nigra accessions had Bni type, and the one E. sativa had Esa type, and the one I. indigotica accession had In type.

4. Discussion

Genetic diversity analysis is the basic work for the effective management and utilization of plant genetic resources. B. juncea is an important crop, which includes oilseed and vegetable types [2,3,4]. In the present investigation, a panel of 99 accessions of the Brassicaceae family, including 84 mustard from 14 provinces in China and 15 other Brassicaceae accessions, was analyzed for their genetic diversity via nuclear and mitochondrial molecular markers. These 84 mustard accessions included 50 oilseed and 34 vegetable types of four subspecies in B. juncea [6]. The vegetable type included the eight most popular varieties of 16 subspecies reported in China [5,7]. The UPGMA cluster analysis based on the 232 polymorphic fragments produced by the 18 SSR, 20 SRAP, and 7 ISJ primers divided all accessions into three major clusters. Cluster I included 50 oilseed mustard, cluster II included 34 vegetable mustard, and cluster III contained 15 other Brassicaceae accessions. Cluster I and cluster II could be further divided into several subclusters. Generally, oilseed mustard accessions were clustered according to their resource, but selection has a certain effect, and vegetable mustard accessions were clustered according to their variety type. The results of principal component analysis and population structure analysis were in accordance with the cluster analysis. All the 84 mustard accessions have cam cytoplasm according to the improved multiplex PCR analysis, and have three mitotypes (MTs1-3) detected by the InDel and SNP markers associated with variations in the mitochondrial genome [8,53]. Our results indicated that there are considerable variations in the tested mustard accessions both at nuclear and cytoplasmic levels, and oilseed- and vegetable-mustards can be used for broadening the genetic background for each other.
To date, a few studies on the genetic relationships between oilseed and vegetable mustards have been carried out. Rabbani et al. [23] evaluated the genetic diversity and the relationships among a collection of 52 mustard accessions, including oilseed and vegetable types from Pakistan and Japan using RAPD markers. They indicated that the clusters formed by the oilseed collections and cultivars were distinct from those formed by the vegetable cultivars. Wu et al. [26] analyzed a collection of 95 mustard accessions (78 oil- and 17 vegetable-use) from China and abroad using SRAP markers. They showed that vegetable, spring oil, and winter oil mustard were clearly divided into three distinct groups, and the level of genetic diversity within vegetable mustard was considerably higher than the level within oil mustard. In the present study, we characterized 84 mustard accessions (50 oilseed and 17 vegetable types) from 14 provinces in China using three kinds of nuclear (SRAP, SSR, and ISJ) and mitochondrial molecular markers. Our results revealed that the genetic variation was 34.07% among populations and 65.93% within populations, which indicated the existence of considerable genetic variations among oilseed and vegetable B. juncea species (Table S7). The level of genetic diversity within vegetable mustard based on different types of molecular markers was similar to the one within oil mustard, and the pairwise difference value within oilseed mustard (59.62041) was similar to the one within vegetable mustard (52.81462) (Table 1). Our results were not fully consistent with the previous study [26], which might be attributed to different accessions and different molecular markers used in both studies.
Cytoplasm diversity analysis is also very important for plant breeding. DNA sequence variation located in the mitochondrial genome can be used to develop mitotype-specific molecular markers to exploit the cytoplasmic diversity in various crop plants. PCR markers based on different CMS causative genes had been developed for rapidly identifying cytoplasm in B. napus and B. rapa [42,62]. Heng et al. [43] identified 90 mitotype-specific sequences after comparative analysis of the six sequenced mitochondrial genomes (cam, nap, ole, pol CMS, ogu CMS, and hau CMS) in the Brassica genus. They developed 12 mitotype-specific markers and identified cytoplasm types of 570 different inbred lines across China. In the present study, we modified the original multiplex PCR assay by increasing one pair of primer specific to orf288 in hau CMS [42,43]. As a result, the modified multiplex PCR method could detect the six cytoplasmic types (nap, pol A/Shaan 2A, ogu, ogu-NWSUAF, hau, and cam) reported to date in one PCR reaction. However, all the 84 mustard accessions in China have cam cytoplasm. Fortunately, the modified multiplex PCR method could detect unique band patterns in the tested B. oleracea, B. carinata, B. nigra, E. sativa, and I. indigotica accessions, indicating that it could be exploited to identify the cytoplasm types of these Brassicaceae crops. Furthermore, based on the InDel and SNP loci in B. juncea mitochondrial genome [8,53], all the 84 B. juncea mitochondrial genomes were divided into three mitotypes (MTs1-3), with 22 accessions having MT1, 20 accessions having MT2, and 42 accessions having MT3. The 50 oilseed mustard accessions contained all three mitotypes. The 34 vegetable-type mustard accessions contained only two mitotypes (MT1 and MT3). Our results are generally consistent with those of Kang et al. [8] and You et al. [63]. Kang et al. [8] classified the MT genomes of 480 mustard accessions from 38 countries mainly into three types (MTs1-3) using the InDel and SNP loci [8,53]. In their study, 329 accessions of subspecies juncea contained three mitotypes [8]. All 14 accessions of subspecies tumida carried MT3. All 29 accessions of subspecies napiformis carried MT1. For subspecies integrifolia, one hundred and one of one hundred and eight accessions had MT3, one accession had MT1 (J301 from Anhui, China), and six accessions had Bra type. You et al. [63] further analyzed the mitotypes of a panel of 558 mustard accessions from 38 countries according to the InDel and SNP loci [8,53] and obtained similar results with those of Kang et al. [8]. In the present study, apart from the four root type accessions having MT1, four leaf type accessions also carried MT1 (Table 2 and Table S1). These four leaf type accessions (Nos. 51–54, var. rugosa) were collected from Ankang region in Shaanxi province, which is located in the Qinling-Bashan mountain, the border between the southern and northern China. The unique climate and geographical environment of this region have nurtured rich plant resources. Furthermore, in the present study, the primer pair (Indel-F/Indel-R) detected a unique band in two B. napus accessions (Nos. 87 and 88) of nap cytoplasm (Figure 5 and Figure 6), which is valuable for identification of cytoplasm type in B. napus accessions. In the future, an increasing number of uncharacterized mitochondrial genomes will be sequenced, and more mitotype-specific markers will be developed and used for identifying and differentiating different mitotypes in Brassica genus crops.
Intron-exon splice junction marker was first developed by Song et al. [46] and was found to be working well in cereals and other crops; however, to date, it has not been used in Brassica crops. In the present study, the three types of molecular markers (SRAP, SSR, and ISJ) could effectively detect the genetic differences among the tested accessions, with the ISJ markers being the most powerful one in terms of polymorphic information content, effective number of alleles, Nei’s gene diversity, and Shannon’s information index (Tables S2–S4).
In summary, our results indicated that there are considerable variations in terms of nuclear and cytoplasmic genomic levels in the tested Chinese mustard accessions, and oilseed- and vegetable-mustards can be used for broadening the genetic background for each other in the B. juncea breeding program.

Supplementary Materials

The following supporting information can be downloaded at: https://www.mdpi.com/article/10.3390/agronomy13030919/s1. Figure S1: PCR amplification of the tested accessions using the SRAP primer Em10Me24; M, marker; the accession numbers are shown in Table S1; Figure S2: PCR amplification of the tested accessions using the SSR primer BrgMS426; M, marker; the accession numbers are shown in Table S1; Figure S3: PCR amplification of the tested accessions using the ISJ primer R4; M, marker; the accession numbers are shown in Table S1; Figure S4: Ln probability of data [Ln P (D)] values for different K values; Figure S5: Results of multiplex PCR amplification for the tested accessions; M, marker; Table S1: The accession numbers; Table S2: Information of 20 pairs of sequence related amplified polymorphism (SRAP) primers; Table S3: Information of 18 pairs of simple sequence repeat (SSR) primers; Table S4: Information of seven intron-exon splice junction (ISJ) primers; Table S5: PCR primers used in the multiple PCR analysis; Table S6: Primers for analyzing the mitochondrial genome type; Table S7: Analysis of molecular variance of Brassica accessions in the present study. Appendix S1: Sequencing results of PCR products amplified by the Indel marker and the SNP marker.

Author Contributions

Conceptualization, S.H.; methodology, S.H.; software, D.Z.; validation, Y.G.; formal analysis, D.Z. and H.Y.; investigation, D.Z. and H.Y.; resources, S.H.; data curation, L.G. and J.W.; writing—original draft preparation, D.Z.; writing—review and editing, S.H.; visualization, L.G. and H.D.; supervision, S.H.; project administration, S.H.; funding acquisition, S.H. All authors have read and agreed to the published version of the manuscript.

Funding

This research was funded by the National Natural Science Foundation of China (grant number 3217150949), the Key Research and Development Project in Shaanxi Province of China (grant number 2022NY-153), and the Key Research and Development Projects of Yangling Seed Industry Innovation Center (YLzy-yc2021-01).

Data Availability Statement

Not applicable.

Acknowledgments

We thank Huixian Zhao, College of Life Sciences, Northwest A&F University; Zhaoxin Hu, Department of electrical and computer engineering, University of California San Diego for their suggestions in the course of preparing the manuscript. The hau CMS was kindly provided by Jinxiong Shen, Huazhong Agricultural University. We are also grateful to our anonymous reviewers for their thoughtful and detailed reviews.

Conflicts of Interest

The authors declare no conflict of interest.

References

  1. Nagaharu, U. Genome analysis in Brassica with special reference to the experimental formation of B. napus and peculiar mode of fertilization. Jpn. J. Bot. 1935, 7, 389–452. [Google Scholar]
  2. Pradhan, A.K.; Pental, D. Genetics of Brassica juncea. In Genetics and Genomics of the Brassicaceae, Plant Genetics and Genomics: Crops and Models; Schmidt, R., Bancroft, I., Eds.; Springer Science + Business Media: Berlin, Germany, 2011; pp. 323–345. [Google Scholar]
  3. Yang, J.; Liu, D.; Wang, X.; Ji, C.; Cheng, F.; Liu, B.; Hu, Z.; Chen, S.; Pental, D.; Ju, Y.; et al. The genome sequence of allopolyploid Brassica juncea and analysis of differential homoeolog gene expression influencing selection. Nat. Genet. 2016, 48, 1225–1232. [Google Scholar] [CrossRef]
  4. Yang, J.; Zhang, C.; Zhao, N.; Zhang, L.; Hu, Z.; Chen, S.; Zhang, M. Chinese root-type mustard provides phylogenomic insights into the evolution of the multi-use diversified allopolyploid Brassica juncea. Mol. Plant 2018, 11, 512–514. [Google Scholar] [CrossRef] [PubMed] [Green Version]
  5. Yang, Y.G.; Liu, N.C.; Chen, X.Q.; Chen, C.L.; Zhou, G.F.; Liao, K.L. A study on classification of mustard. Acta. Hortic. Sin. 1989, 16, 114–121. [Google Scholar]
  6. Gladis, T.; Hammer, K. The Brassica collection in gatersleben: Brassica juncea, Brassica napus, Brassica nigra and Brassica rapa. Feddes Rep. 1992, 103, 469–507. [Google Scholar] [CrossRef]
  7. Chen, C.L.; Zhou, G.F.; Yang, Y.G.; Chen, X.Q.; Liu, N.C. Distribution of Chinese mustard (Brassica juncea (L.) Coss). Southwest China J. Agric. Sci. 1990, 3, 17–21. [Google Scholar]
  8. Kang, L.; Qian, L.; Zheng, M.; Chen, L.; Chen, H.; Yang, L.; You, L.; Bin Yang, B.; Yan, M.; Gu, Y.; et al. Genomic insights into the origin, domestication and diversification of Brassica juncea. Nat. Genet. 2021, 53, 1392–1402. [Google Scholar] [CrossRef] [PubMed]
  9. Paritosh, K.; Yadava, S.K.; Singh, P.; Bhayana, L.; Mukhopadhyay, A.; Gupta, V.; Bisht, N.C.; Zhang, J.; Kudrna, D.A.; Copetti, D.; et al. A chromosome-scale assembly of allotetraploid Brassica juncea (AABB) elucidates comparative architecture of the A and B genomes. Plant Biotechnol. J. 2021, 19, 602–614. [Google Scholar] [CrossRef]
  10. Wang, X.W.; Wang, H.Z.; Wang, J.; Sun, R.; Wu, J.; Liu, S.; Bai, Y.; Mun, J.H.; Bancroft, I.; Cheng, F. The genome of the mesopolyploid crop species Brassica rapa. Nat. Genet. 2011, 43, 1035–1039. [Google Scholar] [CrossRef] [Green Version]
  11. Perumal, S.; Koh, C.S.; Jin, L.; Buchwaldt, M.; Higgins, E.E.; Zheng, C.; Sankoff, D.; Robinson, S.J.; Kagale, S.; Navabi, Z.-K.; et al. A high-contiguity Brassica nigra genome localizes active centromeres and defines the ancestral Brassica genome. Nat. Plants 2020, 6, 929–941. [Google Scholar] [CrossRef]
  12. Erickson, L.R.; Straus, N.A.; Beversdorf, W.D. Restriction patterns reveal origins of chloroplast genomes in Brassica amphiploids. Theor. Appl. Genet. 1983, 65, 201–206. [Google Scholar] [CrossRef] [PubMed]
  13. Palmer, J.D.; Shields, C.R.; Cohen, D.B.; Orton, T.J. Chloroplast DNA evolution and the origin of amphiploid Brassica species. Theor. Appl. Genet. 1983, 65, 181–189. [Google Scholar] [CrossRef] [PubMed]
  14. Li, P.; Zhang, S.; Li, F.; Zhang, S.; Zhang, H.; Wang, X.; Sun, R.; Bonnema, G.; Borm, T.J.A. A phylogenetic analysis of chloroplast genomes elucidates the relationships of the six economically important Brassica species comprising the triangle of U. Front. Plant Sci. 2017, 8, 111. [Google Scholar] [CrossRef] [PubMed] [Green Version]
  15. Vaughan, J.G.; Hemingway, J.S.; Schofield, H.J. Contributions to a study of variation in Brassica juncea Coss. & Czern. J. Linn. Soc. 1963, 58, 435–447. [Google Scholar]
  16. Song, K.M.; Osborn, T.C.; Williams, P.H. Brassica taxonomy based on nuclear restriction fragment length polymorphism (RFLPs). Theor. Appl. Genet. 1988, 76, 593–600. [Google Scholar] [CrossRef]
  17. Chen, S.; Wan, Z.; Nelson, M.N.; Chauhan, J.S.; Redden, R.; Burton, W.A.; Lin, P.; Salisbury, P.A.; Fu, T.; Cowling, W.A. Evidence from genome-wide simple sequence repeat markers for a polyphyletic origin and secondary centers of genetic diversity of Brassica juncea in China and India. J. Hered. 2013, 104, 416–427. [Google Scholar] [CrossRef] [Green Version]
  18. Kaur, P.; Banga, S.; Kumar, N.; Gupta, S.; Akhatar, J.; Banga, S.S. Polyphyletic origin of Brassica juncea with B. rapa and B. nigra (Brassicaceae) participating as cytoplasm donor parents in independent hybridization events. Am. J. Bot. 2014, 101, 1157–1166. [Google Scholar] [CrossRef]
  19. Vavilov, N.I. Phytogeographic basis of plant breeding. Chron. Bot. 1951, 13, 14–56. [Google Scholar]
  20. Saroj, R.; Soumya, S.L.; Singh, S.; Sankar, S.M.; Chaudhary, R.; Yashpal; Saini, N.; Vasudev, S.; Yadava, D.K. Unraveling the relationship between seed yield and yield-related traits in a diversity panel of Brassica juncea using multi-traits mixed model. Front. Plant. Sci. 2021, 12, 651936. [Google Scholar] [CrossRef]
  21. Nanjundan, J.; Aravind, J.; Radhamani, J.; Singh, K.H.; Kumar, A.; Thakur, A.K.; Singh, K.; Meena, K.N.; Tyagi, R.K.; Singh, D. Development of Indian mustard [Brassica juncea (L.) Czern.] core collection based on agro-morphological traits. Genet. Resour. Crop Evol. 2022, 69, 145–162. [Google Scholar] [CrossRef]
  22. Jain, A.; Bhatia, S.; Banga, S.S.; Prakash, S.; Lakshmikumaran, M. Potential use of random amplified polymorphic DNA (RAPD) technique to study the genetic diversity in Indian mustard (Brassica juncea) and its relationship to heterosis. Theor. Appl. Genet. 1994, 88, 116–122. [Google Scholar] [CrossRef]
  23. Rabbani, M.A.; Iwabuchi, A.; Murakami, Y.; Suzuki, T.; Takayanagi, K. Genetic diversity in mustard (Brassica juncea L.) germplasm from Pakistan as determined by RAPDs. Euphytica 1998, 103, 235–242. [Google Scholar] [CrossRef]
  24. Srivastava, A.; Gupta, V.; Pental, D.; Pradhan, A.K. AFLP-based genetic diversity assessment amongst agronomically important natural and some newly synthesized lines of Brassica juncea. Theor. Appl. Genet. 2001, 102, 193–199. [Google Scholar] [CrossRef]
  25. Qi, X.H.; Yang, J.H.; Zhang, M.F. AFLP-based genetic diversity assessment among Chinese vegetable mustards (Brassica juncea (L.) Czern.). Genet. Resour. Crop Evol. 2008, 55, 705–711. [Google Scholar] [CrossRef]
  26. Wu, X.-M.; Chen, B.-Y.; Lu, G.; Wang, H.-Z.; Xu, K.; Guizhan, G.; Song, Y. Genetic diversity in oil and vegetable mustard (Brassica juncea) landraces revealed by SRAP markers. Genet. Resour. Crop Evol. 2009, 56, 1011–1022. [Google Scholar] [CrossRef]
  27. Liu, H.H.; Hu, S.W. Genetic diversity of twenty-three Brassica juncea accessions based on isozyme markers. Acta. Agric. Boreali-occidentalis Sin. 2010, 19, 82–85, 106. [Google Scholar]
  28. Yao, Q.-L.; Chen, F.-B.; Fang, P.; Zhou, G.-F.; Fan, Y.-H.; Zhang, Z.-R. Genetic diversity of Chinese vegetable mustard (Brassica juncea Coss) landraces based on SSR data. Biochem. Syst. Ecol. 2012, 45, 41–48. [Google Scholar] [CrossRef]
  29. Singh, V.K.; Avtar, R.; Mahavir, K.N.; Kumar, R. Assessment of genetic diversity and population structure in Indian mustard (Brassica juncea L.) using SSR markers. J. Environ. Biol. 2021, 42, 396–405. [Google Scholar]
  30. Khan, M.A.; Rabbani, M.A.; Munir, M.; Ajmal, S.K.; Malik, M.A. Assessment of genetic variation with in Indian mustard (Brassica juncea) germplasm using random amplified polymorphic DNA markers. J. Integr. Plant Biol. 2008, 50, 385–392. [Google Scholar] [CrossRef] [PubMed]
  31. Li, R.G.; Zhu, L.; Wu, N.F.; Fan, Y.L.; Wu, X.M.; Qian, X.Z. Genetic diversity among oilseed cultivars of Brassica juncea Czern. et Coss in China. Biotechnol. Bull. 1997, 5, 26–31. [Google Scholar]
  32. An, X.H.; Chen, B.Y.; Fu, T.D.; Liu, H.L. Genetic diversity of Chinese landraces in Brassica napus was analysed by RAPD markers. J. Huazhong Agric. Univ. 1999, 18, 524–527. [Google Scholar]
  33. Pu, X.B.; Wang, M.L.; Li, L. Genetic diversity analysis of Brassica juncea L. and races in southwest China. Sci. Agric. Sin. 2007, 40, 1610–1621. [Google Scholar]
  34. Xu, A.X.; Ma, C.Z.; Xiao, E.S. Genetic diversity of Brassica juncea from western China. Acta. Agron Sin. 2008, 34, 754–763. [Google Scholar] [CrossRef]
  35. Song, W.L.; Xu, K.; Li, F.; Chen, B.; Cai, M.; Wu, J.; Wu, X. Genetic diversity of Brassica juncea from Tibet autonomous region of China. Chinese J. Oil Crop Sci. 2013, 35, 153–161. [Google Scholar]
  36. Qiao, A.M.; Liu, P.Y.; Lei, J.J. RAPD analysis of sixteen varieties of mustard. Acta. Bot. Sin. 1998, 40, 915–921. [Google Scholar]
  37. Fu, J.; Zhang, M.F.; Qi, X.H. Genetic diversity of traditional Chinese mustard crops Brassica juncea as revealed by phenotypic differences and RAPD markers. Genet. Resour. Crop Evol. 2006, 53, 1513–1519. [Google Scholar] [CrossRef]
  38. Song, M.; Liu, T.; Tang, Q.; Wang, Z.; Yang, Y.; Zhang, M. Genetic diversity analysis of mustard germplasm based on RAPD and ISSR. Acta. Hortic. Sin. 2009, 36, 835–842. [Google Scholar]
  39. Li, N.; Si, J.; Ren, X.; Song, H.; Li, C. SRAP analysis of mustard germplasm genetic diversity and genetic relationship. China Veg. 2014, 5, 26–33. [Google Scholar]
  40. Fang, P.; Chen, F.-B.; Yao, Q.-L.; Yang, K.-C.; Zhou, G.-F.; Fan, Y.-H.; Zhang, Z.-R.; Shen, J.-J.; Zhang, H. Analysis of genetic diversity in the tuber mustard (Brassica juncea var. tumida Tsen et Lee) in the Yangtze river basin of China. Genet. Resour. Crop Evol. 2013, 60, 129–143. [Google Scholar] [CrossRef]
  41. Sharma, D.; Nanjundan, J.; Singh, L.; Singh, S.P.; Parmar, N.; Kumar, M.S.S.; Singh, K.H.; Mishra, A.K.; Singh, R.; Verma, K.S.; et al. Genetic diversity in leafy mustard (Brassica juncea var. rugosa) as revealed by agro-morphological traits and SSR markers. Physiol Mol. Biol. Plants 2020, 26, 2005–2018. [Google Scholar] [CrossRef]
  42. Zhao, H.X.; Li, Z.J.; Hu, S.W.; Sun, G.L.; Chang, J.J.; Zhang, Z.H. Identification of cytoplasm types in rapeseed (Brassica napus L.) accessions by a multiplex PCR assay. Theor. Appl. Genet. 2010, 121, 643–650. [Google Scholar] [CrossRef]
  43. Heng, S.; Chen, F.; Wei, C.; Hu, K.; Yang, Z.; Wen, J.; Yi, B.; Ma, C.; Tu, J.; Si, P.; et al. Identification of different cytoplasms based on newly developed mitotype-specific markers for marker-assisted selection breeding in Brassica napus L. Plant Cell Rep. 2017, 36, 901–909. [Google Scholar] [CrossRef] [PubMed]
  44. Murray, M.G.; Thompson, W.F. Rapid isolation of high molecular weight plant DNA. Nucleic Acids Res. 1980, 8, 4321–4325. [Google Scholar] [CrossRef] [Green Version]
  45. Zhang, X.; Chen, H.; Channa, S.A.; Zhang, Y.; Guo, Y.; Klima, M.; Yu, F.; Hu, S. Genetic diversity in Chinese and exotic Brassica rapa L. accessions revealed by SSR and SRAP markers. Braz. J. Bot. 2017, 40, 973–982. [Google Scholar] [CrossRef]
  46. Song, W.N.; Langridge, P. Identification and mapping of polymorphisms in cereals based on the polymerase chain reaction. Theor. Appl. Genet. 1991, 82, 209–216. [Google Scholar]
  47. Bonhomme, S.; Budar, F.; Lancelin, D.; Small, I.; Defrance, M.-C.; Pelletier, G. Sequence and transcript analysis of the Nco2.5 ogura-specific fragment correlated with cytoplasmic male sterility in Brassica cybrids. Mol. Gen. Genet. 1992, 235, 340–348. [Google Scholar] [CrossRef]
  48. Grelon, M.; Budar, F.; Bonhomme, S.; Pelletier, G. Ogura cytoplasmic male-sterility (CMS)-associated orf138 is translated into a mitochondrial membrane polypeptide in male-sterility Brassica cybrids. Mol. Gen. Genet. 1994, 243, 540–547. [Google Scholar] [CrossRef]
  49. L’Homme, Y.; Stahl, R.J.; Li, X.-Q.; Hameed, A.; Brown, G.G. Brassica nap cytoplasmic male sterility is associated with expression of a mtDNA region containing a chimeric gene similar to the pol CMS-associated orf224 gene. Curr. Genet. 1997, 31, 325–335. [Google Scholar] [CrossRef]
  50. Singh, M.; Brown, G.G. Suppression of cytoplasmic male sterility by nuclear genes alters expression of a novel mitochondrial gene region. Plant cell 1991, 3, 1349–1362. [Google Scholar]
  51. L’Homme, Y.; Brown, G.G. Organizational differences between cytoplasmic male-sterile and male-fertile Brassica mitochondrial genomes are confined to a single transposed locus. Nucleic Acids Res. 1993, 21, 1903–1909. [Google Scholar] [CrossRef] [Green Version]
  52. Jing, B.; Heng, S.; Tong, D.; Wan, Z.; Fu, T.; Tu, J.; Ma, C.; Yi, B.; Wen, J.; Shen, J. A male sterility-associated cytotoxic protein ORF288 in Brassica juncea causes aborted pollen development. J. Exp. Bot. 2012, 63, 1285–1295. [Google Scholar] [CrossRef] [PubMed] [Green Version]
  53. Hatono, S.; Nishimura, K.; Murakami, Y.; Tsujimura, M.; Yamagishi, H. Complete mitochondrial genome sequences of Brassica rapa (Chinese cabbage and mizuna), and intraspecific differentiation of cytoplasm in B. rapa and Brassica juncea. Breed. Sci. 2017, 67, 357–362. [Google Scholar] [CrossRef] [PubMed] [Green Version]
  54. Sokal, R.R.; Michener, C.D. A statistical method for evaluating systematic relationships. Sci. Bull. 1958, 28, 1409–1438. [Google Scholar]
  55. Tang, Q.Y.; Zhang, C.X. Data processing system (DPS) software with experimental design, statistical analysis and data mining developed for use in entomological research. Insect Sci. 2013, 20, 254–260. [Google Scholar] [CrossRef]
  56. Kumar, S.; Stecher, G.; Li, M.; Knyaz, C.; Tamura, K. MEGA X: Molecular evolutionary genetics analysis across computing platforms. Mol. Biol. Evol. 2018, 35, 1547–1549. [Google Scholar] [CrossRef]
  57. Li, Y.L.; Han, G.M.; He, S.E.; Zhang, Z.J. A new strategy for construction of phylogenetic tree based on DNA molecular marker data. China J. Bioinform. 2008, 4, 168–170. [Google Scholar]
  58. Rohlf, F.J. NTSYS-pc, Numerical Taxonomy and Multivariate Analysis System, version 2.02g; Exeter Software: New York, NY, USA, 1998. [Google Scholar]
  59. Pritchard, J.K.; Stephens, M.; Donnelly, P. Inference of population structure using multilocus genotype data. Genetics 2000, 155, 945–959. [Google Scholar] [CrossRef] [PubMed]
  60. Excoffier, L.; Lischer, H.E.L. Arlequin suite ver 3.5: A new series of programs to perform population genetics analyses under linux and windows. Mol. Ecol. Resour. 2010, 10, 564–567. [Google Scholar] [CrossRef] [PubMed]
  61. Yeh, F.C.; Yang, R.C.; Boyle, T. POPGENE Version 1.32: Microsoft Window-Based Freeware for Population Genetic Analysis; Molecular Biology and Biotechnology Center, University of Alberta: Edmonton, AB, Canada, 1999. [Google Scholar]
  62. Zhang, R.J.; Hu, S.W.; Yan, J.Q.; Sun, G.L. Cytoplasmic diversity in Brassica rapa L. investigated by mitochondrial markers. Genet. Resour. Crop Evol. 2013, 60, 967–974. [Google Scholar] [CrossRef]
  63. You, L.; Yang, L.; Liu, F.Y.; Kang, L.; Chen, H.; Yang, B.; Yang, Q.; Liu, Z.S. Assembly and marker analysis of mitochondrial genomes provide insights into origin, evolution and spread of Brassica juncea (L.) Czern. et Coss. Crop J. 2022, 10, 611–616. [Google Scholar] [CrossRef]
Figure 1. Cluster dendrogram of the 99 tested accessions constructed by simple sequence repeat, sequence related amplified polymorphism, and intron-exon splice junction molecular markers. The accession numbers are shown in Table S1. Different colored diagrams represent different species or subspecies of the Brassicaceae family, the red background stands for oilseed mustard (Group I); the orange background stands for vegetable mustard (Group II); and the turquoise background stands for references (Group III); different colored branches represent different subgroups.
Agronomy 13 00919 g001
Figure 2. Biplot of the first two major principal components extracted from simple sequence repeat, sequence related amplified polymorphism, and intron-exon splice junction molecular markers data. The accession numbers are shown in Table S1. Different colored diagrams represent different species or subspecies of the Brassicaceae family.
Agronomy 13 00919 g002
Figure 3. Population structure of the 99 tested accessions suggested by structure analysis (K = 5). Five colors represent five inferred groups (G I~G V). Each bar represents each accession. The estimated genetic fraction of each accession of each inferred group is indicated in different colors. The numbers under each bar are the accession numbers in Table S1.
Agronomy 13 00919 g003
Figure 4. The electrophoresis patterns of PCR products amplified with four pairs of primers for genes orf288 (1401 bp), orf222 (1102 bp), orf224 (747 bp), orf138 (465 bp). M, marker; lane 1, hau cytoplasm with orf288; lane 2, nap cytoplasm with orf222; lane 3, pol cytoplasm with orf224; lane 4, ogu CMS cytoplasm with orf138; lane 5, ogu-NWSUAF CMS cytoplasm; lane 6, cam cytoplasm; lane 7, No. 81 (Brassica oleracea); lane 8, No. 92 (B. oleracea); lane 9, No. 93 (B. oleracea); lane 10, No. 94 (B. carinata); lane 11, No. 95 (B. carinata); lane 12, No. 96 (B. nigra); lane 13, No. 97 (B. nigra); lane 14, No. 98 (Eruca sativa Mill); lane 15, No. 99 (Isatis indigotica Fort), respectively.
Agronomy 13 00919 g004
Figure 5. PCR amplification of the tested accessions using the Indel marker. M, marker; the accession numbers are shown in Table S1.
Agronomy 13 00919 g005
Figure 6. Sequence alignment of PCR products yielded by the Indel marker. B. juncea (MT1), Nos. 4 and 9; B. juncea (MT2), Nos. 13, 14, 15, and 16; B. juncea (MT3), Nos. 3, 12, 57, and 58; B. oleracea (MT2), No. 81; B. napus (MT1), Nos. 86, 89, and 90; B. napus (MT4), Nos. 87 and 88; B. rapa (MT1), No. 91. Blue areas represent the same base sequence.
Agronomy 13 00919 g006
Table 1. Population average pairwise differences.
Oilseed MustardVegetable MustardOther Brassicaceae
Oilseed mustard59.62041
Vegetable mustard32.1342552.81462
Other Brassicaceae31.5446535.97280105.84762
Diagonal elements, average number of pairwise differences within population (PiX). Below diagonal, corrected average pairwise difference (PiXY − (PiX + PiY)/2).
Table 2. Summary of mitochondrial type of Brassica juncea accessions in the present study.
Subspecies aVariety bMitochondrial Type c
MT1MT2MT3
junceagracilis142016
integrifoliarugosa409
crassicauli001
gemmifera002
involuta005
strumata003
multiceps002
napiformismegarrhiza400
Tumidatumida004
Total 222042
a, Brassica juncea are classified into four subspecies according to Gladis and Hammer [6]; b, B. juncea are classified into 16 varieties according to Yang et al. [5]; c, the mitochondrial genome types of B. juncea are classified into three mitotypes according to Kang et al. [8].
Disclaimer/Publisher’s Note: The statements, opinions and data contained in all publications are solely those of the individual author(s) and contributor(s) and not of MDPI and/or the editor(s). MDPI and/or the editor(s) disclaim responsibility for any injury to people or property resulting from any ideas, methods, instructions or products referred to in the content.

