

Effects of Goat Manure Fertilization on Grain Nutritional Value in Two Contrasting Quinoa (Chenopodium quinoa Willd.) Varieties Cultivated at High Altitudes
 , , , ,
  and
and
Abstract
:1. Introduction
2. Material and Methods
2.1. Plant Material, Field Experiment, and Treatments
2.2. Grain Yield
2.3. Total Protein and Amino Acid Contents
2.4. Soluble Sugar Content
2.5. Oil Content and Fatty Acid Profile
2.6. Mineral Content
2.7. Statistical Analysis
3. Results
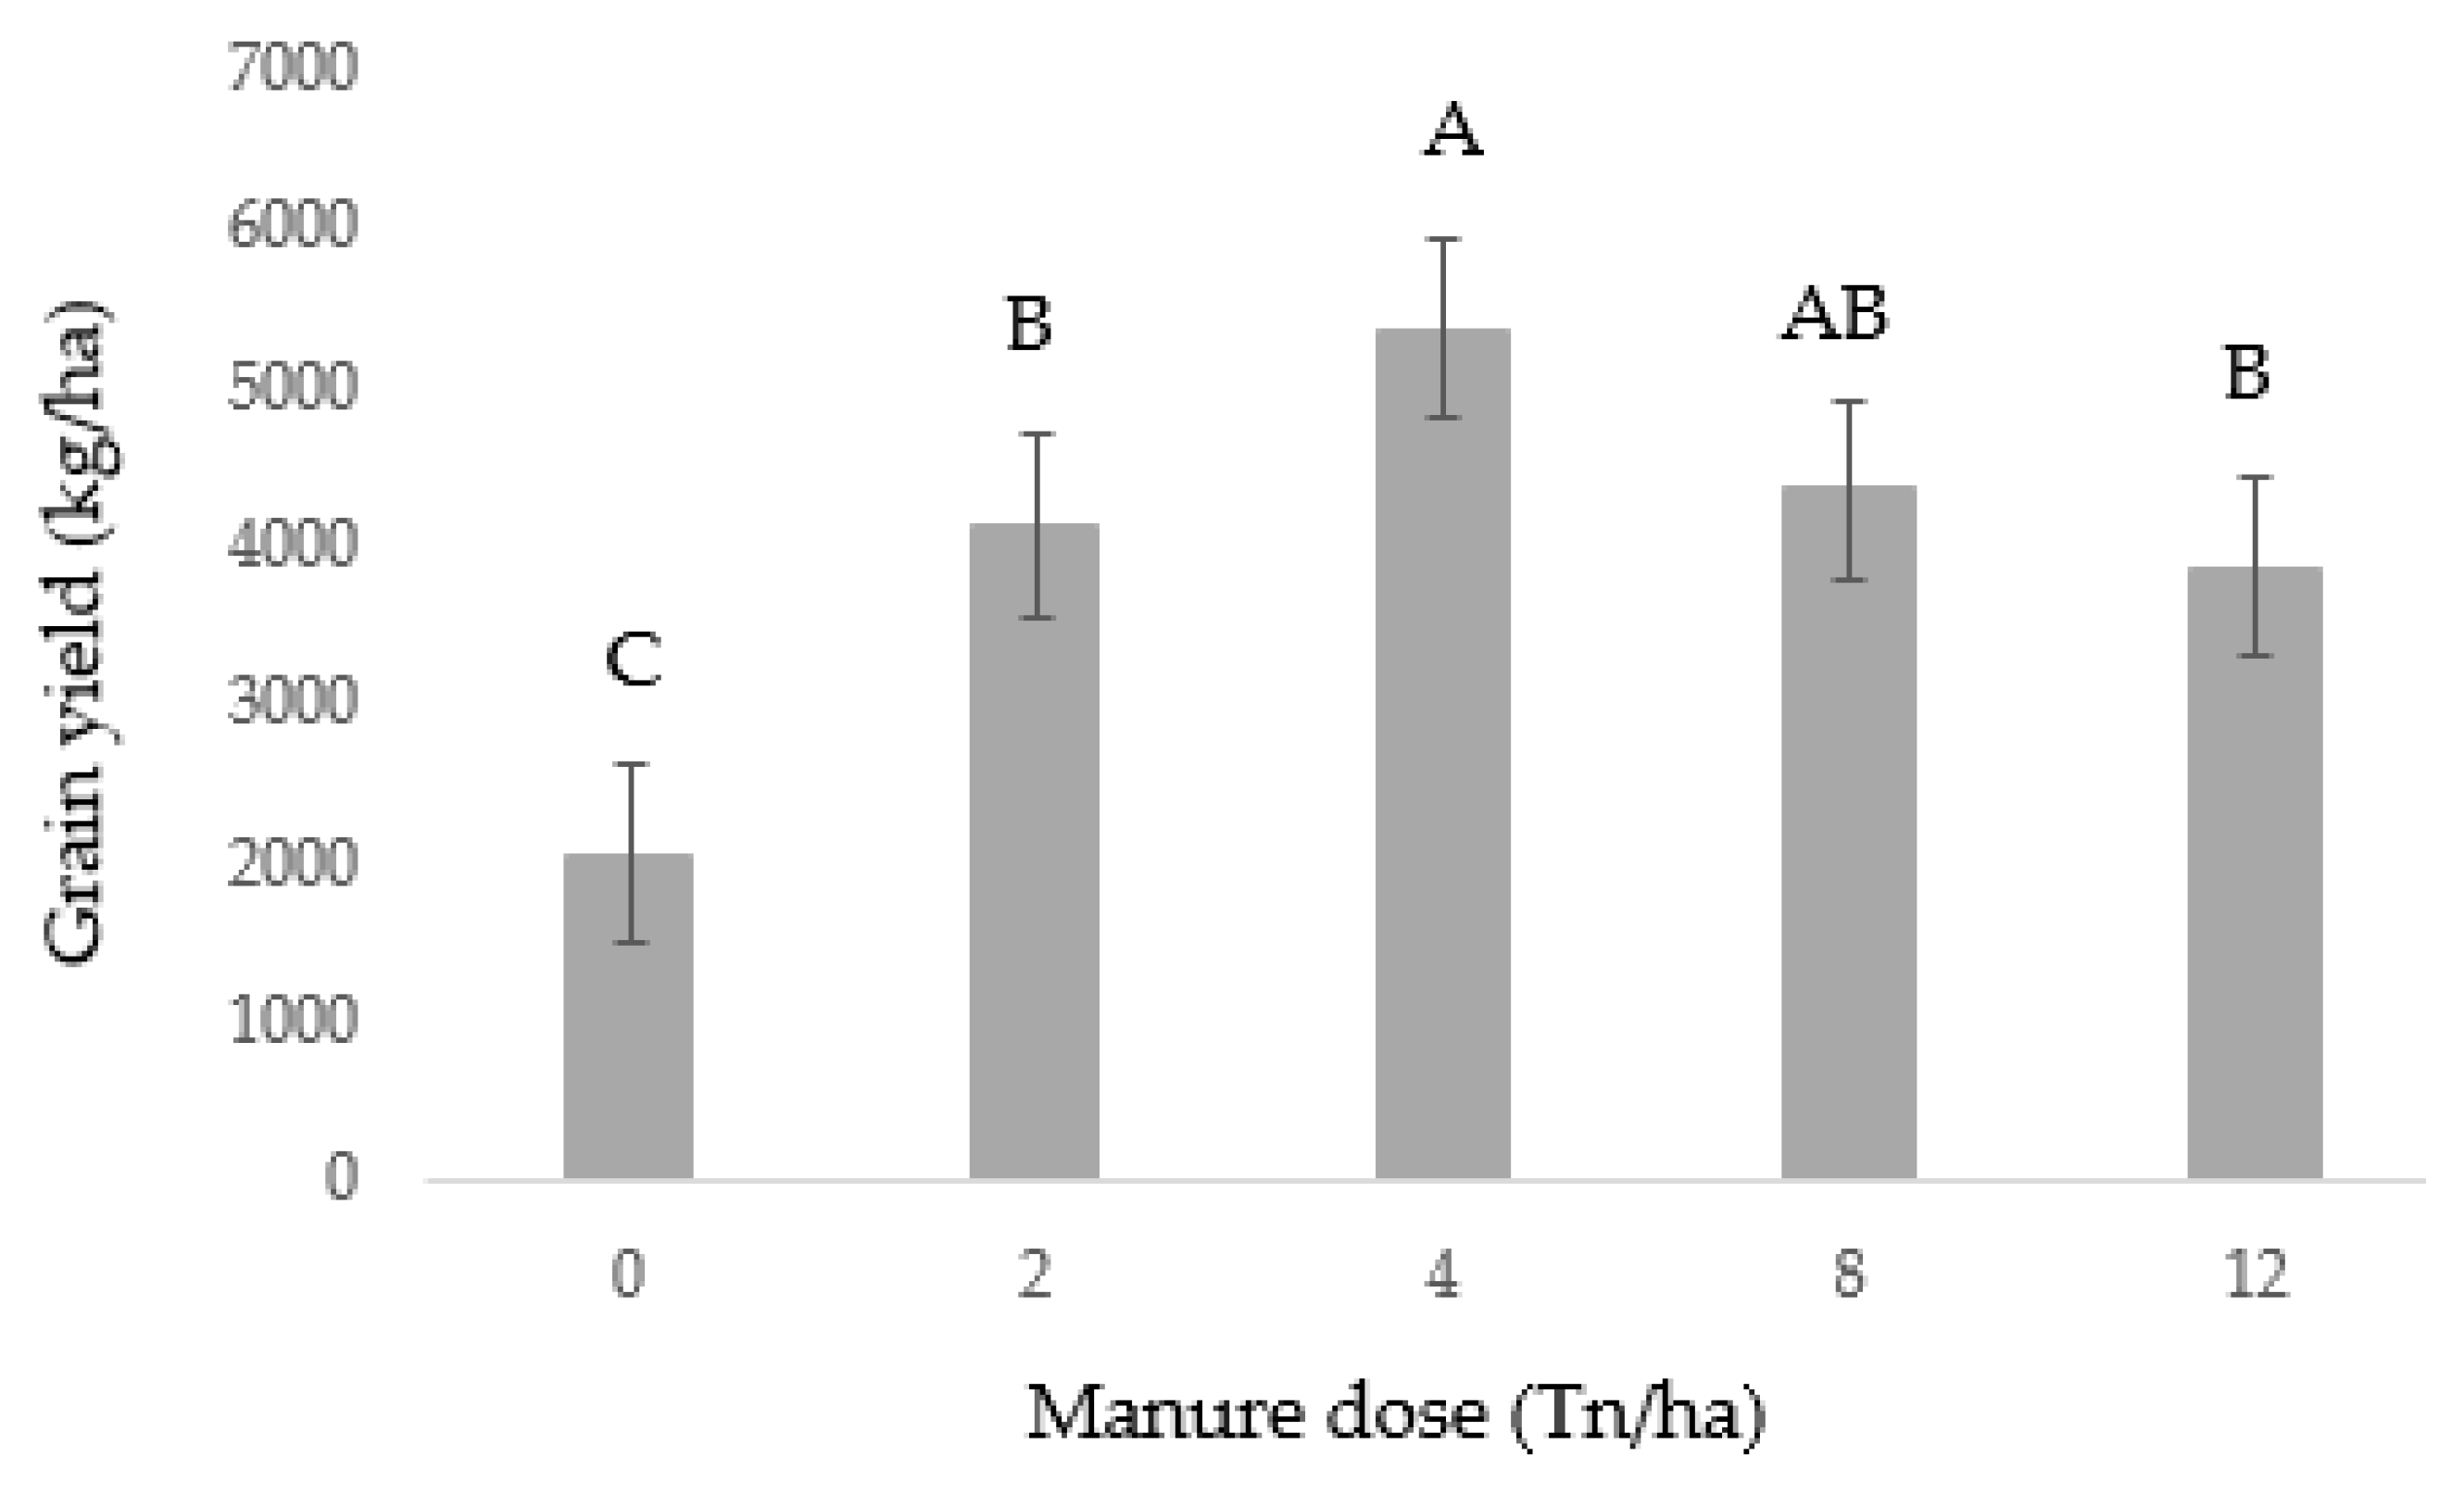
3.1. Grain Yield
3.2. Total Protein and Amino Acid Contents
3.3. Soluble Sugar Content
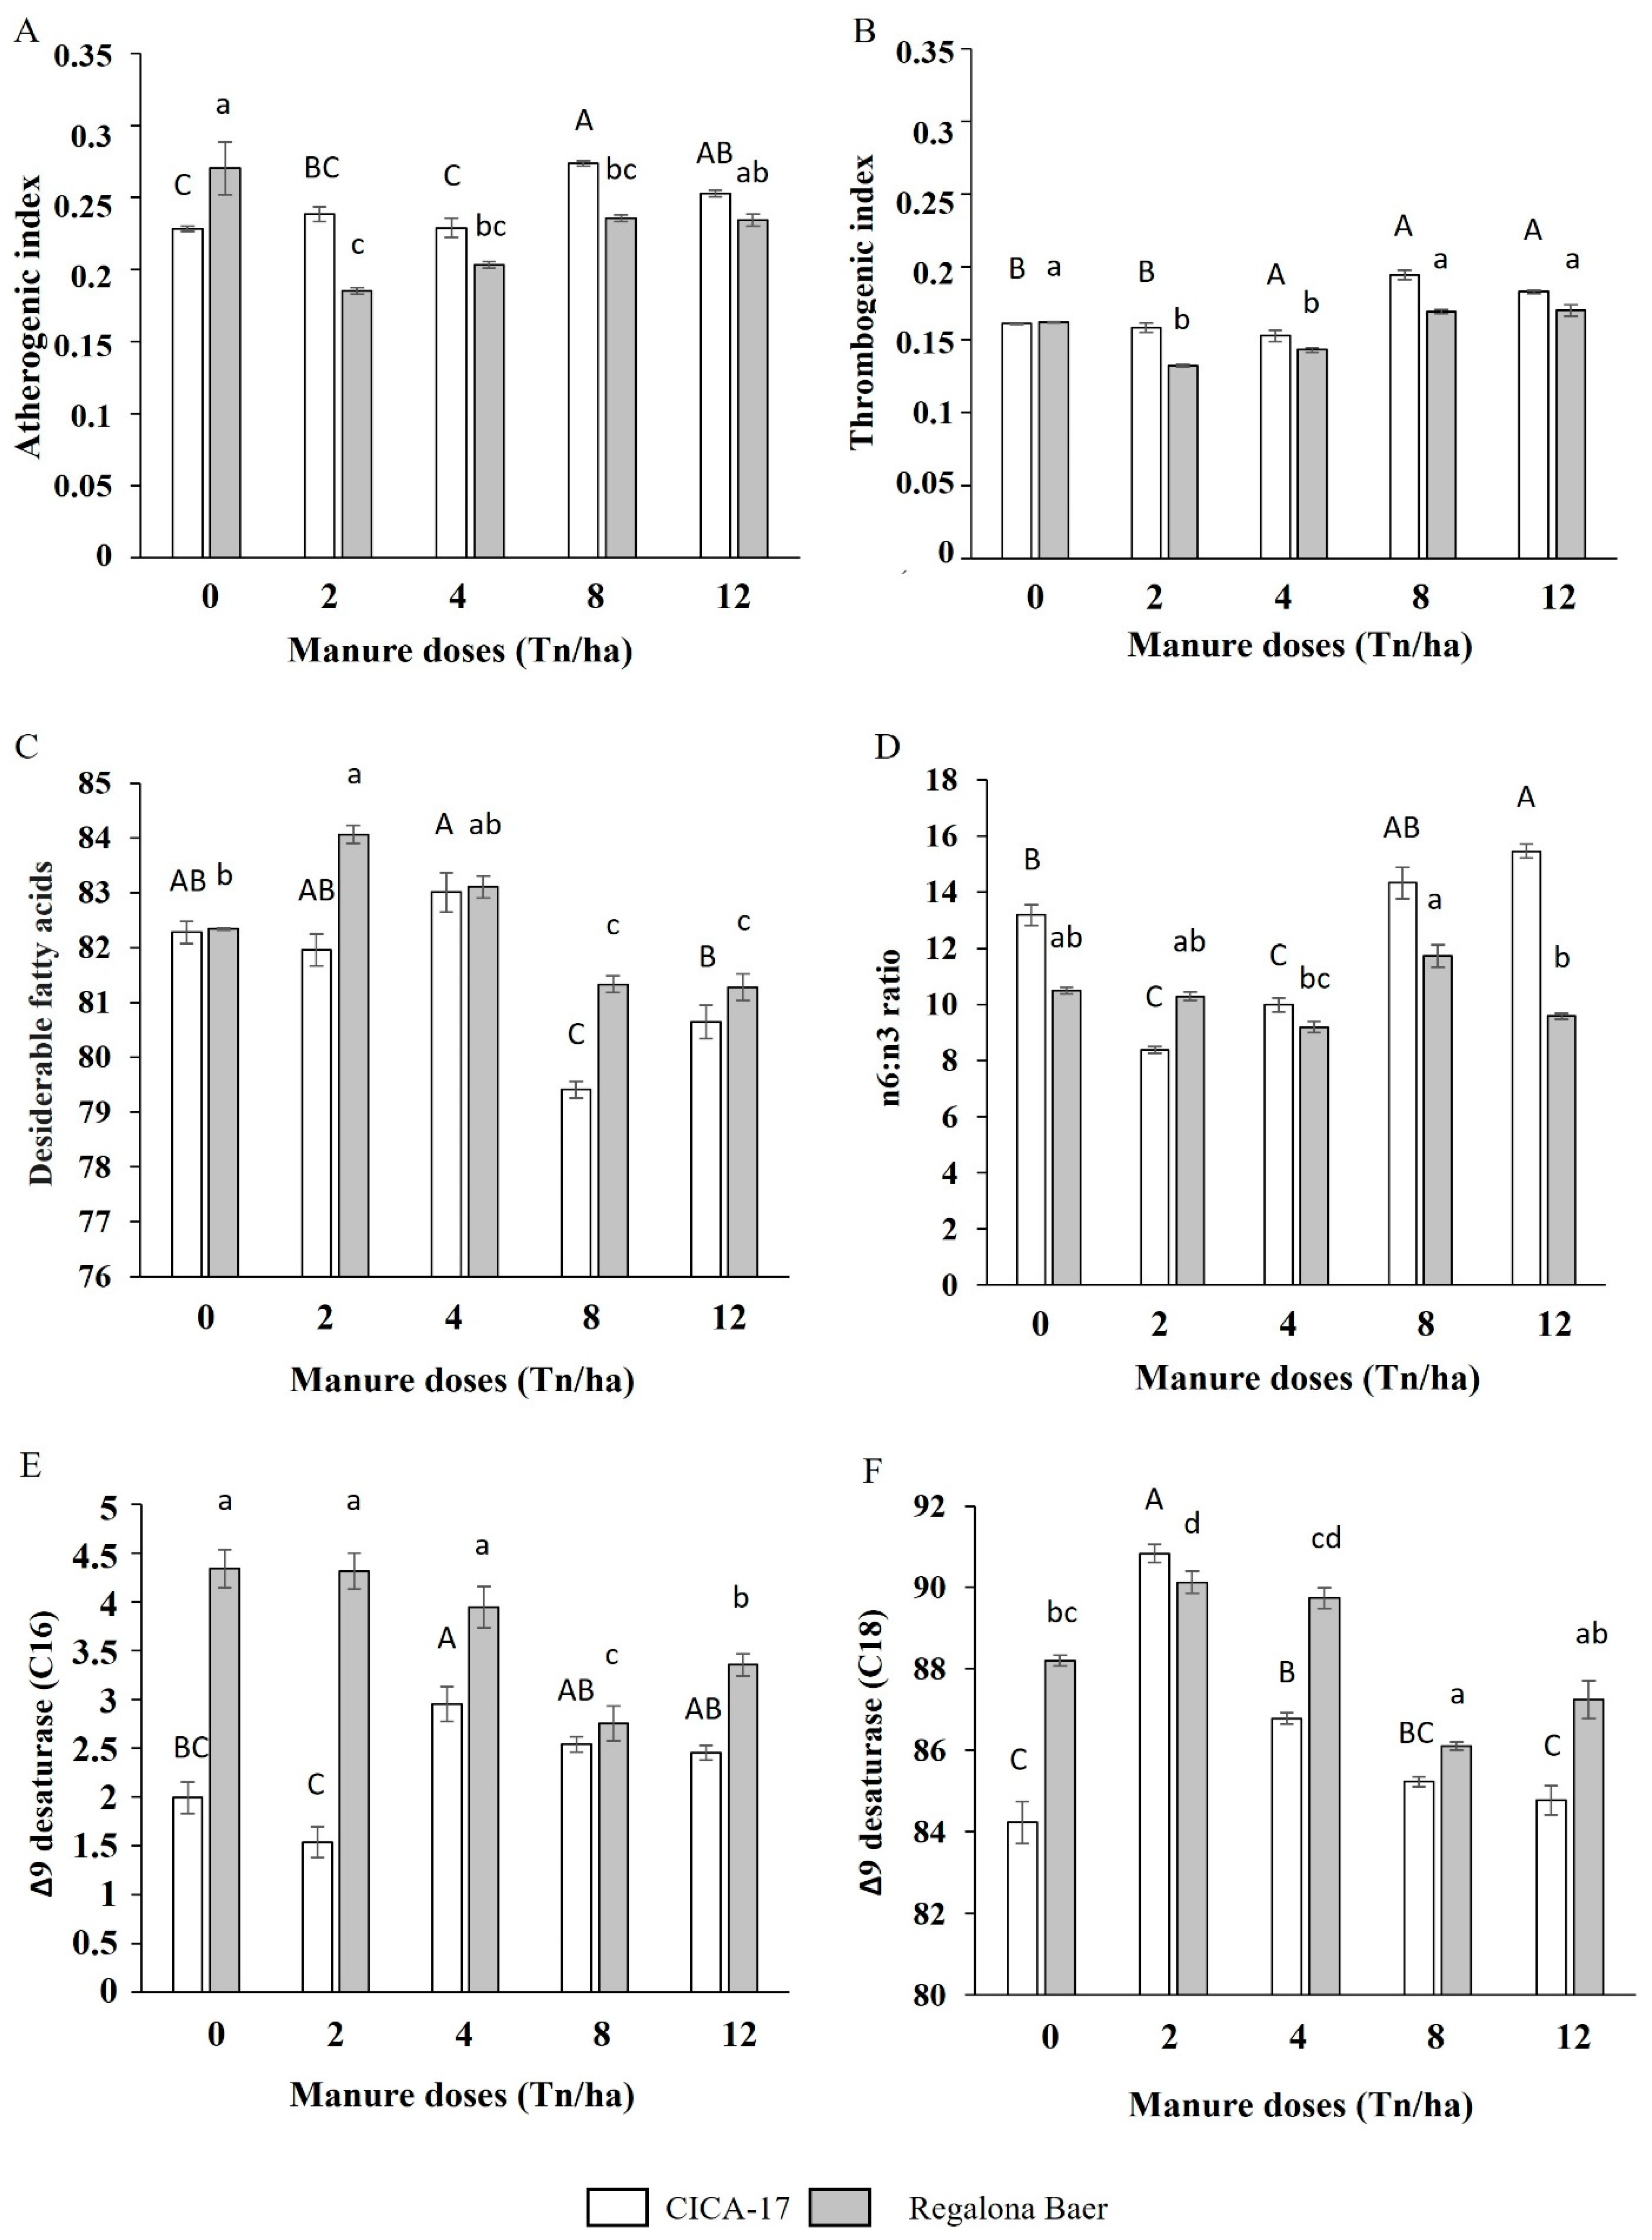
3.4. Oil Content and Fatty Acids Profile
3.5. Mineral Content
4. Discussion
4.1. Grain Yield
4.2. Protein and Amino Acid Profile
4.3. Soluble Sugar Content
4.4. Oil Content and Fatty Acid Profile
4.5. Ash and Mineral Content
5. Conclusions
Author Contributions
Funding
Institutional Review Board Statement
Informed Consent Statement
Data Availability Statement
Acknowledgments
Conflicts of Interest
References
- Graf, B.L.; Rojas-Silva, P.; Rojo, L.E.; Delatorre-Herrera, J.; Baldeón, M.E.; Raskin, I. Innovations in health value and functional food development of quinoa (Chenopodium quinoa Willd.). Compr. Rev. Food Sci. Food Saf. 2015, 14, 431–445. [Google Scholar] [CrossRef] [Green Version]
- Bazile, D.; Baudron, F. The dynamics of the global expansion of quinoa growing in view of its high biodiversity In State of the art report of quinoa in the world in 2013. FAO CIRAD 2015, 42–45. [Google Scholar]
- González, J.A.; Konishi, Y.; Bruno, M.; Valoy, M.; Prado, F.E. Interrelationships among seed yield, total protein and amino acid composition of ten quinoa (Chenopodium quinoa) cultivars from two different agroecological regions. J. Sci. Food Agric. 2012, 92, 1222–1229. [Google Scholar] [CrossRef] [PubMed]
- González, J.A.; Roldán, A.; Gallardo, M.; Escudero, T.; Prado, F.E. Quantitative determinations of chemical compounds with nutritional value from inca crops: Chenopodium quinoa (“quinoa”). Plant Foods Hum. Nutr. 1989, 39, 331–337. [Google Scholar] [CrossRef] [PubMed]
- Prado, F.E.; González, J.A.; Gallardo, M.; Morris, M.; Boero, C.; Kortsarz, A. Changes in soluble carbohydrates and invertase activity in Chenopodium quinoa (“quinoa”) developed for saline stress during germination. Plant Physiol. 1995, 14, 1–5. [Google Scholar]
- Prado, F.E.; Fernandez-Turiel, J.-L.; Tsarouchi, M.; Psaras, G.K.; González, J.A. Variation of Seed Mineral Concentrations in Seven Quinoa Cultivars Grown in Two Agroecological Sites. Cereal Chem. 2014, 91, 453–459. [Google Scholar] [CrossRef] [Green Version]
- Yawadio Nsimba, R.; Kikuzaki, H.; Konishi, Y. Antioxidant activity of various extracts and fractions of Chenopodium quinoa and Amaranthus spp. seeds. Food Chem. 2008, 106, 760–766. [Google Scholar] [CrossRef]
- Tang, Y.; Li, X.; Chen, P.X.; Zhang, B.; Hernandez, M.; Zhang, H.; Marcone, M.F.; Liu, R.; Tsao, R. Characterisation of fatty acid, carotenoid, tocopherol/tocotrienol compositions and antioxidant activities in seeds of three Chenopodium quinoa Willd. genotypes. Food Chem. 2015, 174, 502–508. [Google Scholar] [CrossRef]
- Angeli, V.; Miguel Silva, P.; Crispim Massuela, D.; Khan, M.W.; Hamar, A.; Khajehei, F.; Graeff-Hönninger, S.; Piatti, C. Quinoa (Chenopodium quinoa Willd.): An Overview of the Potentials of the “Golden Grain” and Socio-Economic and Environmental Aspects of Its Cultivation and Marketization. Foods 2020, 9, 216. [Google Scholar] [CrossRef] [Green Version]
- Repo-Carrasco, R.; Espinoza, C.; Jacobsen, S.-E. Nutritional Value and Use of the Andean Crops Quinoa (Chenopodium quinoa) and Kañiwa (Chenopodium pallidicaule). Food Rev. Int. 2003, 19, 179–189. [Google Scholar] [CrossRef]
- Rojas, W.; Pinto, M. Ex Situ Conservation of Quinoa: The Bolivian Experience In Quinoa: Improvement and Sustainable Production; John Wiley & Sons, Inc.: HHoboken, NJ, USA, 2015; pp. 125–160. [Google Scholar] [CrossRef]
- Abdelhamid, A.; Martin, N.; Bridges, C.; Brainard, J.S.; Wang, X.; Brown, T.J.; Hanson, S.; Jimoh, O.F.; Ajabnoor, S.; Deane, K.H.; et al. Polyunsaturated fatty acids for the primary and secondary prevention of cardiovascular disease. Cochrane Database Syst. Rev. 2018, 7, CD012345. [Google Scholar] [CrossRef]
- Gillingham, L.G.; Harris-Janz, S.; Jones, P.J.H. Dietary Monounsaturated Fatty Acids Are Protective Against Metabolic Syndrome and Cardiovascular Disease Risk Factors. Lipids 2011, 46, 209–228. [Google Scholar] [CrossRef]
- Shama, S.; Liu, W. Omega-3 Fatty Acids and Gut Microbiota: A Reciprocal Interaction in Nonalcoholic Fatty Liver Disease. Dig. Dis. Sci. 2020, 65, 906–910. [Google Scholar] [CrossRef] [PubMed] [Green Version]
- Simopoulos, A. An Increase in the Omega-6/Omega-3 Fatty Acid Ratio Increases the Risk for Obesity. Nutrients 2016, 8, 128. [Google Scholar] [CrossRef] [PubMed] [Green Version]
- González, J.A.; Eisa, S.; Hussin, S.; Prado, F.E. Quinoa: An Incan crop to face global changes in agriculture. In Quinoa: Improvement and Sustainable Production; Murphy, K.S., Matanguihan, J., Eds.; Wiley-Blackwell; John Wiley & Sons, Inc: Hoboken, NJ, USA, 2015; pp. 1–18. [Google Scholar]
- Tapia, M.E.; Mujica-Sanchez, A.; Canahua, A. Origen, Distribución Geográfica y Sistemas de Producción de la Quinua; I Reunión sobre genética y fitomejoramiento de la quinua: San jose, Costa Rica, 1980. [Google Scholar]
- Jarvis, D.E.; Ho, Y.S.; Lightfoot, D.J.; Schmöckel, S.M.; Li, B.; Borm, T.J.A.; Ohyanagi, H.; Mineta, K.; Michell, C.T.; Saber, N.; et al. The genome of Chenopodium quinoa. Nature 2017, 542, 307–312. [Google Scholar] [CrossRef] [PubMed] [Green Version]
- Curti, R.N.; del Carmen Sanahuja, M.; Vidueiros, S.M.; Curti, C.A.; Pallaro, A.N.; Bertero, H.D. Oil quality in sea-level quinoa as determined by cultivar-specific responses to temperature and radiation conditions. J. Sci. Food Agric. 2019, 100, 1358–1361. [Google Scholar] [CrossRef]
- González, J.A.; Bruno, M.; Valoy, M.; Prado, F.E. Genotypic Variation of Gas Exchange Parameters and Leaf Stable Carbon and Nitrogen Isotopes in Ten Quinoa Cultivars Grown under Drought. J. Agron. Crop. Sci. 2010, 197, 81–93. [Google Scholar] [CrossRef]
- Eisa, S.E.; El-Samad, E.H.; Hussin, S.A.; Ali, E.A.; Ebrahim, M.; González, J.A.; Ordano, M.; Erazzú, L.E.; El-Bordeny, N.E.; Abdel-Ati, A.A. Quinoa in Egypt—Plant Density Effects on Seed Yield and Nutritional Quality in Marginal Regions. Middle East J. Appl. Sci. 2018, 08, 515–522. [Google Scholar]
- Bilalis, D.; Kakabouki, I.; Karkanis, A.; Travlos, I.; Triantafyllidis, V.; Hela, D. Seed and Saponin Production of Organic Quinoa (Chenopodium quinoa Willd.) for different Tillage and Fertilization. Not. Bot. Horti Agrobot. Cluj-Napoca 2012, 40, 42–46. [Google Scholar] [CrossRef] [Green Version]
- Alandia, G.; Jacobsen, S.-E.; Kyvsgaard, N.C.; Condori, B.; Liu, F. Nitrogen Sustains Seed Yield of Quinoa Under Intermediate Drought. J. Agron. Crop. Sci. 2016, 202, 281–291. [Google Scholar] [CrossRef]
- Martínez, E.A.; Veas, E.; Jorquera, C.; Martín, R.S.; Jara, P. Re-Introduction of Quínoa into Arid Chile: Cultivation of Two Lowland Races under Extremely Low Irrigation. J. Agron. Crop. Sci. 2009, 195, 1–10. [Google Scholar] [CrossRef]
- Hirich, A.; Choukr-Allah, R.; Jacobsen, S.-E. Deficit Irrigation and Organic Compost Improve Growth and Yield of Quinoa and Pea. J. Agron. Crop. Sci. 2014, 200, 390–398. [Google Scholar] [CrossRef]
- Ramzani, P.M.A.; Shan, L.; Anjum, S.; Khan, W.-U.; Ronggui, H.; Iqbal, M.; Virk, Z.A.; Kausar, S. Improved quinoa growth, physiological response, and seed nutritional quality in three soils having different stresses by the application of acidified biochar and compost. Plant Physiol. Biochem. 2017, 116, 127–138. [Google Scholar] [CrossRef] [PubMed]
- Bonifacio, A. Chenopodium Sp.: Genetic Resources, Ethnobotany, and Geographic Distribution. Food Rev. Int. 2003, 19, 1–7. [Google Scholar] [CrossRef]
- Alandia, G.; Rodriguez, J.P.; Jacobsen, S.E.; Bazile, D.; Condori, B. Global expansion of quinoa and challenges for the Andean region. Glob. Food Secur. 2020, 26, 100429. [Google Scholar] [CrossRef]
- Ju, X.-T.; Xing, G.-X.; Chen, X.-P.; Zhang, S.-L.; Zhang, L.-J.; Liu, X.-J.; Cui, Z.-L.; Yin, B.; Christie, P.; Zhu, Z.-L.; et al. Reducing environmental risk by improving N management in intensive Chinese agricultural systems. Proc. Natl. Acad. Sci. USA 2009, 106, 3041–3046. [Google Scholar] [CrossRef] [Green Version]
- Tilman, D.; Balzer, C.; Hill, J.; Befort, B.L. Global food demand and the sustainable intensification of agriculture. Proc. Natl. Acad. Sci. USA 2011, 108, 20260–20264. [Google Scholar] [CrossRef] [Green Version]
- Almadini, A.M.; Badran, A.E.; Algosaibi, A.M. Evaluation of Efficiency and Response of Quinoa Plant to Nitrogen Fertilization levels. Middle East J. Appl. Sci. 2019, 09, 839–849. [Google Scholar] [CrossRef]
- Bascuñán-Godoy, L.; Sanhueza, C.; Pinto, K.; Cifuentes, L.; Reguera, M.; Briones, V.; Zurita-Silva, A.; Álvarez, R.; Morales, A.; Silva, H. Nitrogen physiology of contrasting genotypes of Chenopodium quinoa Willd. (Amaranthaceae). Sci. Rep. 2018, 8, 17524. [Google Scholar] [CrossRef] [Green Version]
- Jacobsen, S.-E.; Jørgensen, I.; Stølen, O. Cultivation of quinoa (Chenopodium quinoa) under temperate climatic conditions in Denmark. J. Agric. Sci. 1994, 122, 47–52. [Google Scholar] [CrossRef]
- Schulte auf’m Erley, G.; Kaul, H.-P.; Kruse, M.; Aufhammer, W. Yield and nitrogen utilization efficiency of the pseudocereals amaranth, quinoa, and buckwheat under differing nitrogen fertilization. Eur. J. Agron. 2005, 22, 95–100. [Google Scholar] [CrossRef]
- Gonzalez-Dugo, V.; Durand, J.-L.; Gastal, F. Water deficit and nitrogen nutrition of crops. A review. Agron. Sustain. Dev. 2010, 30, 529–544. [Google Scholar] [CrossRef] [Green Version]
- Issa Ali, O.; Fghire, R.; Anaya, F.; Benlhabib, O.; Wahbi, S. Physiological and Morphological Responses of two Quinoa Cultivars (Chenopodium quinoa Willd.) to Drought Stress. Gesunde Pflanz. 2019, 71, 123–133. [Google Scholar] [CrossRef]
- Batjes, N.H. A world dataset of derived soil properties by FAO UNESCO soil unit for global modelling. Soil Use Manag. 1997, 13, 9–16. [Google Scholar] [CrossRef]
- Chapman, H.D.; Pratt, P.F. Methods of Analysis for Soils, Plants and Waters; Berkeley University: Berkeley, CA, USA, 1961. [Google Scholar]
- Prasad, K. HPLC Analysis of Amino Acid and Antioxidant Composition of Three Medicinal Plants of (Pithoragarh) Uttarakhand Himalayas. J. Anal. Pharm. Res. 2017, 6, 1–8. [Google Scholar] [CrossRef]
- Prado, F.E.; González, J.A.; Boero, C.; Sampietro, A.R. A Simple and Sensitive Method for Determining Reducing Sugars in Plant Tissues. Application to Quantify the Sugar Content in Quinoa (Chenopodium quinoa Willd.) Seedlings. Phytochem. Anal. 1998, 9, 58–62. [Google Scholar] [CrossRef]
- Jorgensen, O.S.; Andersen, B. An improved glucoseoxidase-peroxidase-coupled assay for β-fructofuranosidase activity. Anal. Biochem. 1973, 53, 141–145. [Google Scholar] [CrossRef]
- Roe, J.H.; Papadopoulos, N.M. The Determination of Fructose-6-Phosphate and Fructose-1,6-Diphosphate. J. Biol. Chem. 1954, 210, 703–707. [Google Scholar] [CrossRef]
- Cardini, C.; Leloir, L.F.; Chiriboga, J. The Biosynthesis of Sucrose. J. Biol. Chem. 1955, 214, 149–155. [Google Scholar] [CrossRef]
- DuBois, M.; Gilles, K.A.; Hamilton, J.K.; Rebers, P.A.; Smith, F. Colorimetric method for determination of sugars and related substances. Anal. Chem. 1956, 28, 350–356. [Google Scholar] [CrossRef]
- Van Nieuwenhove, C.P.; Moyano, A.; Castro-Gómez, P.; Fontecha, J.; Sáez, G.; Zárate, G.; Pizarro, P.L. Comparative study of pomegranate and jacaranda seeds as functional components for the conjugated linolenic acid enrichment of yogurt. LWT 2019, 111, 401–407. [Google Scholar] [CrossRef]
- Folch, J.; Lees, M.; Sloane Stanley, G.H. A simple method for the isolation and purification of total lipides from animal tissues. J. Biol. Chem. 1957, 226, 497–509. [Google Scholar] [CrossRef] [PubMed]
- Ulbricht, T.L.V.; Southgate, D.A.T. Coronary heart disease: Seven dietary factors. Lancet 1991, 338, 985–992. [Google Scholar] [CrossRef]
- González, J.; Hinojosa, L.; Mercado, M.; Fernández-Turiel, J.; Bazile, D.; Ponessa, G.; Eisa, S.; González, D.; Rejas, M.; Hussin, S.; et al. A Long Journey of CICA-17 Quinoa Variety to Salinity Conditions in Egypt: Mineral Concentration in the Seeds. Plants 2021, 10, 407. [Google Scholar] [CrossRef] [PubMed]
- SAS. SAS/STAT User’s Guide, Release 6.03 ed.; SAS Institute Inc.: Cary, NC, USA, 1988. [Google Scholar]
- Kumar, S.; Kumar, S.; Mohapatra, T. Interaction Between Macro- and Micro-Nutrients in Plants. Front. Plant Sci. 2021, 12, 665583. [Google Scholar] [CrossRef]
- Romera, F.J.; Lan, P.; Rodríguez-Celma, J.; Pérez-Vicente, R. Editorial: Nutrient Interactions in Plants. Front. Plant Sci. 2021, 12, 782505. [Google Scholar] [CrossRef]
- Gomaa, E.F. Effect of nitrogen, phosphorus and biofertilizers on quinoa plant. J. Appl. Sci. Res. 2013, 9, 5210–5222. [Google Scholar]
- Kakabouki, I.; Bilalis, D.; Karkanis, A.; Zervas, G.; Tsiplakou, E.; Hela, D. Effects of fertilization and tillage system on growth and crude protein content of quinoa (Chenopodium quinoa Willd.): An alternative forage crop. Emir. J. Food Agric. 2014, 26, 18. [Google Scholar] [CrossRef] [Green Version]
- Triboi, E. Environmentally-induced changes in protein composition in developing grains of wheat are related to changes in total protein content. J. Exp. Bot. 2003, 54, 1731–1742. [Google Scholar] [CrossRef]
- del Moral, L.F.G.; Rharrabti, Y.; Martos, V.; Royo, C. Environmentally Induced Changes in Amino Acid Composition in the Grain of Durum Wheat Grown under Different Water and Temperature Regimes in a Mediterranean Environment. J. Agric. Food Chem. 2007, 55, 8144–8151. [Google Scholar] [CrossRef]
- Thanapornpoonpong, S.; Vearasilp, S.; Pawelzik, E.; Gorinstein, S. Influence of Various Nitrogen Applications on Protein and Amino Acid Profiles of Amaranth and Quinoa. J. Agric. Food Chem. 2008, 56, 11464–11470. [Google Scholar] [CrossRef] [PubMed]
- Food and Agriculture Organization of the United Nations World Health Organization and Organization Nations United. Protein and amino acid requirements in human nutrition: Report of a joint FAO/WHO/UNU expert consultation. 2007. Available online: chrome-extension://efaidnbmnnnibpcajpcglclefindmkaj/https://apps.who.int/iris/bitstream/handle/10665/43411 (accessed on 1 October 2022).
- Repo-Carrasco, R. Andean Crops and Infant Nourishment; University of Helsinki: Helsinki, Finland; Institute of Development Studies: Helsinki, Finland, 1992. [Google Scholar]
- Miranda, M.; Vega-Galvez, A.; Martínez, E.A.; López, J.; Marín, R.; Aranda, M.; Fuentes, F. Influence of contrasting environments on seed composition of two quinoa genotypes: Nutritional and functional properties. Chil. J. Agric. Res. 2013, 73, 06–07. [Google Scholar] [CrossRef]
- Vera, E.P.; Alca, J.J.; Saravia, G.R.; Campioni, N.C.; Alpuy, I.J. Comparison of the lipid profile and tocopherol content of four Peruvian quinoa (Chenopodium quinoa Willd.) cultivars (‘Amarilla de Maranganí’, ‘Blanca de Juli’, INIA 415 ‘Roja Pasankalla’, INIA 420 ‘Negra Collana’) during germination. J. Cereal Sci. 2019, 88, 132–137. [Google Scholar] [CrossRef]
- Miranda, M.; Vega-Gálvez, A.; Quispe-Fuentes, I.; Rodríguez, M.J.; Maureira, H.; Martínez, E.A. Nutritional Aspects of Six Quinoa (Chenopodium quinoa Willd.) Ecotypes from three Geographical Areas of Chile. Chil. J. Agric. Res. 2012, 72, 175–181. [Google Scholar] [CrossRef] [Green Version]
- Pellegrini, M.; Lucas-Gonzales, R.; Ricci, A.; Fontecha, J.; Fernández-López, J.; Pérez-Álvarez, J.A.; Viuda-Martos, M. Chemical, fatty acid, polyphenolic profile, techno-functional and antioxidant properties of flours obtained from quinoa (Chenopodium quinoa Willd) seeds. Ind. Crop. Prod. 2018, 111, 38–46. [Google Scholar] [CrossRef]
- Browse, J.; Somerville, C. Glycerolipid Synthesis: Biochemistry and Regulation. Annu. Rev. Plant Physiol. Plant Mol. Biol. 1991, 42, 467–506. [Google Scholar] [CrossRef]
- Dar, A.A.; Choudhury, A.R.; Kancharla, P.K.; Arumugam, N. The FAD2 Gene in Plants: Occurrence, Regulation, and Role. Front. Plant Sci. 2017, 8, 1789. [Google Scholar] [CrossRef] [Green Version]
- Wang, X.; Liu, A. Expression of Genes Controlling Unsaturated Fatty Acids Biosynthesis and Oil Deposition in Developing Seeds of Sacha Inchi (Plukenetia volubilis L.). Lipids 2014, 49, 1019–1031. [Google Scholar] [CrossRef]
- Chumphukama, O.; Tipsuwan, W.; Khanaree, C.; Pintha, K.; Tantipaiboonwong, P.; Chaiwangyen, W.; Roytrakul, S.; Suttajit, M.; Topanurak, S. Alpha-linolenic acid content and expression of KASII and FAD3 in perilla seed associated with altitude of cultivation areas. Scienceasia 2019, 45, 408–418. [Google Scholar] [CrossRef] [Green Version]
- Tang, Y.; Li, X.; Chen, P.X.; Zhang, B.; Liu, R.; Hernandez, M.; Draves, J.; Marcone, M.F.; Tsao, R. Assessing the Fatty Acid, Carotenoid, and Tocopherol Compositions of Amaranth and Quinoa Seeds Grown in Ontario and Their Overall Contribution to Nutritional Quality. J. Agric. Food Chem. 2016, 64, 1103–1110. [Google Scholar] [CrossRef]
- Pereira, E.; Encina-Zelada, C.; Barros, L.; Gonzales-Barron, U.; Cadavez, V.; Ferreira, I.C. Chemical and nutritional characterization of Chenopodium quinoa Willd (quinoa) grains: A good alternative to nutritious food. Food Chem. 2018, 280, 110–114. [Google Scholar] [CrossRef] [PubMed] [Green Version]
- Campos, D.; Chirinos, R.; Ranilla, L.G.; Pedreschi, R. Bioactive Potential of Andean Fruits, Seeds, and Tubers. Adv. Food Nutr. Res. 2018, 84, 287–343. [Google Scholar] [CrossRef] [PubMed]
- Food and Agriculture Organization of the United Nations and World Health Organization. Fats and Fatty Acids in Human Nutrition: Report of an Expert Consultation. FAO Food Nutr. Pap. 2010. [Google Scholar]
- Craine, E.B.; Murphy, K.M. Seed Composition and Amino Acid Profiles for Quinoa Grown in Washington State. Front. Nutr. 2020, 7, 126. [Google Scholar] [CrossRef]
- Coelho, I.; Gueifão, S.; Nascimento, A.C.; Lobo, M.; Gimenez, A.; Samman, N.; Castanheira, I. Proximate and mineral profile of quinoa (Chenopodium quinoa), and kiwicha (Amaranthus caudatus) consumed in north of Argentina. In Proceedings of the Ninth International Food Data Conference, Norwich, UK, 14–17 September 2011. [Google Scholar]
- Peleg, Z.; Saranga, Y.; Yazici, A.; Fahima, T.; Ozturk, L.; Cakmak, I. Grain zinc, iron and protein concentrations and zinc-efficiency in wild emmer wheat under contrasting irrigation regimes. Plant Soil 2008, 306, 57–67. [Google Scholar] [CrossRef] [Green Version]
- Chatzav, M.; Peleg, Z.; Ozturk, L.; Yazici, A.; Fahima, T.; Cakmak, I.; Saranga, Y. Genetic diversity for grain nutrients in wild emmer wheat: Potential for wheat improvement. Ann. Bot. 2010, 105, 1211–1220. [Google Scholar] [CrossRef] [Green Version]


| Encalilla Soil | Manure Analysis | |
|---|---|---|
| Soil order | Entisol | - |
| Sand (%) | 48 | - |
| Silt (%) | 22 | - |
| Clay (%) | 30 | - |
| Soil texture | Sandy loam | |
| pH | 8.40 | 7.78 |
| EC (dS/m) | 2.0 | 10.4 |
| Organic matter content (%) | 0.60 | 28.80 |
| Total N (%) | 0.055 | 1.60 |
| C/N ratio | 10.9 | 18.0 |
| P (mg/kg) | 1965.6 | 3100 |
| K (mg/kg) | 28,828.8 | 1000 |
| Mg (mg/kg) | 18,729.1 | 2300 |
| Na (mg/kg) | 24,609.4 | 3900 |
| Ca (mg/kg) | 22,895.5 | 10,100 |
| Fe (mg/kg) | 39,194.7 | 4100 |
| Cu (mg/kg) | 20.76 | 5.1 |
| CICA-17 | Regalona Baer | |||||||||
|---|---|---|---|---|---|---|---|---|---|---|
| C0 | C2 | C4 | C8 | C12 | RB0 | RB2 | RB4 | RB8 | RB12 | |
| TPC (g/100 g seed) | 15.5 d | 15.0 d | 17.9 c | 19.6 b | 22.1 a | 15.0 c | 15.2 c | 15.9 c | 17.9 b | 21.4 a |
| EAA (g/100 g protein) | ||||||||||
| Leu | 5.97 b | 8.12 a | 4.80 c | 4.33 c | 0.98 d | 5.28 b | 7.03 a | 5.47 b | 5.64 b | 5.52 b |
| Lys | 5.73 a | 4.76 a | 5.23 a | 5.37 a | 5.12 a | 5.43 a | 5.93 a | 5.77 a | 5.52 a | 5.41 a |
| Val | 5.05 a | 5.63 a | 3.29 b | 3.07 b | 0.98 c | 8.08 a | 6.79 b | 4.18 e | 4.72 d | 4.95 c |
| Ile | 2.04 a | 1.88 a | 1.32 b | 1.17 b | 0.55 c | 2.40 a | 2.05 c | 1.79 d | 2.07 b | 2.07 b |
| Phe | 6.26 a | 6.52 a | 1.10 b | 1.05 b | 1.09 b | 1.16 b | 1.19 b | 1.49 a | 1.38 b | 1.27 b |
| Thr | 0.17 d | 1.06 a | 0.75 bc | 0.63 c | 0.22 d | 1.17 a | 0.71 c | 1.00 a | 0.81 b | 1.04 a |
| Met | 0.77 d | 1.65 b | 1.13 a | 1.02 c | 1.09 c | 1.26 a | 1.19 a | 1.00 b | 0.69 c | 0.58 c |
| TEAA | 25.98 b | 29.62 a | 17.63 c | 16.64 cd | 10.03 d | 24.78 a | 24.89 a | 20.96 b | 20.82 b | 20.84 b |
| NEAA (g/100 g protein) | ||||||||||
| Asp | 1.49 c | 5.63 a | 3.96 ab | 3.62 ab | 1.20 d | 3.49 b | 3.87 b | 4.08 a | 3.91 a | 4.14 a |
| Arg | 10.09 d | 12.07 d | 10.21 d | 8.32 bc | 2.29 a | 10.33 a | 7.74 d | 8.16 d | 9.20 c | 9.09 b |
| Gln | 0.43 e | 2.86 c | 3.57 b | 8.35 a | 1.53 d | 1.13 b | 2.53 a | 0.80 c | 0.81 c | 1.04 b |
| Glu | 1.90 c | 7.00 a | 6.61 a | 5.93 b | 0.44 d | 8.27 a | 7.35 a | 7.96 a | 7.59 a | 8.51 a |
| Gly | 1.63 a | 1.79 a | 1.35 b | 1.33 b | 1.31 b | 5.14 c | 4.27 b | 3.78 c | 3.80 c | 4.49 a |
| Ala | 5.26 b | 7.39 a | 2.86 c | 2.43 c | 2.07 c | 2.64 a | 2.69 a | 2.39 a | 2.42 a | 2.42 a |
| Ser | 0.44 c | 4.54 a | 4.03 a | 3.84 a | 2.62 b | 5.82 a | 4.35 b | 0.50 c | 5.64 a | 5.98 a |
| Tyr | 1.01 c | 2.13 a | 1.74 b | 1.53 b | 0.44 d | 1.36 a | 1.11 a | 1.29 a | 1.27 a | 1.38 a |
| Total NEAA | 22.25 c | 43.40 a | 34.32 b | 35.33 b | 11.88 d | 38.18 a | 33.89 a | 28.95 b | 34.62 a | 37.03 a |
| TAA | 48.2 | 72.7 | 52.0 | 52.0 | 21.9 | 63.0 | 58.8 | 49.9 | 55.4 | 57.9 |
| EAA/TAA | 53.9 | 40.3 | 33.9 | 32.0 | 45.8 | 39.4 | 42.3 | 42.0 | 37.6 | 36.0 |
| NEAA/TAA | 46.1 | 59.7 | 66.1 | 68.0 | 54.2 | 60.6 | 57.7 | 58.0 | 62.4 | 64.0 |
| EAA/NEAA | 116.8 | 68.2 | 51.4 | 47.1 | 84.4 | 64.9 | 73.4 | 72.4 | 60.1 | 56.3 |
| CICA-17 | Regalona Baer | |||||||||
|---|---|---|---|---|---|---|---|---|---|---|
| C0 | C2 | C4 | C8 | C12 | RB0 | RB2 | RB4 | RB 8 | RB 12 | |
| (g/100 g DW) | ||||||||||
| TSS | 0.92 d | 1.39 c | 1.94 b | 2.38 a | 2.59 a | 1.23 c | 1.50 b | 1.49 b | 2.24 a | 2.20 a |
| Glucose | 0.05 e | 0.07 d | 0.08 c | 0.12 b | 0.16 a | 0.05 d | 0.06 c | 0.11 a | 0.12 a | 0.09 b |
| Fructose | 0.13 d | 0.20 c | 0.53 a | 0.49 a | 0.45 b | 0.14 e | 0.30 d | 0.43 c | 0.90 a | 0.47 b |
| Sucrose | 0.90 d | 1.42 c | 2.01 b | 2.19 a | 2.16 a | 0.99 c | 1.08 c | 1.12 c | 2.09 a | 1.99 b |
| CICA-17 | Regalona Baer | |||||||||
|---|---|---|---|---|---|---|---|---|---|---|
| C0 | C2 | C4 | C8 | C12 | RB0 | RB2 | RB4 | RB8 | RB12 | |
| Oil content (%) | 5.83 a | 6.22 a | 6.32 a | 6.03 a | 6.05 a | 5.75 a | 6.25 a | 6.12 a | 6.16 a | 5.99 a |
| Fatty acid (g/100 g) | ||||||||||
| C14:0 | 0.21 c | 0.37 b | 0.52 a | 0.22 c | 0.19 c | 0.88 a | 0.86 a | 0.53 b | 0.22 d | 0.35 c |
| C14:1 | 0.08 a | 0.11 a | 0.12 a | 0.09 a | 0.11 a | 0.08 a | 0.08 a | 0.06 a | 0.08 a | 0.07 a |
| C16:0 | 17.50 b | 17.70 b | 16.46 b | 20.32 a | 19.10 a | 16.75 b | 14.97 c | 16.32 b | 18.37 a | 18.30 a |
| C16:1 | 0.35 b | 0.27 b | 0.50 a | 0.53 a | 0.48 a | 0.76 a | 0.67 ab | 0.67 ab | 0.52 c | 0.63 bc |
| C18:0 | 1.92 a | 1.43 b | 1.88 a | 1.90 a | 2.00 a | 1.73 ab | 1.44 b | 1.50 b | 1.88 a | 1.99 a |
| C18:1 n9 | 10.27 c | 14.17 a | 12.37 b | 10.96 c | 11.13 c | 12.97 a | 13.15 a | 13.12 a | 11.65 b | 13.63 a |
| C18:2 n6 | 64.55 a | 58.50 d | 61.46 c | 61.50 c | 62.76 b | 59.41 b | 62.31 a | 60.90 ab | 61.75 a | 58.60 b |
| C18:3 n3 | 4.91 c | 6.98 a | 6.15 b | 4.30 cd | 4.06 d | 5.65 bc | 6.05 ab | 6.62 a | 5.26 c | 6.11 a |
| C20:1 | 0.19 b | 0.49 a | 0.51 a | 0.22 b | 0.21 b | 1.78 a | 0.43 b | 0.29 c | 0.27 c | 0.30 c |
| SFA | 19.63 c | 19.50 c | 18.87 c | 22.44 a | 21.29 b | 19.37 b | 17.27 d | 18.35 c | 20.47 a | 20.65 a |
| UFA | 80.35 a | 80.53 a | 81.15 a | 77.51 c | 78.65 b | 80.65 bc | 82.70 a | 81.67 b | 79.54 c | 79.35 c |
| MUFA | 10.90 a | 15.04 c | 13.51 b | 11.71 a | 11.82 a | 15.55 c | 14.33 b | 14.15 b | 12.52 a | 14.64 bc |
| PUFA | 69.45 a | 65.48 c | 67.61 b | 65.80 c | 66.82 b | 65.05 c | 68.37 a | 67.52 ab | 67.01 b | 64.71 c |
| SFA/UFA | 0.25 c | 0.24 c | 0.23 c | 0.29 a | 0.27 b | 0.24 b | 0.21 c | 0.22 c | 0.26 a | 0.26 a |
| CICA-17 | Regalona Baer | |||||||||
|---|---|---|---|---|---|---|---|---|---|---|
| C0 | C2 | C4 | C8 | C12 | RB0 | RB2 | RB4 | RB 8 | RB 12 | |
| Ash% DW | 3.22 a | 3.35 a | 3.17 a | 3.88 b | 3.19 a | 3.43 b | 3.38 b | 3.47 b | 3.02 a | 3.57 b |
| Major elements mg/kg DW | ||||||||||
| K | 9042.7 a | 9677.5 a | 8726.8 a | 10,260.9 b | 9195.5 a | 9237.5 b | 9071.3 b | 8734.9 b | 8125.2 a | 10,991.4 c |
| Si | 5303.5 b | 5720.5 b | 5859.0 b | 6304.1 c | 3921.4 a | 6743.9 c | 6772.2 c | 7276.7 c | 3917.9 a | 5760.5 b |
| P | 2692.6 b | 2663.9 b | 2304.7 a | 2751.1 b | 2924.9 b | 2341.9 a | 2150.3 a | 2123.8 a | 2917.7 b | 2300.3 a |
| Mg | 1480.4 a | 1361.0 a | 1362.9 a | 2483.9 b | 2215.3 b | 1446.9 a | 1463.1 a | 1501.7 a | 2019.3 b | 1948.0 b |
| Ca | 660.6 a | 657.7 a | 585.0 a | 1469.6 c | 1132.3 b | 562.4 a | 540.9 a | 655.7 b | 1108.3 c | 924.6 c |
| Na | 146.5 c | 106.7 b | 74.5 a | 156.3 c | 211.8 d | 26.1 a | 70.9 b | 124.6 c | 146.2 c | 86.2 b |
| Minor or trace elements mg/kg DW | ||||||||||
| Fe | 52.8 a | 52.0 a | 50.0 a | 76.1 b | 70.4 b | 50.0 a | 47.2 a | 46.0 a | 73.9 b | 76.7 b |
| Mn | 35.2 a | 29.2 b | 29.1 b | 41.9 c | 37.4 a | 26.7 a | 31.5 c | 15.6 b | 35.3 c | 31.2 c |
| Al | 21.6 a | 30.1 b | 30.2 b | 45.8 c | 35.1 b | 30.8 b | 26.4 b | 21.1 a | 27.4 b | 49.3 c |
| Zn | 13.2 b | 12.6 b | 11.9 b | 10.7 a | 12.5 b | 14.7 b | 15.1 b | 15.3 b | 10.5 a | 11.5 a |
| Cu | 6.79 a | 8.1 b | 7.5 a | 7.1 a | 6.2 a | 5.9 a | 5.7 a | 5.7 a | 6.9 b | 6.8 b |
| Ultratrace elements mg/kg DW | ||||||||||
| Li | 0.319 b | 0.252 b | 0.215 a | 0.651 c | 0.241 b | 0.190 a | 0.205 b | 0.238 c | 0.275 d | 0.347 e |
| Cr | 0.099 | 0.113 | 0.072 | 0.422 | 0.074 | 0.089 a | 0.182 b | 0.076 c | 0.485 d | 0.088 a |
| Co | 0.032 b | 0.033 b | 0.022 a | 0.097 c | 0,028 b | 0.026 b | 0.027 b | 0.089 c | 0.029 b | 0.023 a |
Disclaimer/Publisher’s Note: The statements, opinions and data contained in all publications are solely those of the individual author(s) and contributor(s) and not of MDPI and/or the editor(s). MDPI and/or the editor(s) disclaim responsibility for any injury to people or property resulting from any ideas, methods, instructions or products referred to in the content. |
© 2023 by the authors. Licensee MDPI, Basel, Switzerland. This article is an open access article distributed under the terms and conditions of the Creative Commons Attribution (CC BY) license (https://creativecommons.org/licenses/by/4.0/).
Share and Cite
González, J.A.; Yousif, S.K.M.; Erazzu, L.E.; Martínez Calsina, L.; Lizarraga, E.F.; Omer, R.M.; Bazile, D.; Fernandez-Turiel, J.L.; Buedo, S.E.; Rejas, M.; et al. Effects of Goat Manure Fertilization on Grain Nutritional Value in Two Contrasting Quinoa (Chenopodium quinoa Willd.) Varieties Cultivated at High Altitudes. Agronomy 2023, 13, 918. https://doi.org/10.3390/agronomy13030918
González JA, Yousif SKM, Erazzu LE, Martínez Calsina L, Lizarraga EF, Omer RM, Bazile D, Fernandez-Turiel JL, Buedo SE, Rejas M, et al. Effects of Goat Manure Fertilization on Grain Nutritional Value in Two Contrasting Quinoa (Chenopodium quinoa Willd.) Varieties Cultivated at High Altitudes. Agronomy. 2023; 13(3):918. https://doi.org/10.3390/agronomy13030918
Chicago/Turabian StyleGonzález, J. A., Sawsan K. M. Yousif, L. E. Erazzu, L. Martínez Calsina, E. F. Lizarraga, Rihab M. Omer, D. Bazile, J. L. Fernandez-Turiel, S. E. Buedo, M. Rejas, and et al. 2023. "Effects of Goat Manure Fertilization on Grain Nutritional Value in Two Contrasting Quinoa (Chenopodium quinoa Willd.) Varieties Cultivated at High Altitudes" Agronomy 13, no. 3: 918. https://doi.org/10.3390/agronomy13030918