Article

Regulated Deficit Irrigation during Vegetative Growth Enhances Crop Water Productivity in Chickpea (Cicer arietinum L.)

by
José Denis Osuna-Amador
1,2,
Rodrigo Méndez-Alonzo
3,*,
Armando Trasviña-Castro
4,
Romeo Saldívar-Lucio
5,
Rufina Hernandez-Martinez
6 and
Georgianne W. Moore
7
1
Posgrado en Ciencias de la Vida, Centro de Investigación Científica y de Educación Superior de Ensenada (CICESE), Carretera Ensenada-Tijuana No. 3918, Zona Playitas, Ensenada 22860, Baja California, Mexico
2
Campo Experimental Todos Santos del Instituto Nacional de Investigaciones Forestales, Agrícolas y Pecuarias (INIFAP), Calle Agricultura No. 1555 entre Calle México y Durango, La Paz 23070, Baja California Sur, Mexico
3
Departamento de Biología de la Conservación, Centro de Investigación Científica y de Educación Superior de Ensenada, Carretera Ensenada-Tijuana No. 3918, Zona Playitas, Ensenada 22860, Baja California, Mexico
4
Centro de Investigación Científica y de Educación Superior de Ensenada (CICESE Unidad La Paz), Calle Miraflores No. 334 entre Calle Mulegé y Calle La Paz, La Paz 23050, Baja California Sur, Mexico
5
CONACYT-Centro de Investigación Científica y Educación Superior de Ensenada (CICESE Unidad La Paz), Calle Miraflores No. 334 entre Calle Mulegé y Calle La Paz, La Paz 23050, Baja California Sur, Mexico
6
Departamento de Microbiología, Centro de Investigación Científica y de Educación Superior de Ensenada, Carretera Ensenada-Tijuana No. 3918, Zona Playitas, Ensenada 22860, Baja California, Mexico
7
Department of Biology, Georgia Southern University, 4324 Old Register Road, Stateboro, GA 30460, USA
*
Author to whom correspondence should be addressed.
Agronomy 2023, 13(3), 917; https://doi.org/10.3390/agronomy13030917
Submission received: 2 February 2023 / Revised: 15 March 2023 / Accepted: 16 March 2023 / Published: 20 March 2023

Abstract

:
To optimize irrigation, agronomists need to modulate crop water productivity (CWP) throughout phenology. We compared regulated deficit irrigation (RDI) and sustained deficit irrigation (SDI) in chickpea (Cicer arietinum L. var. Blanoro), expecting RDI during vegetative growth (VG) to enhance CWP, as opposed to flowering (F) and pod-filling (PF) stages. The effects of RDI and SDI on grain yield, plant height, weight, grain caliber, pods and grains per plant, harvest index, and CWP, were tested through a complete randomized block experiment during the years 2020 and 2021, comparing full irrigation (FI, ETc = 100%), SDI (SDI75, ETc = 75% during all stages), and six RDI treatments varying in ETc% across phenology: VG50, VG75, F50, F75, PF50, and PF75. VG75 had higher CWP while minimizing impacts on productivity. During 2020, the plants were taller (0.44 ± 4.4 m), and increased in harvest index (0.47 ± 0.06), and CWP (0.90 ± 0.2 kg m−3) (p < 0.05), while in 2021, plants were heavier (11.4 ± 2.8 g) and increased in caliber (46.1 ± 3.0 grains); grain yield did not differ between the years (p ˃ 0.05), reaching 861.8 (2020) and 944.7 kg ha−1 (2021). Our results highlight the relevance of maintaining 100% ETc during flowering, and the maintenance of RDI at 75% ETc during vegetative growth.

1. Introduction

Owing to human-induced climatic changes, an increase in the recurrence and intensity of droughts in several areas of the world is forecasted [1,2,3]. This complex situation turns even more pressing for arid and semiarid regions of the world, which may have been already experiencing abnormal droughts [4]. Globally, agriculture uses 70% of the available freshwater, and coupled with population growth and food demands, this implies a potential increase in agricultural production by 70% for the year 2050 [5]. Therefore, agriculture urgently needs the implementation of water-saving irrigation strategies to improve crop water productivity (CWP), which is defined as the ratio of crop yield to water consumed by the plant [6,7].
Deficit irrigation is the deliberate manipulation of irrigation in which water volumes are applied below the plant´s water optimal requirements [8]; its implementation can increase CWP without providing additional water and is especially useful when the value of harvest is low, but the value of water is high [9]. Deficit irrigation consists of different schemes, such as regulated deficit irrigation (RDI) and sustained deficit irrigation (SDI) [10,11,12]. RDI is a scheduling method that consists of the variable application of crop irrigation in specific stages of plant development, usually focusing on water volumes that are under the optimal plant growth requirements for specific phenological stages [12,13]. In contrast, SDI applies below-optimal water volumes during each irrigation event for the complete crop cycle [14]. RDI and SDI have become efficient irrigation practices to optimize the CWP of different crops, such as vegetables and fruit trees [15,16].
Given the short life cycles of pulses, and their importance to global food security, it is critical to quantify the relevance of RDI and SDI to promote increases in their CWP. Successful applications of RDI and SDI in pulses, such as common bean (Phaseolus vulgaris L.) [17] and pea (Pisum sativum L.) [18], have led to enhanced CWP. However, for chickpea (Cicer arietinum, L.), the third most intensively established legume globally, few reports have tested the advantage of applying RDI and SDI irrigation strategies [19,20,21]. Studies suggest that RDI can induce significant differences in biomass yield. In chickpeas, induced drought stress at a level of 50% of crop evapotranspiration (ETc) during the vegetative period produced higher yields (6.5 t ha−1) than under full irrigation (4.9 t ha−1) [19,20]. Effects were the highest during the vegetative period compared with the flowering and grain-filling stages. However, it is critical to determine whether a 50% reduction or other reductions in ETc may further enhance CWP and other productivity-related variables during the vegetative period. In contrast, non-stress conditions during the flowering and pod-filling stages allow plants to increase their photosynthetic rate and carbon translocation to reproductive organs, thus increasing productivity [19,20]. Water stress applied at the mid-vegetative and pod-filling stages mitigates the reductions in plant yield, and in other productivity and yield variables [21].
In order to optimize RDI and SDI strategies in chickpeas and other crops, the local environmental conditions under which RDI and SDI can be implemented should be characterized [10,11,12,13]. Therefore, testing RDI and SDI under different schemes of irrigation volumes and methodologies is critical to expand their applicability and implementation in the field. Because CWP varies considerably due to genotype and environment, RDI and SDI strategies require precise knowledge of the response of crops to drought stress, thus allowing the improvement of rational management decisions [14,22,23]. When applied in combination, SDI schemes could inform growers about safe quantities to under-irrigate a crop, and at the same time, RDI could shed light on the correct timing (phenology stage) of when a deficit should be imposed [13].
We evaluated the effects of deficit irrigation on grain yield, plant height and weight, grain caliber, the number of pods and grains per plant, the harvest index, and CWP under different schemes of RDI and SDI in the Blanoro variety of chickpea at Baja California Sur in north-west Mexico; this state has the lowest average annual rain in Mexico (190 mm as the mean of the last 36 years), and climatic records indicate a persistent reduction in rain volumes for the last decades due to regional climate change [24,25,26,27]. Our main hypothesis was that RDI during vegetative growth would allow the maximization of CWP, and, secondarily, that flowering, and pod filling would demand full irrigation to avoid abortion and the under-growth of grains. In conjunction, our results intend to provide guidance to establish and improve schemes of RDI for chickpeas and other pulses growing in the semiarid regions of the world.

2. Materials and Methods

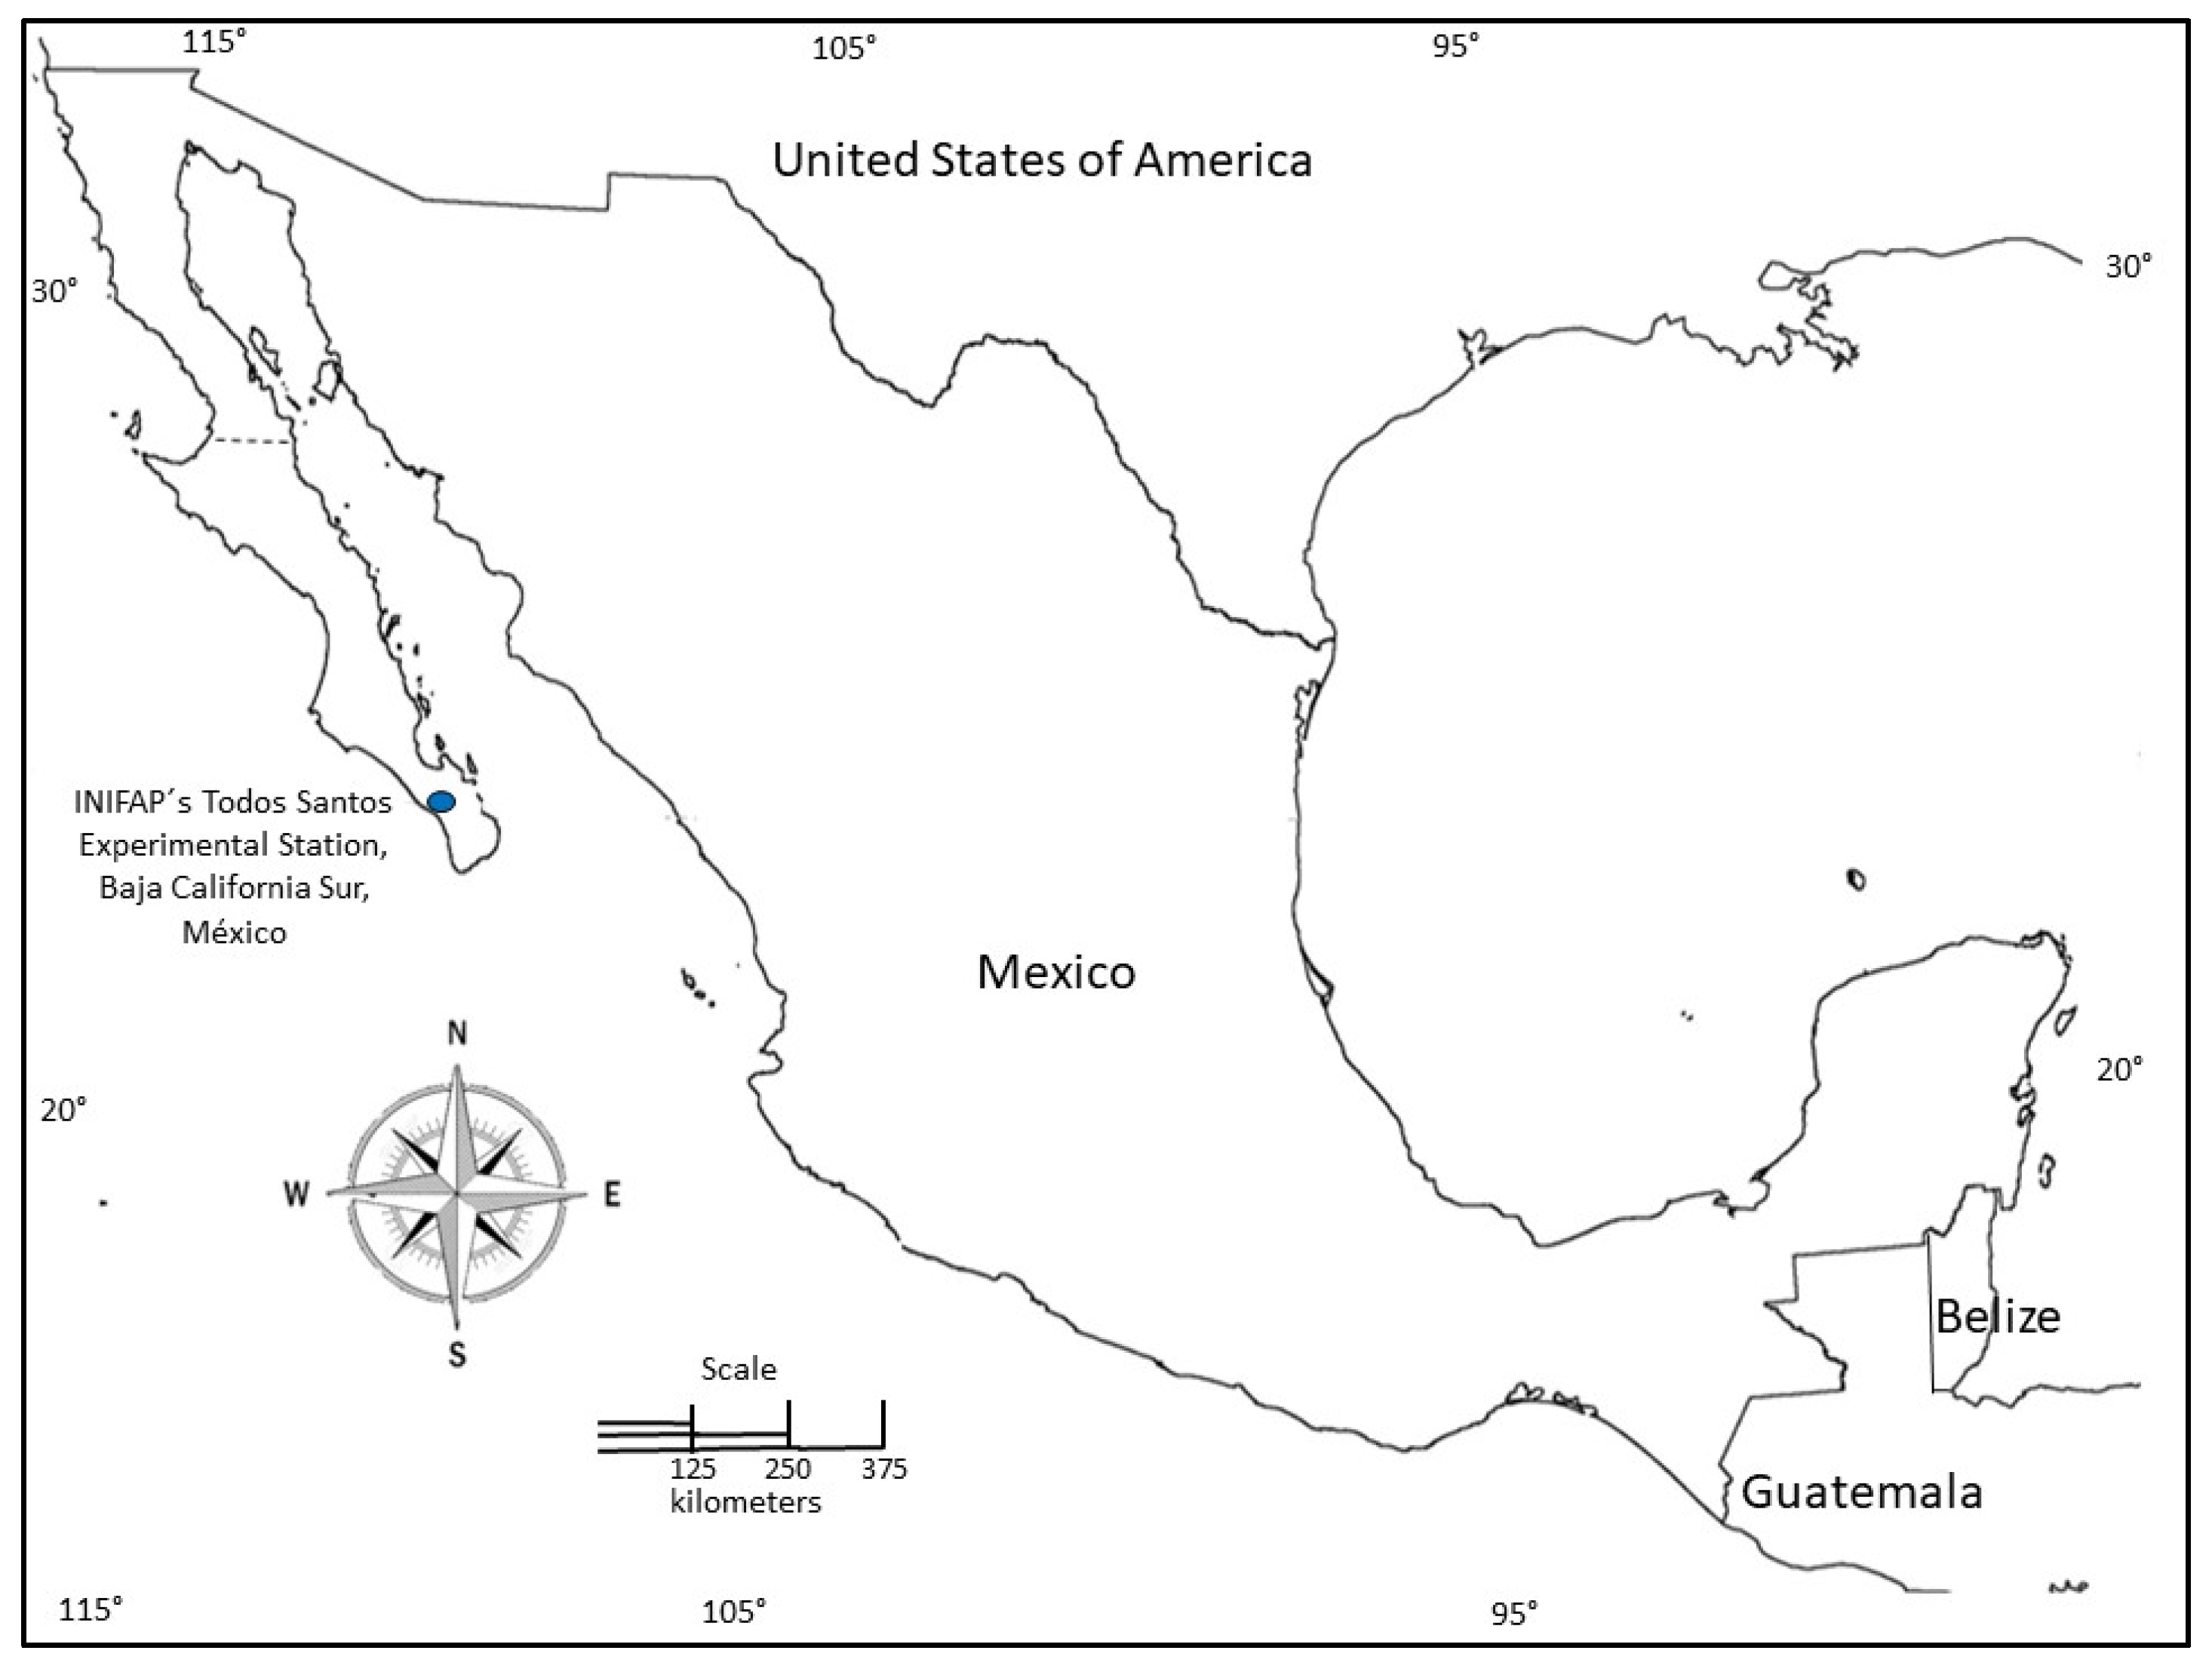
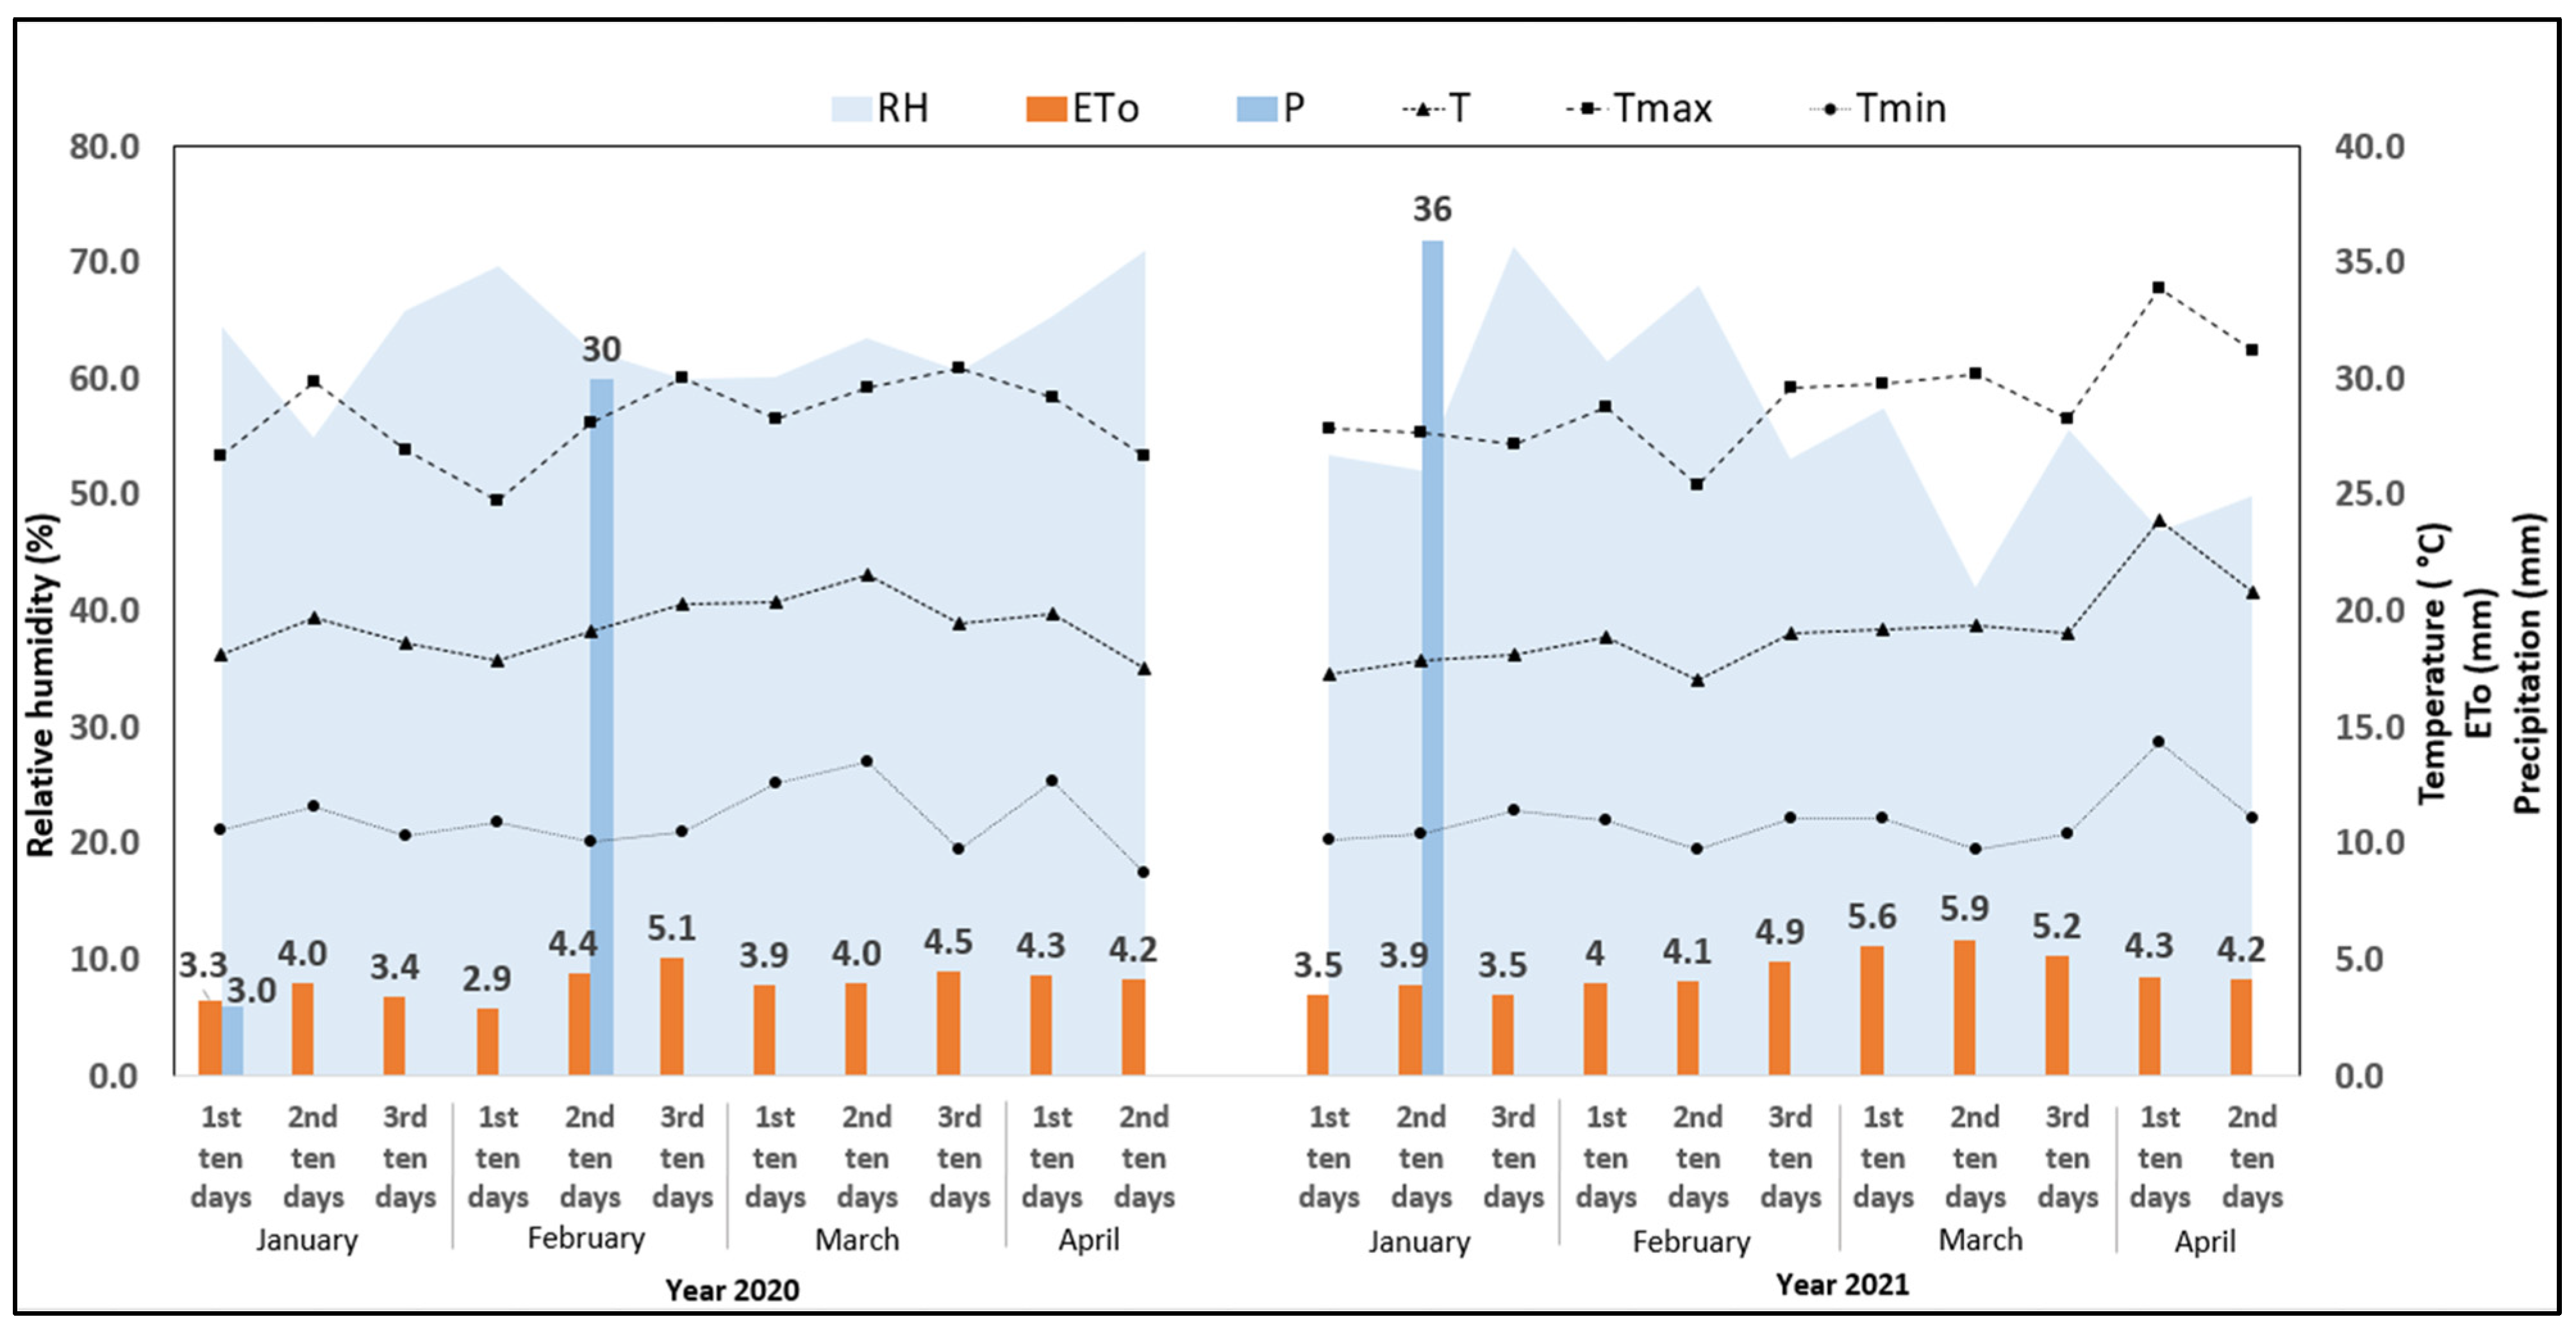
2.1. Experimental Site Condition

Two experiments were conducted during two consecutive years (2020 and 2021) at the National Institute for Forestry, Agriculture and Livestock Research (INIFAP), Todos Santos Experimental Station, Baja California Sur, México (at 110°09′ latitude N and 23°25′ longitude W, and at 150 m above sea level (Figure 1)). The climate in this area is arid and hot, with a mean rainfall and temperature of 168.6 mm and 24.6 °C, with 60% of annual rainfall occurring during the summer season [28,29]. During the period of time in which the experiments were conducted, the temperature ranged from 10.55 to 32.34 °C, with a relative humidity between 51.89 and 67.99% (Table 1).
Both experiments were established on December 31 of each year, under drip-tape irrigation conditions in loamy sand soil with a pH equal to 8.08, and an electrical conductivity of 0.33 dS m−1, with 11.7, 47.6, and 157 mg kg−1 of NO3, P2O5, and K, respectively (Table 2). The soil was low in organic matter content (0.91%) with a dry bulk density of 1.52 g cm−3, a field capacity of 11.5%, and a permanent wilting point of 6.84%. Irrigation water was pumped from groundwater (the volume and quality of which is in Table 2).

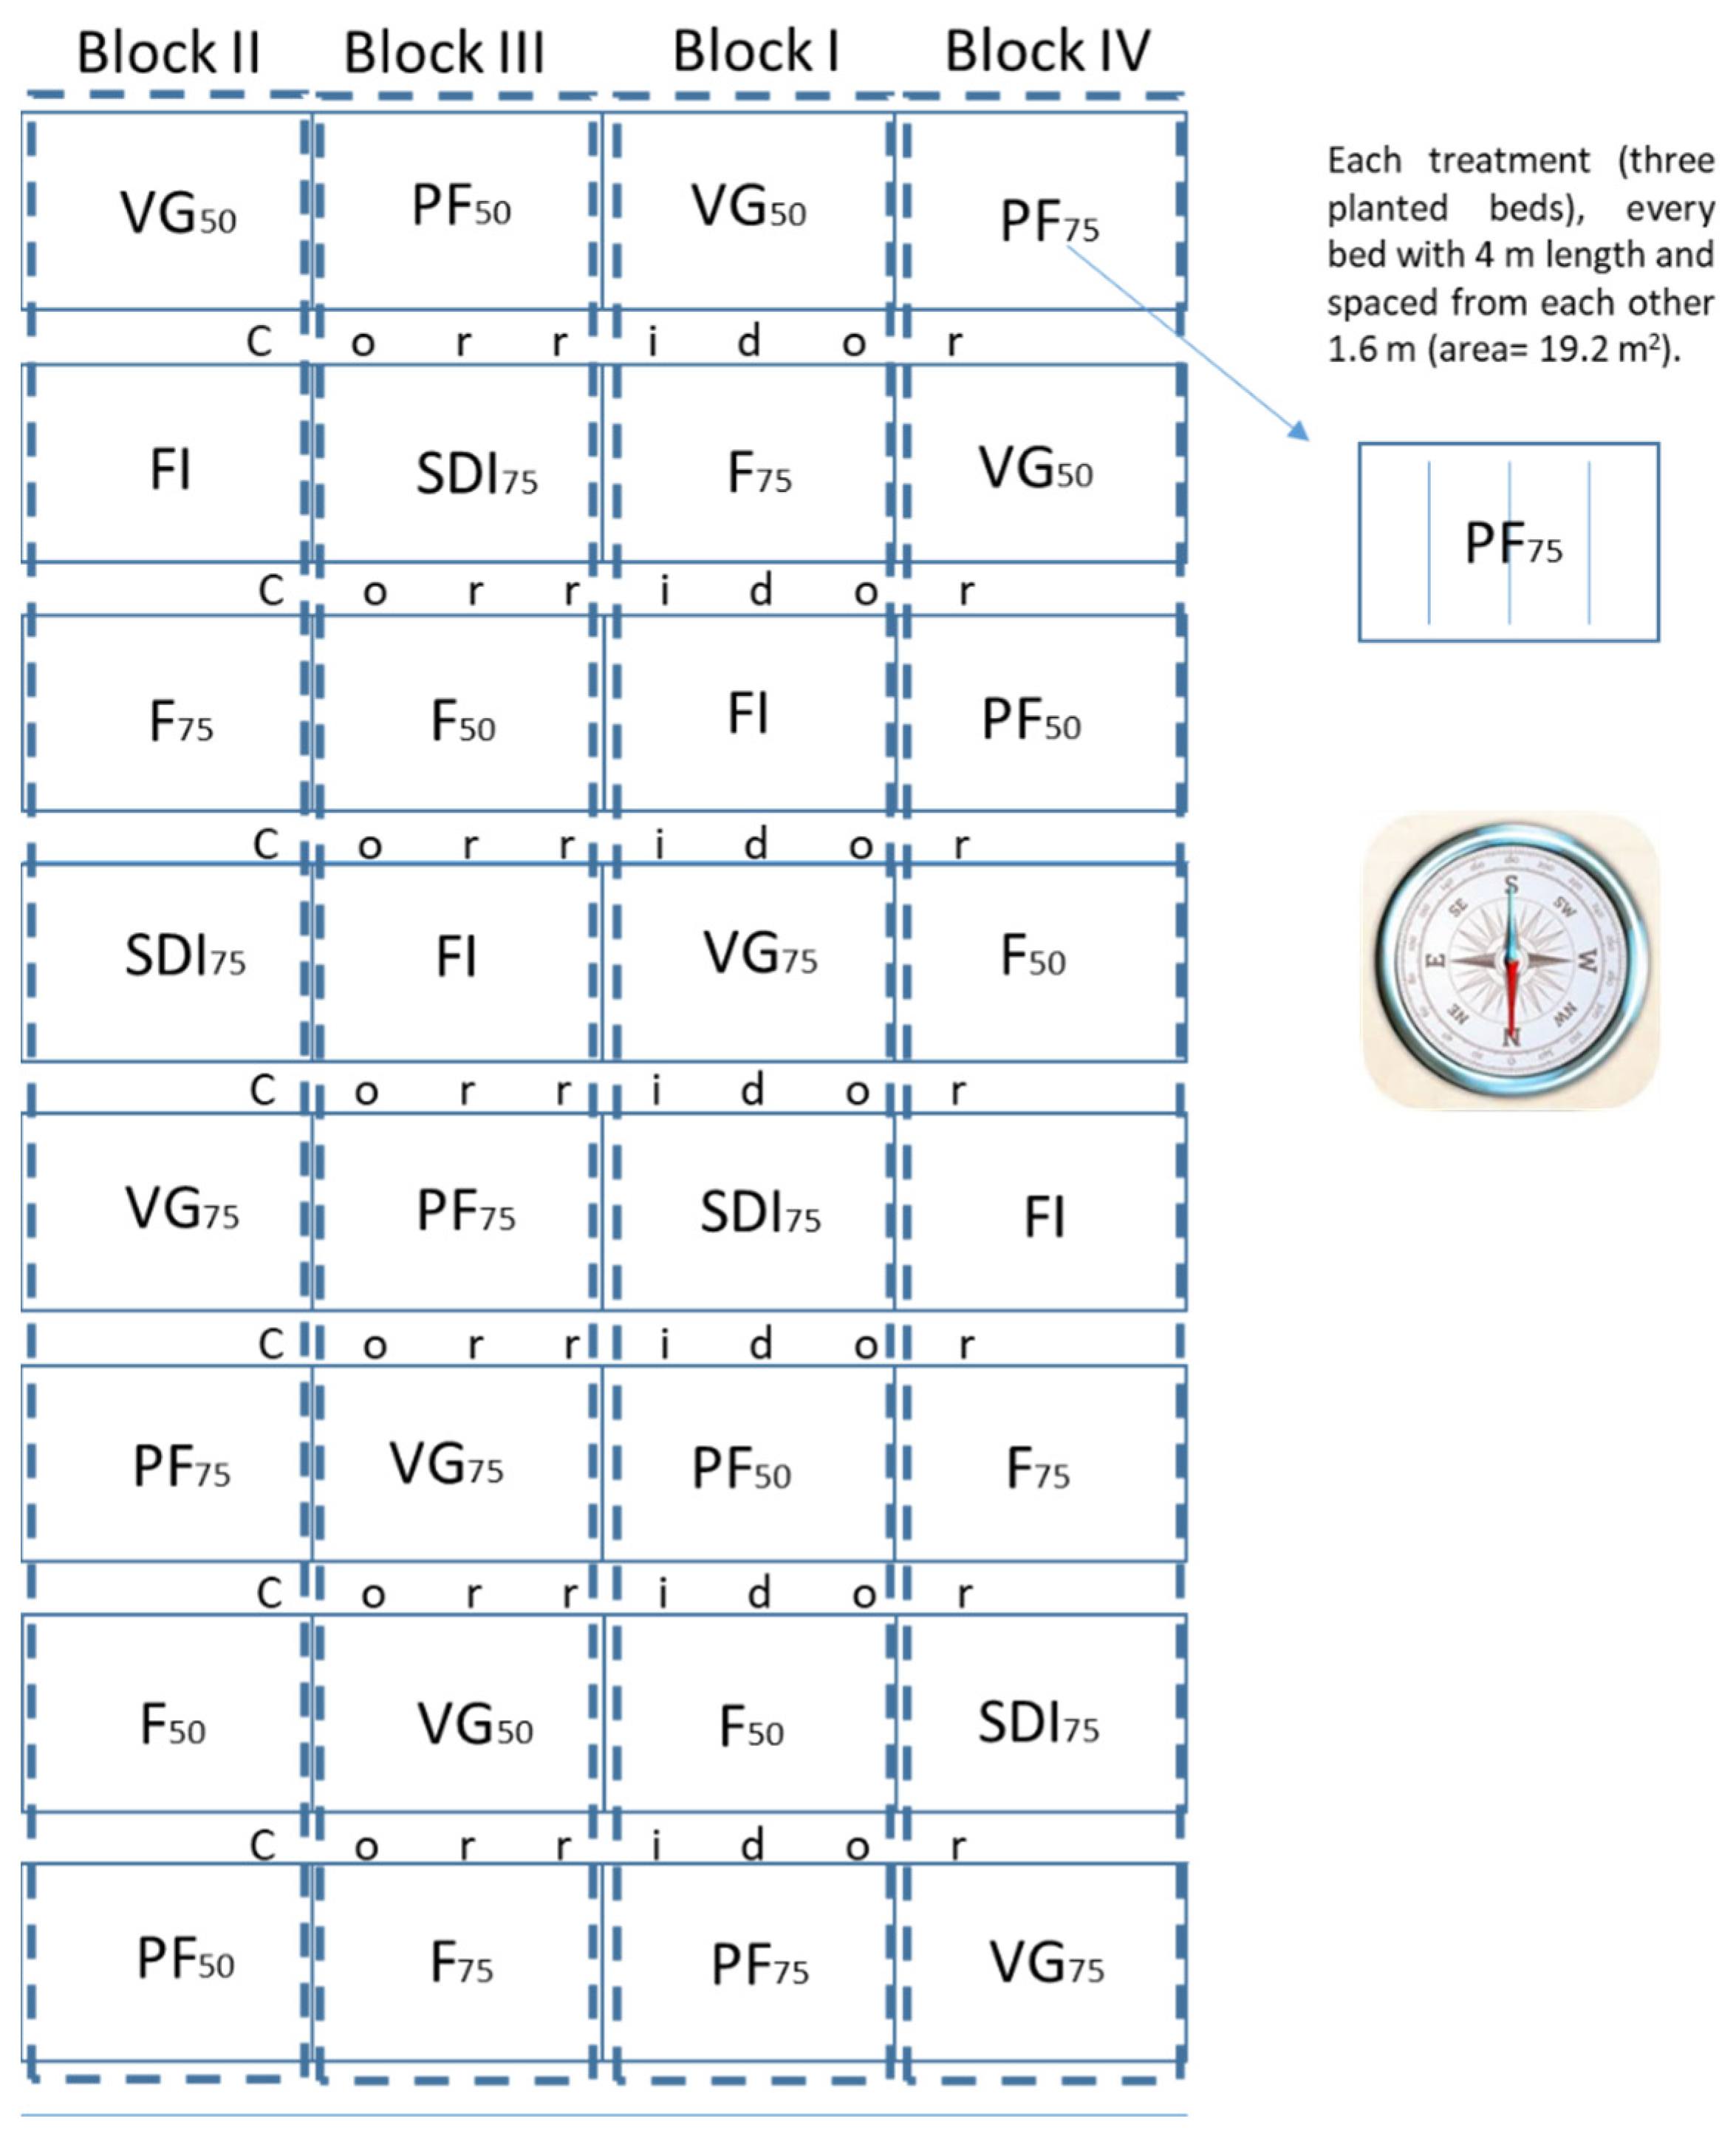
2.2. Experimental Plot Establishment

The Blanoro variety of chickpea used in this study was cultivated following the local management guidelines for this crop [30]. We deployed a drip tape irrigation system with a drip tape caliber of 8000 μ, with droppers every 0.20 m for each meter of tape and a flux of 4.98 l min−1 for each meter of tape at an operating pressure of 8 psi. Seeds were sown one inch below the soil surface at a density of 14 seeds m−1 in every row, utilizing a double-row plantation. The space between rows was 0.40 m at each bed. Fertilization doses were 90-30-0 and were applied in four parts, 15-30-0, 15-0-0, 30-0-0, and 30-0-0, at 17, 25, 34, and 51 days after sowing, respectively. The fertilizers used were urea (46-0-0) and monoammonium phosphate (11-52-0). Heliothis virescens and Liriomyza sativae, the main pests present on the site, were controlled through the aspersion of abamectin and cyantraniliprole, at 500 and 150 mL ha−1, respectively, dissolved in 270 L of water. Weeding was done manually from emergence until harvest in both cycles.

2.3. Treatments Description and Experimental Design

A completely randomized block design testing eight irrigation treatments with four replications (Figure 2) was implemented, full irrigation (FI, ETc = 100%), sustained deficit irrigation (SDI75, ETc = 75% during vegetative growth (VG), flowering (F), and pod-filling (PF), and six combinations of regulated deficit irrigation (RDI) varying across phenology, VG50 (ETc = 50%), VG75 (ETc = 75%), F50 (ETc = 50%), F75 (ETc = 75%), PF50 (ETc = 50), and PF75 (ETc = 75), were established each year (Table 3). The experimental treatment units consisted of three 4 m long planting beds spaced 1.6 m apart (an area of 19.2 m2). A one-meter-wide corridor separated contiguous treatments inside each block. For the duration of each stage of development, we calculated the growing degree days (GDD) through the formula GDD = ((Tmax + Tmin)/2) − Tb, where Tmax and Tmin are the daily maxima and minimum temperature, and Tb is the base temperature (5 °C) [31].

2.4. Irrigation Scheduling and System

To promote seed germination, irrigation was applied continually until the space that spanned between the drip tape to where the seeds were located was fully wetted (0.20 m). After this initial period, the irrigation water requirement (IWR) between the two consecutives irrigation events was determined using the equation IWR = (ETc − Pe)/Ef, where ETc is the crop evapotranspiration (mm), and Pe is the effective precipitation (mm), which was determined using a Hellman pluviometer with a collection area of 400 cm2; this pluviometer incorporates an 880 cm3 inner aluminum collector vessel. Ef is the irrigation efficiency with a considered value of 0.85 [20]. The ETc was calculated from the potential evapotranspiration (ETo) and crop coefficient (Kc) with values of 0.3, 0.75, and 0.22 for the VG, F, and PF stages for the first year and 0.43, 1.05, and 0.31, for the same stages, respectively, for the second year. Figure 3 shows the meteorological records for both years.
ETo was calculated using the ETo Calculator software [32] from meteorological data obtained from local measurements (HOBO datalogger MX2301A, Bourne, MA, USA). Instruments were installed aside our experimental plot and programmed to record the minimum, maximum, and mean daily values of temperature and relative humidity. In addition, the daily mean wind speed, and total hours of sunlight during each experimental season were accessed from reports published on the Meteoblue website [33]. Irrigation was applied, on average, every seven days. Table 4 shows the irrigation accumulated for every treatment by growth stage in both years. In the first experimental year, two rain events occurred on January 1 (3 mm) and February 3 (VG stage) (30 mm). During the second experimental year, one rain event occurred on January 29 (36 mm) during the VG stage (Figure 3).

2.5. Response Variables

Response variables (Table 5) were measured in the harvest stage (physiological maturity), which occurred 112 days (1655 growing degree days) after planting. Plant height (H) was determined inside the central bed (4.8 m2). Subsequently, the total number of plants in this area was hand harvested and stored in paper bags to obtain dry mass sampling through shade-drying in the lab. Later, a sub-sample of ten plants was randomly selected from each treatment to determine the average plant dry weight (PDW), pods per plant (PP), and grains per plant (GP). Sub-sample data plus the remaining content in each treatment´s paper bag was utilized for grain yield (GY), in kg m−2, and to obtain the sample total dry weight as biological yield (BY) in kg m−2; subsequently, GY was converted to kg ha−1. GY in kg m−2 divided by the biological yield was utilized to estimate the harvest index (HI). For each treatment, the grain caliber (Cal) was determined as the number of grains in 30 g. Finally, CWP was calculated as the total grain yield for each treatment divided by the total quantity of water used in the whole crop life cycle.

2.6. Data Analysis

The following model for the analysis of variance (ANOVA) was employed: Yijk = μ + Yi + Tj + Bk + YTij + YB(i)k + E(i)jk, where Yijk is the response variable measured on the ijk experimental unit (plot), μ is the overall mean, Yi is the effect of the ith year, Tj is the effects of the jth treatment, B(i)k is the effect of the block within the ith year, YTij is the interaction of the ith level of Y with the jth level of T, and E(i)jk is the experimental error. Statistical analyses were conducted with the procedure ANOVA in version 9.3 of the SAS software, [34]. We applied the Fisher least significance difference test (LSD) at the 5% alpha threshold for the detection of a significant trend. The description and classification of treatments were also executed in the SAS 9.3 software, with a principal component (PROC PRINCOM) and cluster analysis (PROC CLUSTER) with the AVERAGE method as the grouping criteria.

3. Results

3.1. Inter-Year Variability and Treatment Effect on Our Experimental Data

Grain caliber, plant height, dry weight, harvest index, and CWP differed (p ˂ 0.01) between experimental years (Table S1). A higher Kc was factored into the estimate of the ETc in the second year, leading to an increase in grain caliber, plant height, and dry weight, but reducing the harvest index and CWP (Table S2). The experimental treatments influenced all variables (p ˂ 0.01, Table S1). Plant height interaction between years and treatments varied, but no other variable did (p ˂ 0.01, Table S1).

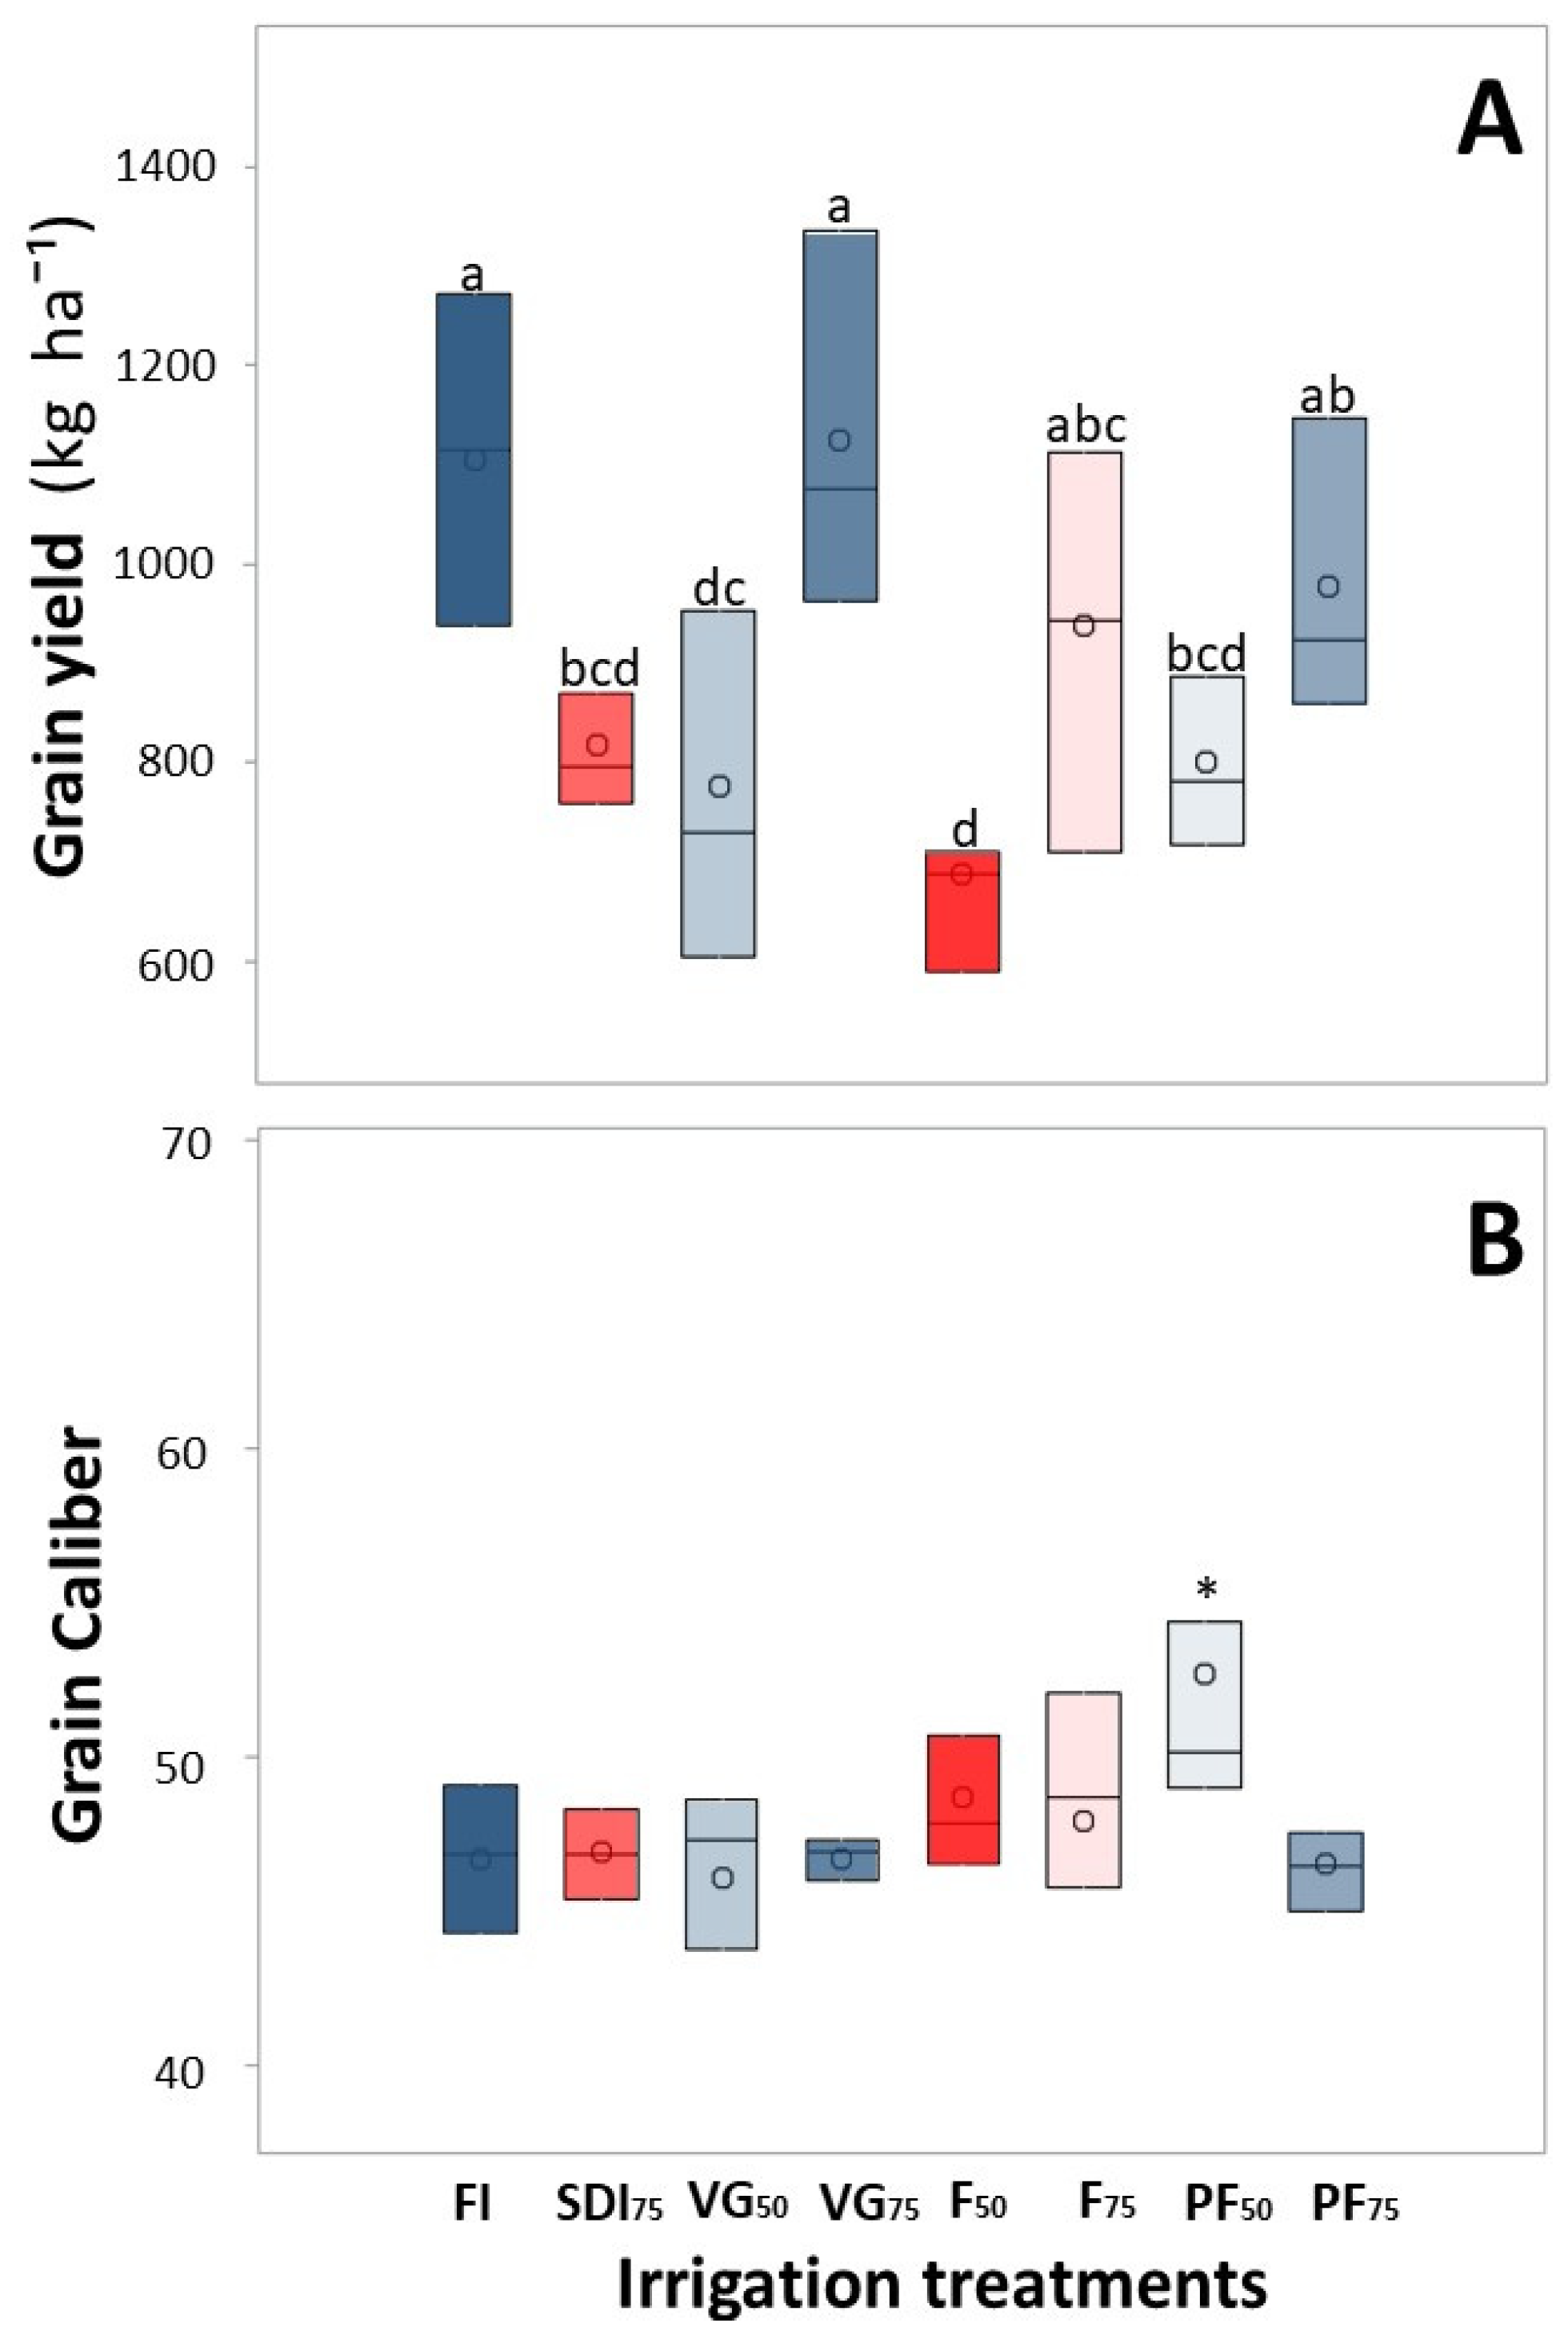
3.2. Grain Yield and Quality
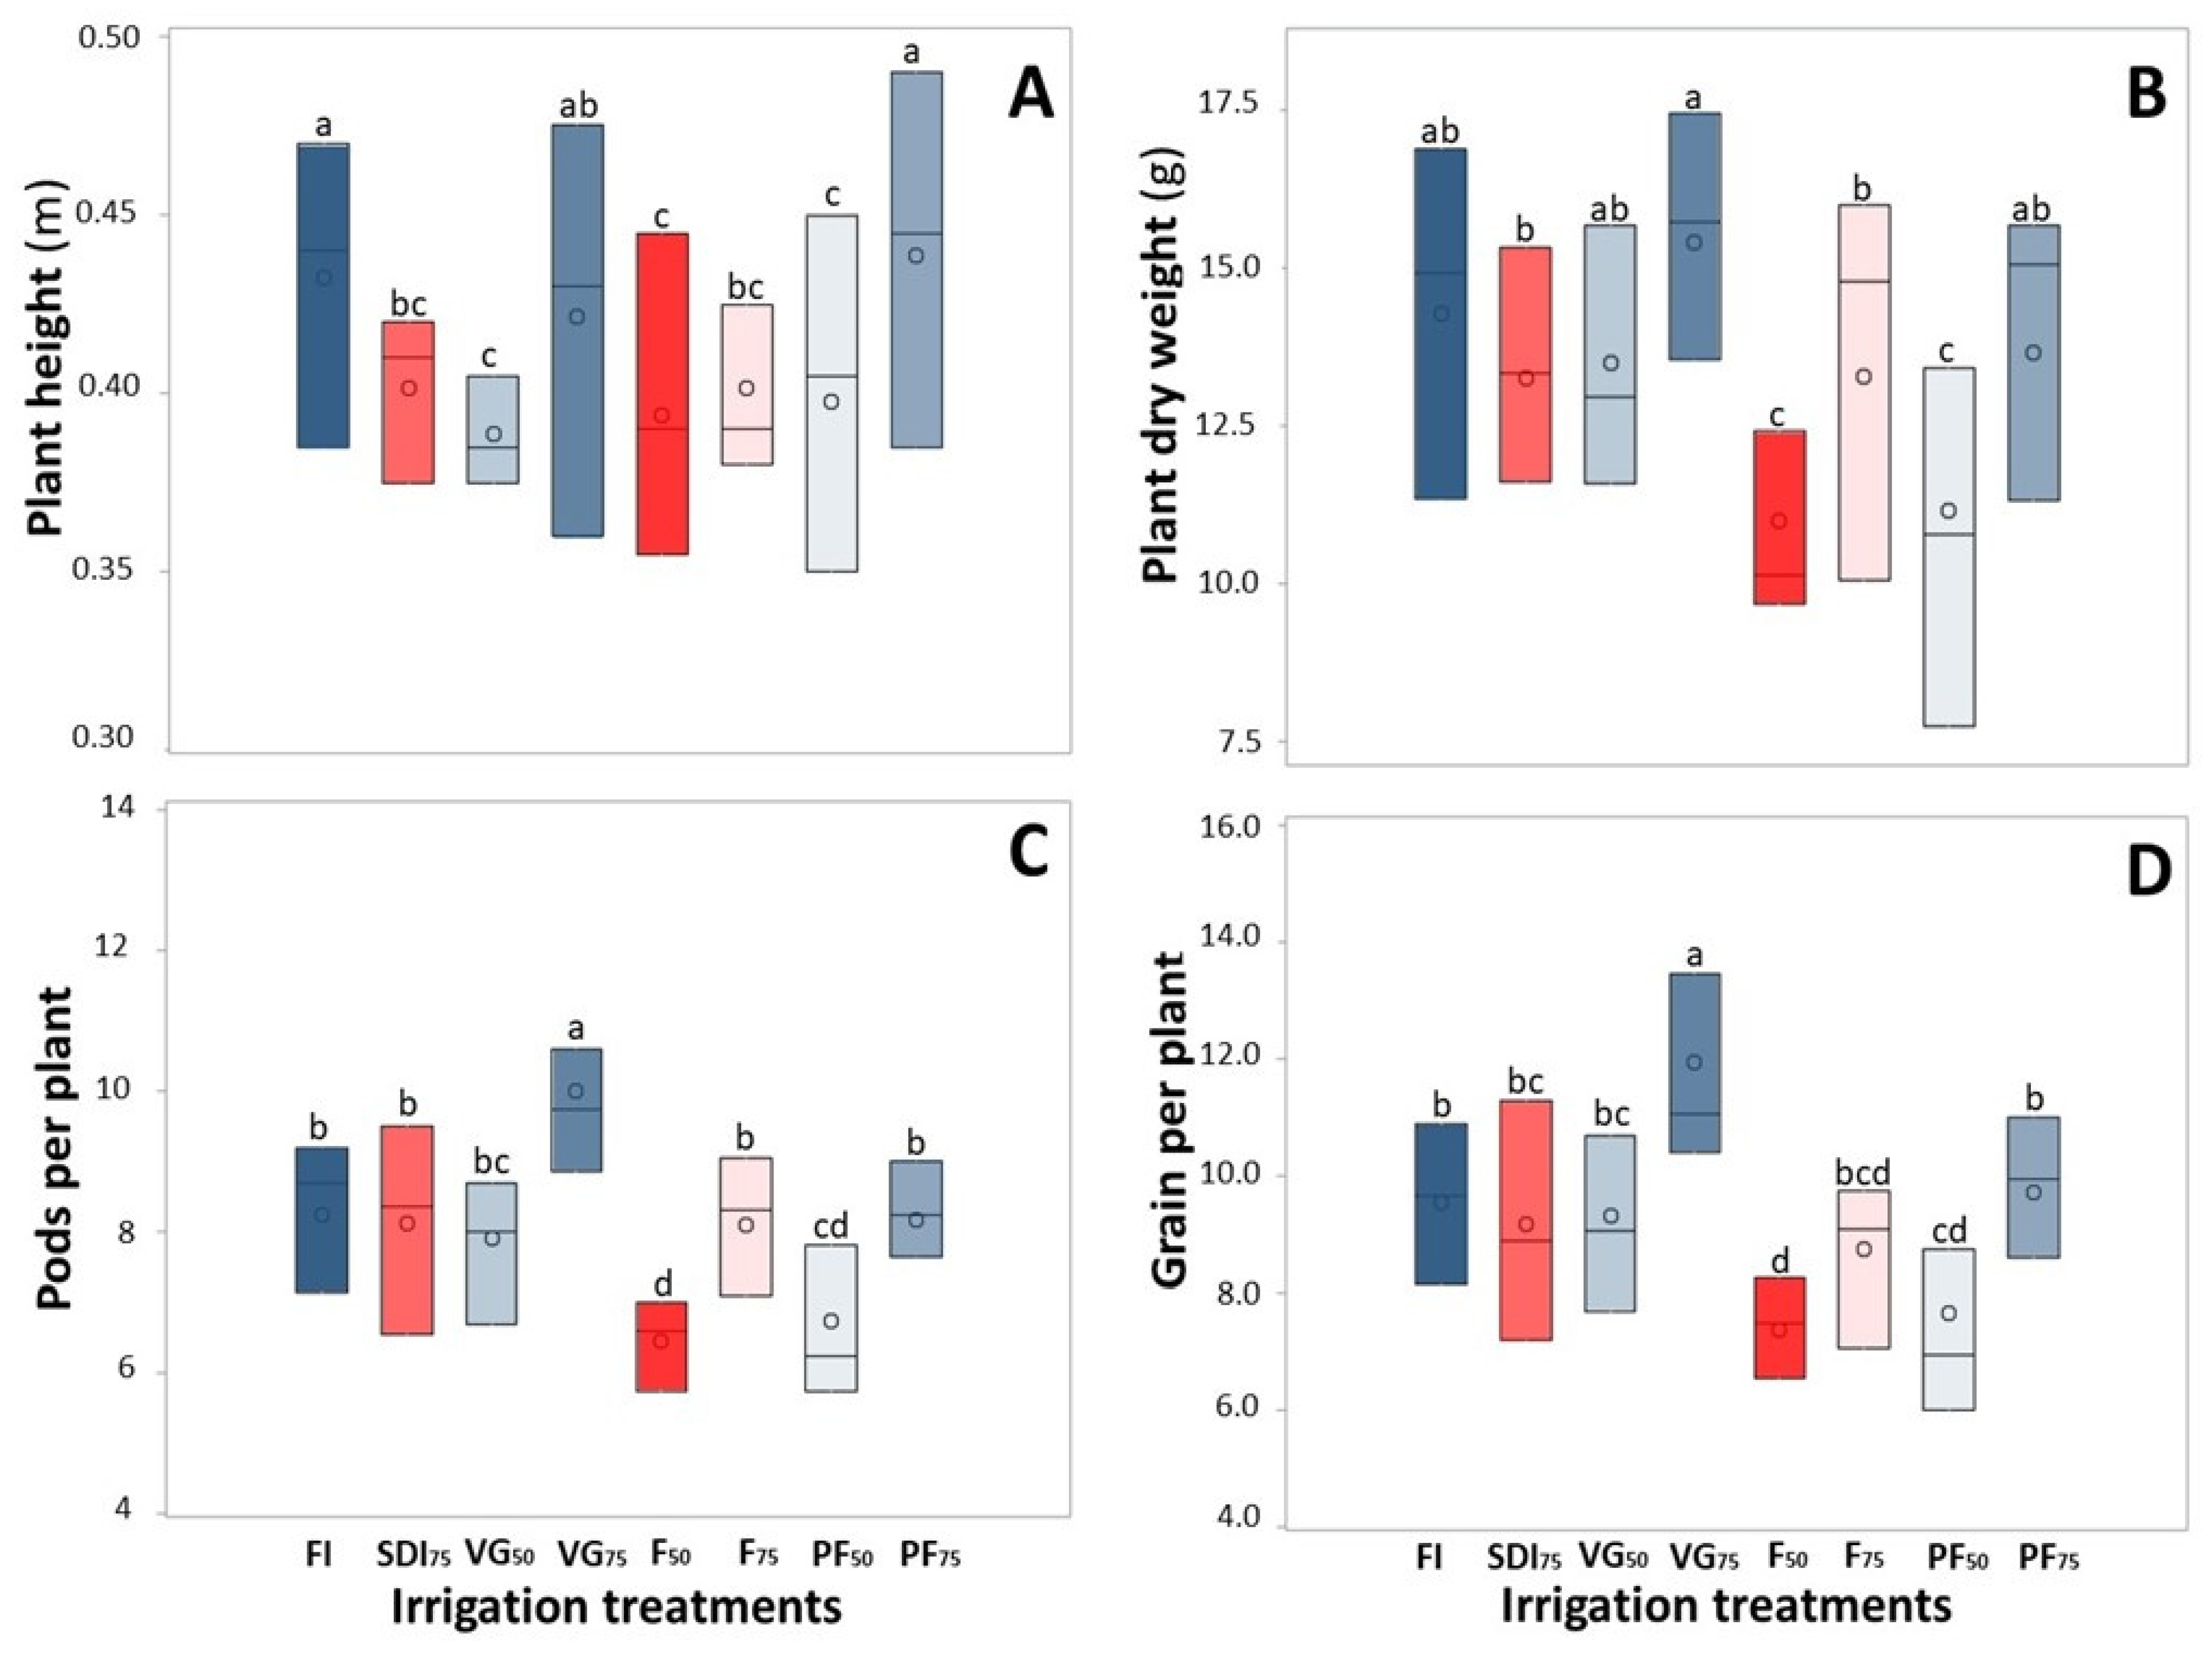
The highest grain yield was obtained in the treatments FI, VG75, F75, and PF75 (Figure 4A), with no statistical differences among them (p ≥ 0.05, LSD). A restriction in irrigation equal to 75 ETc (VG75) did not limit the grain yield with respect to pod-filling and flowering treatments (PF75 and F75, respectively) (Table 6), although the water deficit did limit productivity by 11.5 and 15.1%, respectively, in the latter treatments. Grain caliber was highest at PF50 with 52.7 grains in 30 g (Figure 4B). The rest of the treatments showed no differences in grain caliber (p ≥ 0.05, LSD), ranging between 46.0 to 48.7 grains at 30 g. Notably, water deficit during both flowering and pod filling affected grain caliber (Table 6), but a strong restriction of irrigation in the pod filling stage (PF50) had the greatest impact on grain caliber.

3.3. Plant Growth

The FI, VG75, and PF75 treatments had the largest effect on plant height (Figure 5A) (p ≤ 0.05, LSD); the rest of the treatments were not associated with a difference in plant height. The VG50, F50, and PF50 treatments produced shorter plant heights (between 9.4 and 11.7%, Table 7) than FI. The FI, VG50, VG75, and PF75 treatments were associated with the highest plant dry weight values (Figure 5B), while the F50 and PF50 treatments produced plants with less weight (between 22 and 23%; Table 7). The number of pods per plant and grains per plant (Figure 5C,D) was higher in the VG75 treatment. Plant dry weight, pods per plant, and grains per plant were most sensitive to the combined effect of the irrigation restriction implemented during the critical stage; this is the application of the PF50 and F50 treatments (Table 7).

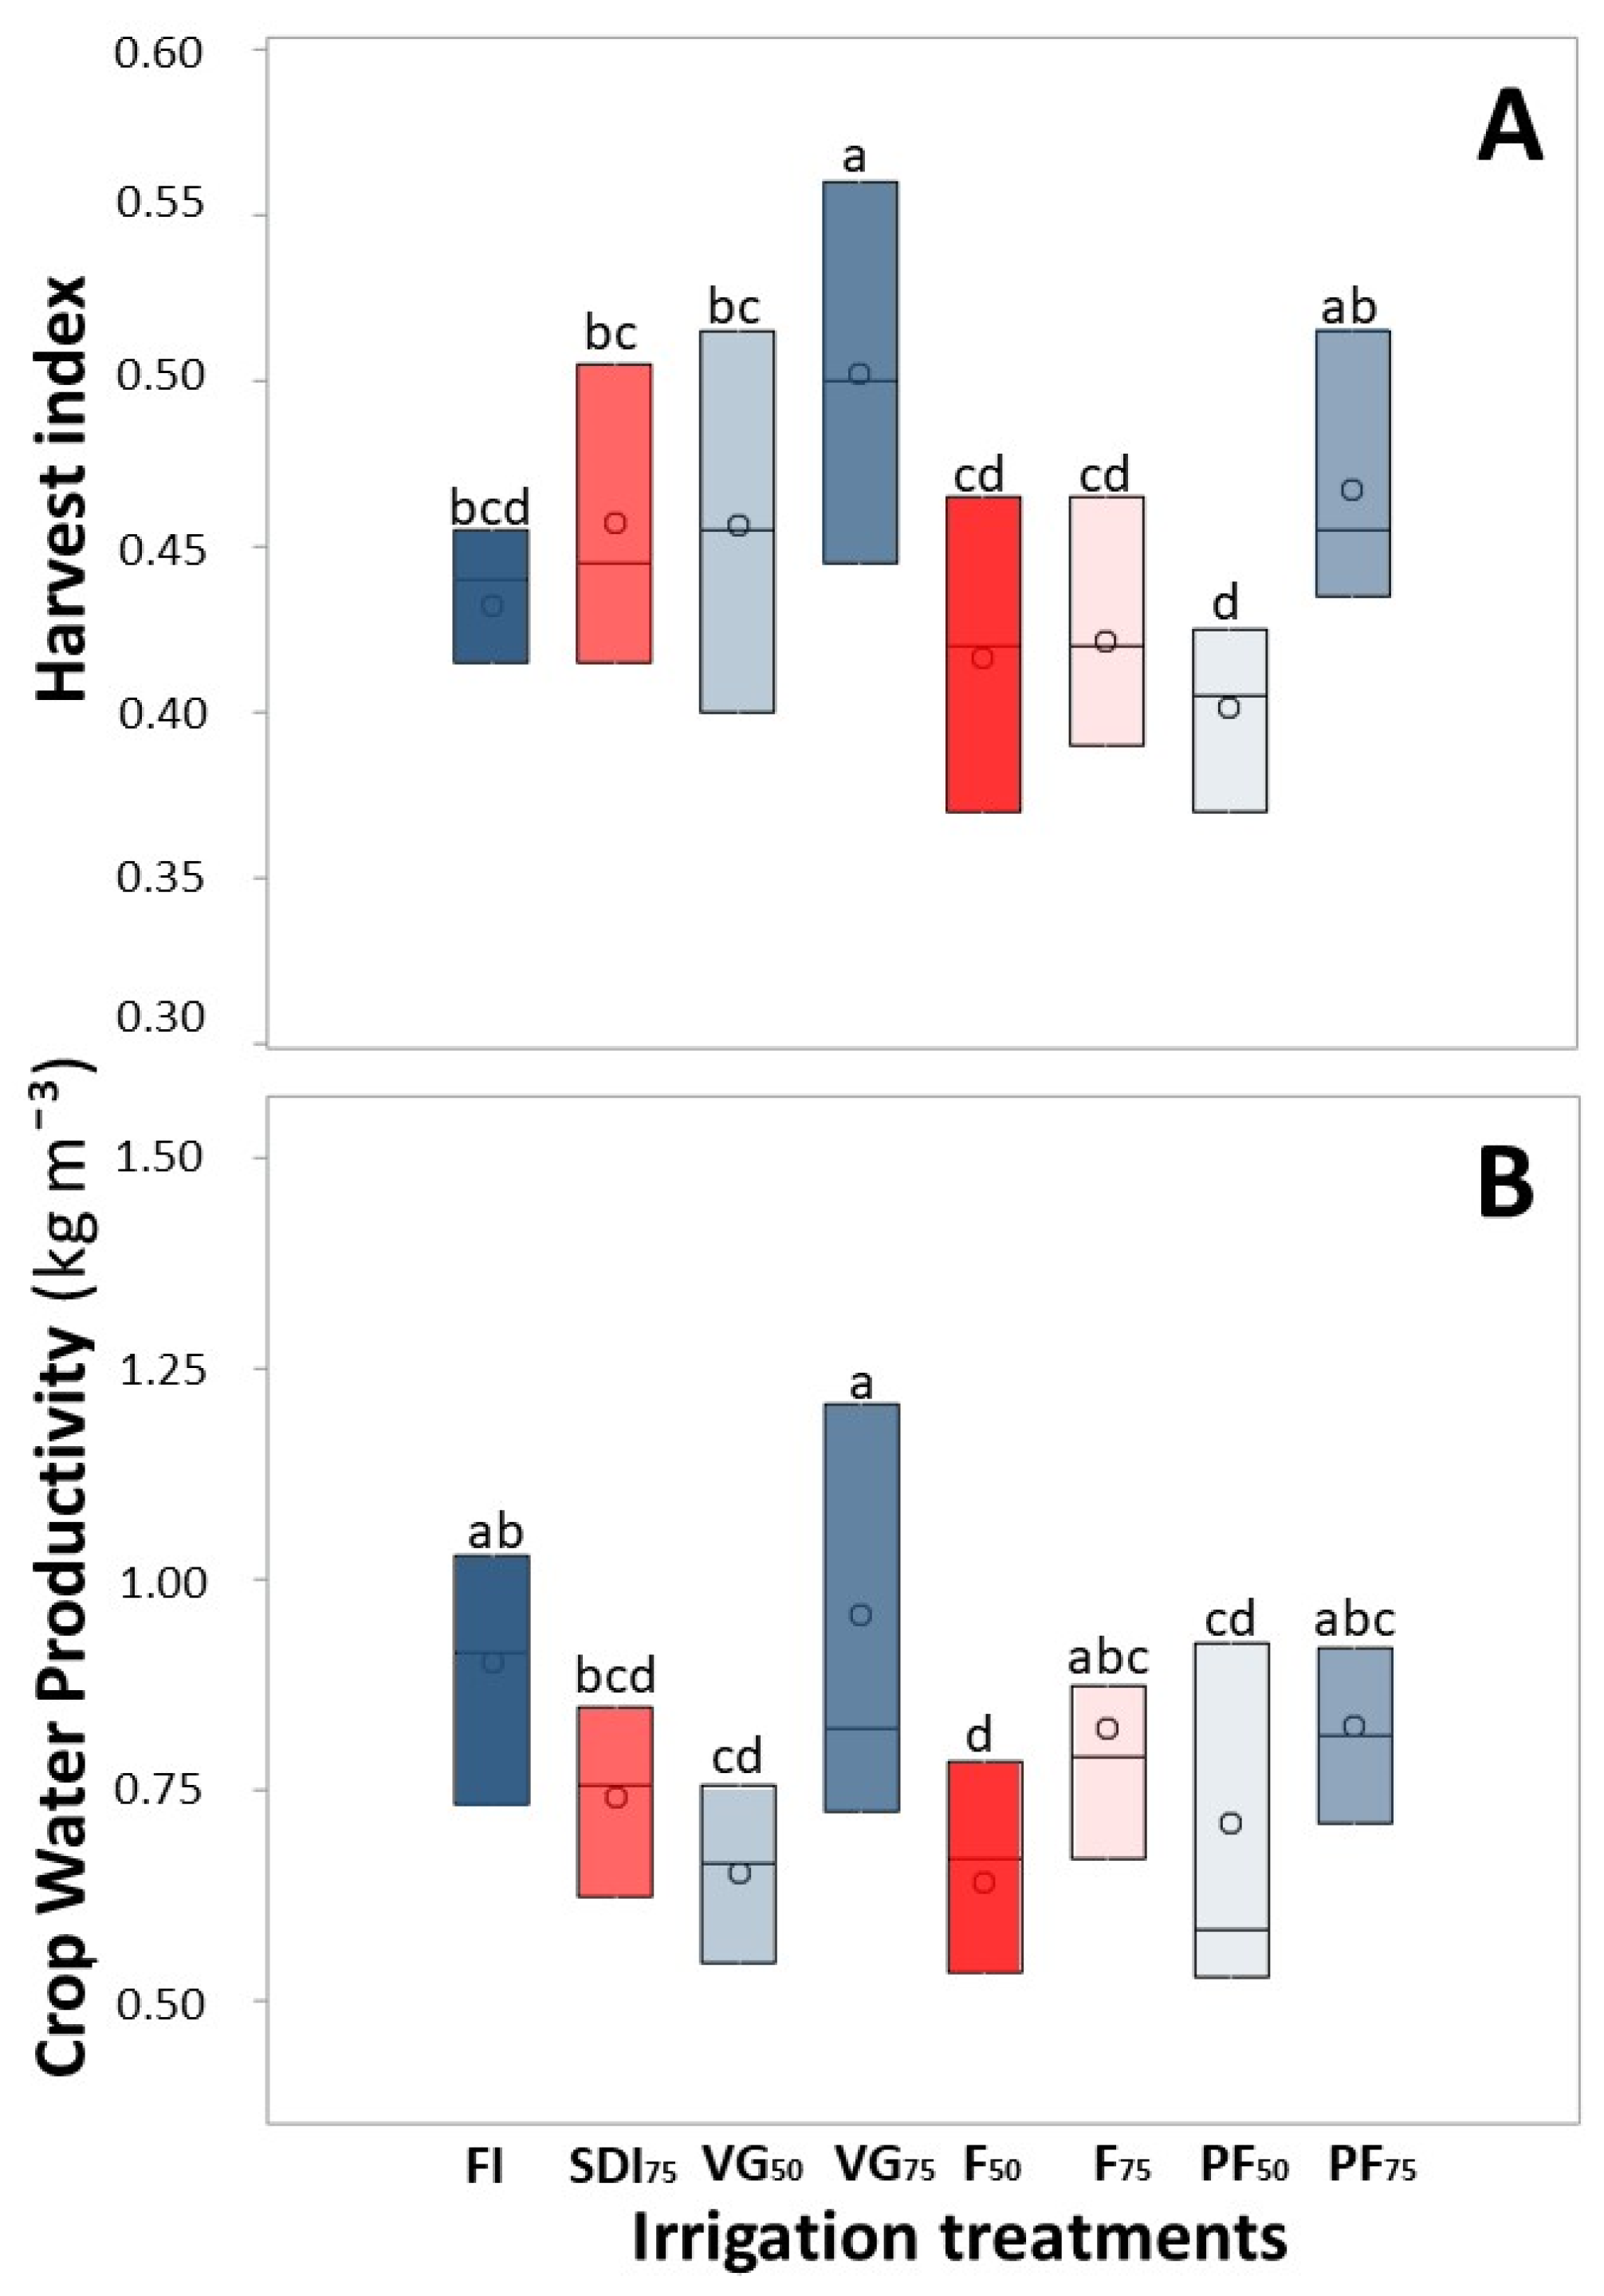
3.4. Crop Productivity

A higher harvest index was found in the VG75 and PF75 treatments (Figure 6A), while the PF50, F50, and F75 treatments were associated with lower harvest indexes (Table 8). CWP was the highest in the VG75, FI, F75, and PF75 treatments, while SDI75, PF50, F50, and VG50 showed the lowest values, and these did not differ in CWP (Figure 6B). The treatments VG50, F50, and PF50 limited the yield of the crop to a greater extent, even more than SDI75, even though a sustained deficit irrigation treatment was applied throughout the whole ontogeny of this crop (Table 8).

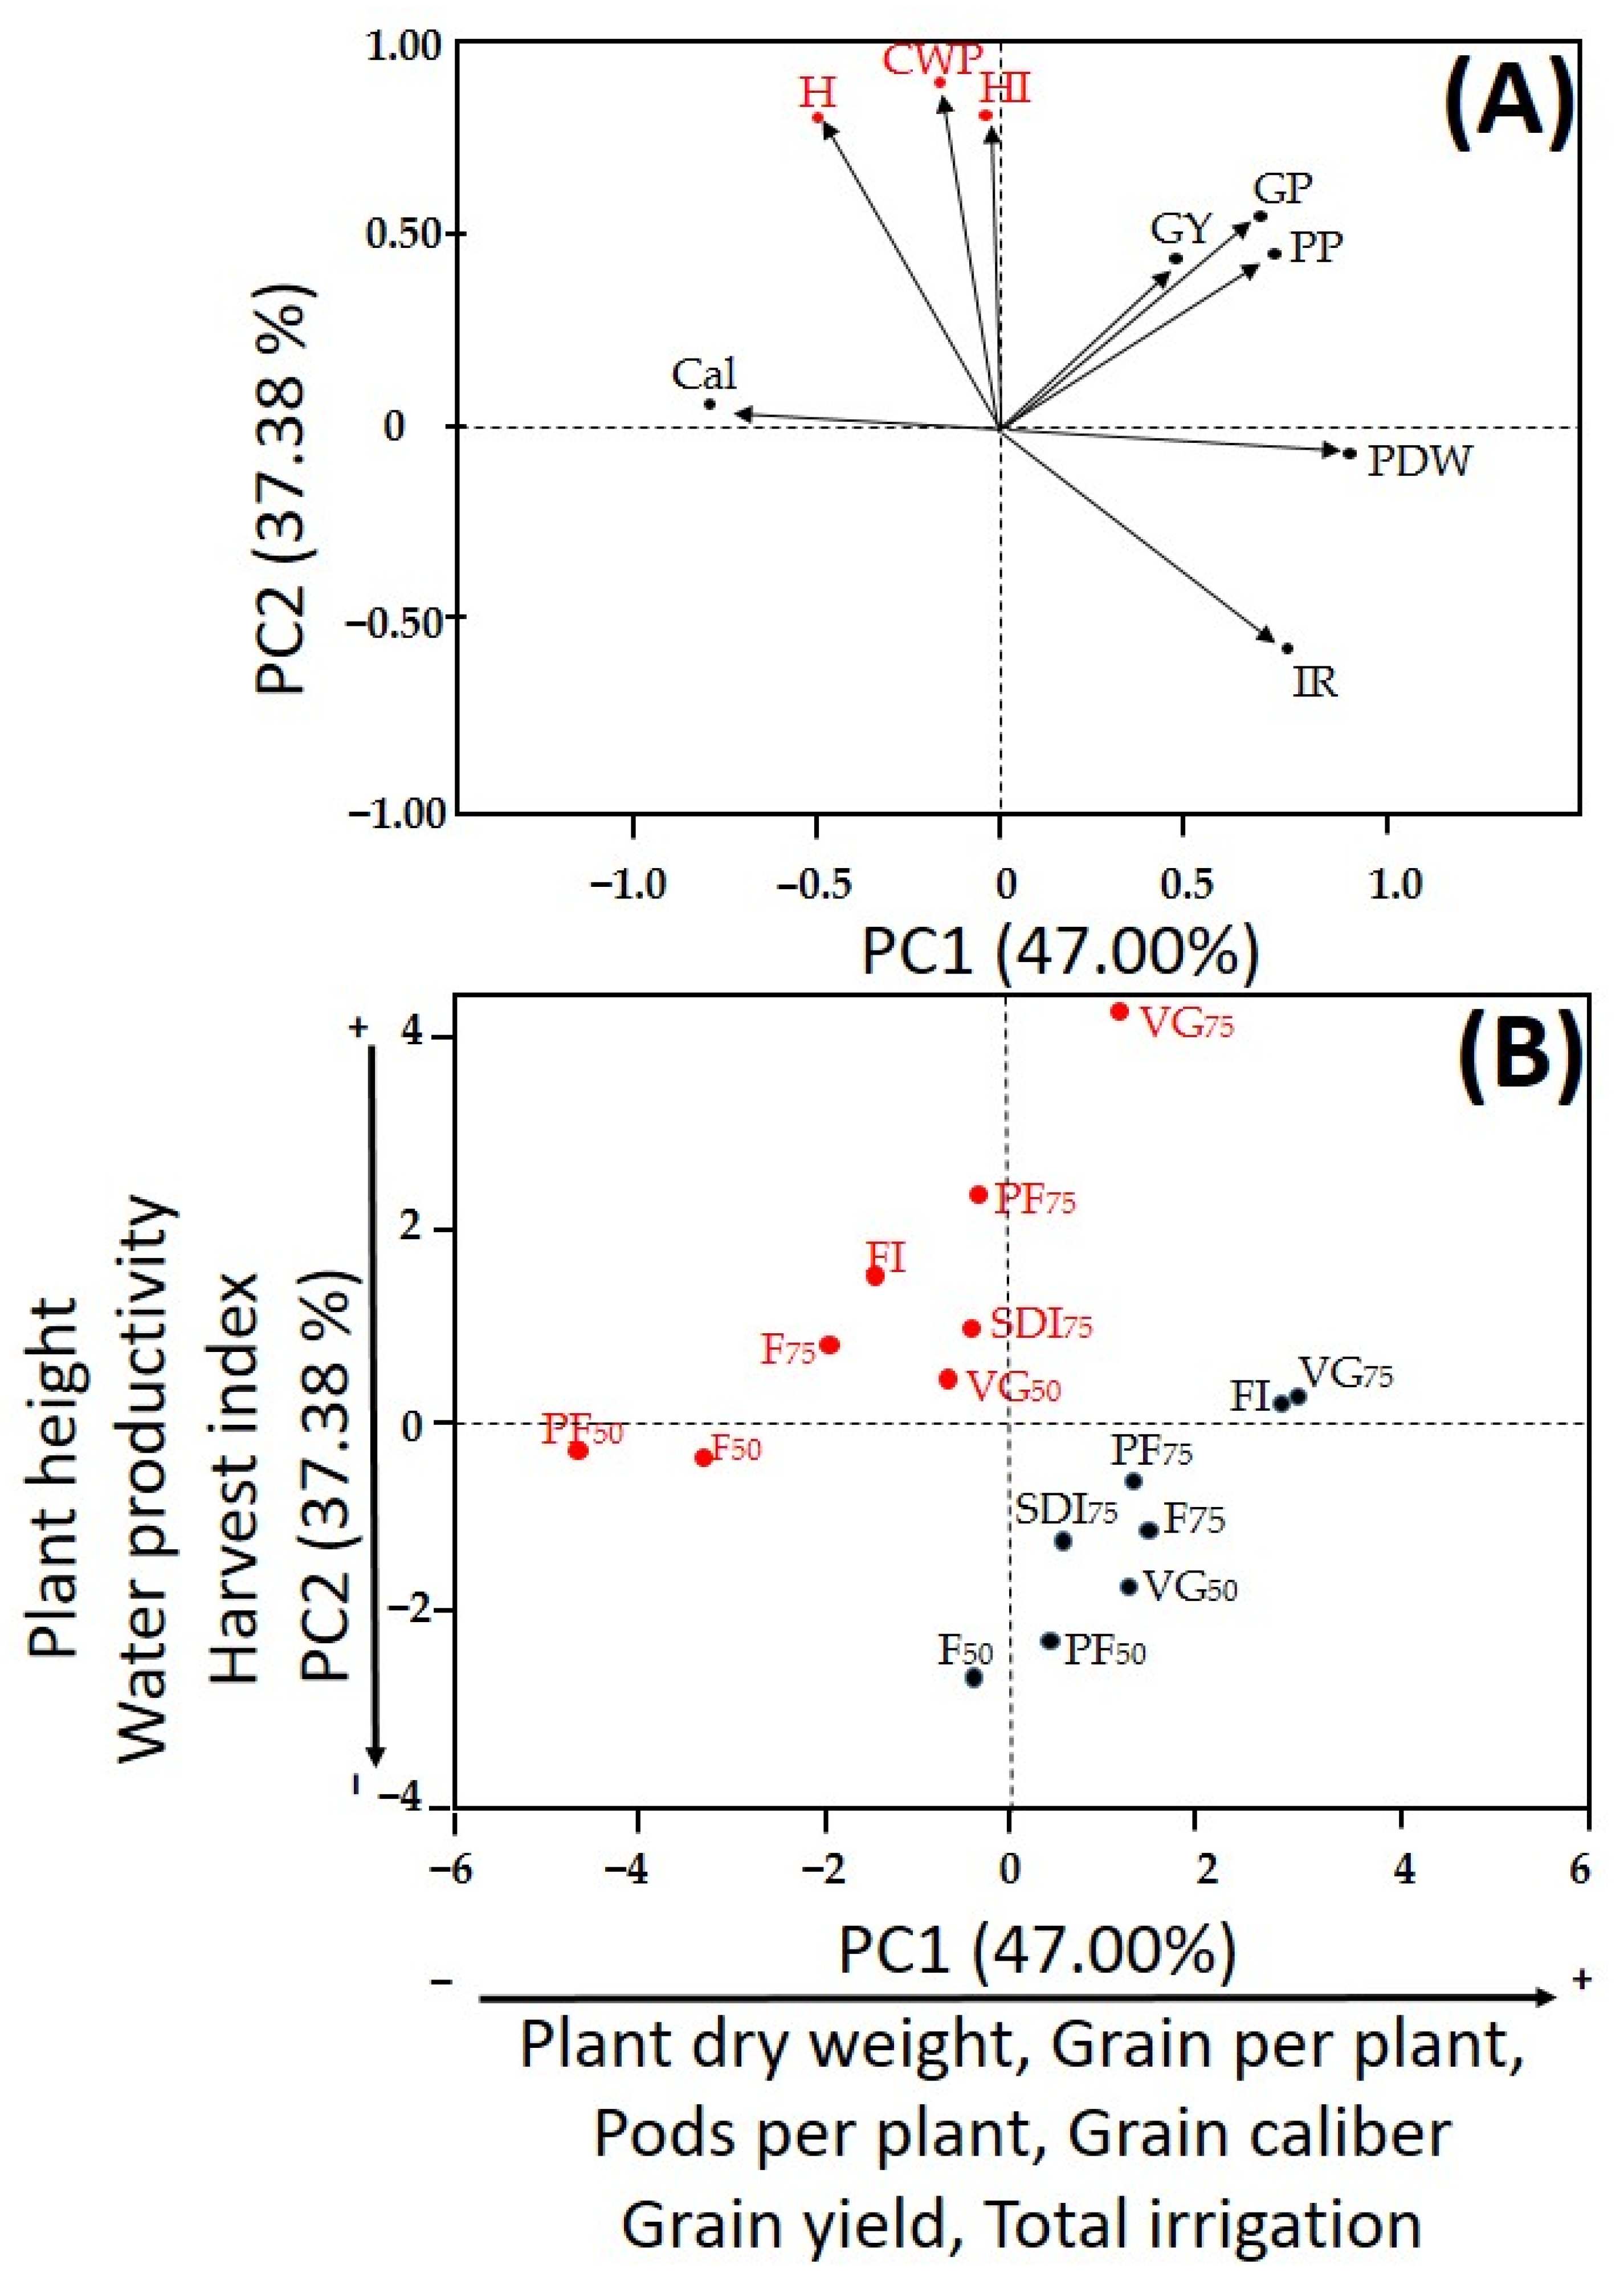
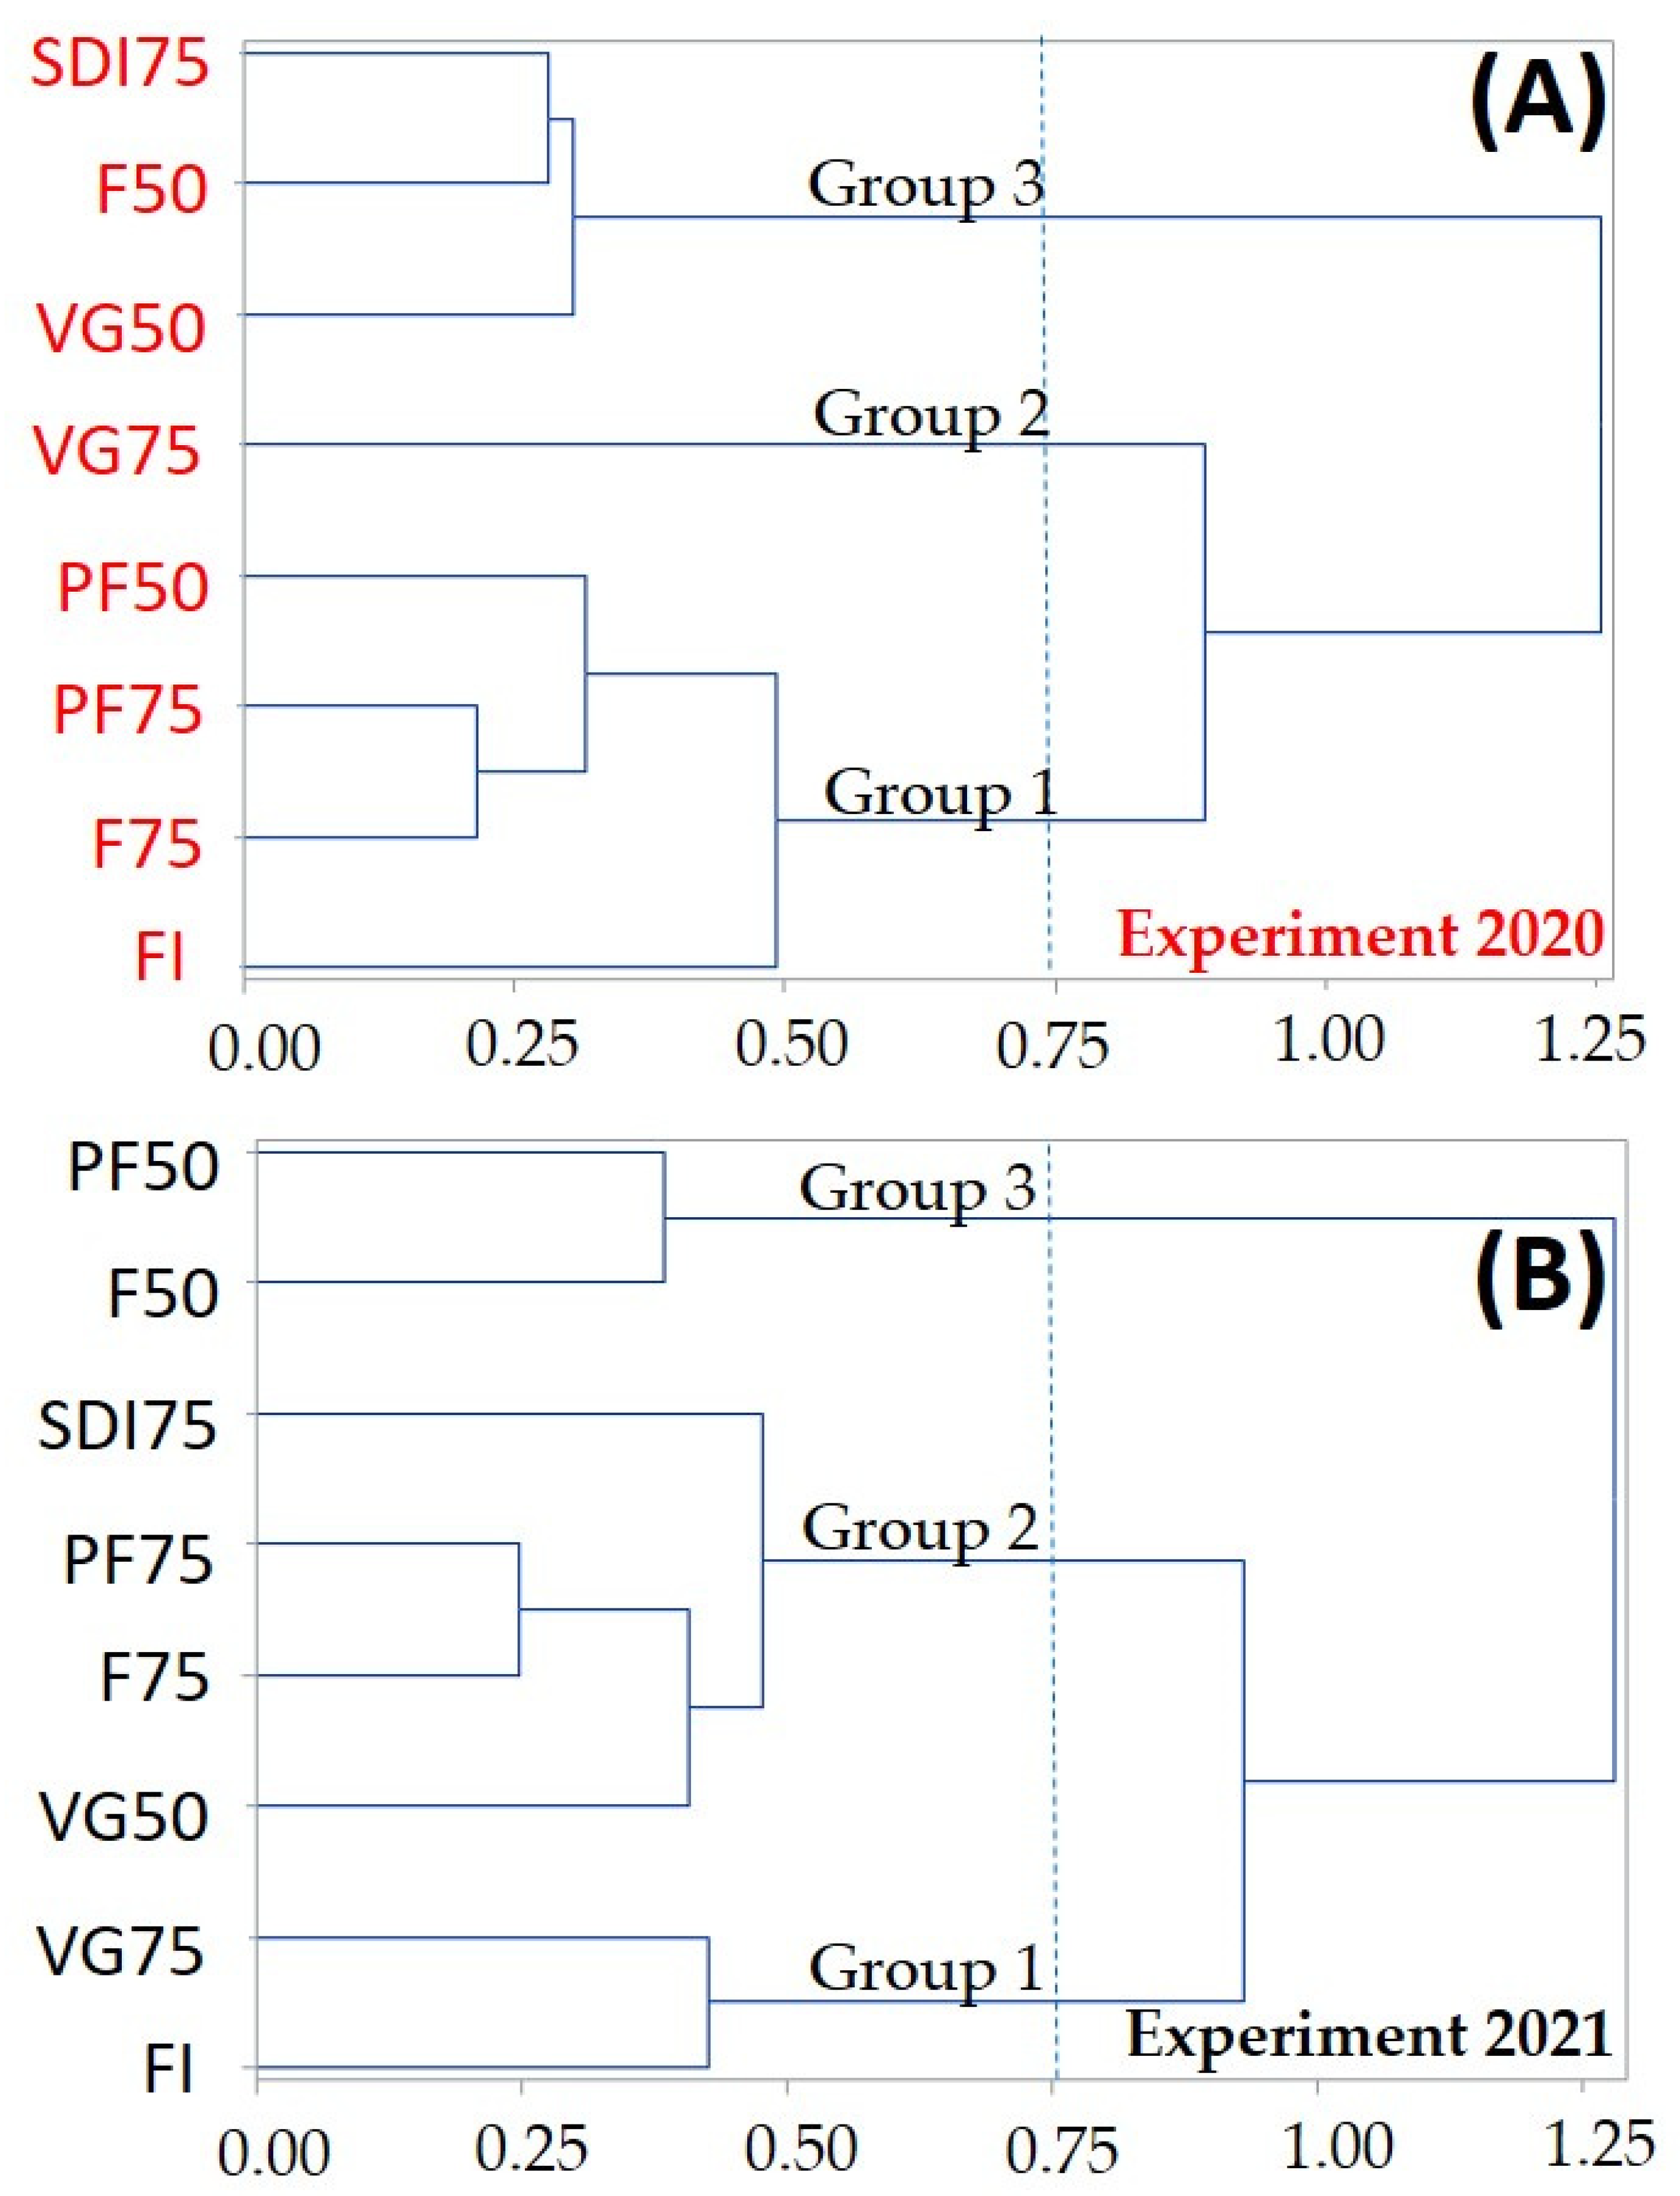
3.5. Multivariate Classification and Description for Irrigation Treatments

Data were summarized via principal component analysis (PCA) (Table 9). The first two main components (PC1 and PC2) accounted for 84.38% of the total variance, PC1 accounting for 47.0% of the total variance. PC1 was defined as a component capturing the variability of grain yield, plant traits, and accumulated irrigation, as shown by the high positive correlation of PC1 with grain yield (r = 0.62), plant dry weight (r = 0.99), pods per plant (r = 0.81), grains per plant (r = 0.77), total irrigation (r = 0.77), and its negative correlation with grain caliber (r = −0.85). On the other hand, PC2 explained 37.4% of the variance and was positively related to plant height, CWP, and harvest index.
Figure 7A,B shows the distribution of the variables and treatments in the first two principal components. Notably, the treatments evaluated in 2020 presented lower total irrigation, which limited plant dry weight, grains per plant, pods per plant, grain caliber, and grain yield in comparison with the treatments evaluated in 2021(Figure 7). Additionally, the 2020 treatments were associated with greater plant height, CWP, and harvest index. When integrating the information via cluster analyses across the years, VG75 formed a cluster on its own during 2020 (Figure 8A), but aggregated with FI during 2021 (Figure 8B).

4. Discussion

Our results agree with those of prior research on the regulated deficit irrigation (RDI) of chickpeas. As with those studies, we recommend implementing RDI during the vegetative growth stage, not during the flowering and pod filling stages, as it compromises crop yield [19,20,21]. Our work provides additional insights into refining efficient practices of RDI to maximize crop yield, as we have tested the effect of a high number of irrigation combinations over eight critical productivity-related variables. In accordance with our main hypothesis, RDI during vegetative growth enhances CWP, but only when applying irrigation equivalent to 75% of ETc. This level of 75% RDI appears to optimize CWP without affecting productivity. In contrast, the application of SDI or RDI during the flowering and pod-filling stages compromised grain yield viability and reduced CWP. In conjunction, the potential for environmental, economic, and energetic savings can be inferred from this study.

4.1. Across-Year Differences in Productivity, Growth and Grain Yield, and Quality

Because Kc varied by 25% across the years, the actual volume of water irrigated was 49% greater in the 2021 experimental year compared to that in the prior year. This difference was a product of climate differences between the years. The increased water volume in the year 2021 did not promote better grain yield, pods per plant, and grains per plant values. In the growing season of 2021, there was a slight increase in temperature and lower relative humidity, which increased ETc and vapor pressure deficits (Figure 3). This meteorological condition occurred between 50 and 90 days after planting (coinciding with the final flowering and pod-filling stages), thus reducing pollen production per flower in 2021, which, in turn, affected the percentage of germinated pollen, pod production, the number of seeds per pod, and the final crop yield. Similar impacts of drought on pollen production were found in other chickpea genotypes [35,36,37].
Our observed differences in grain caliber and plant dry weight between the years with contrasting climate conditions were consistent with those found by other studies [21,38], as minor restrictions in irrigation increased seed weight, and with this, increase the caliber and dry weight of the plants at harvest. In contrast, plant heights appeared to respond positively to low amounts of water restriction. However, plant height showed minimal differences or even slightly higher heights for plants under deficit irrigation [21]. The harvest index, the proportion of grain produced per total weight of the plant, also varied between years. The harvest index was higher during 2020, implying a larger proportion of grain weight over plant dry weight. The increase in the harvest index when the irrigation water volumes were lower is concordant with previous research reporting that the water deficit applied in reproductive stages increases the allocation of plant resources in the reproductive organs, improving the productivity parameters in the crop [39]. Given that the irrigation volume was lower by 49% in 2020 compared to 2021, and grain yield was not different across years, CWP was higher in 2020. These results are consistent with those of other studies in which chickpea crops were subject to lower total irrigation volume derived from a deficit irrigation application, and even when the grain production per plant was not optimal, CWP increased due to the application of a lower water volume [19].

4.2. Effects of RDI and SDI Treatments on Chickpea Grain Yield and Quality, Plant Growth, and Productivity

The treatments that achieved higher grain yield were full irrigation or those that applied regulated deficit irrigation considering crop evapotranspiration of 75% during the vegetative growth (VG75), flowering (F75) or pod filling (PF75) stages; the latter three treatments saved 24, 74, and 34 m3 ha−1 of water on average in the two years of evaluation of (the average of the two growing seasons; Table 4). Oppositely, the lowest grain yield were produced by treatments in the VG50, F50, and PF50 stages (Table 6). The results of grain yield under full irrigation and regulated deficit irrigation during vegetative growth are consistent with those of other studies for the Desi chickpea, showing the best grain yield (6.7 t ha−1) under irrigation restriction at the vegetative stages (50% ETc), followed by full irrigation treatment (4.9 t ha−1) [20] with irrigation volumes of 2300 m3 ha−1 and 2750 m3 ha−1, respectively. Further evidence indicates that the grain yield performance under regulated deficit irrigation was reduced with respect to full irrigation, restricting grain yield by up to 38% [40]. In our study, grain yield from sustained deficit irrigation treatment was better than for treatments in VG50, F50, and PF50 due to the last ones experiencing a shorter period of stress but with more intensive irrigation restriction (50% of ETc in any crop stage studied).
Grain caliber was only affected by regulated deficit irrigation applied at 50% of the ETc in the pod-filling stage, which denotes once again the importance of not applying this irrigation strategy at this stage of development (Table 6), otherwise a reduction in the weight of the grains will be caused; this result agrees with that of previous findings [19] but disagrees with that of another report [40] in which the application of a water deficit during the reproductive phase, although at larger volumes than those used in our research, increased the translocation of resources to the reproductive organs.
Plant height was of a larger value under full irrigation treatments, and under those of regulated deficit irrigation applying 75% of the ETc in the vegetative growth and pod-filling stages. The treatments that applied 50% of the ETc in the three stages evaluated significantly reduced plant height (Table 7). Other studies found that height is mainly affected in the vegetative growth stage (a reduction of 12.1%) with respect to the reproductive stages (a decrease of 9.23%) [40]. In our study, plant height under treatments of regulated deficit irrigation applying 50% of ETc during the vegetative growth and flowering stages diminished 11.7 and 9.4% respectively. As plant height is a function of the water availability in any environment, and is associated with biomass, it is expectable that regulated deficit irrigation applying 50% of ETc would reduce the investment in above-ground biomass [41]. Therefore, plant height and plant dry weight were higher under full irrigation and were less affected under treatments with irrigation restriction in the vegetative growth (50 and 75% of ETc) stage, as well as in the pod filling stage applying 75% of ETc; likewise, more restrictive irrigation was associated to reductions in plant height, as found elsewhere [42].
Pods per plant and grains per plant decreased as the water restriction increased (an application of 50% of ETc) in the flowering and pod-filling stages (Table 7); this situation is coincident with that found by other evaluations reporting a 3% decrease in the number of pods and grains per plant [43]. The harvest index had less reductions under lower irrigation restrictions, which is consistent with the results of other research [40,43], and regulated deficit irrigation during the flowering stage or under substantial restrictions (50% of ETc) in the pod-filling stage impacted pods per plant and grains per plant to a greater degree. Finally, CWP was reduced due to the application of regulated deficit irrigation in the flowering and pod-filling stages, because the biomass invested in reproductive structures was diminished as water stress promotes abortion or low grain yield. At the same time, in the case of regulated deficit irrigation during vegetative growth applying 50% of ETc also impacted CWP (Table 8). Other studies show that applications of 50% of full irrigation in the flowering stage in comparison to the pod filling stage generates significant reductions in CWP, the prior being more sensitive than the latter; so, in our study, flowering is confirmed as the most sensitive stage in which the application of regulated deficit irrigation impacts CWP more [19].

4.3. Synthetic Analyses

The principal component analysis successfully summarized the contributions of each of the variables with each component (Figure 7A), resulting in PC1 being associated with grain yield, plant dry weight, pods per plant, grains per plant, and total irrigation, and in PC1 being negatively associated with grain caliber. On the other hand, PC2 was positively related to plant height, CWP, and harvest index. Thus, it was observed that the treatments evaluated in 2020 were mainly associated with PC2, while the treatments evaluated in 2021 had stronger associations with PC1. Concerning the stages and levels of irrigation, in the years 2020 and 2021, treatments that applied irrigation at 50% of ETc during the flowering and pod-filling stages most affected the production of plants (Figure 7B). Another relevant contribution was the clusters formed by the year (Figure 8A,B), where VG75 was segregated as a relevant treatment with outstanding influence on both of the main components (PC1 and PC2). These results are coherent with recommendations that the vegetative growth stage is the reference stage for applying regulated deficit irrigation strategies [20]. The reason is that regulated deficit irrigation modifies the patterns of allocation of the root and above-ground biomass and reaffirms the previous recommendation of not stressing the plant with this irrigation strategy during the flowering and pod-filling stages, thus enabling the plant to optimize its photosynthesis and carbon translocation to its reproductive organs, and increasing grain productivity [20].

5. Conclusions

In concordance with our hypothesis, regulated deficit irrigation (i.e., crop irrigation in specific stages of plant development under the full requirement for optimal plant growth) applied in the vegetative stages is the best means to improve CWP. But the application of regulated deficit irrigation in the flowering and grain filling stages negatively impacts CWP; it is affected even more if the level of the reduction of irrigation reaches 50% of the crop evapotranspiration. This trend shows that the greater the restriction of irrigation, the more significant the impact on grain yield derived from a lower number of capsules and grains per plant. At the same time, CWP benefits from slight irrigation restrictions not reaching 50% of the crop evapotranspiration (at any crop stage). We consider necessary to assess other levels of Kc in the stages of cultivation, which will allow an exploration of productive potential, refining the levels of 50 to 75% of ETc, seeking to increase grain yield and CWP, which would allow for the optimization of the implementation of regulated deficit irrigation schemes worldwide.

Supplementary Materials

The following supporting information can be downloaded at: https://www.mdpi.com/article/10.3390/agronomy13030917/s1, Table S1: Analysis of variance of eight productivity, yield, quality, and growth variables of chickpeas across deficit irrigation treatments during two consecutive years of experiments (2020 and 2021) in Todos Santos, Baja California Sur, Mexico. Table S2: Differences in grain yield and quality, plant growth, and crop water productivity of chickpeas between two consecutive years of deficit irrigation experiments (2020, 2021) in Todos Santos, Baja California Sur, Mexico.

Author Contributions

Conceptualization, methodology, formal analysis, investigation, writing—original draft preparation, funding acquisition, J.D.O.-A.; conceptualization, supervision, funding acquisition, writing—original draft preparation, and visualization, R.M.-A.; supervision, funding acquisition, writing—review and editing, A.T.-C.; supervision, writing—review and editing, R.S.-L.; supervision, writing—review and editing, R.H.-M.; supervision, writing—review and editing, G.W.M. All authors have read and agreed to the published version of the manuscript.

Funding

This research was carried out with the support of INIFAP, CICESE, and CONACYT (grant: 2022-000018-02NACF-14205).

Data Availability Statement

Not applicable.

Acknowledgments

This work is a partial requirement to fulfill a program at the Posgrado en Ciencias de la Vida (PCV-CICESE). We acknowledge the support by CONACYT, PCV-CICESE (19191369), and INIFAP. We thank Carlos Ariel Cabada Tavares for his help in the establishment and management of the field experiments. We also thank Yuri Vladimir Albores Barajas for his comments and improvements in the writing of this manuscript. We acknowledge that the study site was on the traditional territory of the Guaycura Indigenous people.

Conflicts of Interest

The authors declare no conflict of interest. The funders had no role in the design of the study; in the collection, analyses, or interpretation of data; in the writing of the manuscript; or in the decision to publish the results.

References

  1. IPCC. Climate Change 2014: Synthesis Report. Contribution of Working Groups I, II, and III to the Fifth Assessment Report of the Intergovernmental Panel on Climate Change; Core Writing Team, R.K.P., Meyer, L.A., Eds.; IPCC: Geneva, Switzerland, 2014; pp. 8–16. [Google Scholar]
  2. Ault, T.R.; Makin, J.S.; Cook, B.I.; Smerdon, J.E. Relative impact of mitigation, temperature, and precipitation on 21st-century megadrought risk in the American Southwest. Sci. Adv. 2016, 2, e1600873. [Google Scholar] [CrossRef] [PubMed] [Green Version]
  3. Stevenson, S.; Coats, S.; Touma, D.; Cole, J.; Lehner, F.; Fasullo, J.; Otto-Bliesner, B. Twenty-first century hydroclimate: A continually changing baseline, with more frequent extremes. Proc. Natl. Acad. Sci. USA 2022, 119, e2108124119. [Google Scholar] [CrossRef]
  4. Woodhouse, C.A.; Meki, D.M.; MacDonald, G.M.; Stahle, D.W.; Cook, E.R. A 1,200-year perspective of 21st-century drought in southwestern North America. Proc. Natl. Acad. Sci. USA 2010, 107, 21283–21288. [Google Scholar] [CrossRef] [PubMed] [Green Version]
  5. Water in Agriculture, The World Bank. Available online: http://www.worldbank.org/topic/water-in-agriculture (accessed on 7 March 2023).
  6. Heyari, N. Water productivity in agriculture: Challenges in concepts, terms, and values. Irrig. Drain. 2013, 63, 22–28. [Google Scholar] [CrossRef]
  7. Kilemo, D.B. The review of water use efficiency and water productivity metrics and their role in sustainable water resources management. Open Access Libr. J. 2022, 9, 1–21. [Google Scholar] [CrossRef]
  8. Ferere, E.; Soriano, M.A. Deficit irrigation for reducing agricultural water use. J. Exp. Bot. 2007, 98, 147–159. [Google Scholar] [CrossRef] [Green Version]
  9. Abdelkhalik, A.; Pascual, B.; Nájera, I.; Baixauli, C.; Pascual-Seva, N. Deficit irrigation as a sustainable practice in improving irrigation water use efficiency in cauliflower under Mediterranean conditions. Agronomy 2019, 9, 732. [Google Scholar] [CrossRef] [Green Version]
  10. Chai, Q.; Gan, Y.; Zhao, C.; Xu, H.; Waskon, R.; Niu, Y.; Siddique, K.H.M. Regulated deficit irrigation for crop production under drought stress. A review. Agron. Sustain. 2016, 36, 3. [Google Scholar] [CrossRef] [Green Version]
  11. Singh, M.; Singh, P.; Sukhbir, S.; Saini, R.K.; Angadi, S.V. A global meta-analysis of yield and water productivity responses of vegetables to deficit irrigation. Nat. Sci. Rep. 2021, 11, 22095. [Google Scholar] [CrossRef]
  12. Yang, B.; Fu, P.; Lu, J.; Ma, F.; Sun, X.; Fang, Y. Regulated deficit irrigation: An effective way to solve the shortage of agriculture for horticulture. Stress Biol. 2022, 2, 28. [Google Scholar] [CrossRef]
  13. Endalu, L.; Temesgen, T. Systematic review: Effects of irrigation water quality and deficit irrigation on crop yield and water use efficiency. Turk. J. Agric. 2020, 8, 1201–1220. [Google Scholar] [CrossRef]
  14. Chalmers, Y.M. Influence of Sustained Deficit Irrigation on Physiology and Phenolic Compounds in Winegrapes and Wine. Ph.D. Thesis, Discipline of Wine and Horticulture, The University of Adelaide, Adelaide, School of Agriculture, Food and Wine, Australia, Adelaide, Australia, 2007. Available online: https://digital.library.adelaide.edu.au/dspace/bitstream/2440/50101/9/01front.pdf (accessed on 6 October 2022).
  15. Hassan, I.F.; Gaballah, M.S.; El-Hoseiny, H.M.; El-Sharnouby, M.E.; Alam-Eldein, S.M. Deficit Irrigation to Enhance Fruit Quality of the ‘African Rose’ Plum under the Egyptian Semi-Arid Conditions. Agronomy 2021, 11, 1405. [Google Scholar] [CrossRef]
  16. Parra, R.A.; Ortiz Franco, P.; Amado Álvarez, J.P.; Chávez Sánchez, N. Productividad y crecimiento de manzano bajo déficit de riego controlado. Terra Latinoam. 2009, 27, 337–343. [Google Scholar]
  17. Simsek, M.; Comlekcioglu, N.; Oztuk, I. The effects of the regulated deficit irrigation on yield and some yield components of common bean (Phaseolus vulgaris L.) under semi-arid conditions. Afr. J. Biotechnol. 2011, 10, 4057–4064. [Google Scholar]
  18. Hirick, A.; Choukr-Allah, R.; Jacobsen, S.E. Deficit irrigation and organic compost improve growth and yield of quinoa and pea. J. Agron. Crop Sci. 2014, 200, 390–398. [Google Scholar] [CrossRef]
  19. Hirich, A.; Choukr-Allah, R.; Fahmi, H.; Rami, A.; Laajaj, K.; Jacobsen, S.; El Omari, H. Using deficit irrigation to improve crop water productivity of sweet corn, chickpea, faba bean, and quinoa: A synthesis of several field trials. Rev. Mar. Sci. Agron. Vét. 2014, 2, 15–22. [Google Scholar]
  20. Hirich, A.; Choukr-allah, R.; Jacobsen, S.E.; Hamdy, A.; El Youssfi, L.; El Omari, H. Improving water productivity of chickpeas by the use of deficit irrigation with treated domestic wastewater. World Acad. Sci. Eng. Technol. 2011, 59, 1352–1357. Available online: https://www.researchgate.net/publication/282006481_Improving_water_productivity_of_chickpea_Cicer_arietinum_by_the_use_of_deficit_irrigation_with_treated_domestic_wastewater (accessed on 28 December 2022).
  21. Douh, B.; Mguidich, A.; Jar Allah Al-Marri, M.; Moussa, M.; Rjeb, H. Assessment of deficit irrigation impact on agronomic parameters and water use efficiency of six chickpeas (Cicer arietinum L.) cultivars under Mediterranean semi-arid climate. Ital. J. Agrometeorol. 2021, 2, 29–42. [Google Scholar] [CrossRef]
  22. Mekonnen, L. Effects of water stress applied at different phenological phases of chickpea (Cicer arietinum L.). Int. J. Agric. Res. Innov. Technol. 2020, 10, 13–21. [Google Scholar] [CrossRef]
  23. Geerts, S.; Raes, D. Deficit irrigation as an on-farm strategy to maximize crop water productivity in dry areas. Agric. Water Manag. 2009, 96, 1275–1284. [Google Scholar] [CrossRef] [Green Version]
  24. Ochoa-Noriega, C.A.; Aznar-Sánchez, J.A.; Velasco-Muñoz, J.F.; Álvarez-Bejar, A. The use of water in agriculture in Mexico and its sustainable management: A bibliometric review. Agronomy 2020, 10, 1957. [Google Scholar] [CrossRef]
  25. SEMARNAT (Secretaria de Medio Ambientes y Recursos Naturales). Acuerdo por el Que se Actualiza la Disponibilidad Media Anual de Agua Subterránea de os 653 Acuíferos de los Estados Unidos Mexicanos. Available online: https://www.dof.gob.mx/nota_detalle.php?codigo=5600593&fecha=17/09/2020. (accessed on 24 October 2021).
  26. SMN (Servicio Meteorológico Nacional). Resúmenes Mensuales de Temperaturas y Lluvias. Available online: https://smn.conagua.gob.mx/es/climatologia/temperaturas-y-lluvias/resumenes-mensuales-de-temperaturas-y-lluvias (accessed on 24 October 2021).
  27. Murray-Tartarolo, G.N. Seven decades of climate change across México. Atmósfera 2021, 34, 217–226. [Google Scholar] [CrossRef]
  28. Ruíz Corral, J.A.; Medina García, G.; Meza Sánchez, R.; Díaz Padilla, G.; Serrano Altamirano, V. Estadísticas Climatológicas Básicas del Estado de Baja California Sur (Periodo 1961–2003), 1st ed.; Centro de Investigación Regional del Noroeste del INIFAP: Ciudad Obregón, México, 2006; pp. 220–221. [Google Scholar]
  29. INEGI. Anuario Estadístico y Geográfico de Baja California Sur. Available online: https://www.inegi.org.mx/contenido/productos/prod_serv/contenidos/espanol/bvinegi/productos/nueva_estruc/anuarios_2017/702825094881.pdf (accessed on 18 September 2021).
  30. Instituto Nacional de Investigaciones Forestales, Agrícolas y Pecuarias (INIFAP). Agenda Técnica Agrícola de Baja California Sur, 1st ed.; INIFAP: Ciudad de México, México, 2017; pp. 40–44. [Google Scholar]
  31. Kumar, M.S.; Luther, M.M.; Rao, C.P.; Rao, K.L.N.; Prasad, P.R. Growing Degree Days and Heat Use Efficiency Influenced by dates of Sowing and Irrigation Levels on Rainfed Chickpea. Int. J. Curr. Microbiol. Appl. Sci. 2020, 9, 3996–4002. [Google Scholar] [CrossRef]
  32. Raes, D. The ETo Calculator, Evapotranspiration from a Reference Surface, 1st ed.; Food and Agriculture Organization of the United Nations: Rome, Italy, 2012; pp. 14–17. [Google Scholar]
  33. Meteoblue. Weather Close to You: Descargar Datos Históricos Todos Santos. 2022. Available online: https://www.meteoblue.com/es/tiempo/archive/export/todos-santos_m%c3%a9xico_3981432 (accessed on 22 October 2022).
  34. SAS (Statistical Analysis System). Procedure Guide, SAS Version 9.3; SAS Inc.: Cary, NC, USA, 2011; pp. 1–515. [Google Scholar]
  35. Devassirvatham, V.; Gaur, P.M.; Mallikarjuna, N.; Tokachichu, R.N.; Trethowan, R.M.; Tan, D.K.Y. Effect of high temperature on the reproductive development of chickpea genotypes under controlled environments. Funct. Plant Biol. 2012, 39, 1009–1018. [Google Scholar] [CrossRef] [PubMed] [Green Version]
  36. Sivakumar, M.V.K.; Singh, P. Response of chickpea cultivars to water stress in a semiarid environment. Exp. Agric. 2008, 23, 53–61. [Google Scholar] [CrossRef]
  37. Fierros, G.A.; Ortega, P.F.; Acosta, J.A.; Padilla, I.; Valenzuela, V.; Jiménez, Y.; López, J. Respuesta del rendimiento de genotipos de garbanzo blanco a sequía terminal. Rev. Mex. Cienc. Agrícolas 2017, 8, 1143–1154. [Google Scholar] [CrossRef] [Green Version]
  38. Singh, P. Influence of water–deficit on phenology, growth and dry-matter allocation in chickpea (Cicer arietinum L.). Field Crop Res. 1991, 28, 1–15. [Google Scholar] [CrossRef] [Green Version]
  39. Kang, S.; McKenzie, B.A.; Hill, G.D. Effects of irrigation on growth and yield of Kabuli chickpea (Cicer arietinum L.) and narrow-leafed lupin (Lupinus angustifolious L.). Agron. N. Z. 2008, 38, 11–32. [Google Scholar]
  40. Sachdeva, S.; Bharadwaj, C.; Siddanagouda, B.; Pal, M.; Roorkiwai, M.; Varshney, R.K. Agronomic performance of chickpea affected by drought stress at different growth stages. Agronomy 2022, 12, 995. [Google Scholar] [CrossRef]
  41. Olson, M.E.; Soriano, D.; Rosell, J.A.; Andofillo, T.; Donaghue, M.J.; León-Gómez, C.; Dawson, T.; Martínez, J.J.C.; Castorena, M.; Echeverría, A. Plant height and hydraulic vulnerability to drought and cold. Proc. Natl. Acad. Sci. USA 2018, 115, 7551–7556. [Google Scholar] [CrossRef] [Green Version]
  42. Ghassemi-Gplezani, K.; Ghaasemi, S.; Bandehhagh, A. Effects of water supply on field performance of chickpea (Cicer arietinum L.) cultivars. Int. J. Agron. Plant Prod. 2013, 4, 94–97. [Google Scholar]
  43. Dogan, E.; Kahraman, A.; Bucak, B. Varying irrigation rates effects on yield and yield components of chickpea. Irrig. Sci. 2013, 31, 903–909. [Google Scholar] [CrossRef]
Figure 1. Todos Santos Experimental Station location (blue dot).
Agronomy 13 00917 g001
Figure 2. Experimental design for testing RDI and SDI on the Blanoro variety of Chickpea during years 2020 and 2021 in Todos Santos, Baja California Sur, Mexico. Treatment acronym in Table 3.
Agronomy 13 00917 g002
Figure 3. Relative humidity (RH; %), ten-day reference evapotranspiration (ETo; mm), precipitation (P; mm), average temperature (T; °C), and maximum (Tmax; °C) and minimum (Tmin; °C) temperatures during two consecutive years of evaluation.
Agronomy 13 00917 g003
Figure 4. (A) Grain yield and (B) caliber (grains 30 g−1) of chickpea grown using different irrigation treatments in Todos Santos, Baja California Sur, Mexico. Vegetative growth (VG), flowering (F), and pod-filling (PF) stages. RDI = regulated deficit irrigation. FI = full irrigation application of 100% ETc during VG, F, and PF. SDI75 = sustained deficit irrigation applying 75% of ETc during VG, F, and PF. VG50 = RDI applying irrigation equivalent to 50% of ETc in VG. VG75 = RDI applying irrigation equivalent to 75% of ETc in VG. F50 = RDI applying irrigation equivalent to 50% of ETc in F. F75 = RDI applying irrigation equivalent to 75% of ETc in F. PF50 = RDI applying irrigation equivalent to 50% of ETc in PF. PF75 = RDI applying irrigation equivalent to 50% of ETc in PF. abcd: different letters among treatments indicate significant difference (p ≤ 0.05, LSD). More intense blue color in box plot indicates higher total irrigation volume, and more intense red color in box plot indicates lower total irrigation volume.
Agronomy 13 00917 g004
Figure 5. (A) Plant height, (B) plant dry weight, (C) pods per plant, and (D) grains per plant of chickpea under different irrigation treatments at Todos Santos, Baja California Sur, Mexico. Vegetative growth (VG), flowering (F), and pod-filling (PF) stages. RDI = regulated deficit irrigation. FI = full irrigation application of 100% ETc during VG, F, and PF. SDI75 = sustained deficit irrigation applying 75% of ETc during VG, F, and PF. VG50 = RDI applying irrigation equivalent to 50% of ETc in VG. VG75 = RDI applying irrigation equivalent to 75% of ETc in VG. F50 = RDI applying irrigation equivalent to 50% of ETc in F. F75 = RDI applying irrigation equivalent to 75% of ETc in F. PF50 = RDI applying irrigation equivalent to 50% of ETc in PF. PF75 = RDI applying irrigation equivalent to 50% of ETc in PF. abcd: different letters among treatments indicate statistical significance (p ≤ 0.05, LSD). More intense blue in box plot indicates higher total irrigation volume, and more intense red in box plot indicates lower total irrigation volume.
Agronomy 13 00917 g005
Figure 6. (A) Harvest index and (B) crop water productivity of chickpeas under different irrigation treatments in Todos Santos, Baja California Sur, Mexico. Vegetative growth (VG), flowering (F), and pod-filling (PF) stages. RDI = regulated deficit irrigation. FI = full irrigation application of 100% ETc during VG, F, and PF. SDI75 = sustained deficit irrigation applying 75% of ETc during VG, F, and PF. VG50 = RDI applying irrigation equivalent to 50% of ETc in VG. VG75 = RDI applying irrigation equivalent to 75% of ETc in VG. F50 = RDI applying irrigation equivalent to 50% of ETc in F. F75 = RDI applying irrigation equivalent to 75% of ETc in F. PF50 = RDI applying irrigation equivalent to 50% of ETc in PF. PF75 = RDI applying irrigation equivalent to 50% of ETc in PF. abcd Different letter among treatments indicates statistical significance (p ≤ 0.05, LSD). More intense blue in box plot indicates higher total irrigation volume, and more intense red in box plot indicates lower total irrigation volume.
Agronomy 13 00917 g006
Figure 7. (A) Variable distribution and (B) irrigation treatments distribution across the two principal components. Vegetative growth (VG), flowering (F), and pod-filling (PF) stages. RDI = regulated deficit irrigation. FI = full irrigation application of 100% ETc during VG, F, and PF. SDI75 = sustained deficit irrigation applying 75% of ETc during VG, F, and PF. VG50 = RDI applying irrigation equivalent to 50% of ETc in VG. VG75 = RDI applying irrigation equivalent to 75% of ETc in VG. F50 = RDI applying irrigation equivalent to 50% of ETc in F. F75 = RDI applying irrigation equivalent to 75% of ETc in F. PF50 = RDI applying irrigation equivalent to 50% of ETc in PF. PF75 = RDI applying irrigation equivalent to 50% of ETc in PF.
Agronomy 13 00917 g007
Figure 8. Treatment cluster analysis in (A) experiment 2020 and (B) experiment 2021. Vegetative growth (VG), flowering (F), and pod-filling (PF) stages. RDI = regulated deficit irrigation. FI = full irrigation application of 100% ETc during VG, F and PF. SDI75 = sustained deficit irrigation applying 75% of ETc during VG, F, and PF. VG50 = RDI applying irrigation equivalent to 50% of ETc in VG. VG75 = RDI applying irrigation equivalent to 75% of ETc in VG. F50 = RDI applying irrigation equivalent to 50% of ETc in F. F75 = RDI applying irrigation equivalent to 75% of ETc in F. PF50 = RDI applying irrigation equivalent to 50% of ETc in PF. PF75 = RDI applying irrigation equivalent to 50% of ETc in PF.
Agronomy 13 00917 g008
Table 1. Meteorological parameters for the growing seasons (monthly average for every variable) in the Todos Santos Experimental Station location, Baja California Sur, Mexico.
Meteorological ParameterYear 2020Year 2021
JanuaryFebruaryMarchAprilJanuaryFebruaryMarchApril
Tmean *18.8219.0620.4618.8517.7818.2819.2322.26
Tmax *27.8127.5729.4928.0827.5027.8329.4332.34
Tmin *10.8310.5511.9010.9410.6210.6310.4812.73
Wind speed 1.812.341.791.362.011.762.350.44
Rainfall events 1.002.000.000.001.000.000.000.00
Rainfall magnitude §3.0030.000.000.0036.000.000.000.00
RHmean ~62.0064.3061.5267.9959.1061.5151.8948.32
RHmax ~84.3088.8386.8590.1782.0886.8982.6282.42
RHmin ~37.8439.7736.7740.4033.8234.9924.2720.00
*: °C, : km h−1, : Days a month−1, §: mm, ~: %. Tmean = average temperature. Tmax = maximum temperature. Tmin = minimum temperature. RHmean = relative humidity (mean). RHmax = relative humidity (maximum). RHmin = relative humidity (minimum).
Table 2. Soil and irrigation water properties at the Todos Santos Experimental Station, Baja California Sur, Mexico.
Soil Property *Irrigation Water Properties
TextureLoamy sandSalinity (dS m−1)1.07
Salinity (dS m−1)0.33pH7.62
pH8.08N-NO3 (mg kg−1)10.9
Field capacity (%)11.50K (mg kg−1)0.39
Wilting point (%)6.84Ca (mg kg−1)88.6
Bulk density (g cm−3)1.52Mg (mg kg−1)36.1
Organic matter (%)0.91Na (mg kg−1)78.2
Nitrogen NO3 (mg kg−1)11.70SAR1.92
Phosphorus-Bray (mg kg−1)47.60Classification of irrigation waterC2 S1
Potassium (mg kg−1)157.00
*: corresponding 0–30 cm soil profile. SAR: Sodium adsorption ratio.
Table 3. Deficit irrigation treatments applied to chickpeas for two consecutive years (2020 and 2021) in Todos Santos, Baja California Sur, Mexico.
Treatments Treatments Description
GVGFPFS
FIIrrigation for
germination for all treatments
100% ETc100% ETc100% ETcNo irrigation applied in all treatments
VG5050% ETc100% ETc100% ETc
VG7575% ETc100% ETc100% ETc
F50100% ETc50% ETc100% ETc
F75100% ETc75% ETc100% ETc
PF50100% ETc100% ETc50% ETc
PF75100% ETc100% ETc75% ETc
SDI7575% ETc75% ETc75% ETc
Stage duration0–10 days
149 GDD
10–33 days
149–506 GDD
33–56 days
506–811GDD
56–81 days
811–1189 GDD
81–112 days
1189–1655 GDD
Germination (G), vegetative growth (VG), flowering (F), and pod-filling (PF), and senescence stages. RDI = regulated deficit irrigation. ETc = crop evapotranspiration. FI = full irrigation application of 100% ETc during VG, F, and PF. SDI75 = sustained deficit irrigation applying 75% of ETc during VG, F, and PF. VG50 = RDI applying irrigation equivalent to 50% of ETc in VG. VG75 = RDI applying irrigation equivalent to 75% of ETc in VG. F50 = RDI applying irrigation equivalent to 50% of ETc in F. F75 = RDI applying irrigation equivalent to 75% of ETc in F. PF50 = RDI applying irrigation equivalent to 50% of ETc in PF. PF75 = RDI applying irrigation equivalent to 50% of ETc in PF. GDD = growing degree days.
Table 4. Deficit irrigation treatments and total irrigation by growth stage applied to chickpeas during two consecutive years of experiments (2020 and 2021) at Todos Santos, Baja California Sur, Mexico.
Treatments Treatment Irrigation Accumulated (m3 ha−1) by Growth Stage and Total
GVGFPFSTotal Irrigation Volume% with Respect to FI
Year 2020
FI273.86 393.22 244.695.100.01006.78100
VG50273.86346.61244.695.100.0960.1795.3
VG75273.86369.91244.695.100.0983.4197.6
F50273.86393.22122.3095.100.0884.4887.8
F75273.86393.22183.4595.100.0945.6393.9
PF50273.86393.22244.6047.550.0959.2395.2
PF75273.86393.22244.6071.320.0983.0097.6
SDI75273.86369.91183.4571.320.0897.8489.1
Year 2021
FI514.04457.76 353.31172.430.01497.54100
VG50514.04408.87353.31172.430.01448.6596.7
VG75514.04433.31353.31172.430.01473.0998.3
F50514.04457.76176.65172.430.01320.8888.2
F75514.04457.76265.25172.430.01409.2194.1
PF50514.04457.76353.3186.210.01411.3294.2
PF75514.04457.76353.31129.380.01454.4997.1
SDI75514.04433.31265.25129.380.01341.9889.6
Stage duration0–10 days
149 GDD
10–33 days
149–506 GDD
33–56 days
506–811GDD
56–81 days
811–1189 GDD
81–112 days
1189–1655 GDD
Germination (G), vegetative growth (VG), flowering (F), pod-filling (PF), and senescence stages. RDI = regulated deficit irrigation. ETc = crop evapotranspiration. FI = full irrigation application of 100% ETc during VG, F, and PF. SDI75 = sustained deficit irrigation applying 75% of ETc during VG, F, and PF. VG50 = RDI applying irrigation equivalent to 50% of ETc in VG. VG75 = RDI applying irrigation equivalent to 75% of ETc in VG. F50 = RDI applying irrigation equivalent to 50% of ETc in F. F75 = RDI applying irrigation equivalent to 75% of ETc in F. PF50 = RDI applying irrigation equivalent to 50% of ETc in PF. PF75 = RDI applying irrigation equivalent to 50% of ETc in PF. GDD = growing degree days. : treatment´s water volume considering 3 (30 m3 ha−1) and 30 mm (300 m3 ha−1) of rain, on 1 January and 3 February 2020, respectively. : treatment´s water volume considering 36 mm of rain (360 m3 ha−1) on 20 January 2021.
Table 5. Response variables of chickpea deficit irrigation experiments during two consecutive years (2020 and 2021) at Todos Santos, Baja California Sur, Mexico.
VariableSymbolUnitMean Value ± SD
Grain yieldGYkg ha−1903.33 ± 196.09
Grain caliberCalgrains in 30 g47.69 ± 3.38
Plant heightHM0.40 ± 0.02
Plant dry weightPDWg plant−113.18 ± 1.94
Number of pods per plantPP-7.96 ± 1.23
Number of grains per plantGP-9.18 ± 1.65
Harvest indexHI-0.44 ± 0.04
Crop water productivityCWPkg m−30.78 ± 0.17
SD = Standard deviation.
Table 6. Differences (%) in grain yield (GY) and caliber (Cal) among irrigation treatments.
TreatmentsGrain Yield
* kg ha−1% with Respect to FI
VG751124.8 ± 264.3101.8
FI1104.3 ± 246.2100.0
PF75978.0 ± 150.988.5
F75937.6 ± 265.084.9
SDI75817.3 ± 162.274.0
PF50799.6 ± 150.372.4
VG50776.5 ± 221.270.3
F50688.2 ± 167.162.3
Grain caliber
* grain 30 g−1% with respect to FI
PF5052.7 ± 6.7113.0
F5048.7 ± 3.6104.5
F7547.9 ± 5.2102.7
SDI46.9 ± 2.1100.6
VG7546.7 ± 0.7100.2
FI46.6 ± 2.8100.0
PF7546.5 ± 1.999.7
VG5046.0 ± 3.598.7
Vegetative growth (VG), flowering (F), and pod-filling (PF) stages. RDI = Regulated deficit irrigation. FI = full irrigation application of 100% of ETc during VG, F, and PF. SDI75 = sustained deficit irrigation applying 75% of ETc during VG, F, and PF. VG50 = RDI applying irrigation equivalent to 50% of ETc in VG. VG75 = RDI applying irrigation equivalent to 75% of ETc in VG. F50 = RDI applying irrigation equivalent to 50% of ETc in F. F75 = RDI applying irrigation equivalent to 75% of ETc in F. PF50 = RDI applying irrigation equivalent to 50% of ETc in PF. PF75 = RDI applying irrigation equivalent to 50% of ETc in PF. *: Mean ± standard deviation.
Table 7. Differences (%) in plant height (H), plant dry weight (PDW), pods per plant (PP), and grains per plant (GP) among irrigation treatments.
TreatmentsPlant HeightTreatmentsPods per Plant
m *% with Respect to FIPods *% with Respect to FI
FI0.43 ± 0.04100.0VG7510.00 ± 1.88121.2
PF750.43 ± 0.05100.0FI8.25 ± 1.28100.0
VG750.42 ± 0.0697.6PF758.17 ± 1.3599.0
F750.40 ± 0.0393.0F758.10 ± 1.6898.1
SDI750.40 ± 0.0293.0SDI758.12 ± 1.5598.4
PF500.39 ± 0.0590.6VG507.90 ± 1.4495.7
F500.39 ± 0.0590.6PF506.73 ± 1.6681.5
VG500.38 ± 0.0288.3F506.45 ± 0.8478.1
TreatmentsPlant dry weightTreatmentsGrains per plant
g *% with respect to FIgrains *% with respect to FI
VG7515.41 ± 2.62107.9VG7511.93 ± 1.99125.1
FI14.27 ± 2.95100.0FI9.53 ± 1.73100.0
PF7513.66 ± 2.9495.7PF759.71 ± 1.77101.8
VG5013.48 ± 2.7194.4SDI759.16 ± 2.0596.1
F7513.26 ± 3.6492.9VG509.31 ± 1.8597.6
SDI7513.26 ± 2.3092.9F758.75 ± 2.2291.8
PF5011.14 ± 3.8478.0PF507.66 ± 2.2780.3
F5010.99 ± 2.2077.0F507.37 ± 1.5477.3
Vegetative growth (VG), flowering (F), and pod-filling (PF) stages. RDI = regulated deficit irrigation. FI = full irrigation application of 100% ETc during VG, F and PF. SDI75 = sustained deficit irrigation applying 75% of ETc during VG, F, and PF. VG50 = RDI applying irrigation equivalent to 50% of ETc in VG. VG75 = RDI applying irrigation equivalent to 75% of ETc in VG. F50 = RDI applying irrigation equivalent to 50% of ETc in F. F75 = RDI applying irrigation equivalent to 75% of ETc in F. PF50 = RDI applying irrigation equivalent to 50% of ETc in PF. PF75 = RDI applying irrigation equivalent to 50% of ETc in PF. *: Mean ± standard deviation.
Table 8. Differences (%) in harvest index (HI) and crop water productivity (CWP) among irrigation treatments.
TreatmentsHarvest Index
% with Respect to FI
VG750.50 ± 0.07116.2
PF750.46 ± 0.05106.9
VG500.45 ± 0.06104.6
SDI750.45 ± 0.07104.6
FI0.43 ± 0.03100.0
F750.42 ± 0.0597.6
F500.41 ± 0.0695.3
PF500.40 ± 0.0393.0
Crop water productivity
* kg m−3% with respect to FI
VG750.95 ± 0.34105.5
FI0.90 ± 0.22100.0
F750.82 ± 0.2991.1
PF750.82 ± 0.1991.1
SDI0.74 ± 0.1282.2
PF500.71 ± 0.2378.0
VG500.65 ± 0.1472.2
F500.64 ± 0.1571.1
Vegetative growth (VG), flowering (F), and pod-filling (PF) stages. RDI = regulated deficit irrigation. FI = full irrigation application of 100% ETc during VG, F and PF. SDI75 = sustained deficit irrigation applying 75% of ETc during VG, F, and PF. VG50 = RDI applying irrigation equivalent to 50% of ETc in VG. VG75 = RDI applying irrigation equivalent to 75% of ETc in VG. F50 = RDI applying irrigation equivalent to 50% of ETc in F. F75 = RDI applying irrigation equivalent to 75% of ETc in F. PF50 = RDI applying irrigation equivalent to 50% of ETc in PF. PF75 = RDI applying irrigation equivalent to 50% of ETc in PF. *: Mean ± standard deviation.
Table 9. Pearson correlation coefficients relating response variables with the two main principal components summarizing data of chickpea under different irrigation treatments, tested at Todos Santos, Baja California Sur, Mexico.
VariablesPrincipal Components
PC1PC2
Grain yield (GY)0.62 **0.44
Caliber (Cal)−0.85 **0.02
Plant height (H)−0.460.81 **
Plant dry weight (PDW)0.99 **−0.06
Pods per plant (PP)0.81 **0.47
Grains per plant (GP)0.77 **0.56
Crop Water productivity (CWP)−0.190.91 **
Harvest index (HI)−0.020.89 **
Total irrigation (IR)0.77 **−0.56
Eigenvalue4.223.36
Variance Eigenvalue, %47.0037.40
Accumulated variance, %47.0084.40
PC1 = First principal component, PC2 = Second principal component. **: highly significant (p ≤ 0.01).
Disclaimer/Publisher’s Note: The statements, opinions and data contained in all publications are solely those of the individual author(s) and contributor(s) and not of MDPI and/or the editor(s). MDPI and/or the editor(s) disclaim responsibility for any injury to people or property resulting from any ideas, methods, instructions or products referred to in the content.

