Article

Plant Architecture Influences the Population Transpiration and Canopy Temperature in Winter Wheat Genotypes

1
Key Laboratory for Dryland Agriculture of Ministry of Agriculture and Rural Affairs, Institute of Environment and Sustainable Development in Agriculture, Chinese Academy of Agricultural Sciences, Beijing 100081, China
2
Agricultural and Rural Bureau of Jingxing District, Shijiazhuang 050100, China
3
Hebei Key Laboratory of Crop Stress Biology, College of Agronomy and Biotechnology, Hebei Normal University of Science & Technology, Qinhuangdao 066004, China
4
Forestry and Grassland Bureau of Aohan Banner, Chifeng 024300, China
*
Authors to whom correspondence should be addressed.
Agronomy 2023, 13(3), 742; https://doi.org/10.3390/agronomy13030742
Submission received: 17 January 2023 / Revised: 27 February 2023 / Accepted: 27 February 2023 / Published: 2 March 2023

Abstract

:
To study how plant architecture affects the canopy traits and water use of wheat, the Triticum aestivum L. population is expected to provide important information for cultivar improvement and the ideal population structure establishment for conserving water without causing an enormous grain yield loss. This study was conducted for three consecutive growing seasons using two genotypes with contrasting plant architectures as the materials, the upright-leafed compact type Jing 411 and the flat-leafed loose type Jinmai 47. The population-scale transpiration (PT) and soil evaporation (E) were partitioned from the evapotranspiration (ET) using micro-lysimeters, and the canopy traits population density and the canopy temperature depression (CTD) were also monitored during the period from the jointing to early grain filling stage—the largest water requirement period of wheat crops. Jinmai 47 showed a lower E than Jing 411, but a similar PT and ET, though it had a higher population density at the sowing density. The total evapotranspiration (TET) for the whole growing season was also similar in the two genotypes. This indicated that Jinmai 47 performed better in water conservation than Jing 411. With a similar PT and TET, however, Jinmai 47 showed a rather larger CTD and a significantly higher grain yield than Jing 411. If the higher population density and higher leaf net photosynthetic rate could explain its higher grain yield, the higher leaf stomotal conductance and transpiration rate and the higher population density could not explain the similar PT, ET and TET to Jing 411. Presumably, the involvement of the plant architecture disrupted the original higher transpiration–larger CTD relation, and broke up the prevailing saving water-losing yield concept. Thus, the study might suggest the important water saving value of the flat-leafed loose architecture in wheat crops and demonstrate the possibility of conserving irrigation water without causing serious grain yield loss by taking advantage of the distinct plant architecture to establish an appropriate population structure.

1. Introduction

Water shortages have been restricting crop production worldwide. The North China Plain is one of the most important agricultural regions in China, supplying more than 75% of China’s wheat and 35% of its maize [1]. Less than 30% of the annual rainfall occurs during the wheat growing season, meeting only about 25–40% of wheat water requirements. As a result, more than 70% of the irrigation water use is for winter wheat [2,3]. Due to the excessive exploitation of groundwater for irrigation from both shallow and deep aquifers, the groundwater table has been declining rapidly. The irrigation usage for wheat is also threatening the ecological environment of the local area [4,5]. Thus, in the North China Plain, to mitigate the water crisis, ecology crisis and to ensure national food security, efforts must be taken to enormously reduce water use while maintaining the current high level of crop production.
Selecting and breeding water-saving cultivars can be a long-lasting and less expensive solution for water conservation. Since “more crop per drop” was widely pronounced as a target to tackle the water crisis, breeding efforts in the North China Plain have been concentrated on enhancing the grain yield in irrigation areas and improving the drought tolerance to obtain a good and stable harvest in rain-fed (RF) areas [5,6], but rarely on reducing water use. Actually, the genotypic variation in the water use efficiency (WUE) is affected more by variations in the denominator (water use) rather than by variations in the nominator (biomass) [7]. This suggests a great water saving potential for improving cultivars with water use traits and appropriately matching cultivars for growth in areas with specific water availability.
Since the main part of water consumption for the wheat population is through stomatal transpiration, a number of studies were focused on the genotypic difference in the stomatal response to different water conditions and their underlying mechanisms and aimed to achieve water conservation by controlling transpiration. However, the stomatal movement is closely associated with the photosynthetic rate, and the reduction in the stomatal conductance would lead to a decline in the carbon gain, thereby resulting in a grain yield loss. Fischer et al. [8] analyzed and ascribed the wheat yield progress to a higher stomatal conductance, higher photosynthetic rate and cooler canopy. Thereafter, a number of studies found that a higher stomatal conductance and transpiration rate were associated with a better yield performance of the tolerant genotypes under stress conditions [9,10,11]. Zhang et al. [12] recently found that the drought-tolerant cultivar Jinmai 47 was capable of maintaining a higher stomatal conductance for carbon assimilation under dry air conditions and largely enhancing its stomatal conductance under wet air conditions, thus stably obtaining a higher grain yield in drier RF areas. The exception is the successful and widely cited case for dryland wheat grain yield improvement with the selection for a low stomatal conductance and a high WUE in NSW Australia [13]. This can be explained by the fact that wheat is primarily grown there on stored soil moisture. A significant avenue for yield improvement is through controlling the water use during the earlier part of the growing season in order to avoid a lack of soil moisture during grain filling. Hence, one can see that, through repressing the stomatal conductance, it is possible to reduce the water use but impossible to reduce the water use without the expense of the grain yield loss. Thus, the other cultivar traits that can be modified to simultaneously achieve both water saving and a high grain yield remain to be explored.
The current study attempted to explore the potential role of the morphological attribute, i.e., the plant architecture, in water conservation. It is a specific three-dimensional architecture that is jointly determined by different morphological attributes such as the size, shape and orientation of the aboveground shoot components [14]. Plant architecture has been attracting great attention since it exerts a direct influence on the population structure [15,16]. The population structure influences the light interception and distribution as well as the air permeability within the canopy, affects the key physiological processes, such as photosynthesis, and in turn virtually affects the yield potential of a cultivar [15,16,17]. The previous studies have been carried out to clarify the effect of different plant architecture on the grain yield in diverse crops. Falster et al. [18] found that shallow angled leaves had a greater daily light interception and a potentially greater carbon gain than steeper angled leaves. In cotton, research confirmed that the ideal types with upright leaves allowed light to penetrate more deeply and distribute more uniformly within the canopy, thus enhancing the carbon assimilates accumulation [19,20]. The modification of plant architectures is also considered as an important breeding strategy to enhance the yield potential of crops [21].
Water use, the important integrative trait of crops, is attracting more and more attention against the background of the worsening worldwide water shortage. The population water use, differing from the transpiration of a leaf and the individual plant, mainly consists of the population-scale transpiration (PT) and soil evaporation (E). The PT comprises the major moiety of the total water use. Virtually, transpiration itself is a physical process, in which water molecules freely diffuse into the air through the leaf stomata. On one hand, crops adjust their stomatal aperture to control transpiration and meet the photosynthetic requirements for CO2. On the other hand, transpiration is strongly influenced by the surrounding environmental factors, e.g., the transpiration rate consistently peaked at the time of the highest air temperature in its diurnal variation. With a similar stomatal aperture, the genotypic difference in the PT depends on the microclimate. The population structure that affects the water and heat exchange between the canopy and the surrounding environment exactly regulates the microclimate. Thus, the plant architecture, one of the determinant factors of the canopy structure, is supposed to have great effect on the PT. To date, however, how different plant architectures affect the PT still remains unknown.
The canopy temperature depression (CTD), defined as the difference between the air temperature and the canopy temperature, is an integrative index closely associated with the canopy structure. Genotypic differences existed in the CTD regardless of time of the day [22,23]. Since the CTD is primarily derived from canopy transpiration [24] and any factors affecting the crop transpiration lead to a CTD variation, it is closely associated with the water use. The CTD is also strongly influenced by the heat and water exchange between the canopy and the atmosphere, thus it is closely associated with the canopy structure [25]. Therefore, the CTD was adopted as a major canopy index relating to the canopy structure and water use.
By selecting two cultivars of contrasting plant architectures once widely cultivated in the North China Plain as commercial cultivars, the study was carried out during the period from the jointing to the early grain filling stage—the largest water requirement period for winter wheat. The PT was determined through partitioning the evapotranspiration (ET) using micro-lysimeters. The objectives of this study were (1) to reveal how plant architectures affect the canopy traits related to the population structure and (2) to clarify how plant architectures regulate the PT and E under different water conditions. The research is expected to identify the potential values of plant architecture for water saving and demonstrate that the population structure is as important for the population water saving as it for the high grain yield of a population. This would provide useful information for genetically improving the water use traits of wheat cultivars in terms of their plant architecture, and also highlights the important population controlling pathways for water conservation.

2. Materials and Methods

2.1. Experimental Site

The field experiments were carried out at the Shunyi Experimental Station of the Institute of Environment and Sustainable Development in Agriculture (40°05′ N and 116°55′ E), Chinese Academy of Agricultural Sciences. The experimental station was located in the northern part of the North China Plain. The soil of the experimental field was classified as calcareous Fluvo-aquic (sand, 28.7%; silt, 64.2% and clay, 7.1%), according to the Food and Agriculture Organization (FAO). In the 0–20 cm soil tillage layer, the organic matter content was 14.4 g kg−1 and the content of the total nitrogen, rapidly available phosphorus and rapidly available potassium were 1.1 g kg−1, 24.5 mg kg−1, and 106 mg kg−1, respectively. The soil bulk density was 1.40 g cm−3 and the pH was approx. 7.7. At the time of sowing, 112.5 kg ha–1 of nitrogen, 75 kg ha–1 of phosphorus pentoxide and 75 kg ha–1 of potassium oxide were applied to the soil, and the previously planted crop was field peas (Pisumsativum spp. arvense).

2.2. Experimental Design

The winter wheat genotypes Jinmai 47 and Jing 411, which have contrasting plant architectures, were selected as the experimental materials. Jinmai 47 was a flat-leafed loose type while Jing 411 was an upright-leafed compact type, both of which were widely planted in the North China Plain. The two genotypes were planted at a density of 6.75 × 10⁶ plants ha−1 on 5 October 2015, 3 October 2016 and 3 October 2017, and were harvested on 12 June 2016, 11 June 2017 and 14 June 2018, respectively. Each experimental plot was 10.0 m × 2.4 m in size and the plot consisted of 12 rows with 20 cm row spacing. The experiments were arranged in randomized blocks with three replications under RF and supplemental irrigation (SI) treatments. The plots were on completely level ground and the distance between the RF area and the SI area was 2.5 m, with a 1.5 m protection line planting for winter wheat in the middle. Before sowing, 90 mm of irrigation was given to all the treatments to ensure uniform soil water conditions and seedling emergence. For the RF treatments, no irrigation was conducted after sowing in the winter wheat growing season. For the SI treatments, a total of 120 mm of irrigation was provided to each plot through sprinkling irrigation before the jointing (60 mm, on 8 April 2016, 9 April 2017 and 11 April 2018) and flowering stages (60 mm, on 1 May 2016, 3 May 2017 and 4 May 2018) in each growing season. The flow meter was used to record the amount of irrigated water. The flowering and mature stages of the two genotypes were basically the same during the different growing seasons. The date, the winter wheat began flowering on 7 May in the three growing seasons. At ripening, wheat plants of 1 m in length in the five rows for each plot were harvested manually and air dried, and the grain yield (kg/ha) was determined.

2.3. Measurements

2.3.1. Morphological Traits

The flag leaf area (LA, cm2) was measured with an area meter LI-3000 (LICOR Inc., Lincoln, NE, USA) and SPAD chlorophyll readings were taken using a SPAD meter (SPAD-502, Konica Minolta Optics Inc., Tokyo, Japan) during the anthesis stage. A SPAD reading of <50 indicated a bright green color and a reading >53 indicated a dark green color. The plant height was measured with a steel tape and the stem diameter was measured with a digital vernier caliper during the mature stage. The flag leaf inclination angle (LIA), the angle between the vertical and the direction in which the flag leaf plane extends, was measured on the still days between 10:00 and 11:00 a.m. using a transparent plastic protractor during the anthesis stage. All the morphological traits were measured under RF conditions in 2016.

2.3.2. Leaf Transpiration Traits

The stomatal conductance, transpiration rate and photosynthetic rate were measured simultaneously using a Licor-6400 portable infrared gas analyzer (LI-COR Inc., Lincoln, NE, USA). The CO2 concentration was set at 400 μmol mol−1 and the photosynthetic active radiation was set at 1200 μmol m−2 s−1. Three flag leaves for each plot were selected for measurement on sunny days during the anthesis stage.

2.3.3. Canopy Traits

The population densities were investigated during the anthesis stage. The number of shoots per m2 from the middle five rows of each plot were counted.
The canopy temperature was measured using the handheld testo 845 infrared thermometer (Testo SE and Co. KGaA, Titisee-Neustadt, Germany) at the middle of the jointing and anthesis stages for the winter wheat. The thermometer measured a temperature range from −35 °C to 900 °C with an accuracy of ±0.75 °C. The canopy temperature measurements were conducted between 13:00 and 15:00 on sunny and windless days. A representative and wider canopy was selected to avoid measuring the exposed ground or gaps in the canopy. In order to eliminate the effect of the sun azimuth and planting direction on the observation value, an instrument probe was set along the plot in the planting direction during the measuring. The thermometer was held 15–20 cm above the canopy surface with an angle of 30° between the instrument and the crop canopy. The canopy temperature values and the air temperature values were directly read out after five seconds of each measurement. Each measurement was the average of three readings recorded from different points in each plot. The CTD was finally calculated by subtracting the canopy temperature from the air temperature.

2.3.4. Water Use Traits

In 2015–2016, 2016–2017 and 2017–2018, the three consecutive growing seasons, the ET, E and PT were determined from the jointing to the early grain filling stages—the largest water requirement period of wheat crops—and the total evapotranspiration (TET) for the whole growing season was also determined.
The ET and TET were determined and calculated according to the soil water balance Equation [26]
ET = I + P − R − D − SW
where I is the irrigation amount (mm), P is the precipitation (mm) that was measured by the weather station at the site, R is the surface runoff (mm) which was ignored due to the low precipitation and flat land, D is the downward drainage below the crop root zone (mm) which was negligible due to the low deep percolation under the experimental conditions and SW denotes the change in the water storage in the soil profile (0–160 cm in depth) exploited by the crop roots (mm). For determining SW, the gravimetric soil water contents were measured at 20 cm intervals to a depth of 160 cm by taking the soil cores and then converted to volumetric soil water contents using bulk density data. The gravimetric soil water contents were measured on 17 April and 11 May in 2016, on 18 April and 12 May in 2017 and on 20 April and 11 May in 2018 for calculating the ET and measured before sowing and after harvest for determining the TET.
The E was determined using the micro-lysimeter method [27]. Three micro-lysimeters were installed between two rows in each plot for the treatments. The micro-lysimeters were composed of PVC cylinders 15 cm in length and with a 10 cm inside diameter. Prior to installing the micro-lysimeter, a slightly larger PVC cylinder with a 12 cm inside diameter and the same length, which served as the sleeve to facilitate the insertion and removal of the micro-lysimeter, was pushed into the ground and the soil inside of it was emptied. For taking the soil samples, the micro-lysimeter was pushed into the soil at a site between two rows within the same plot, carefully taken out and the soil outside the instrument was cleaned. The bottom was sealed with waterproof adhesive tape and weighed, then it was put into the sleeve in the plot. The small, isolated soil volume contained in each micro-lysimeter was weighed daily at dusk using an electronic balance to determine the water loss. To keep the soil water contents within the micro-lysimeters close to that of the surrounding soil, the soil in the instruments was changed every 3 days and immediately after irrigation or rainfall. The holes left from new samples were refilled with the previously removed soil from the micro-lysimeters. Each time the samples were taken, special care was used to minimize disturbances to the crops. The soil evaporation was assumed to be negligible for the days when rainfall occurred. Finally, the soil evaporation was calculated from the daily weight change along with the surface area of the micro-lysimeters.
The PT was finally calculated by subtracting the E from the ET.

2.4. Statistical Analysis

The statistical analysis was performed using the SAS procedure (Version 9.2, SAS Institute, Cary, NC, USA). For primarily evaluating the differences between the two contrasting genotypes and confirming the difference trend under the different water conditions and different growing seasons, a one-way ANOVA (analysis of variance) was carried out in the experimental indices (water use, canopy and physiological traits) separately under each water condition in each growing season. The means of the two genotypes were compared using the least significant differences (LSD) at a probability level of p = 0.05.

3. Results

3.1. Meteorological Conditions

In the experimental site located in the Beijing suburb, the winter wheat crops were sown in early October and harvested in early June. The developmental period from the jointing to the early grain filling stages—the largest water requirement period for wheat crops—was generally from early April to early May. The total precipitation occurred in the 2015–2016, 2016–2017 and 2017–2018 growing seasons were 173.4 mm, 119.6 mm and 130.1 mm, respectively. Thus, in view of the total precipitation, the 2015–2016 season was the wettest followed by the 2017–2018 season, and the 2016–2017 season was the driest. However, the precipitation wasdistributed in an extremely uneven pattern. The precipitation in April 2016, 2017 and 2018 was 5.6 mm, 0.1 mm and 52.7 mm, respectively. Thus, for April of 2018, the special water requirement period of wheat crops was the wettest. In 2016, a large precipitation of 56.9 mm occurred in May, alleviating the severe April drought damage to some extent. In the driest 2016–2017 season, merely 23.2 mm of precipitation occurred in the two months from April to May, while 70.8 mm occurred in October, accounting for 59.2% of the total 119.3 mm (Table 1).
The monthly mean air temperature was rather closer for the three growing seasons. In comparison to the long-term average, it was apparently higher in the months from March to June when the wheat crops vigorously grew and matured, especially in the 2016–2017 season (Table 1).

3.2. Genotypic Comparison between Jing 411 and Jinmai 47 in the Morphological Traits and Gas Exchange Parameters

The wheat genotypes Jinmai 47 and Jing 411 possessed contrasting plant architectures. The former was a flat-leafed loose type, had relatively higher and thinner stems and larger and brighter green leaves, while the latter was an upright-leafed compact type, had relatively shorter and thicker stems and smaller and darker green leaves, as shown in Table 2.
The comparison of the gas exchange parameters under the different water conditions in the three different years indicated that Jinmai 47 generally had a higher photosynthetic rate, stomatal conductance and transpiration rate than Jing 411, especially under the conditions of better soil and water availability (Table 3).

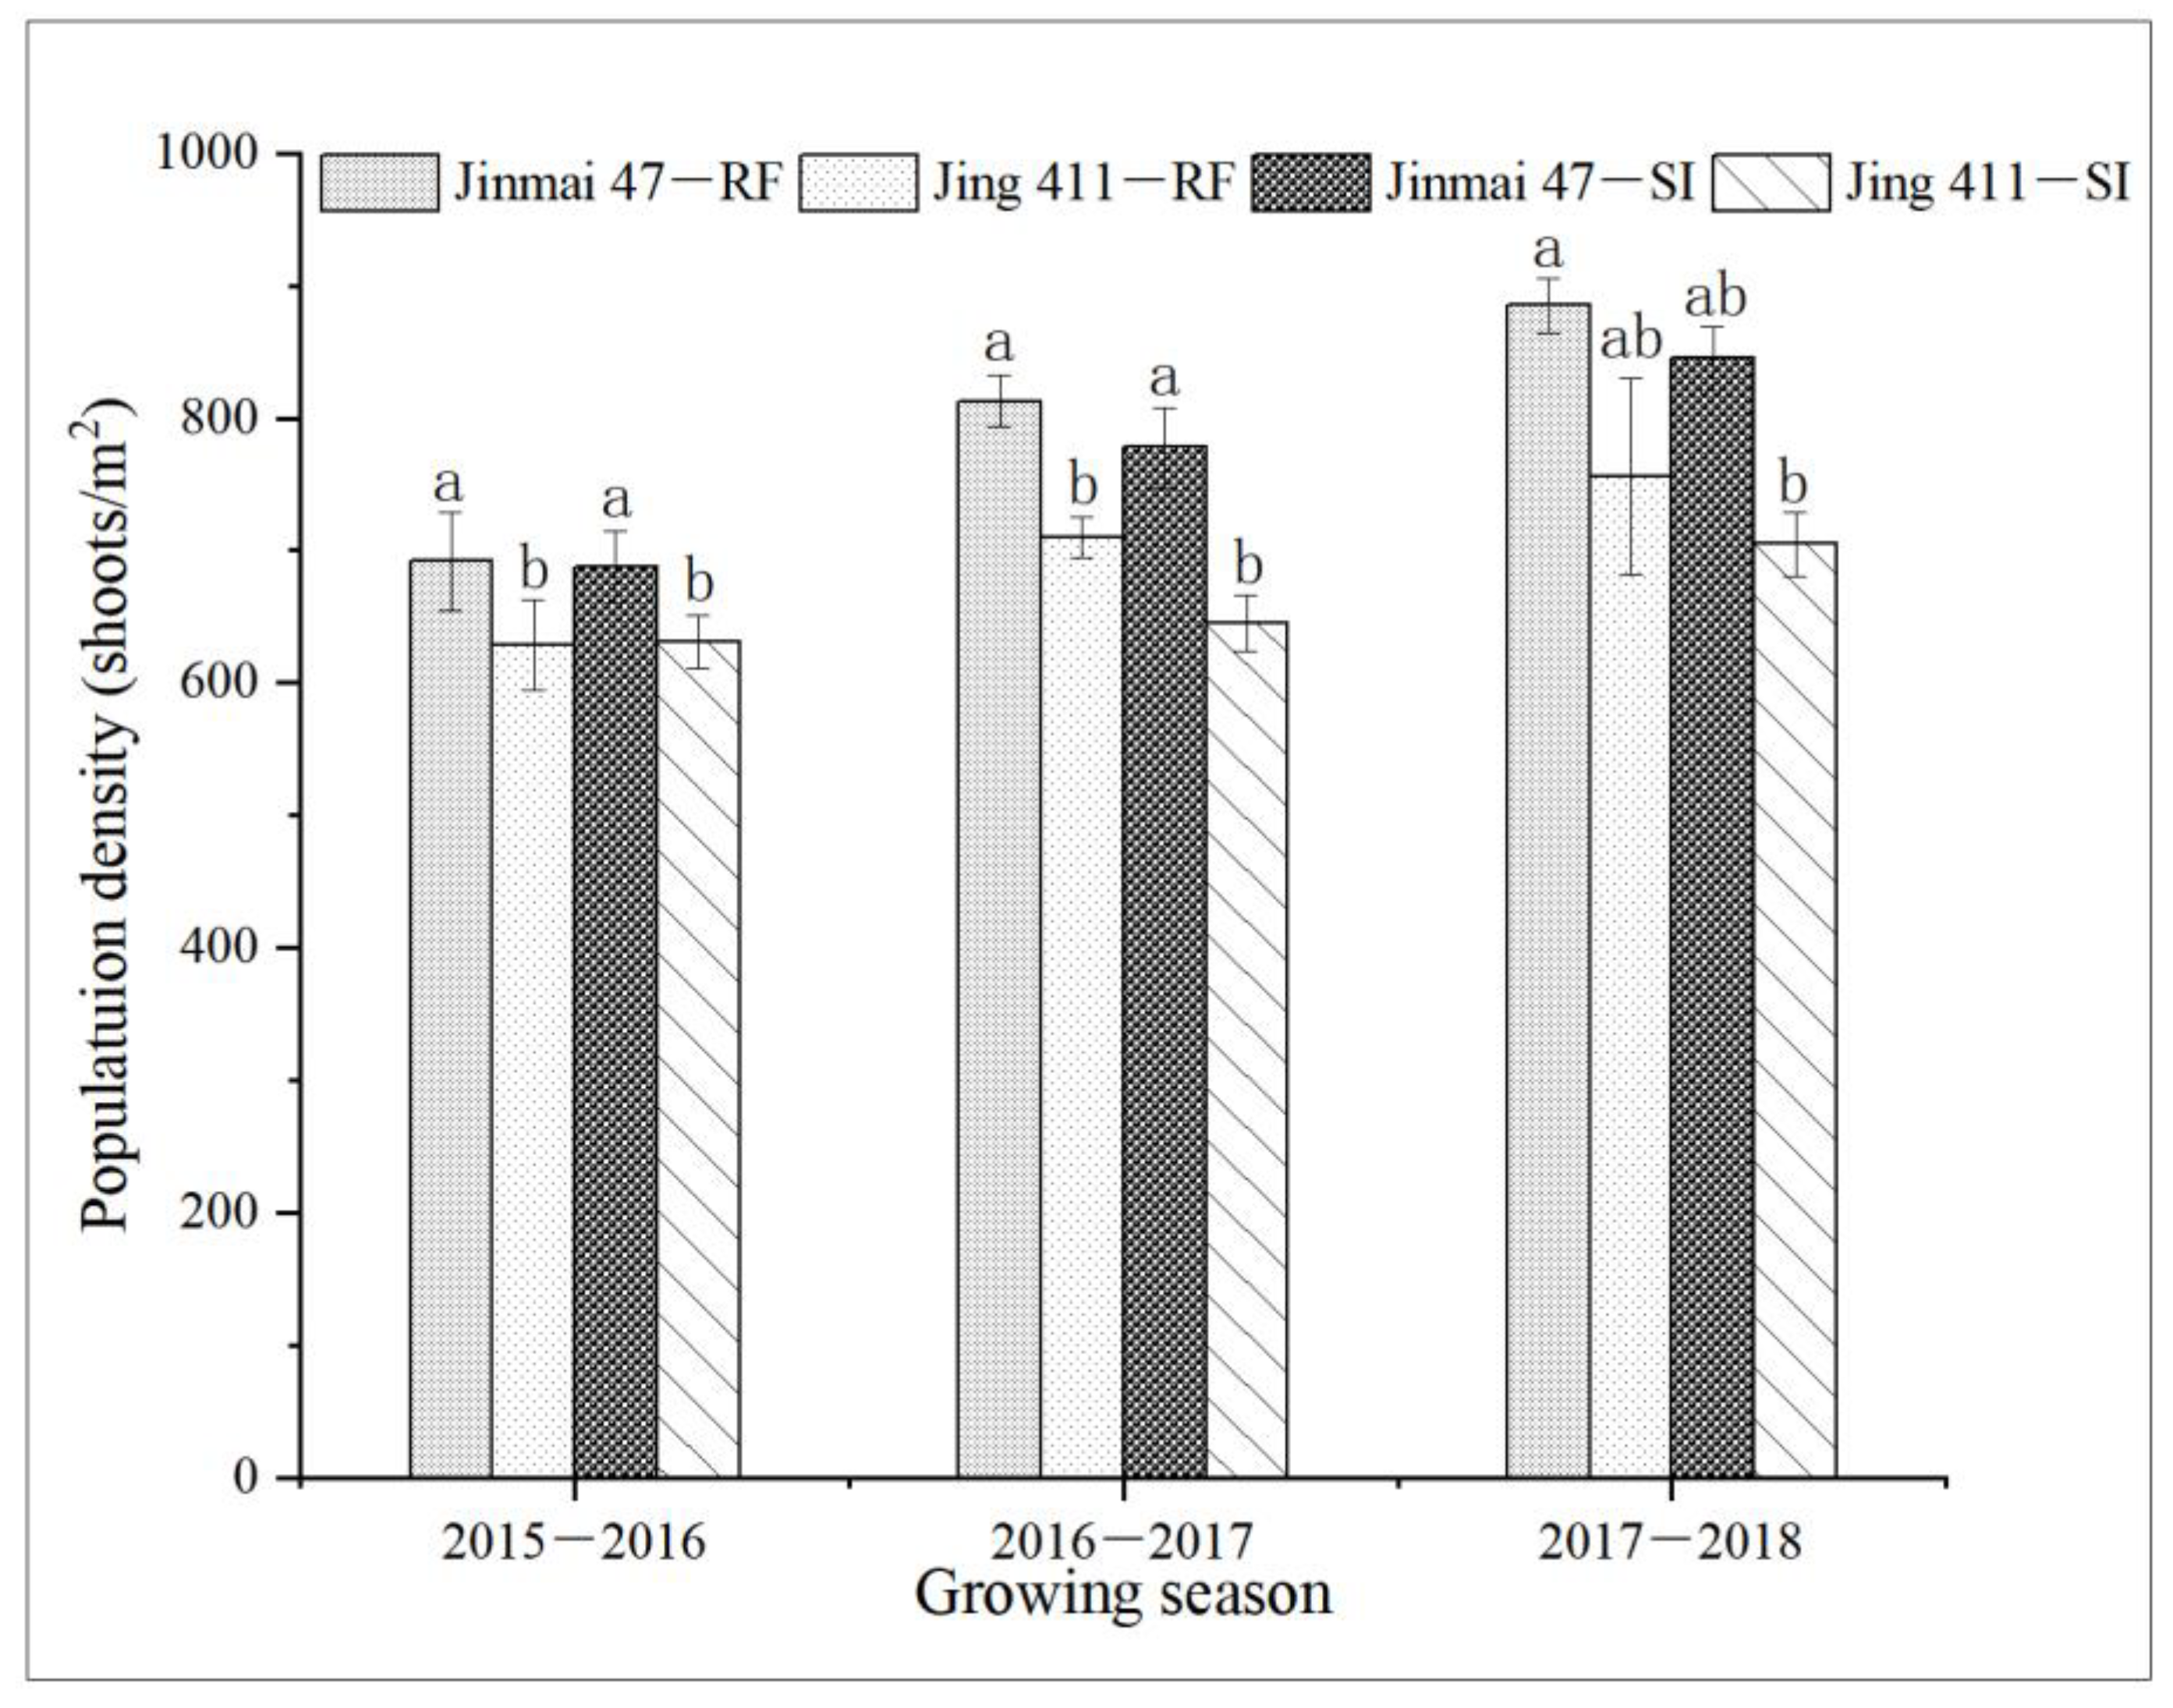
3.3. Genotypic Comparison between Jing 411 and Jinmai 47 in the Canopy Traits

The two population traits related to or subjected to the canopy structure, population density and CTD were investigated for the two genotypes during the anthesis stage of the wheat crops. In each of the three consecutive seasons, the population density of Jinmai 47 was higher than that of Jing 411, regardless of the water conditions (Figure 1), indicating its stronger tillering ability than Jing 411 at that sowing density. Consistently, with a higher stomatal conductance and transpiration rate, Jinmai 47 showed a higher CTD than Jing 411 over all the 12 measurements in the three growing seasons under the two water treatments (Table 4).

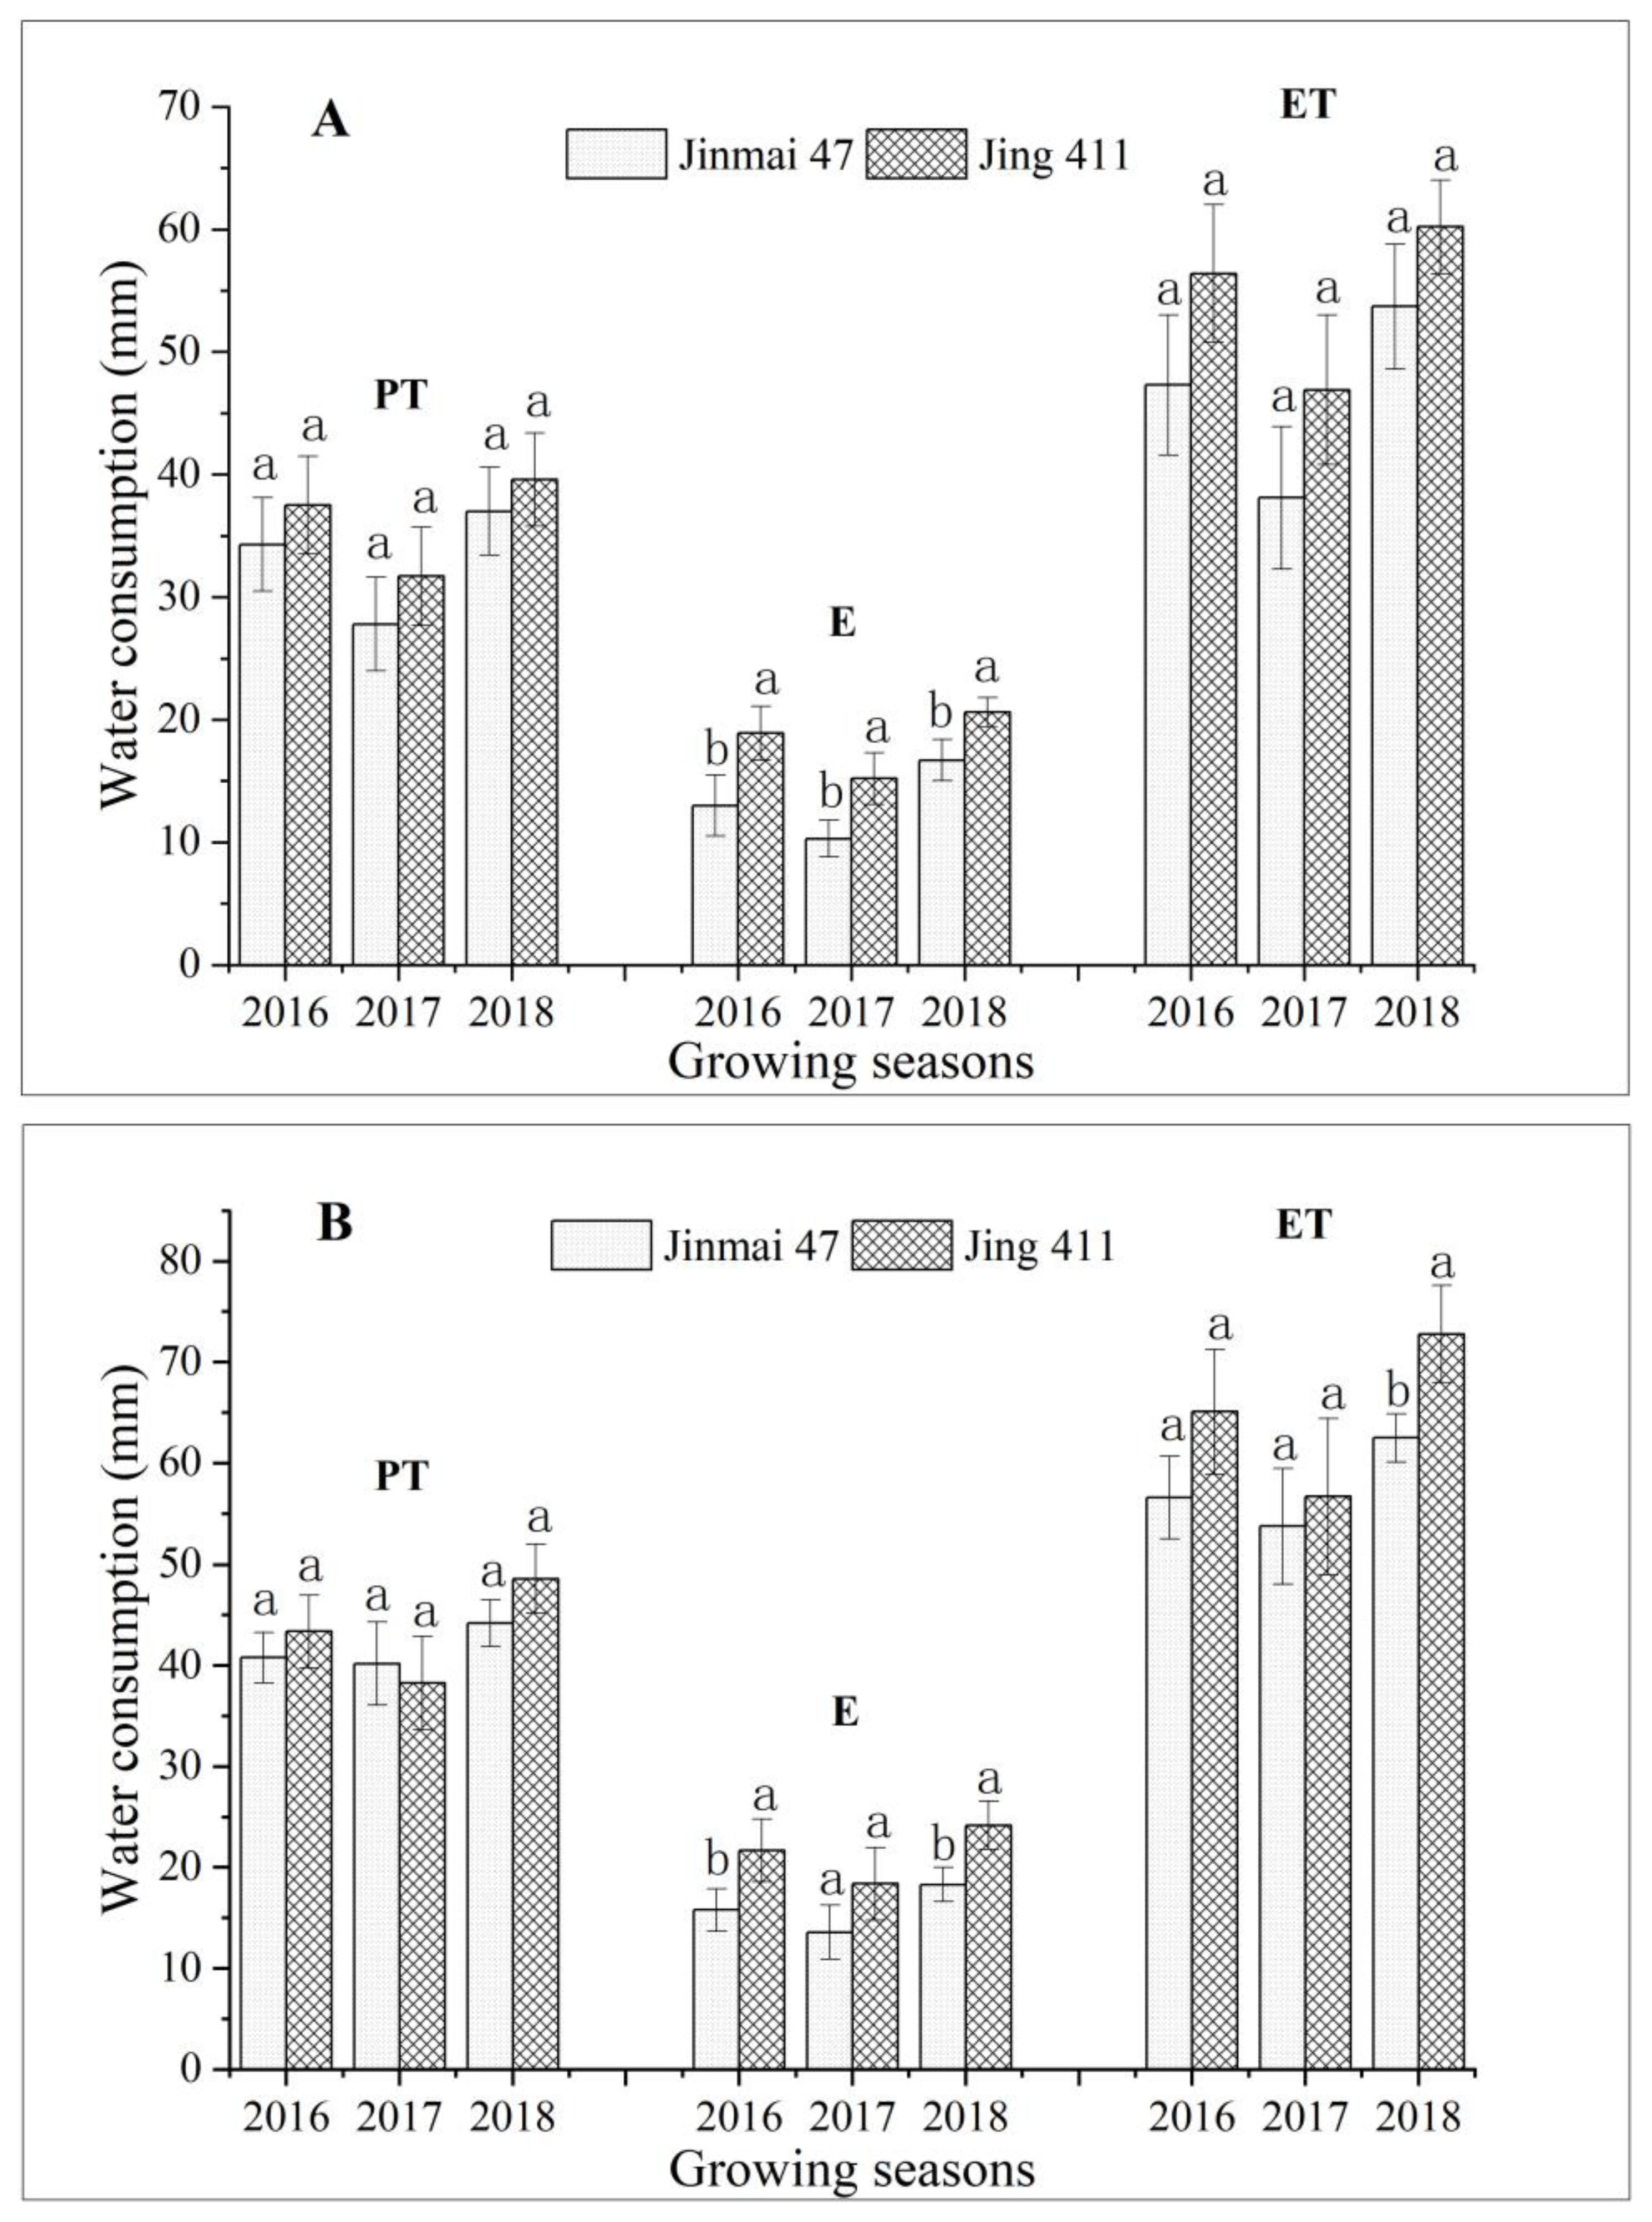
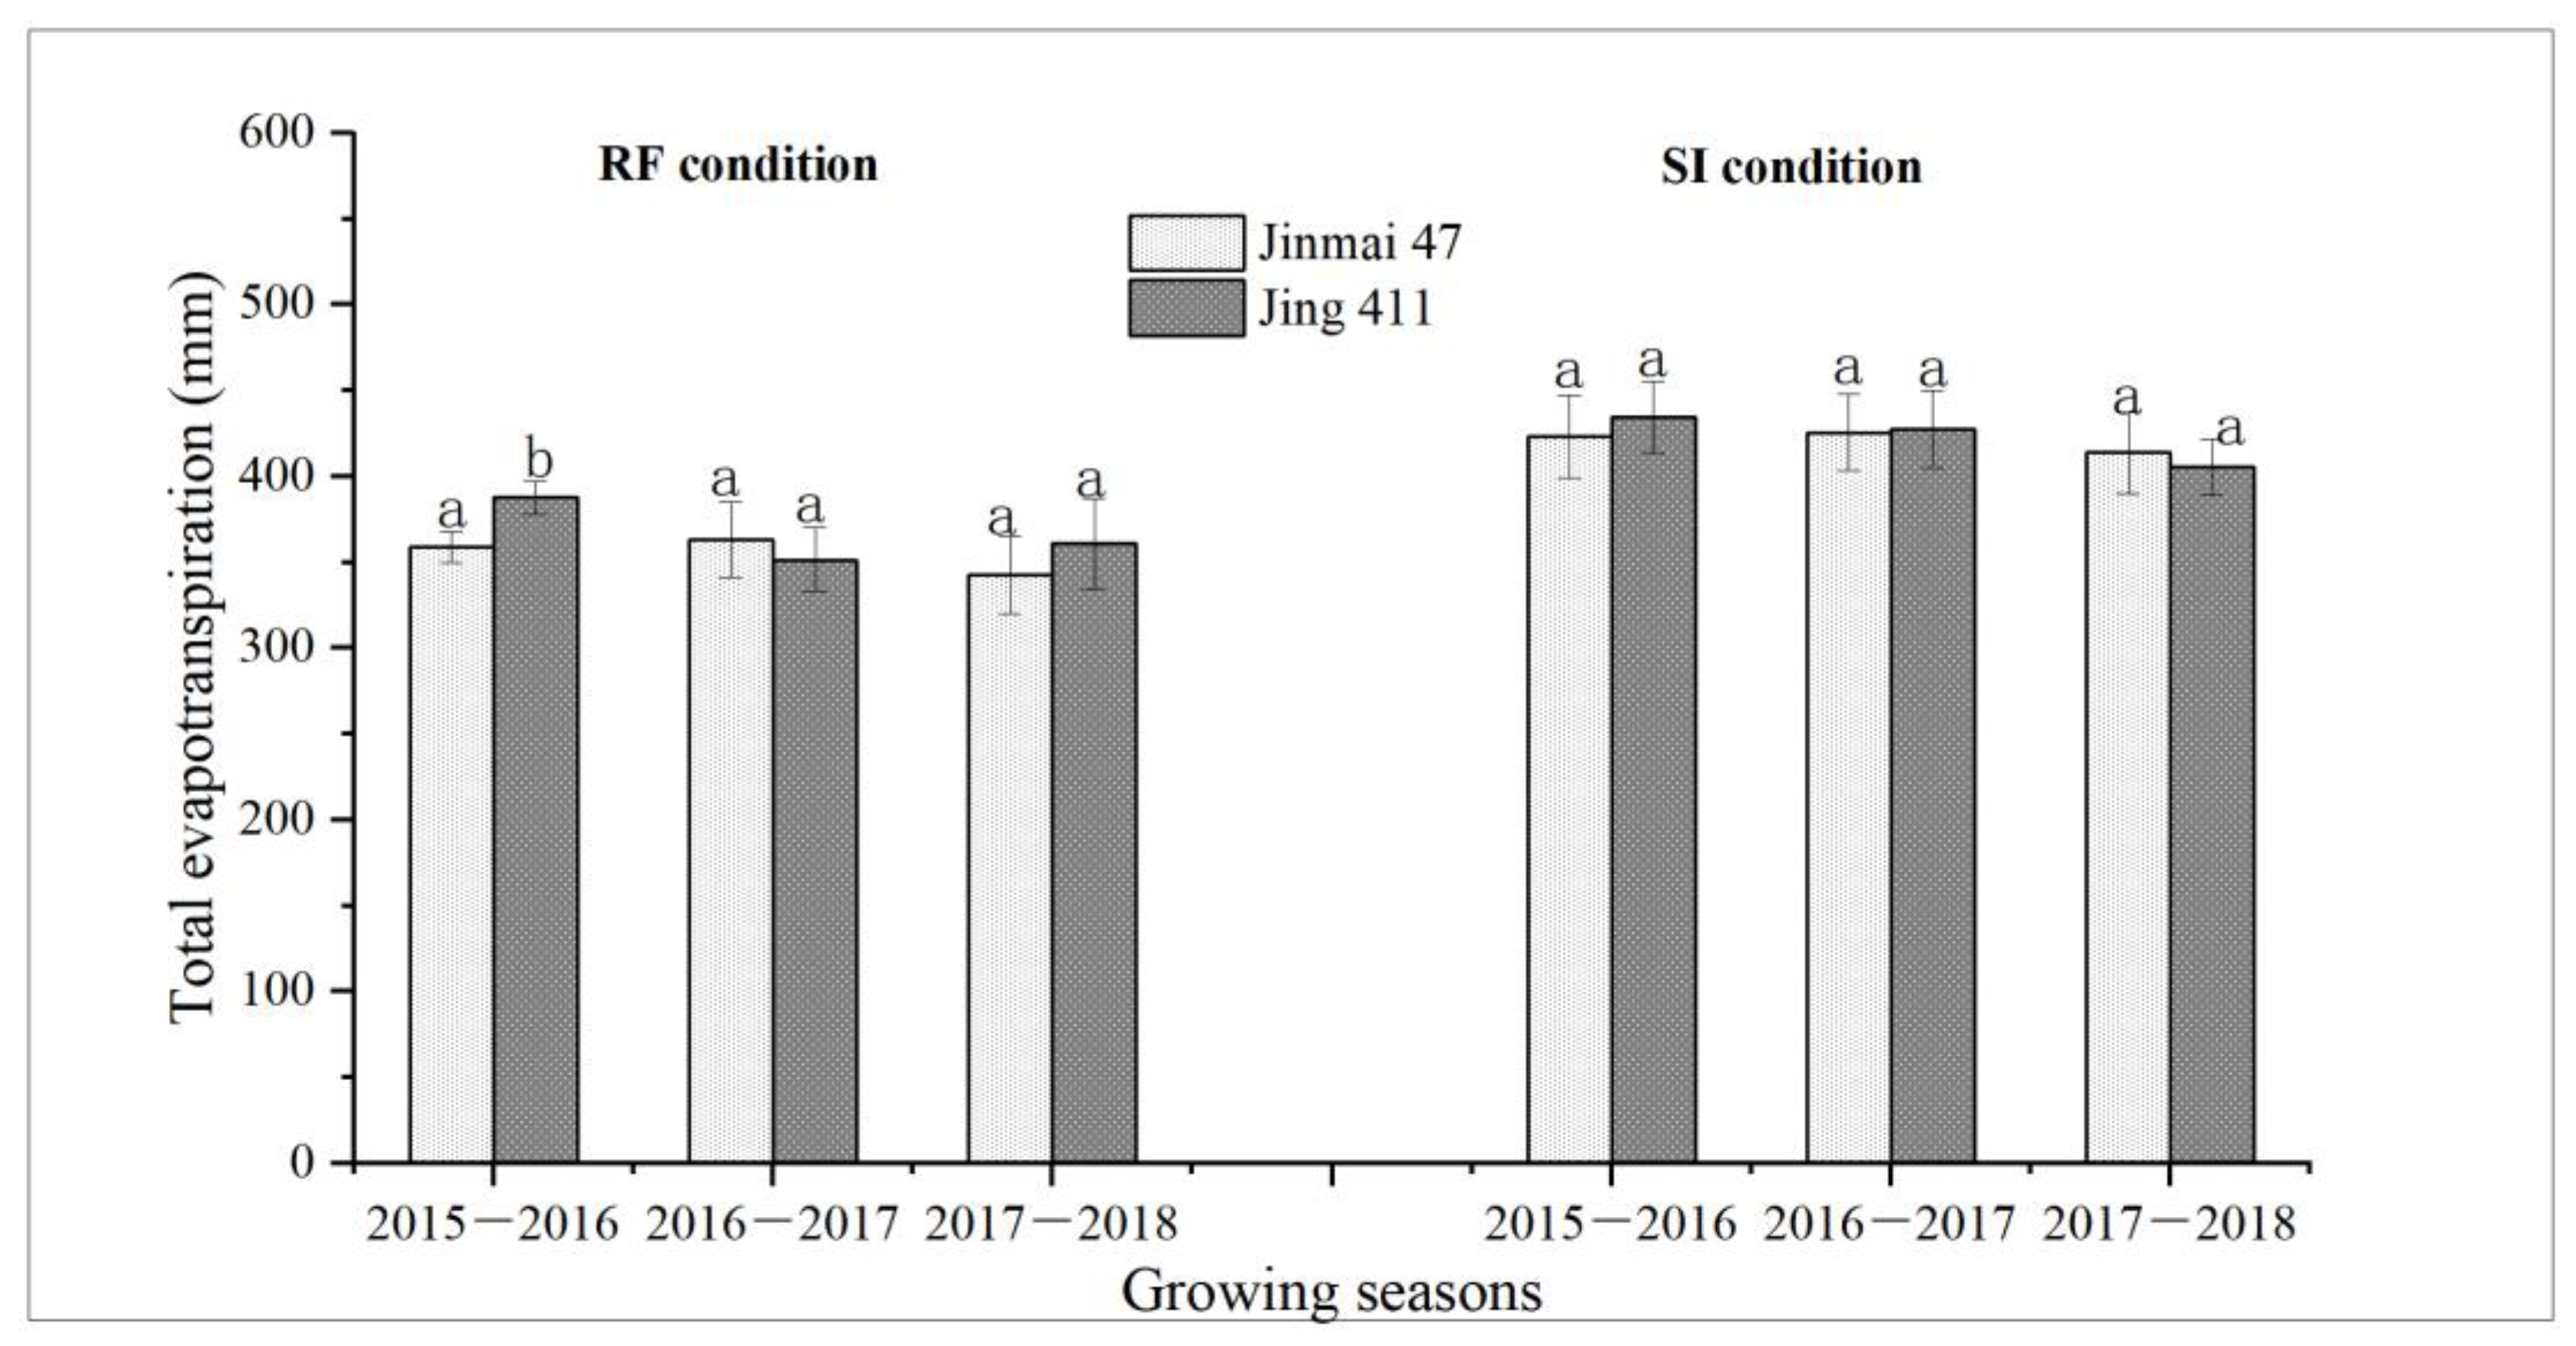
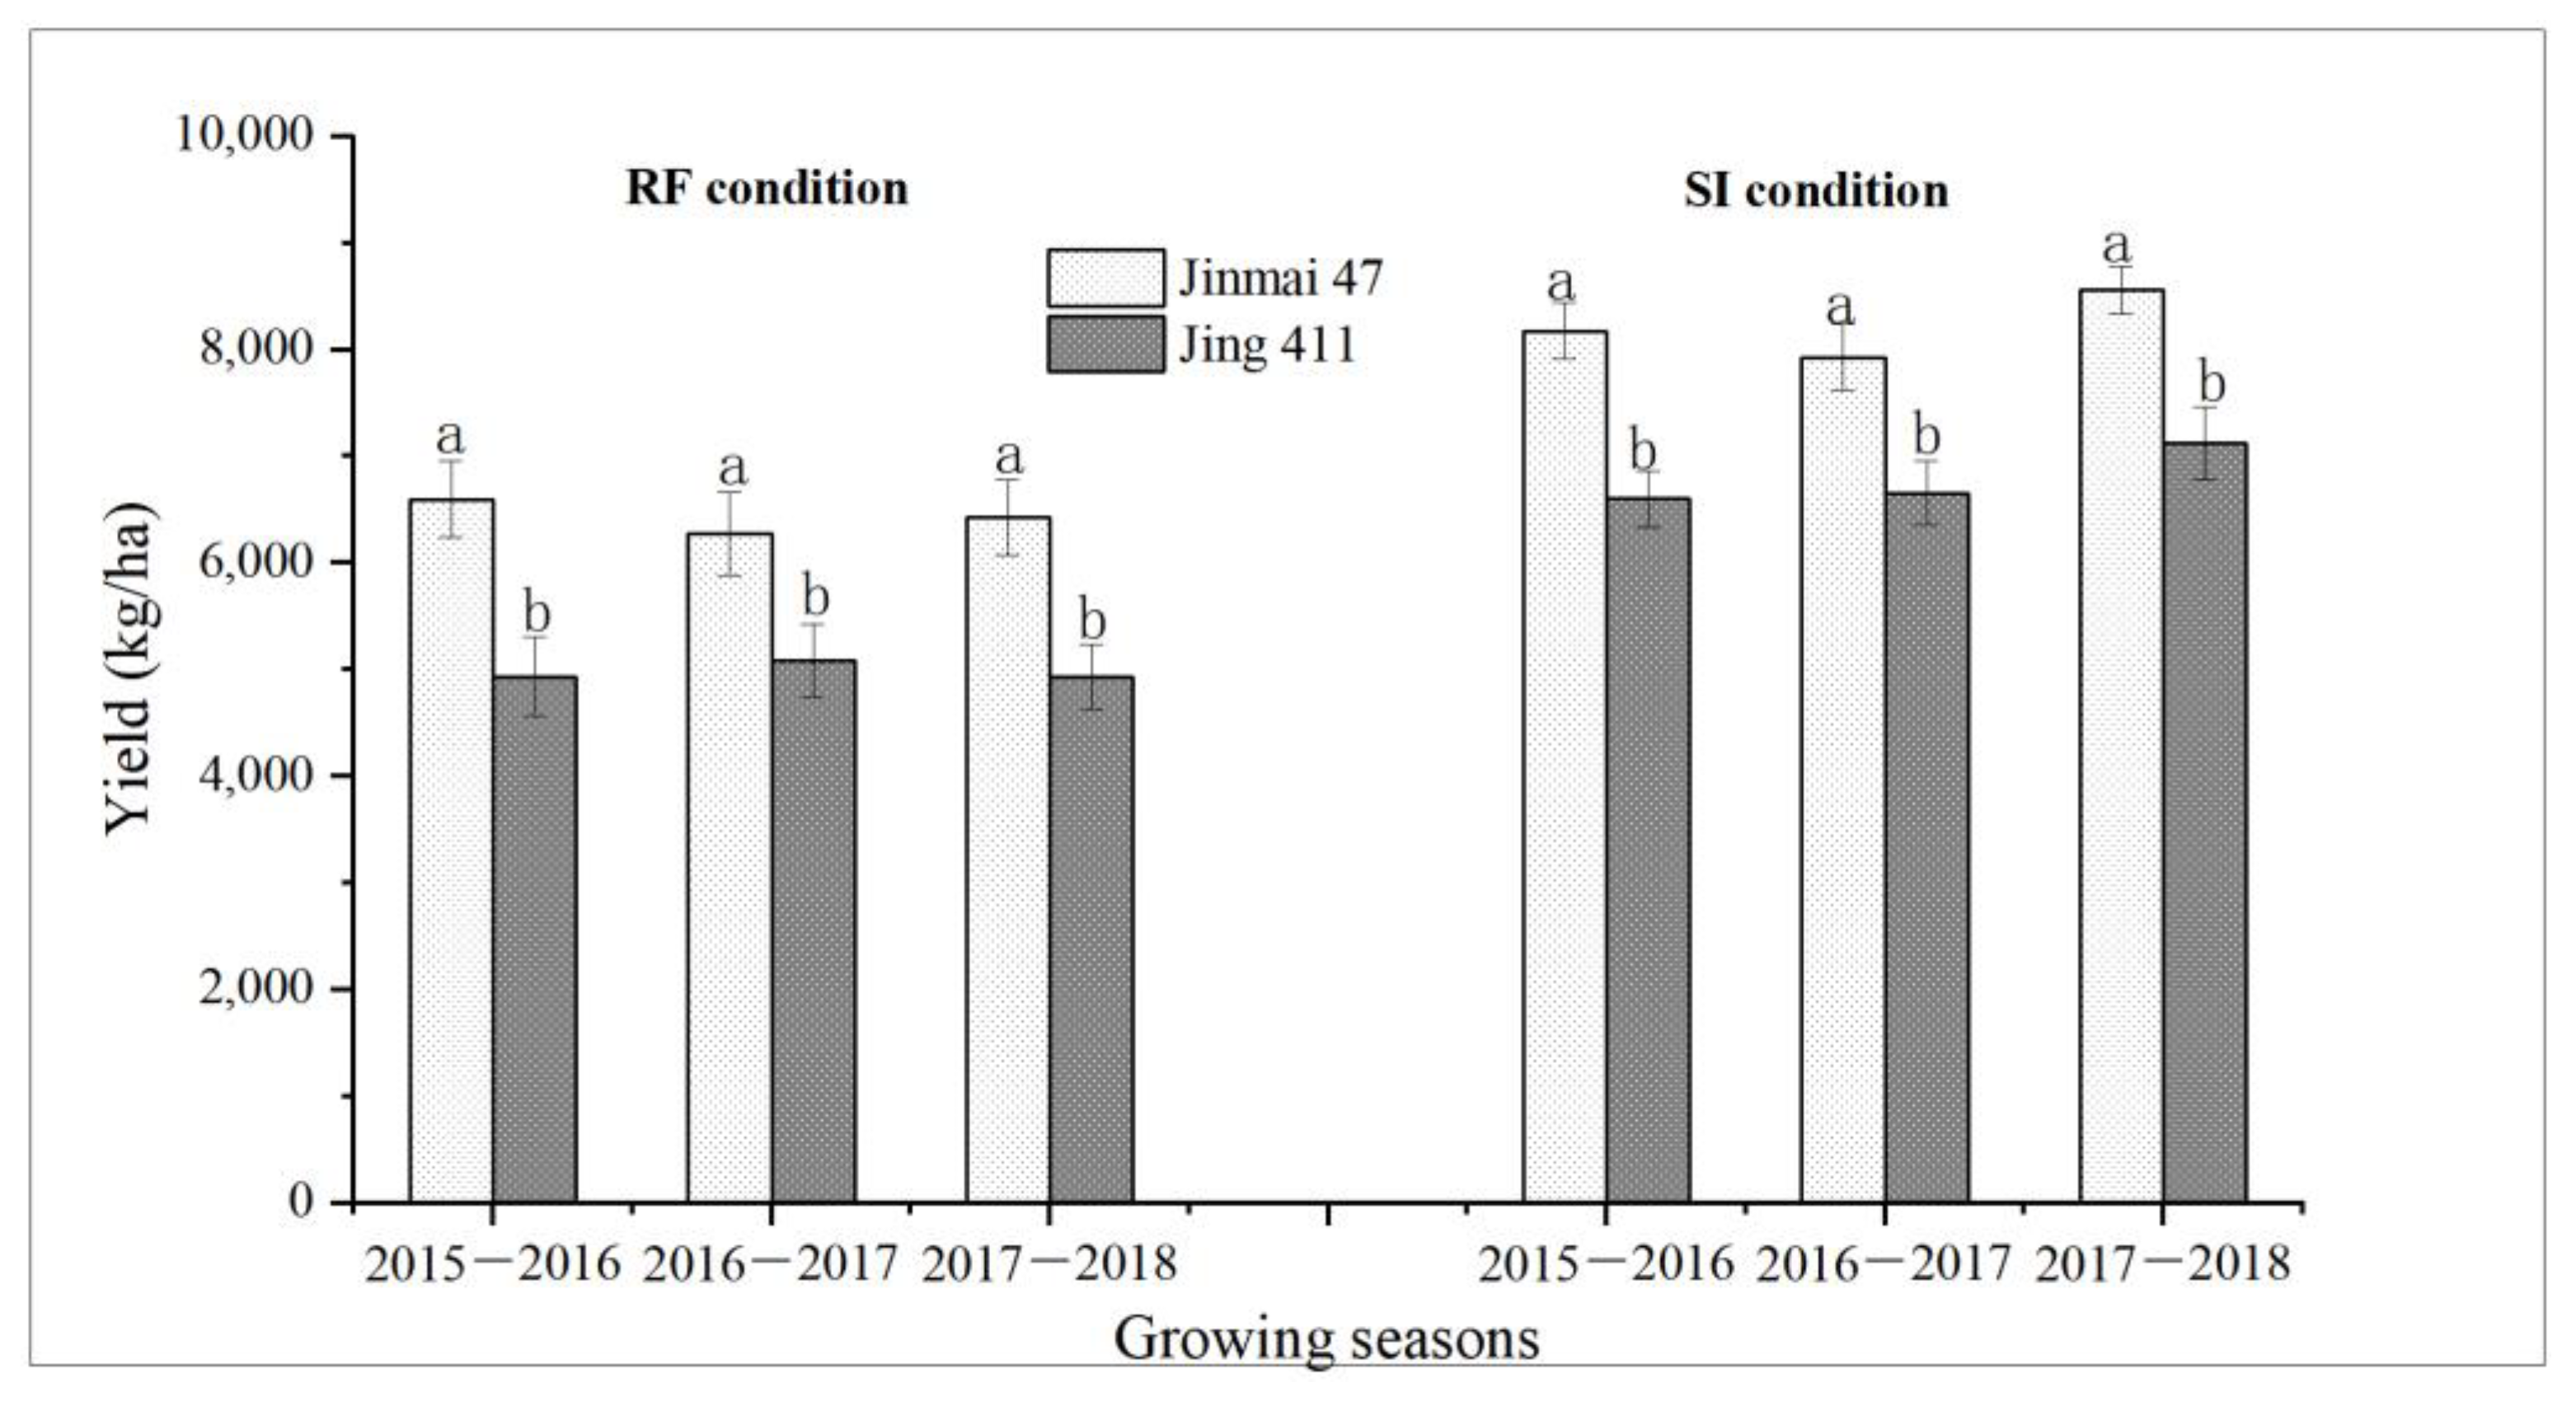
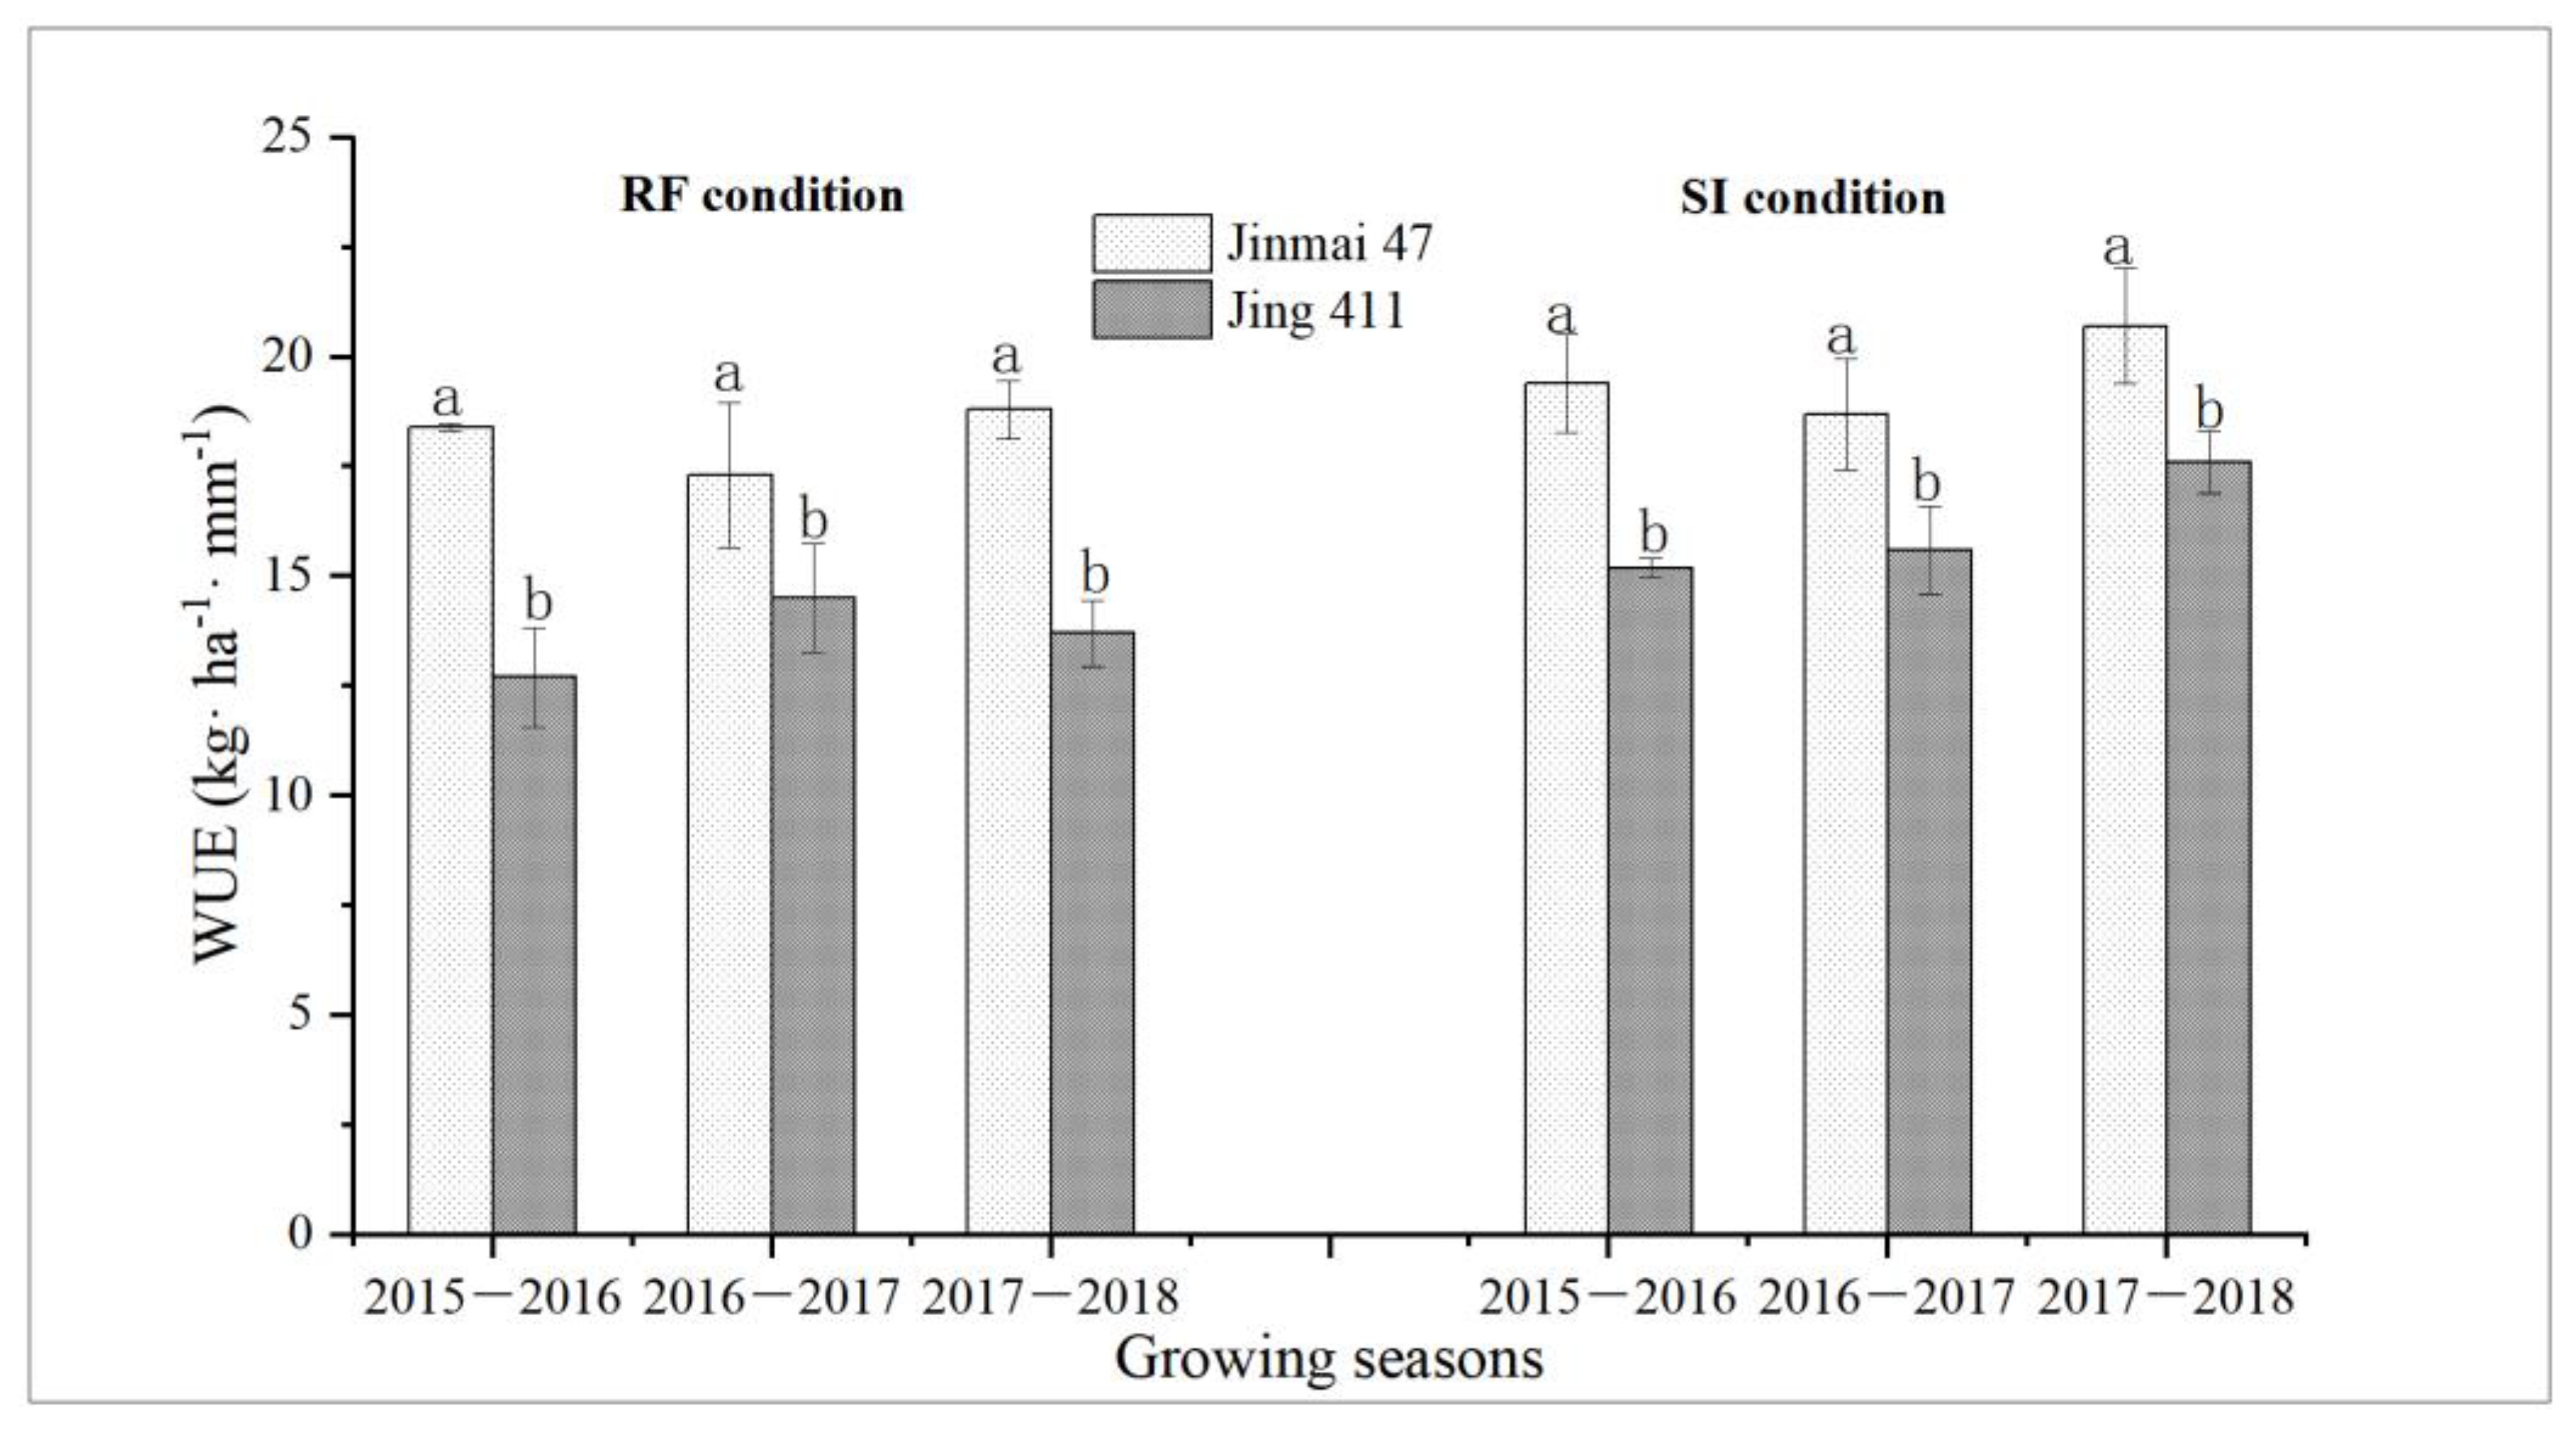
3.4. Water Consumption and Grain Yield of Jinmai 47 and Jing 411

The soil E was determined by utilizing micro-lysimeters, which were installed between the two rows. The E in the rows might have been smaller than that between the rows where the soil surface was more exposed. Additionally, the existence of the cylinder of the micro-lysimeter might have affected the E. Measurement by this method might have led to an over-estimated E, and thus a higher percentage of the E over the total ET. In any case, this study separated the E and PT, providing a reference for assessing and comparing the E and PT among the two cultivars with contrasting plant architectures.
It was during the period from the jointing to the early grain filling stages that the E, PT and ET were determined for the two genotypes under the two water conditions. Only in the E did the genotypic difference exist. Five of the six measurements in the three growing seasons under the two water treatments demonstrated a higher E in Jing 411 than in Jinmai 47, with the difference tending to increase under the SI condition (Figure 2A,B). It is important to note that the PT and ET were not significantly different between the two genotypes (Figure 2A,B). Consistently, the TET was not significantly different between them, either (Figure 3). With a higher population density, Jinmai 47 did not consume more water, as shown by the similar ET and TET, indicating that Jinmai 47 conserved more water relative to Jing 411. The higher leaf transpiration rate and higher population density did not bring about a higher PT for Jinmai 47. Moreover, a similar PT did not lead to a similar CTD. Instead, Jinmai 47 showed an obviously larger CTD than Jing 411. These conflicts might be attributed to the effect of its flat-leafed loose plant architecture.
With the SI, PT and E, the sum ET increased more in Jing 411 than in Jinmai 47 (Figure 2A,B). For each genotype, the ET was rather higher under the SI than under the RF condition, and the PT increased by a larger amount than the E, indicating the primary effect of the soil water availability on the water consumption of the crop population in the field, particularly on its transpiration (Figure 2A,B). Among the three growing seasons for each genotype, though the E varied slightly regardless of the water conditions, both the PT and ET were rather larger in 2018 than in the other two years under the RF condition, which could be due to the much higher precipitation that occurred in April (Figure 2A and Table 1).
Jinmai 47 consistently yielded higher than Jing 411 over the three growing seasons under the RF and SI conditions (Figure 4), which could be explained by its higher leaf photosynthetic rate as well as its higher population density. Due to the higher grain yield as well as the statistically similar amount of the TET with Jing 411, Jinmai 47 had a rather higher WUE than Jing 411 (Figure 5). The results confirmed the superiority of Jinmai 47 in its yield performance, especially without the expense of consuming more water in comparison to Jing 411.

4. Discussion

Jinmai 47 and Jing 411 perform excellently in the northern wheat region in China. Jinmai 47 has been frequently used as a control cultivar in genotypic comparison for evaluating drought resistance and grain yield up to now. In the present study, the two cultivars were selected to study how plant architectures affected the canopy traits and water use traits, in particular the transpiration. The flat-leafed Jinmai 47 showed a superiority in the canopy temperature and grain yield compared to the upright-leafed Jing 411. Moreover, the flat-leafed loose genotype not only prevented soil evaporation, but also significantly conserved transpiration water.

4.1. Flat-leafed Jinmai 47 Maintained a Cooler Canopy and Conserved Water Relative to the Upright-Leafed Jing 411

The canopy temperature generally follows the air temperature but can drop below or rise above the air temperature due to the balance of radiative heating and transpirational cooling [28]. To date, the reported CTD values in wheat are in a rather wide spectrum, ranging from negative to positive. Generally, the CTD was more positive under the conditions of the higher air temperature [29,30,31] and more negative under the relatively lower air temperature, accompanied by the water deficit in particular [23,32]. While under similar climatic conditions, the studies performed in Texas reported a negative [23] and positive CTD [22], which might be due to the different cultivation practices.
The genotypic difference in the CTD is primarily caused by the different transpiration [24]. Transpiration, as a moisture and heat exchange process occurring on the leaf–air interface, is also regulated by multiple factors. Crops adjust their stomatal conductance to decrease the transpiration rate for controlling water loss or increase the transpiration rate for cooling their leaves. Increased transpiration brought about a cooler canopy temperature, namely a larger CTD [22,33,34]. The CTD was proven to be positively correlated with the transpiration status in wheat, rice, potatoes and sugar beets [35].
On the other hand, the canopy structure, determined by the plant architecture traits and population density, not only affect the solar radiation on and within the canopy, but also affect the permeability and resistance to the water and heat exchange between the canopy and the atmosphere. Thus, they play an pivotal role in regulating transpiration [36] and the canopy temperature [37]. With a better permeability, namely a weak resistance to the water and heat exchange, the canopy structure allows for a faster heat and water exchange, leading to a CTD decline but a PT increase. That is, the canopy structure regulates the CTD and PT in opposite ways, thereby breaking the positive correlation between the CTD and PT.
In the present study, although the PT amount did not differ between Jinmai 47 and Jing 411 statistically, Jinmai 47 consistently showed a larger CTD than Jing 411. The phenomenon might only be attributed to the dominant effect of the canopy structure, which was derived from the contrasting plant architectures of both genotypes and their different population density. The canopy structure of the upright-leafed Jing 411 allowed for a fast exchange of water and heat between the air and the canopy, then diminished the CTD and enhanced the PT. In comparison, the canopy structure of the flat-leafed Jinmai 47 prevented a faster exchange of water and heat between the canopy and the atmosphere, and thus gained a greater CTD and inhibited the PT as a result. The enhanced PT, due to its higher leaf transpiration rate and higher population density, might be offset by the negative effect of its canopy structure in Jinmai 47. Consistently, Thapa et al. [38] planted maize (Zea mays L.) in clumps, instead of uniform planting, and found that an alteration in the growing pattern brought about change in the canopy structure, which led to a cooler canopy temperature (increasing CTD) during the vegetative growth stage.
In a wheat field, water loss through E accounts for about 30% of total ET in the North China Plain [39]. Therefore, efficiently reducing E has been considered as an important strategy for water conservation. Jinmai 47 consistently showed a rather lower E than Jing 411. Its flat-leafed loose architecture might help prevent evaporation from the soil surface due to the better shading from its flat leaves. Additionally, the CTD was positive in the North China Plain, namely the canopy temperature was lower than the air temperature, as found in the current study. Jinmai 47 had a larger CTD than Jing 411, implying that the canopy of the flat-leafed genotype was more superior for resisting heat dissipation from the air into the canopy, and thus kept a cooler canopy temperature. Tafesse et al. [14] also found that the flattening of the canopy was most strongly associated with a low heat dissipation due to the limited canopy air flow. They also pointed out that the pea cultivar’s sensitivity to heat stress was due to differences in the plant factors that influenced the canopy structure. Apart from the leaf type, the CTD was influenced by other architectural traits. A greater CTD was also attributed to a light leaf color in barley (Hordeum vulgare L.) [40] and in wheat [14]. Consistent with the previous research, Jinmai 47 had a lighter leaf color which demonstrated a greater CTD than Jing 411, which had darker green leaves.

4.2. Flat-Leafed Type Jinmai 47 Yielded Higher Than Upright-Leafed Type Jing 411

Herbert [41,42] found that a more erect distribution of upper foliage reduced the mutual shading among plants, benefitting a deeper penetration and more uniform distribution of light within the canopy but decreasing the light interception by the upper layers. Additionally, Falster et al. [18] found that shallow angled leaves had a greater daily light interception and a potentially greater carbon gain than steeper angled leaves. In cotton, since the earlier fruits were on the lower parts of the plant and the ability of the older leaves to produce sufficient photosynthates in concert with the fruit requirements limited potential yield, adequate light penetration into the crop canopy was particularly important [19,20]. Differing from cotton, the wheat ear is uppermost. Moreover, the grain yield formation of cereals primarily depends on the photosynthates of the younger leaves after anthesis, which contributes up to 70–80% of the grain yield [43]. Especially since the flag leaf functions as the major photosynthetic apparatus in the later developmental stage, its contribution to the grain yield covers more than one third [44]. Apparently, the flat-leafed type benefits the light interception and carbon gain, thus helping wheat crops obtain a higher grain yield. Jinmai 47 obtained a higher grain yield than Jing 411 at the same sowing density, which might be due partly to its higher population density, partly to its higher leaf photosynthetic rate and partly attributable to its flat-leafed architecture.
On the other hand, the flat-leafed Jinmai 47 had a greater CTD, namely a cooler canopy temperature, as discussed above. Fischer et al. [7] analyzed and ascribed wheat yield improvement to the higher stomatal conductance, photosynthetic rate and cooler canopies. The CTD was closely and positively correlated with the grain yield under no matter RF or SI conditions [23,25,45,46]. In the North China Plain, the heat stress, especially during the grain filling stage, has been a factor restricting wheat production [47]. The maintenance of a cooler canopy is important for wheat crops to maintain a good harvest.
Transpiration is a determinant factor for the grain yield, according to the classic biomass transpiration function proposed by de Wit [48], which is old but has stood the test of time, and thus has been considered as the cornerstone for relating plant production to water use. This was practically confirmed in the crop production, e.g., a higher leaf transpiration rate was found to be closely associated with a better yield performance in tolerant cultivars under stress conditions [9,11]. Blum [49] also stressed that breeding for maximized soil moisture capture for transpiration is the most important target for yield improvement under drought stress. All these suggest that conserving transpiration water must be at the expense of grain yield loss. In the present study, however, Jinmai 47 consumed a similar amount of water viewed from the TET over the whole growing season, but obtained rather higher grain yield than Jing 411, challenging the classical transpiration yield in wheat cultivars.
It might have been the involvement of the plant architecture that challenged the original transpiration–CTD and transpiration–yield relations. This effect of plant architecture otherwise provides the possibility of coordinately maintaining a high grain yield level and conserving water. The genotypes with diverse plant architectures are likely to gain a higher grain yield through appropriately adjusting the sowing density. However, to realize the dual goals of a higher grain yield and water saving, the flat-leafed type might be ideal candidate, since it may benefit the light interception of the upper leaves, keeping a cooler canopy, preventing soil evaporation and reducing the population transpiration, as discussed above.

5. Conclusions

Jinmai 47, with a flat-leafed loose architecture, larger population density, higher leaf net photosynthetic rate, higher stomatal conductance and higher transpiration rate, obtained a rather higher grain yield and maintained a cooler canopy temperature relative to Jing 411. Unexpectedly, its population-scale transpiration (PT) and evapotranspiration investigated during the jointing to early grain filling stages were not higher than Jing 411 or its total evapotranspiration (TET) over the whole growing season. This demonstrated that Jinmai 47 performed excellently in water conservation and grain yield formation. The conflicts between its higher leaf transpiration rate and higher population density with a similar PT to Jing 411, between its larger canopy temperature depression (CTD) with a similar PT to Jing 411 and between its higher grain yield with a similar TET to Jing 411 challenged the classical positive correlation between the CTD and PT. The correlation between the water use and grain yield also implied the critical effect of the canopy structure relating to the plant architecture on the water use and grain yield of a population. It might be the flat-leafed loose architecture that endows the genotype with a water saving merit contributes more to the cooler canopy temperature and benefits the light interception of the upper leaves to ensure a higher grain yield. This study, thus, suggested the possibility of saving water without causing enormous grain yield loss by selecting an appropriate plant architecture to establish an ideal canopy structure. It should be noted the current study was limited to only two wheat genotypes. Thus, further studies remain to be carried out to confirm a flat-leafed loose architecture as a potential factor for coordinately realizing the dual goal of water conservation and yield improvement in wheat crops.

Author Contributions

Conceptualization, X.M.; methodology, X.Z. (Xiuli Zhong), Y.L. and X.L.; formal analysis, G.H., R.G. and F.G.; investigation, G.H., X.Z. (Xinying Zhang), Z.W. and S.L.; writing—original draft preparation, G.H. and X.Z. (Xiuli Zhong); writing—review and editing, Y.L., X.L. and X.M.; visualization, G.H. and X.Z. (Xinying Zhang); project administration, X.M.; funding acquisition, E.L. All authors have read and agreed to the published version of the manuscript.

Funding

This research was funded by the grant from the National Key R & D Program (2021YFE0101300) and the Central Public-interest Scientific Institution Basal Research Fund (BSRF202002).

Institutional Review Board Statement

Not applicable.

Informed Consent Statement

Not applicable.

Data Availability Statement

All data generated or analyzed during this study are included in the present article.

Conflicts of Interest

The authors declare no conflict of interest.

References

  1. National Bureau of Statistics of China. China Statistical Year-Book; China Statistics Press: Beijing, China, 2021.
  2. Sun, H.Y.; Liu, C.M.; Zhang, X.Y.; Shen, Y.J.; Zhang, Y.Q. Effects of irrigation on water balance, yield and WUE of winter wheat in the North China Plain. Agric. Water Manag. 2006, 85, 211–218. [Google Scholar] [CrossRef]
  3. Zhang, X.Y.; Qin, W.L.; Xie, J.N. Improving water use efficiency in grain production of winter wheat and summer maize in the North China Plain: A review. Front. Agr. Sci. Eng. 2016, 3, 25–33. [Google Scholar] [CrossRef] [Green Version]
  4. Yuan, Z.; Shen, Y. Estimation of agricultural water consumption from meteorological and yield data: A case study of Hebei, North China. PLoS ONE 2013, 8, e58685. [Google Scholar] [CrossRef] [PubMed]
  5. Yang, X.L.; Chen, Y.Q.; Pacenka, S.; Gao, W.S.; Ma, L.; Wang, G.Y.; Yan, P.; Sui, P.; Steenhuis, T.S. Effect of diversified crop rotations on groundwater levels and crop water productivity in the North China Plain. J. Hydrol. 2015, 522, 428–438. [Google Scholar] [CrossRef]
  6. Zhang, X.Y.; Qin, W.L.; Chen, S.Y.; Shao, L.W.; Sun, H.Y. Response of yield and WUE of winter wheat to water stress during the past three decades-A case study in the North China Plain. Agric. Water Manag. 2017, 179, 47–54. [Google Scholar] [CrossRef]
  7. Blum, A. Drought resistance, water-use efficiency, and yield potential-are they compatible, dissonant, or mutually exclusive? Aust. J. Agric. Res. 2005, 56, 1159–1168. [Google Scholar] [CrossRef] [Green Version]
  8. Fischer, R.A.; Rees, D.; Sayre, K.D.; Lu, Z.M.; Condon, A.G. Wheat yield progress associated with higher stomatal conductance and photosynthetic rate, and cooler canopies. Crop Sci. 1998, 38, 1467–1475. [Google Scholar] [CrossRef]
  9. Bota, J.; Flexas, J.; Medrano, H. Genetic variability of photosynthesis and water use in Balearic grapevine cultivars. Ann. Appl. Biol. 2001, 138, 353–361. [Google Scholar] [CrossRef]
  10. Ratnayaka, H.H.; Kincaid, D. Gas exchange and leaf ultrastructure of tinnevelly senna, Cassia angustifolia, under drought and nitrogen stress. Crop Sci. 2005, 45, 840–847. [Google Scholar] [CrossRef]
  11. Saeidi, M.; Abdoli, M. Effect of Drought Stress during Grain Filling on Yield and Its Components, Gas Exchange Variables, and Some Physiological Traits of Wheat Cultivars. J. Agr. Sci. Tech. Iran 2015, 17, 885–898. [Google Scholar]
  12. Zhang, X.Y.; Wang, Y.J.; Huang, G.R.; Feng, F.; Liu, X.Y.; Guo, R.; Gu, F.X.; Hu, X.; Yang, Z.G.; Zhong, X.L.; et al. Atmospheric humidity and genotype are key determinants of the diurnal stomatal conductance pattern. J. Agron. Crop Sci. 2020, 206, 161–168. [Google Scholar] [CrossRef]
  13. Condon, A.G.; Richards, R.A.; Rebetzke, G.J.; Farquhar, G.D. Improving intrinsic water-use efficiency and crop yield. Crop Sci. 2002, 42, 122–131. [Google Scholar] [PubMed]
  14. Tafesse, E.G.; Warkentin, T.D.; Bueckert, R.A. Canopy architecture and leaf type as traits of heat resistance in pea. Field Crops Res. 2019, 241, 107561. [Google Scholar] [CrossRef]
  15. Tharakan, P.J.; Volk, T.A.; Nowak, C.A.; Ofezu, G.J. Assessment of canopy structure, light interception, and light-use efficiency of first year regrowth of shrub willow (Salix sp.). BioEnerg. Res. 2008, 1, 229–238. [Google Scholar] [CrossRef]
  16. Li, W.; Niu, Z.; Chen, H.Y.; Li, D. Characterizing canopy structural complexity for the estimation of maize LAI based on ALS data and UAV stereo images. Int. J. Remote Sens. 2017, 38, 2106–2116. [Google Scholar] [CrossRef]
  17. Reihardt, D.; Kuhlemerier, C. Plant architecture. EMBO Rep. 2002, 3, 846–851. [Google Scholar] [CrossRef]
  18. Falster, D.S.; Westoby, M. Leaf size and angle vary widely across species: What consequences for light interception? New Phytol. 2003, 158, 509–525. [Google Scholar] [CrossRef] [PubMed] [Green Version]
  19. Wullschleger, S.D.; Oosterhuis, D.M. Photosynthesis of individual field-grown cotton leaves during ontogeny. Photosynth. Res. 1990, 23, 163–170. [Google Scholar] [CrossRef]
  20. Marois, J.J.; Wright, D.L.; Wiatrak, P.J.; Vargas, M.A. Effect of row width and nitrogen on cotton morphology and canopy micro-climate. Crop Sci. 2004, 44, 870–877. [Google Scholar] [CrossRef]
  21. Balota, M.; Payne, W.A.; Evett, S.R.; Peters, T.R. Morphological and physiological traits associated with canopy temperature depression in three closely related wheat lines. Crop Sci. 2008, 48, 1897–1910. [Google Scholar] [CrossRef] [Green Version]
  22. Thapa, S.; Jessup, K.E.; Pradhan, G.P.; Rudd, J.C.; Liu, S.Y.; Mahan, J.R.; Devkota, R.N.; Baker, J.A.; Xue, Q.W. Canopy temperature depression at grain filling correlates to winter wheat yield in the U.S. Southern High Plains. Field Crop Res. 2018, 217, 11–19. [Google Scholar] [CrossRef]
  23. Jones, H.G.; Serraj, R.; Loveys, B.R.; Xiong, L.Z.; Wheaton, A.; Price, A.H. Thermal infrared imaging of crop canopies for the remote diagnosis and quantification of plant responses to water stress in the field. Funct. Plant Biol. 2009, 36, 978–989. [Google Scholar] [CrossRef] [PubMed] [Green Version]
  24. Balota, M.; Payne, W.A.; Evett, S.R.; Lazar, M.D. Canopy temperature depression sampling to assess grain yield and genotypic differentiation in winter wheat. Crop Sci. 2007, 47, 1518–1529. [Google Scholar] [CrossRef] [Green Version]
  25. Khush, G.S. What it will take to feed 5.0 billion rice consumers in 2030. Plant Mol. Biol. 2005, 59, 1–6. [Google Scholar] [CrossRef] [PubMed]
  26. Li, Q.Q.; Zhou, X.B.; Chen, Y.H.; Yu, S.L. Water consumption characteristics of winter wheat grown using different planting patterns and deficit irrigation regime. Agric. Water Manag. 2012, 105, 8–12. [Google Scholar]
  27. Chen, S.Y.; Zhang, X.Y.; Sun, H.Y.; Ren, T.S.; Wang, Y.M. Effects of winter wheat row spacing on evapotranpsiration, grain yield and water use efficiency. Agric. Water Manag. 2010, 97, 1126–1132. [Google Scholar] [CrossRef]
  28. Webber, H.; White, J.W.; Kimball, B.A.; Ewert, F.; Asseng, S.; Rezaei, E.E.; Pinter, J.P.J.; Hatfield, J.L.; Reynolds, M.P.; Behnam, A.B.M.; et al. Physical robustness of canopy temperature models for crop heat stress simulation across environments and production conditions. Field Crops Res. 2018, 216, 75–88. [Google Scholar] [CrossRef] [Green Version]
  29. Kumari, M.; Pudake, R.N.; Singh, V.P.; Joshi, A.K. Association of stay green trait with canopy temperature depression and yield under terminal heat stress in wheat (Triticum aestivum L.). Euphytica 2013, 190, 87–97. [Google Scholar] [CrossRef]
  30. Mason, R.E.; Hays, D.B.; Mondal, S.; Ibrahim, M.H.; Basnet, B.R. QTL for yield, yield components and canopy temperature depression in wheat under late sown field conditions. Euphytica 2013, 194, 243–259. [Google Scholar] [CrossRef]
  31. Mondal, S.; Mason, R.E.; Huggins, T.; Hays, D.B. QTL on wheat (Triticum aestivum L.) chromosomes 1B, 3D and 5A are associated with constitutive production of leaf cuticular wax and may contribute to lower leaf temperatures under heat stress. Euphytica 2015, 201, 123–130. [Google Scholar] [CrossRef]
  32. Pradhan, G.P.; Xue, Q.; Jessup, K.E.; Rudd, J.C.; Liu, S.; Devkota, R.N.; Mahan, J.R. Cooler canopy contributes to higher yield and drought tolerance in new wheat cultivars. Crop Sci. 2014, 54, 2275–2284. [Google Scholar] [CrossRef]
  33. Cossani, C.M.; Slafer, G.A.; Savin, R. Do barley and wheat (bread and durum) differ in grain weight stability through seasons and water-nitrogen treatments in a Mediterranean location? Field Crops Res. 2011, 121, 240–247. [Google Scholar] [CrossRef]
  34. Balota, M.; Green, A.J.; Griffery, C.A.; Pitman, R.; Thomason, W. Genetic gains for physiological traits associated with yield in soft red winter wheat in the Eastern United States from 1919 to 2009. Eur. J. Agron. 2017, 84, 7–83. [Google Scholar] [CrossRef]
  35. Rebetzke, G.J.; Rattey, A.R.; Farquhar, G.D.; Richards, R.A.; Condon, A.G. Genomic regions for canopy temperature and their genetic association with stomatal conductance and grain yield in wheat. Funct. Plant Biol. 2013, 40, 14–33. [Google Scholar] [CrossRef]
  36. Johnson, R.C.; Witters, R.E.; Ciha, A.J. Apparent photosynthesis, evapotranspiration, and light penetration in two contrasting hard red winter wheat canopies. Agron. J. 1981, 73, 419–422. [Google Scholar] [CrossRef]
  37. Holmes, M.G.; Keiller, D.R. Effects of pubescence and waxes on the reflectance of leaves in the ultraviolet and photosynthetic wavebands: A comparison of a range of species. Plant Cell Environ. 2002, 25, 85–93. [Google Scholar] [CrossRef]
  38. Thapa, S.; Stewart, B.A.; Xue, Q.; Pokhrel, P.; Barkley, T.; Bhandari, M. Growing corn in clumps reduces canopy temperature and improves microclimate. J. Crop Improv. 2016, 30, 614–631. [Google Scholar] [CrossRef]
  39. Umair, M.; Shen, Y.J.; Qi, Y.Q.; Zhang, Y.C.; Ahmad, A.; Pei, H.W.; Liu, M.Y. Evaluation of the CropSyst model during wheat-maize rotations on the North China Plain for identifying soil evaporation losses. Front. Plant Sci. 2017, 8, 1667. [Google Scholar] [CrossRef] [Green Version]
  40. Ferguson, H.; Eslick, R.F.; Aase, J.K. Canopy temperature of barley as influenced by morphological characteristics. Agron. J. 1973, 65, 425–428. [Google Scholar] [CrossRef]
  41. Herbert, T.J. Variation in interception of the direct solar beam by top canopy layers. Ecology 1991, 72, 17–22. [Google Scholar] [CrossRef]
  42. Herbert, T.J. Random wind-induced leaf orientation-effect upon maximization of whole plant photosynthesis. Photosynthetica 1992, 26, 601–607. [Google Scholar]
  43. Prasad, P.V.V.; Pisipati, S.R.; Ristic, Z.; Bukovnik, U.; Fritz, A.K. Impact of Nighttime Temperature on Physiology and Growth of Spring Wheat. Crop Sci. 2008, 48, 2372–2380. [Google Scholar] [CrossRef]
  44. Murchie, E.H.; Chen, Y.Z.; Hubbart, S.; Peng, S.B.; Horton, P. Interactions between senescence and leaf orientation determine in situ patterns of photosynthesis and photoinhibition in field-grown rice. Plant Physiol. 1999, 119, 553–564. [Google Scholar] [CrossRef] [PubMed] [Green Version]
  45. Lopes, M.S.; Reynolds, M.P.; Jalal-Kamali, M.R.; Moussa, M.; Feltaous, Y.; Tahir, I.S.A.; Barma, N.; Vargas, M.; Mannes, Y.; Baum, M. The yield correlations of selectable physiological traits in a population of advanced spring wheat lines grown in warm and drought environments. Field Crops Res. 2012, 128, 129–136. [Google Scholar] [CrossRef]
  46. Purushothaman, R.; Thudi, M.; Krishnamurthy, L.; Upadhyaya, H.D.; Kashiwagi, J.; Gowda, C.L.L.; Varshney, R.K. Association of mid-reproductive stage canopy temperature depression with the molecular markers and grain yields of chickpea (Cicerarietinum L.) germplasm under terminal drought. Field Crops Res. 2015, 174, 1–11. [Google Scholar] [CrossRef] [Green Version]
  47. Chen, Y.; Zhang, Z.; Tao, F.L.; Palosuo, T.; Rötter, R.P. Impacts of heat stress on leaf area index and growth duration of winter wheat in the North China Plain. Field Crops Res. 2018, 222, 230–237. [Google Scholar] [CrossRef] [Green Version]
  48. de Wit, C.T. Transpiration and Crop Yields; Institute of Biological and Chemical Research on Field Crops and Herbage: Wageningen, The Netherlands, 1958; Volume 64.6, p. 24. [Google Scholar]
  49. Blum, A. Effective use of water (EUW) and not water-use efficiency (WUE) is the target of crop yield improvement under drought stress. Field Crops Res. 2009, 112, 119–123. [Google Scholar] [CrossRef]
Figure 1. Population density (shoots/m2) of the genotypes Jinmai 47 and Jing 411 under the rain-fed (RF) and supplemental irrigation (SI) conditions. For each growing season, the columns with the different letters differ significantly according to the least significant difference (LSD) test (p < 0.05). Vertical bars indicate the standard deviation.
Agronomy 13 00742 g001
Figure 2. Population-scale transpiration (PT), soil evaporation (E), evapotranspiration (ET) during the jointing to the early grain filling stages for the genotypes Jinmai 47 and Jing 411 under (A) rain-fed (RF) and (B) supplemental irrigation (SI) conditions. The PT, E and ET were measured for 25 days from 17 April to 11 May in the 2015–2016 growing season; for 25 d from 18 April to 12 May in the 2016–2017 growing season and for 22 d from 22 April to 11 May in the 2017–2018 growing season. For each water use parameter in each growing season, different letters indicate significant differences between the two genotypes at p < 0.05 based on the LSD test. Vertical bars indicate the standard deviation.
Agronomy 13 00742 g002
Figure 3. Total evapotranspiration (TET) over the whole growing season for the genotypes Jinmai 47 and Jing 411 under rain-fed (RF) and supplemental irrigation (SI) conditions. For each growing season, different letters indicate significant differences between the two genotypes at p < 0.05 based on the LSD test. Vertical bars indicate the standard deviation.
Agronomy 13 00742 g003
Figure 4. Grain yield of the genotypes Jinmai 47 and Jing 411 under rain-fed (RF) and supplemental irrigation (SI) conditions. For each growing season, different letters indicate significant differences between the two genotypes at p < 0.05 based on the LSD test. Vertical bars indicate the standard deviation.
Agronomy 13 00742 g004
Figure 5. Water use efficiency (WUE) of the genotypes Jinmai 47 and Jing 411 under rain-fed (RF) and supplemental irrigation (SI) conditions. For each growing season, different letters indicate significant differences between the two genotypes at p < 0.05 based on the LSD test. Vertical bars indicate the standard deviation.
Agronomy 13 00742 g005
Table 1. Monthly precipitation and temperature for the winter wheat growing seasons from 2015 to 2018 and the long-term average from 1990–2018.
ParameterGrowing SeasonsOct.Nov.Dec.Jan.Feb.Mar.Apr.May.Jun.Total
Rainfall (mm)2015–20168.7 42.92.31.29.205.656.946.6173.4
2016–201770.86.500.83.711.60.123.13119.6
2017–201858.800001.752.713.53.4130.1
Long-term average (1990–2018)27.212.922.34.79.720.635.928.5143.8
Mean temperature (°C)2015–201613.7 3−0.6 −4.80.68.716.421.225.2_
2016–2017134−0.4−21.78.417.223.225.6_
2017–201812.73.4−1.4−3.9−1.68.115.622.126.8_
Average of the three seasons13.1 3.5 −0.8 −3.6 0.2 8.4 16.4 22.2 25.9 _
Long-term average (1990–2018)13.14.4−1.7−3.7−0.16.814.720.924.8_
Note: the precipitation in June for the three growing seasons was the sum from 1 June to the harvest day and the precipitation in June for the long-term average (1990–2018) was the sum from 1 June to 15 June. Winter wheat was usually harvested around 15 June.
Table 2. Plant architecture attributes of the genotypes Jinmai 47 and Jing 411.
GenotypePlant TypeLeaf TypeLeaf ColorSPAD ReadingFlag Leaf Inclination
Angle (°)
Flag Leaf Area (cm2)Plant Height
(cm)
Basal Internode Diameter (mm)
Jinmai 47Loose typeFlat leafBright green48.3 ± 0.865 ± 4.619.3 ± 1.580.5 ± 3.13.2 ± 0.2
Jing 411Compact typeUpright leafDark green55.1 ± 1.035 ± 4.416.3 ± 1.369.9 ± 3.04.8 ± 0.3
Note: values after ± represent the standard deviation of the nine measurements in the three replicates under rain-fed conditions.
Table 3. Leaf net photosynthetic rate (Pn, μmol CO2·m−2·s−1), stomatal conductance (Gs, mmol·m−2·s−1) and transpiration rate (Tr, mmol·m−2·s−1) of the genotypes Jinmai 47 and Jing 411 under rain-fed (RF) and supplemental irrigation (SI) conditions in the three growing seasons.
Genotype2015–20162016–20172017–2018
PnGsTrPnGsTrPnGsTr
RF condition
Jinmai 4717.9 a0.312 a5.86 a16.9 a0.279 a5.22 a20.7 a0.422 a6.4 a
Jing 41115.2 b0.249 b4.56 b13.9 b0.264 a4.15 a16.7 b0.327 b4.34 b
P > F0.0130.02970.03250.04540.3460.43940.04630.0160.0112
SI condition
Jinmai 4724.3 a0.505 a8.24 a22.1 a0.445 a7.33 a25.4 a0.589 a8.76 a
Jing 41119.8 b0.331 b6.22 b18.6 b0.274 b5.73 b22.2 a0.466 b7.21 b
P > F0.03630.00090.00390.03060.00070.01450.14440.00610.0165
Note: under each water condition, the different letters in each column indicate the significant difference between the two genotypes at the p < 0.05 level based on the LSD test.
Table 4. Canopy temperature depression (CTD, °C) of the genotypes Jinmai 47 and Jing 411 under the rain-fed (RF) and supplemental irrigation (SI) conditions.
Genotype2015–20162016–20172017–2018
15 April26 April20 April30 April24 April9 May
RF condition
Jinmai 477.2 a5.9 a6.2 a5 a7.8 a6 a
Jing 4115.6 b4.4 b5.4 b4.7 a6.6 b4.6 b
P > F0.00230.00440.01840.36580.03510.0056
SI condition
Jinmai 478.7 a7 a6.8 a5.6 a8 a5.9 a
Jing 4117.4 b5.6 b5.7 b5 a6.8 b5.5 a
P > F0.03540.01350.03090.06020.00970.3005
Note: under each water condition, the different letters in each column indicate the significant difference between the two genotypes at the p < 0.05 level based on the LSD test.
Disclaimer/Publisher’s Note: The statements, opinions and data contained in all publications are solely those of the individual author(s) and contributor(s) and not of MDPI and/or the editor(s). MDPI and/or the editor(s) disclaim responsibility for any injury to people or property resulting from any ideas, methods, instructions or products referred to in the content.

