Article

Genome-Wide Characterization of the SAMS Gene Family in Cotton Unveils the Putative Role of GhSAMS2 in Enhancing Abiotic Stress Tolerance

1
State Key Laboratory of Cotton Biology/Institute of Cotton Research, Chinese Academy of Agricultural Science, Anyang 455000, China
2
Biological and Food Engineering, Anyang Institute of Technology, Anyang 455000, China
3
School of Life Sciences, Nantong University, Nantong 226007, China
4
School of Biological, Physical, Mathematics and Actuarial Sciences (SBPMAS), Jaramogi Oginga Odinga University of Science and Technology (JOOUST), Bondo P.O. Box 210-40601, Kenya
5
School of Agricultural Sciences, Zhengzhou University, Zhengzhou 450001, China
*
Authors to whom correspondence should be addressed.
These authors contributed equally to this work.
Agronomy 2023, 13(2), 612; https://doi.org/10.3390/agronomy13020612
Submission received: 28 April 2022 / Revised: 24 May 2022 / Accepted: 25 May 2022 / Published: 20 February 2023

Abstract

:
The most devastating abiotic factors worldwide are drought and salinity, causing severe bottlenecks in the agricultural sector. To acclimatize to these harsh ecological conditions, plants have developed complex molecular mechanisms involving diverse gene families. Among them, S-adenosyl-L-methionine synthetase (SAMS) genes initiate the physiological, morphological, and molecular changes to enable plants to adapt appropriately. We identified and characterized 16 upland cotton SAMS genes (GhSAMSs). Phylogenetic analysis classified the GhSAMSs into three major groups closely related to their homologs in soybean. Gene expression analysis under drought and salt stress conditions revealed that GhSAMS2, which has shown the highest interaction with GhCBL10 (a key salt responsive gene), was the one that was most induced. GhSAMS2 expression knockdown via virus-induced gene silencing (VGIS) enhanced transgenic plants’ susceptibility to drought and salt stress. The TRV2:GhSAMS2 plants showed defects in terms of growth and physiological performances, including antioxidative processes, chlorophyll synthesis, and membrane permeability. Our findings provide insights into SAMS genes’ structure, classification, and role in abiotic stress response in upland cotton. Moreover, they show the potential of GhSAMS2 for the targeted improvement of cotton plants’ tolerance to multiple abiotic stresses.

1. Introduction

Cotton is a valued economic crop worldwide. The long growth cycle of cotton coupled with its large genome size have rendered many available traditional methods complicated and labor-intensive in analyzing its gene function [1]. Gossypium hirsutum, commonly referred as upland cotton, is the most popular cotton germplasm due to its high yield. About 90% of all cotton cultivars being produced globally are derived from upland cotton. Due to climate change, crops are exposed to various abiotic stresses affecting plant growth, development, yield components, and productivity [2]. Among them, drought and salinity are the harshest environmental adversities, causing dramatic losses in cotton production [3]. Drought stress induces extensive crop loss, and predictions have revealed that it will intensify in the future [3]. It is estimated that no less than 6% of landmass globally is affected by salinity [4]. Sodium chloride is the primary salt responsible for soil salinity, and its continued accumulation poses a severe threat to farmers worldwide as agriculture productivity dwindles due to considerable defects in plant growth [5,6]. The presence of sodium chloride in high concentrations usually induces deficiency diseases (the unavailability of crucial nutrients for plants’ healthy growth) and disrupts cellular ionic balance [7].
Plants have developed complex and dynamic mechanisms to adapt to these stressful environments, including various morphological, physiological, and molecular changes [8]. The common strategies employed by plants to tolerate drought and salt stresses are the reinforcement and maintenance of biological membranes’ structure and properties and the escalated synthesis of antioxidant enzymes [3,9]. Many gene families, such as S-adenosyl-L-methionine synthase (SAMS), are involved in the dynamic complex regulatory networks of plants’ stress responses to modulate continued development and enhance stress tolerance [10]. The SAMS genes contain a methionine binding site and an ATP binding motif in their N-terminal and C-terminal domain, respectively [10]. They catalyze the combination of methionine and ATP to produce SAM (S-Adenosyl-L-methionine), a critical molecule involved in essential biological processes in eukaryotic cells [11]. SAM provides methyl groups for DNA, RNA, lipids, and proteins methylation and participates in transsulfuration reactions and the biosynthesis of polyamine, nicotianamine, and lignin [11,12,13,14]. Moreover, SAM is the precursor for synthesizing ethylene and polyamines (PAs), which are essential for plant growth, development, and responses to environmental stresses [15,16,17,18].
Regarding the importance of SAMS, studies have focused on SAMS’ function in regulating plants’ stress response. The overexpression of the potato SbSAMS improved drought and salt stress tolerance in transgenic Arabidopsis plants [2]. In rice, the knockdown of OsSAMS1, 2, and 3 altered the histones and DNA methylation, leading to late flowering [19]. The overexpression of the Sugar Beet M14 SAMS2 in transgenic Arabidopsis enhanced its tolerance to oxidative stress and salt [14]. The targeted reduction of PAs biosynthesis induced a decrease in pollen viability and plant length and promoted sensitivity to abiotic stress in rice [20]. The overexpression of Medicago sativa subsp. falcata SAMS1 induced oxidation and polyamine synthesis in transgenic tobacco plants, improving their tolerance to chilling and freezing stress [21]. The overexpression of the cucumber CsSAMS1 and its interacting protein CsCDPK6 promoted ethylene and PAs biosynthesis, leading to the enhancement of salt stress tolerance in transgenic tobacco [22]. The SAMS gene family has been well studied in diverse monocotyledonous and dicotyledonous plants such as rice, sugar beet M14, Arabidopsis, barley, tomato, soybean, sunflower, sorghum, Medicago truncatula, eggplant, Triticum urartu [11], and Chorispora bungeana [23]. However, in upland cotton, no study has focused on SAMS genes and their potential to enhance stress tolerance.
Moreover, it was recently found that GhCBL10 plays a central role in upland cotton’s tolerance to salt stress [24]. Therefore, it is of particular interest to identify the GhSAMS with strong co-expression interaction with GhCBL10 for the targeted improvement of cotton plants’ tolerance to multiple abiotic stresses.
In the present study, SAMS genes were identified in upland cotton, and their structure, chromosomal distribution, subcellular localization, phylogeny, cis-acting elements, and conserved motifs were revealed through comprehensive bioinformatic analyses. We performed yeast two-hybrid experiments and detected the GhSAMS that exhibited the strongest co-expression relationship with GhCBL10. Furthermore, we explored the expression patterns of GhSAMS genes in response to salt and drought treatments, and the most promising GhSAMS for enhancing plant tolerance to multiple abiotic stresses was identified and functionally validated via transgenic experiments. Our data represent important resources for deciphering GhSAMSs in plant functions and insights into the complex molecular regulatory networks of abiotic stress response in cotton.

2. Materials and Methods

2.1. Protein Identification and Physiochemical Analysis of SAMS Genes in Gossypium hirsutum

SAMS proteins were retrieved from three Pfam domain accessions in the NAU assembly: PF00438 (1), PF02772 (2), and PF02773 (3). The three accession domains carry 16, 17, and 16 genes, respectively, though the gene names are similar. Pfam Scan was specifically used to query the genes (https://www.ebi.ac.uk/Tools/pfa/pfamscan/; accessed on 5 May 2020), and SMART search provided the identity of SAMS genes present in Gossypium hirsutum (http://smart.emblheidelberg.de/smart/; accessed on 20 May 2020). GhSAMS genes’ identity was further confirmed via the official website of the Cotton genomic database (https://cottonfgd.org/; accessed on 29 May 2020), using PF02772. The physical and chemical properties of GhSAMS proteins (excluding the scaffolded gene), including the instability index, protein length, isoelectric point (pI), grand average of hydropathy (GRAVY), and molecular weight (MW), were predicted by ExPASy ProtParam software [25].

2.2. Chromosomal Location, Phylogenetic Analysis, Prediction of Subcellular Localization, Gene Structure, Cis-Acting Elements, and Conserved Motifs Analyses

For gene location visualization on the respective chromosomes, the retrieved gene ID information in gtf3 file format of all the GhSAMSs was used in Tbtools software to map the genes onto the chromosomes. The coding sequence of GhSAMS members was downloaded from the official website of Phytozome (https://Phytozome.jgi.doe.gov; accessed on 9 June 2020). Homolog genes from closely related plant species (Table S1) were also downloaded from the Phytozome website and later used to perform the phylogenetic analysis via the neighbor-joining method in the MEGA 7.0 program, with the specification of 1000 bootstrap replicates [26]. ClustalX software was used to align all the protein sequences before generating a phylogenetic tree diagram for evolutionary relationships analysis [27]. The Poisson correction was applied to estimate the distance between sequences. WoLF Psort online software was used to predict GhSAMS genes’ subcellular localization (https://wolfpsort.hgc.jp; accessed on 15 June 2020) [28].
GhSAMS genes’ structure analysis was conducted via the Gene Structure Display Server website (http://gsds.cbi.pku.edu.cn; accessed on 19 June 2020) [29]. In-depth prediction of the cis-regulatory DNA elements in the GhSAMS promoter region (2000 bp upstream nucleotide sequence) was achieved by the online PlantCARE server software (Bristol, England) [30]. MEME server (https://meme-suite.org, version 5.4.1; accessed on 13 Jully 2020), with the default setting, was used to predict conserved motifs within the gene structures ().

2.3. Plant Materials and Treatments

Marie Galante-85 and CRI-12 semi-wild accessions of G. hirsutum were used, as they are tolerant to drought and salt stresses. Seeds of the two accessions were provided by the Institute of Cotton Research, Chinese Academy of Agricultural Sciences, where the entire experiment was performed with a Complete Random design. In the preliminary steps, the cotton seeds were soaked in dd H2O overnight to allow the seed coat to soften. The soaked seeds were then grown in folded absorbent papers vertically placed in mini rectangular plastic buckets, which had been filled with distilled water halfway and left for a period of four days [31]. Upon germination (the sixth day), the healthy seedlings were transplanted to a Hoagland nutrient solution medium in the greenhouse. In the greenhouse, transplanted seedlings were treated by a 16 h light-8 h dark photoperiod with specified temperatures of 28 °C during the day and 25 °C at night. The relative humidity in the experimental room was maintained at 60–70%, as previously described [32]. The entire Hoagland nutrient solution medium was replenished when the seedlings reached the three-true-leaf stage, and freshly prepared solutions of 17% of glycol PEG-6000 and 250 mM of sodium chloride compounds were immediately added to simulate drought and salt stresses, respectively [33]. The healthy tissues of the root and leaf were collected from nine plants of each category for RNA extractions after stress exposure at the following time intervals: 0 h, 3 h, 6 h, 9 h, 12 h, and 24 h. Three biological replications were considered in each case. Untreated plants were considered as the control. The harvested tissues were directly frozen in liquid nitrogen and transferred to the fridge at −80 °C for storage up to the total RNA extraction.

2.4. RNA Extraction and RT-qPCR Assays

The total RNA was extracted using the RNAprep Pure Plant kit (Tiangen, Beijing, China), and its quality and concentration were determined using a NanoDrop 2000 spectrophotometer. cDNA synthesis was conducted by treating 1 g of total RNA using RNase-free DNase I and a reverse transcriptase, strictly following the guidelines given by the manufacturer (Thermo Fisher Scientific, Shanghai, China). We investigated the expression patterns of GhSAMSs under drought and salt stress at different time intervals, using previously released RNA-Seq data (https://cottonfgd.org/analyze/ accessed on 5 May 2020). According to the genes’ expression patterns, we selected 14 genes, including 5 genes that were induced under salt and drought stress, 5 genes that were downregulated under the stress conditions, and 4 genes that showed similar expression under normal and stress conditions for the RT-qPCR analysis. Using the Premier Premier5 software, the primers of all the selected genes were designed for the RT-qPCR assays (Table S2). GhActin was chosen to serve as a standard reference gene. The SYBR Green Real-Time PCR Master Mix (Thermo Scientific, Rockford, IL, USA) was used to perform qPCR assays following the procedure described previously [34]. The reactions comprised the following reagents: cDNA template (5 μL), forward primer (0.5 μL), reverse primer (0.5 μL), SYBR green master mix (10 μL), and dd H2O (4 μL). The final mixture, whose concentration was at 10 mM, was centrifuged at 12,000 rpm for 1 min and placed into PCR thermal cycling conditions, as previously described [35]. The PCR procedure was performed according to the manufacturer’s instructions. Pre-incubation, 1 cycle: 95 °C for 30 s; Amplification, 40 cycles: 95 °C for 10 s, 60 °C for 30 s; Melting curve, 1 cycle: 95 °C for 15 s, 60 °C for 60 s, 95 °C for 15 s; Cooling, one cycle: 40 °C for 30 s. The real-time analysis of each gene was performed with three independent biological replicates under the same conditions. The expression levels of the genes were analyzed using the 2−ΔΔCT method [36].

2.5. Identification of Pray Proteins

First, the CBL10 gene-specific protein sequence for the Arabidopsis plant was obtained from the official website of the Arabidopsis Information Resource database (ftp://ftp.arabidopsis.org; accessed on 21 February 2021). Then, the isolated protein sequence was used in a BLASTp analysis as a query against the proteomes of upland cotton, and the NAU assembly was used to identify the CBL10 homolog. The identified cotton CBL10 gene (Gh_D05G0440.1) was later used in the Y2H system experiment to screen for its interacting proteins from the AD library.

2.6. Construction of Yeast Two-Hybrid Library, Bait Cloning, and Auto Activation Analysis

The Yeast Two-Hybrid (Y2H) fusion library of Gossypium hirsutum Marie-Galante leaves, stems, and roots under drought and salt conditions (pGADT7-library) was prepared by Oebiotech (Shanghai, China). The BD-GhCBL10 bait plasmid was constructed as previously described [37]. In summary, the full length of the GhCBL10 CDS was amplified by PCR, using the primers F-TGCATATGGCCATGGAGGCCGAATTC and R-TGCGGCCGCTGCAGGTCGAC GGATCC, and cloned at the pGBKT7 vector sites NCO1 and BamH1. It was crucial to confirm the transcriptional activation of the bait in the Y2HGold competent cell in the absence of a prey protein. We independently transformed the plasmids of bait, the negative control, and the positive control into Y2H Gold competent cells. The constructs were grown on different growth media, as described by Chen et al. [37], for three days. Table 1 presents the annotation of the negative and positive controls and the empty vector.

2.7. cDNA Libraries Screening and Yeast Two-Hybrid Interaction Assay

Yeast two-hybrid screening was conducted following the Oebiotech (Shanghai) mating protocol, as previously described. Briefly, we mated the bait strain (Y2HGold (pGBKT7- GhCBL10)) and the pGADT7-library plasmid, plated on the SD/–Ade/–His/–Leu/– Trp/X- α-gal/AbA (QDO/X/A) and SD/–Leu/–Trp/–His/X- α-gal/AbA (TDO/X/A) plates, and incubated the plates at 30 °C for five days [38]. We conducted colony PCR and sequencing using the T7 primer to determine the positive interaction and the duplicates. After sequencing, we used the BLASTn of the CottonFGD database to analyze the nucleotide sequence. We then co-transformed the potential positive prey identified with the pGBKT7-GhCBL10 bait into Y2HGold competent cells. The CDS of CBL10 was cloned into the DNA-binding domain (BD) vector pGBKT7, while the CDSs of PRA1 B1, DSP8, and SAMS2 were cloned into the activation domain (AD) vector pGADT7, respectively, using the primers presented in Table S3. The generated transformants were grown on TDO/X/A and QDO/X/A plates and incubated at 30 °C until colonies appeared. PGBKT7-Lam and pGBKT7 (empty vector) denoted the negative control, while pGBKT7-53 denoted the positive control [38,39].

2.8. Virus-Induced Gene Silencing of GhSAMS2 in G. hirsutum and Stress Treatments

Tobacco rattle virus (pTRV) was used to elucidate GhSAMS2 (Gh_A08G1067) gene function with the RNAi technique [40]. VIGS TRV2:PDS, TRV2:00, TRV2:GhSAMS2, and WT plants were investigated under both drought and salt stress conditions. The CDS fragment of GhSAMS2 was 1182 bp in length. The GhSAMS2 cDNA was amplified using the specific primers F-TGCATATGGCCATGGAGGCCGAATTC and R-TGCGGCCGCTGCAGGTCGACGGATCC. Next, the PCR products were cloned into the Xba1 and Xho1 sites of the pTRV to generate pTRV:GhSAMS2 [41]. Subsequently, recombinant DNA transformation into the LBA4404 bacteria strain (Agrobacterium tumefaciens) was conducted as previously described [42]. The LBA4404 strain containing the pTRV2-PDS, pTRV1, pTRV2-Gh_A08G1067, and pTRV2 vectors was cultured in a shaking incubator at 28 °C in the Luria-Bertani (LB) liquid medium, with freshly prepared 10 mM 2-(N-morpholino)- ethane sulfonic acid (MES) added in. Kanamycin and rifampicin antibiotics were first added to the LB medium. Then, the cultures were put in the shaking incubator overnight, as previously prescribed [43]. This was followed by the centrifugation of the cultures for 10 min at 8000 rpm after the OD had been determined at 1.5, and the cells then were re-suspended into the infiltration buffer containing 200 μM of acetosyringone (As), 10 mM of magnesium chloride, and 10 mM of MES to a final OD600 = 1.5. To obtain the final infiltration medium, the pTRV1 re-suspension was mixed with pTRV2-PDS, pTRV2-GhSAMS2, and pTRV2, separately, at a ratio of 1:1 before the seedlings were infiltrated by the infusion, as previously described [44]. The functional analysis experiment via VIGS involved the inoculation of 60 plants with the TRV:GhSAMS2 and TRV: PDS inoculum, respectively. The empty vector (TRV2:00) was inoculated into 60 other plants to represent the wild type. Then, 60 other plants were left to grow without any inoculum, serving as the control in this experiment. When the plants reached the three-leaf-stage, the Hoagland nutrient solution medium into which they had been transplanted was treated with freshly prepared solutions of 17% of glycol PEG-6000 and 250 mM of sodium chloride compounds to simulate drought and salt stress, respectively [45]. The duration of each stress was 48 h. After the stress exposure, the healthy tissues of the stem, root, and leaf were collected from ten plants of each category in triplicate for RNA extraction and physiological and biochemical analyses.

2.9. Measurement of the Physiological and Morphological Parameters

The morphological and physiological parameters were equally determined to help assess the extent of susceptibility between the silenced and non-silenced plants under drought and salt stress conditions. Plant height (PH), root length (RL), shoot fresh weight (SFW), root fresh weight (RFW), relative leaf water content (RLWC), cell membrane stability (CMS), chlorophyll content (SPAD/Chlo), and excised leaf water loss (ELWL) were measured. The relative leaf water loss, cell membrane stability through ion leakage, and chlorophyll content were determined, as described previously [46]. Excised leaf water loss was determined by first weighing the collected fresh leaf samples immediately after harvesting to note the initial leaf weight in grams. After the leaf sample had lasted for 24 h on the bench at room temperature, the second weight measurement was taken and recorded as wilted weight (WW). Finally, the third measurement was taken and recorded as dry weight (DW) after the leaf sample had stayed inside an oven (50 °C) for four days. To calculate the ELWL, the formula below was applied.
ELWL = FW WW DW
Regarding the relative leaf water content and fresh weight (FW), the leaf samples were placed into dd H2O at room temperature for 24 h using tissue paper; they were then dried on both surfaces before being weighed again to obtain the saturated weight (SW). Finally, the dry weight (DW) was measured and recorded after the leaf samples had stayed inside an oven at 50 °C for four days. The formula applied in the calculation of RLWC was:
RLWC = FW DW SW DW × 100
Ion leakage in the plant tissues, which is also referred to as cell membrane stability (CMS), was assessed using the fresh leaf tissues. First, the plant electrolyte was quantified in the process of determining cell membrane stability, as previously described [47]. Then, plastic cylindrical tubes filled with 5 mL of dd H2O and kept in the dark for 24 h were used to harbor leaf samples weighing 0.5 g each. Two electrical conductivities were measured per sample, the first one being measured after the 24 h dark period stage (T1), while the second one was conducted after the leaves had been boiled in a water bath at 99 °C for 30 min and cooled to room temperature (T2). The CMS was calculated using the following formula [48]:
CMS = 1 TI T 2 / 1 C 1 C 2 × 100
where C is the electrical conductivity of dd H2O.

2.10. Estimation of Oxidant and Antioxidant Enzyme Activities

The plant tissue samples were collected in three replicates, wrapped in aluminum foil, and kept at −80 °C until the biochemical analyses. Two oxidant (hydrogen peroxide, H2O2 and malondialdehyde, MDA) and two antioxidant (catalase, CAT, and peroxidase, POD) enzyme activities were evaluated. According to the manufacturer’s protocols, the extraction and spectrometric analysis of H2O2 and the antioxidant enzymes were achieved using their respective assay kits supplied by Beijing Solarbio Science and Technology, China [46]. As for the malondialdehyde (MDA), which is a byproduct of liquid metabolism, its cellular concentration was measured following the method described previously [49]. The physiological parameters that were measured are very significant for water stress tolerance in plants, and they have been used extensively in evaluating various field crops [50].

2.11. Statistical Analysis

All the samples used in these experiments were in three bio-replicates. Data analysis and visualization were conducted with the aid of GraphPad Prism 8.4.3 (GraphPad Software Inc., La Jolla, CA, USA). The analysis of variance (ANOVA) determined the mean difference of the samples statistically. The significant difference was set at p < 0.05.

3. Results

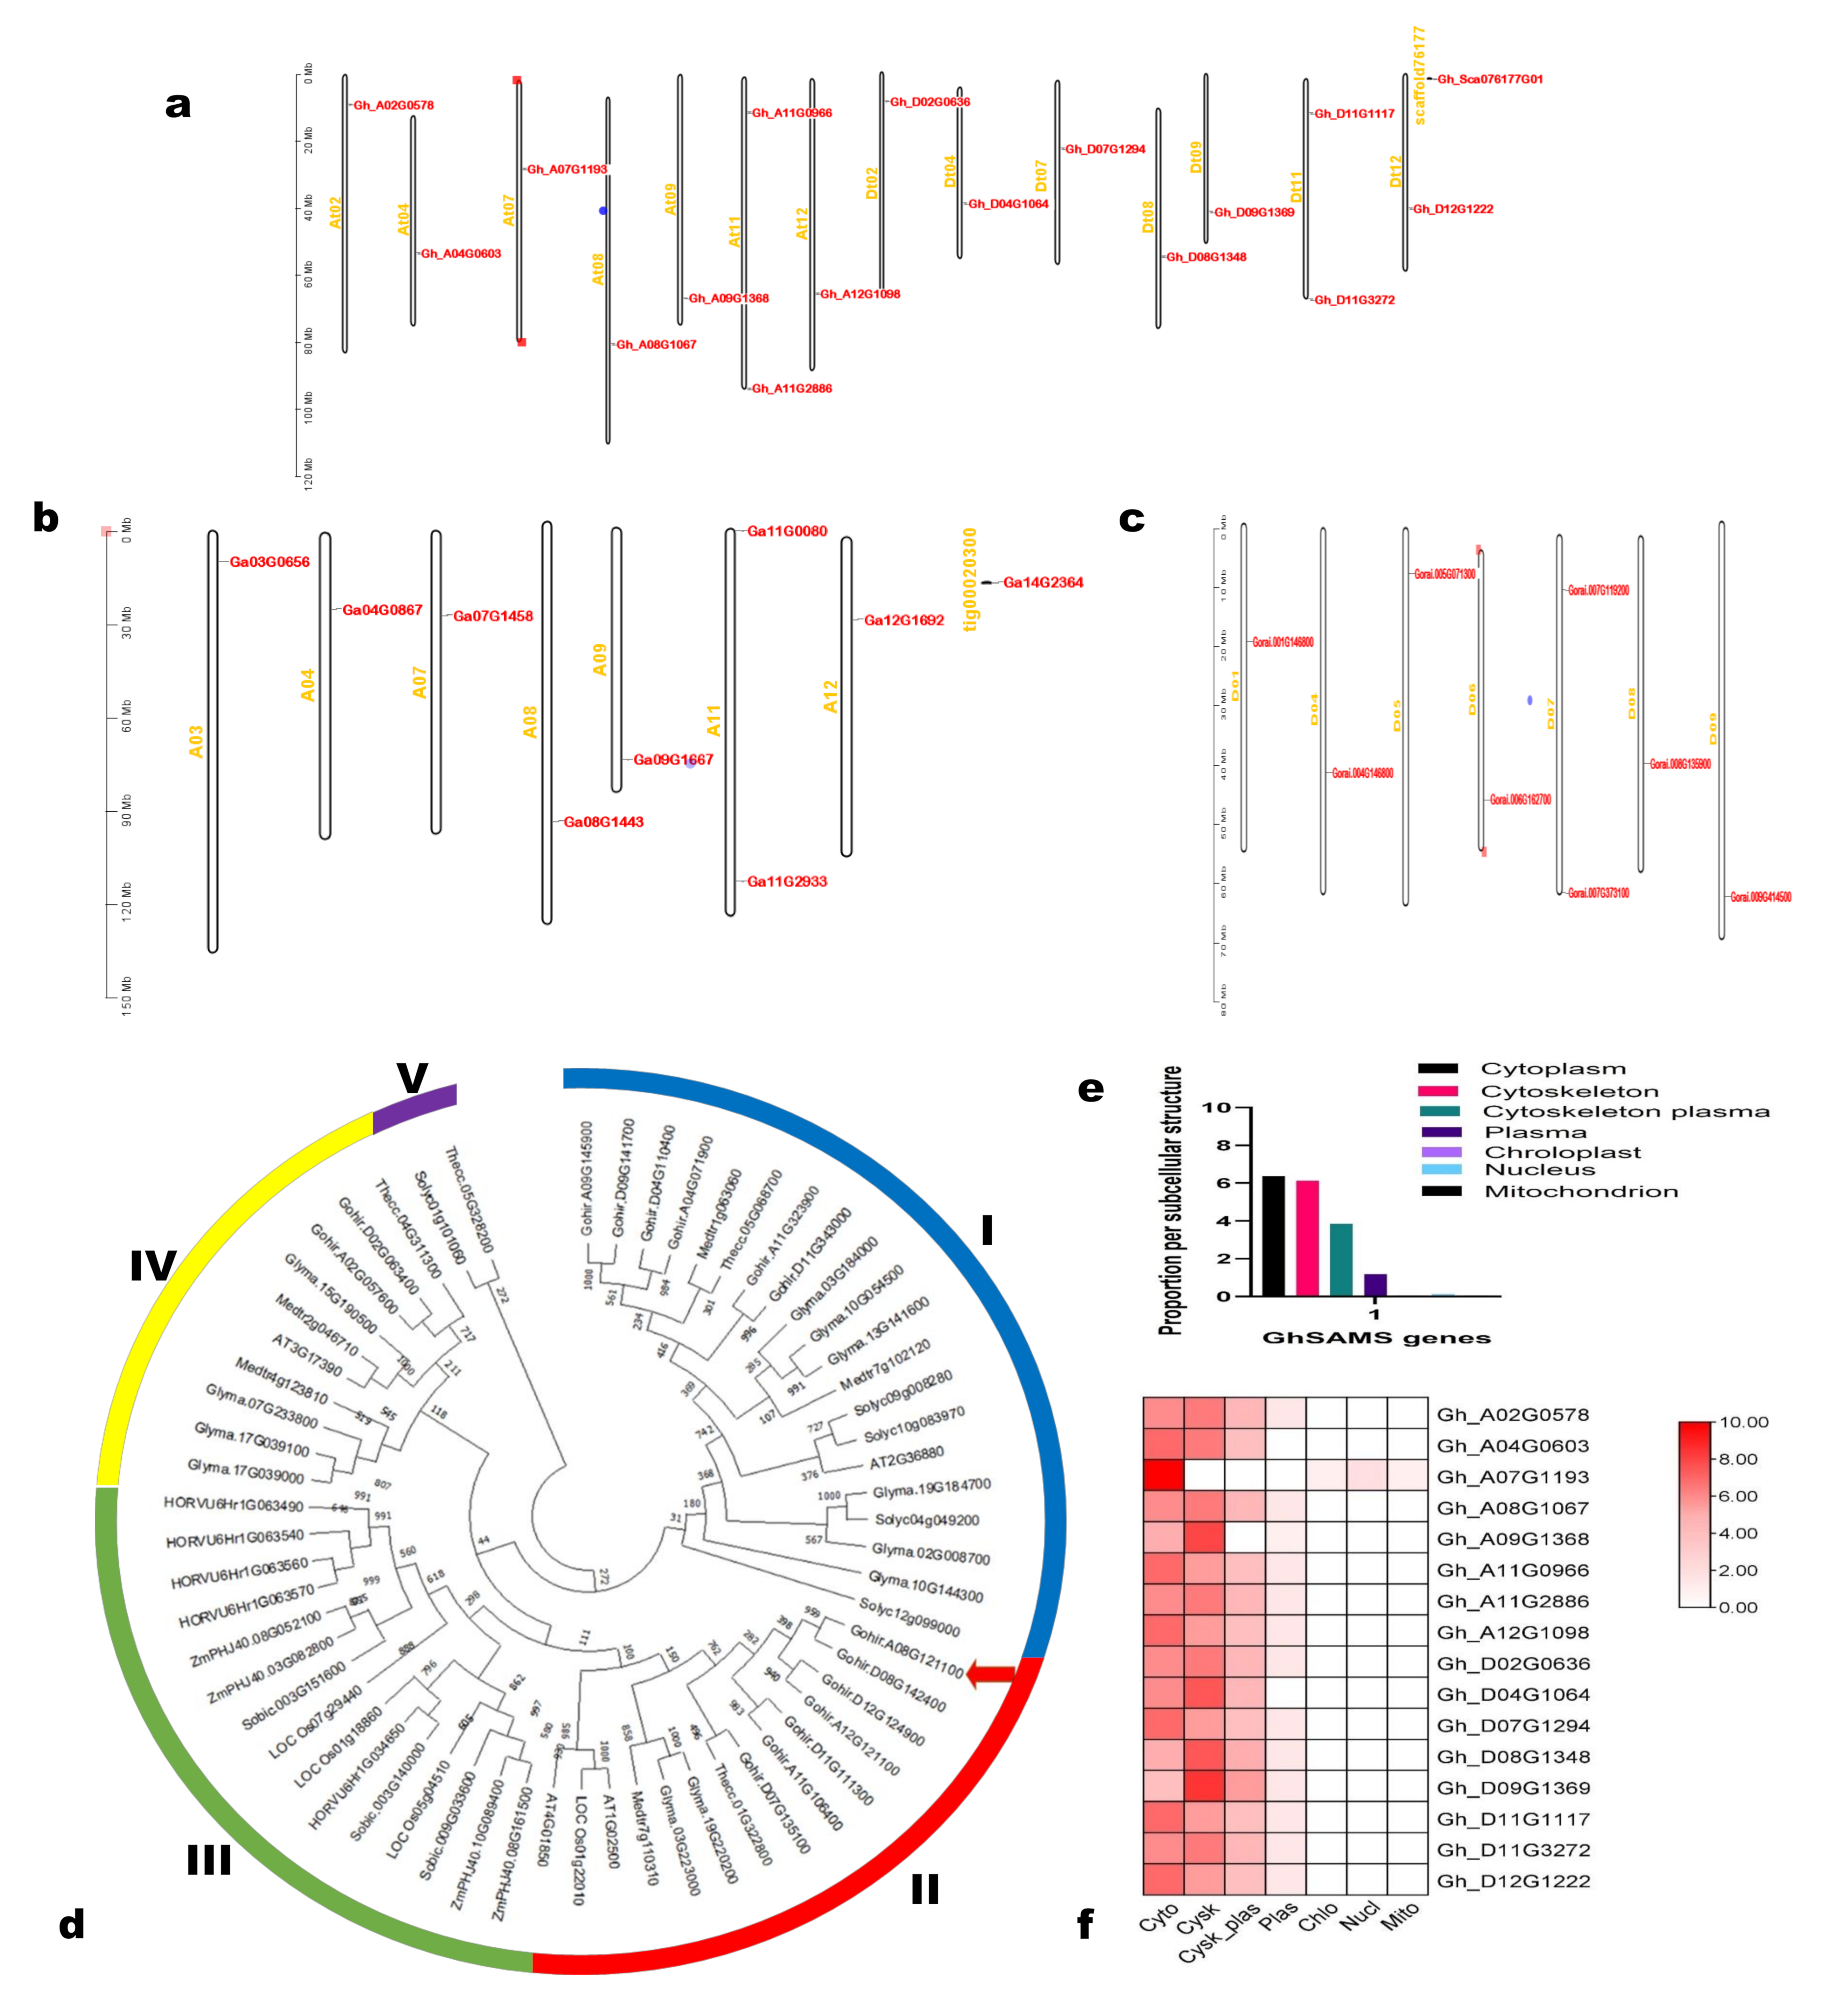
3.1. Identification, Physiochemical Properties, Chromosomal Distribution, Phylogenetic Analysis, and Subcellular Localization

In total, seventeen (17) SAMS genes were identified in the Gossypium hirsutum species using the NAU assembly. They are distributed on all of the fourteen (14) chromosomes of the G. hirsutum genome, with the chromosomes At11 and Dt11 harboring, respectively, two GhSAMSs (Figure 1a). One of them is located on a scaffold. We also investigated the chromosomal distribution of GhSAMSs in the genomes of G. arboretum (A genome) and G. raimondii (D genome). We found that the GhSAMS genes are located on chromosomes At02, At04, At07, At08, At09, At11, and At12 of the A genome and on chromosomes Dt02, Dt04, Dt07, Dt08, Dt09, Dt11, and Dt12 of the D genome (Figure 1b,c).
The physicochemical properties of the GhSAMS genes are presented in Table 2. Their protein sequence length ranged from 256 (Gh_A07G1193) to 393 aa (Gh_A08G1067), with a molecular weight (MW) varying from 28.12 to 42.61 kDa. Both the proteins were stable and exhibited negative GRAVY values. The isoelectric points (PI) of the protein ranged from 5.579 to 8.974 (Table 2).
The phylogenetic analysis of GhSAMS proteins and SAMS proteins from other related species was performed to examine their relationships (Figure 1d). The results indicated that SAMS proteins could be classified into five major groups (I–V). The Group III genes were all from monocotyledonous plant species, while the genes from the dicotyledonous plant species were scattered across all four groups. GhSAMS genes were classified into groups I, II, and IV, where they showed a high degree of similarity with the SAMS genes from soybean, T. cacao, and M. truncatula (Figure 1d). The subcellular localization analysis showed that SAMS proteins are located mainly in the cytoplasm and cytoskeleton of G. hirsutum cells (Table 2; Figure 1e,f).

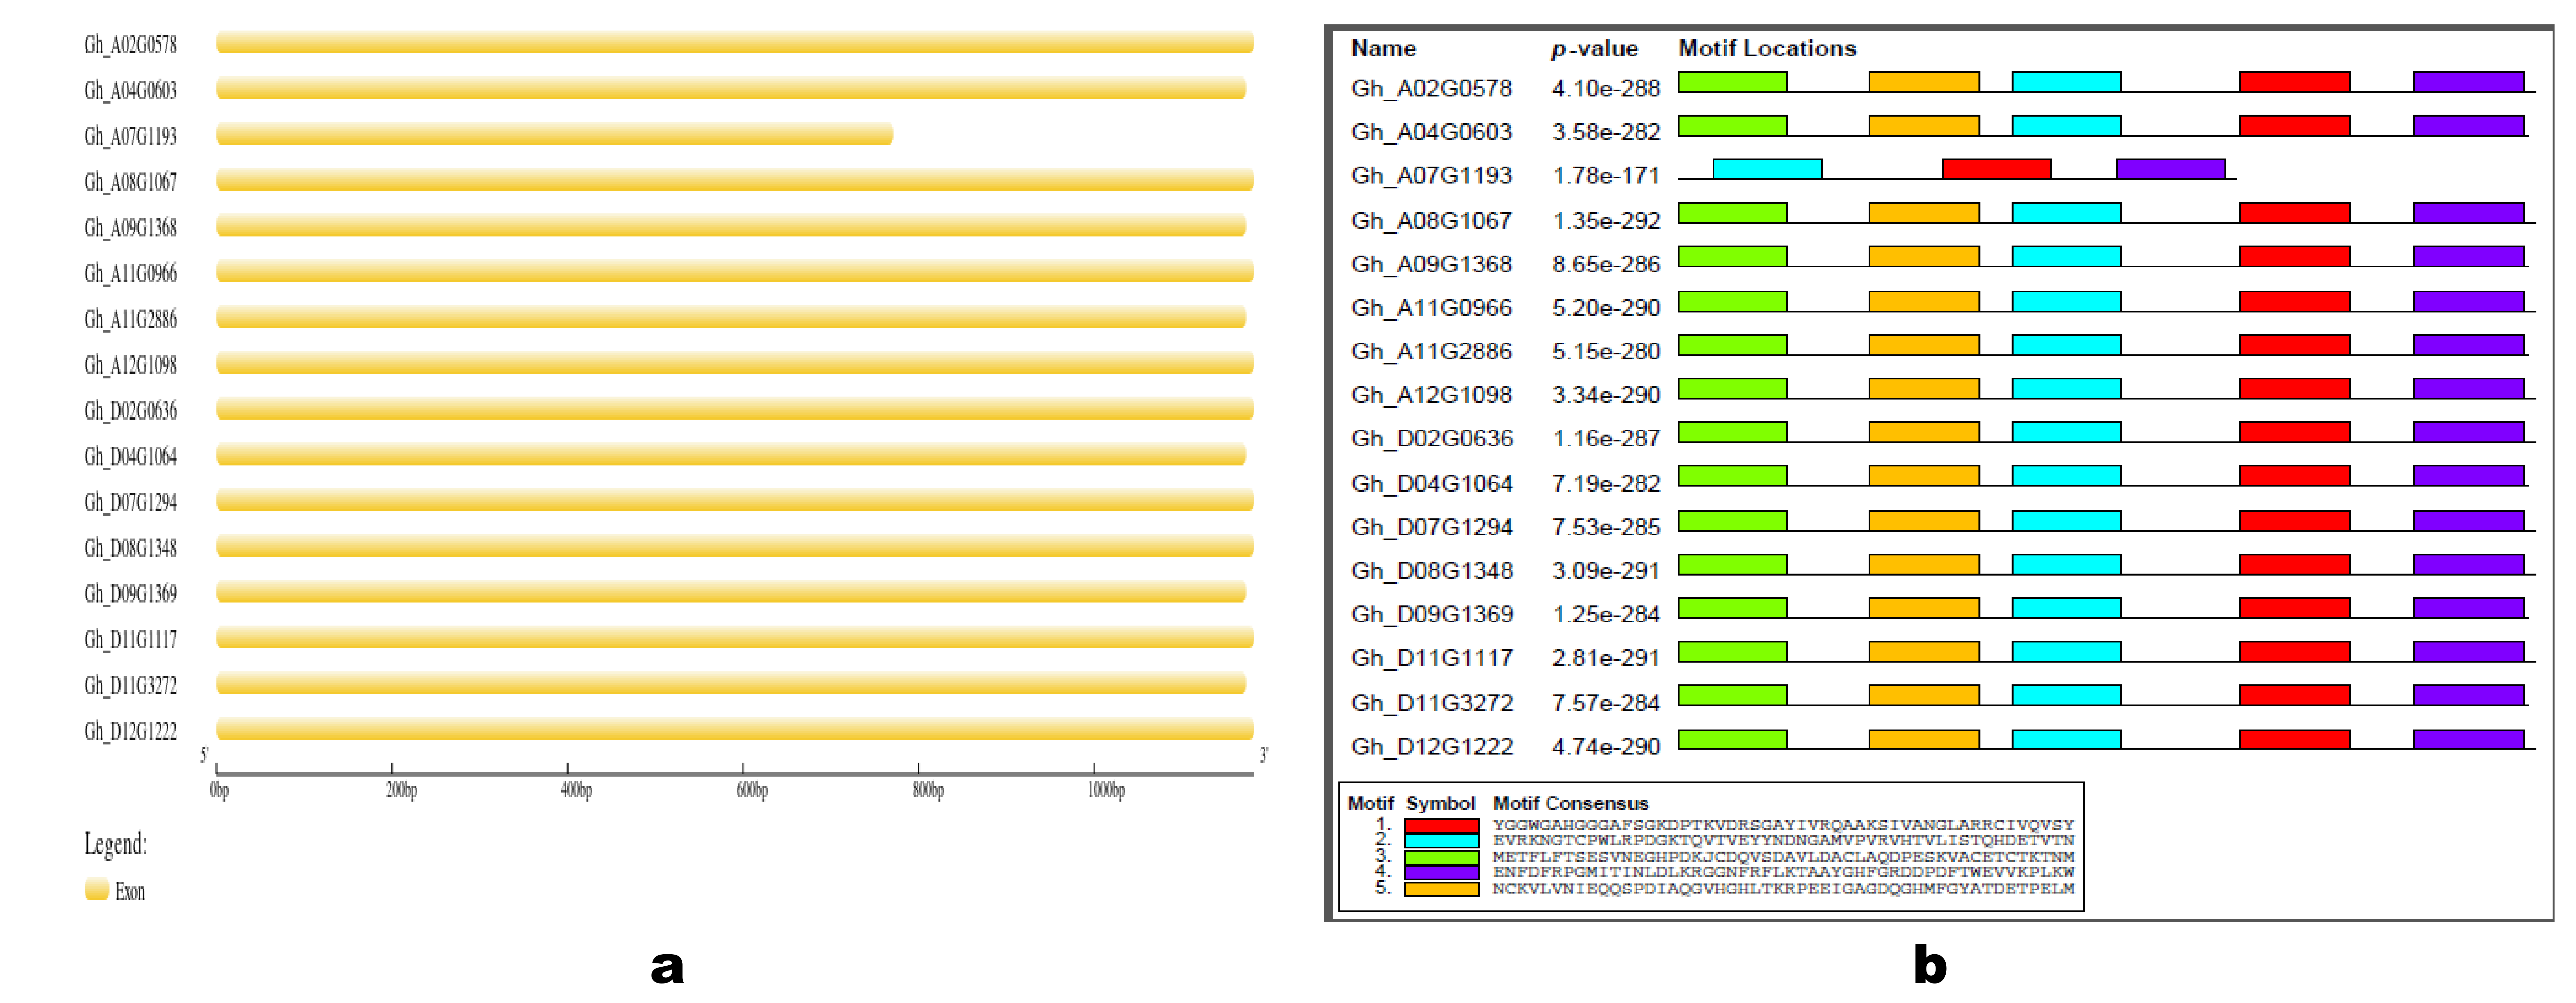
3.2. Gene Structure, Conserved Motifs, and Cis-Acting Elements Analyses

The gene structure analysis revealed that all of the sixteen GhSAMS genes are intronless and contain only one exon (Figure 2a). In total, we identified five (5) conserved motifs in the sequence of the GhSAMS genes. Both GhSAMS genes contained the five motifs, except for Gh_A07G1193, which lacked motifs 3 and 5 (Figure 2b). Furthermore, the cis-acting regulatory elements analysis in the promoter region of the GhSAMS genes indicated that they might be primarily involved in the plant defense and stress responsiveness within the plant cells, considering the phytohormonal signals (Table S4).

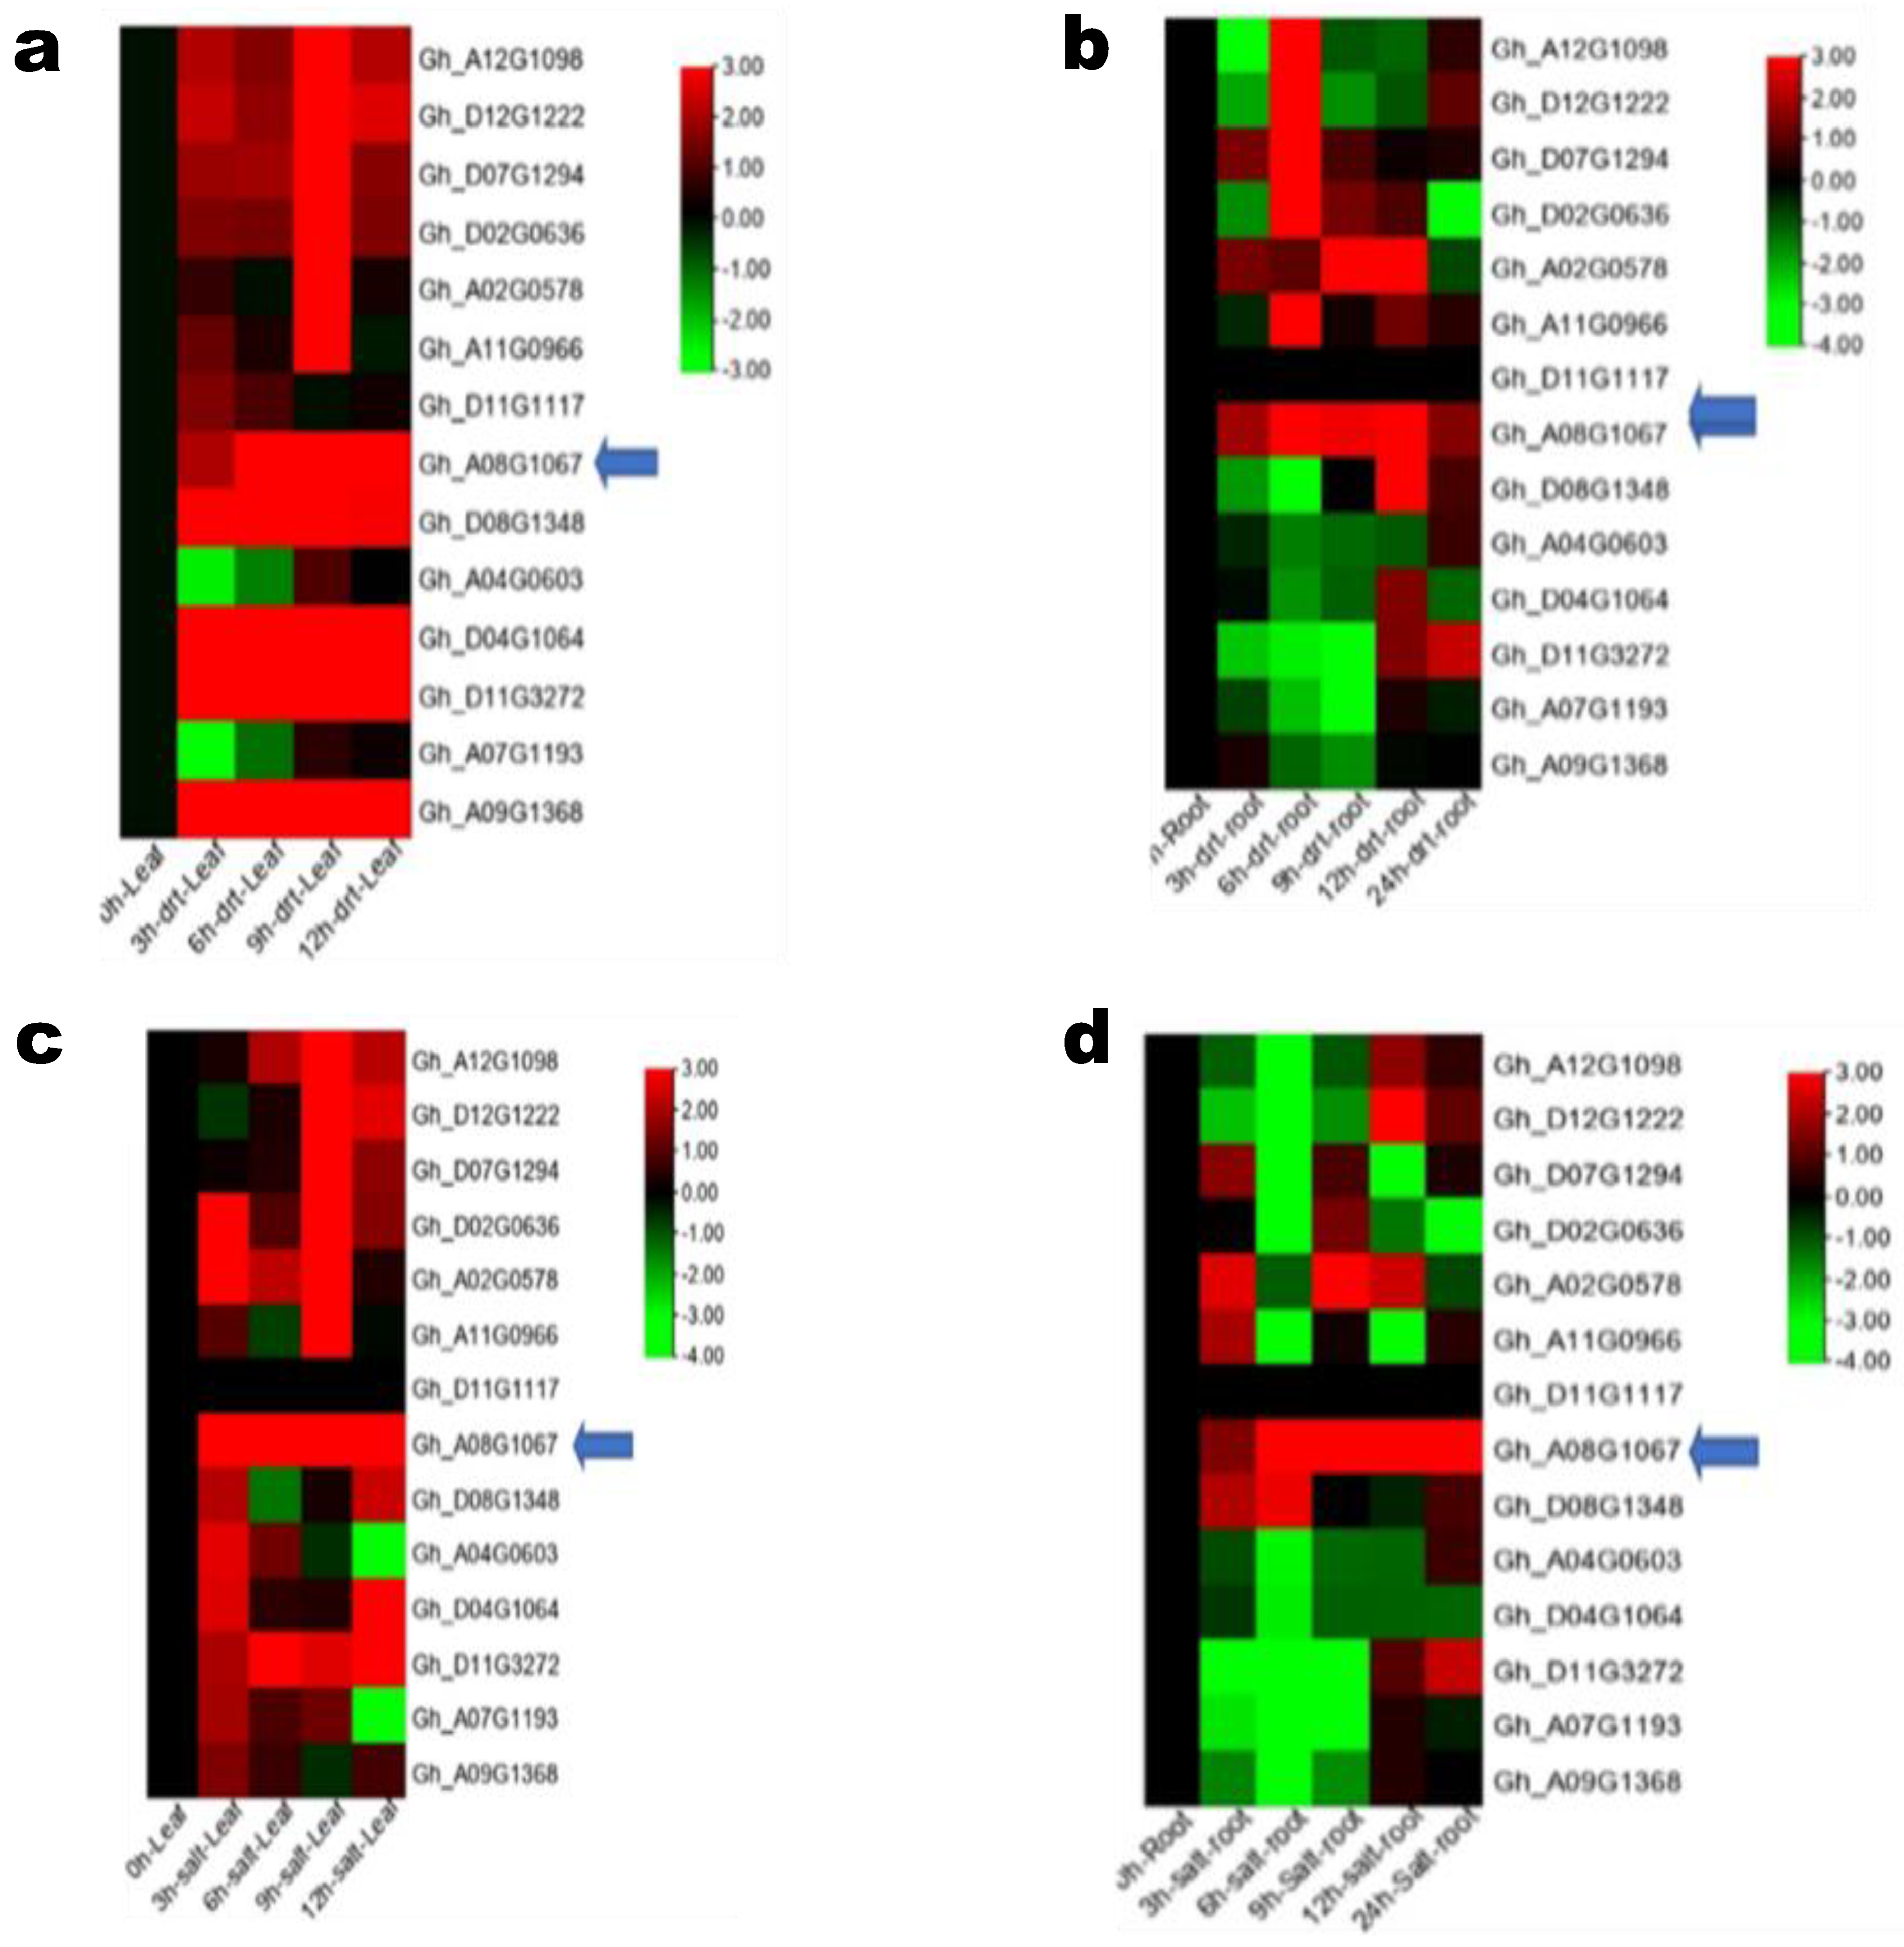
3.3. GhSAMS Genes Expression under Drought and Salt Stress

Since the cis-acting elements analysis predicted that GhSAMS genes’ function might be closely related to stress response, we examined their expression patterns under drought and salt stress in leaves and roots via RT-qPCR and using available RNA-Seq data (Figure 3 and Figure S1). The GhSAMS genes’ expression patterns showed significant variations, as some were down-regulated while others were highly up-regulated within the leaves and roots under the stress conditions. The RT-qPCR results were significantly correlated with the RNA-Seq in the leaf and root tissues. In general, most of the analyzed genes exhibited higher expression in the leaves (Figure 3a,c) than in the roots (Figure 3b,d). The expression of Gh_A08G1067, Gh_A09G1368, Gh_A12G1098, Gh_D02G0636, Gh_D07G1294, Gh_D08G1348, Gh_D11G1117, and Gh_D12G1222 was significantly induced by both the drought and salt stress in the leaves. It is worth noting that Gh_A08G1067 (GhSAMS2) expression was significantly up-regulated under the drought and salt stress in both the tissues (Figure 3), indicating that it might be critical for upland cotton’s tolerance to abiotic stresses.

3.4. Identification of CBL10 Interacting Proteins from the Cotton AD Library under Drought and Salt Stress Using the Y2H System

To confirm the potential role of GhSAMS2 in abiotic stress tolerance in upland cotton, we searched for prey proteins interacting with GhCBL10, the salt responsive gene, using the Yeast two-hybrid (Y2H) system. The summary of the experiments, including the self-auto-activation state, the toxicity test, the verification of the interactions, and the mating efficiency determination of the GhCBL10 bait gene in the Y2H system, is shown in Figure S2. The zygotes that resembled a cloverleaf with a three-lobed structure (Figure S2e) confirmed the successful mating between GhCL10 and the prey proteins contained in the cotton AD library. The GhCBL10 bait protein did not auto-activate the reporter genes in the Y2HGold cells in the absence of a prey protein, confirming the suitability of the results. We identified 23 prey proteins that showed interaction with GhCBL10 (Table 3). Of them, only four proteins, PRA1 B1, DSP8, CAB-151, and SAMS2, could activate the expression of the reporter genes in diploid yeast cells. The SAMS2 gene showed the highest interaction frequency with the CBL10 bait protein, supporting its importance for upland cotton’s tolerance to abiotic stress.

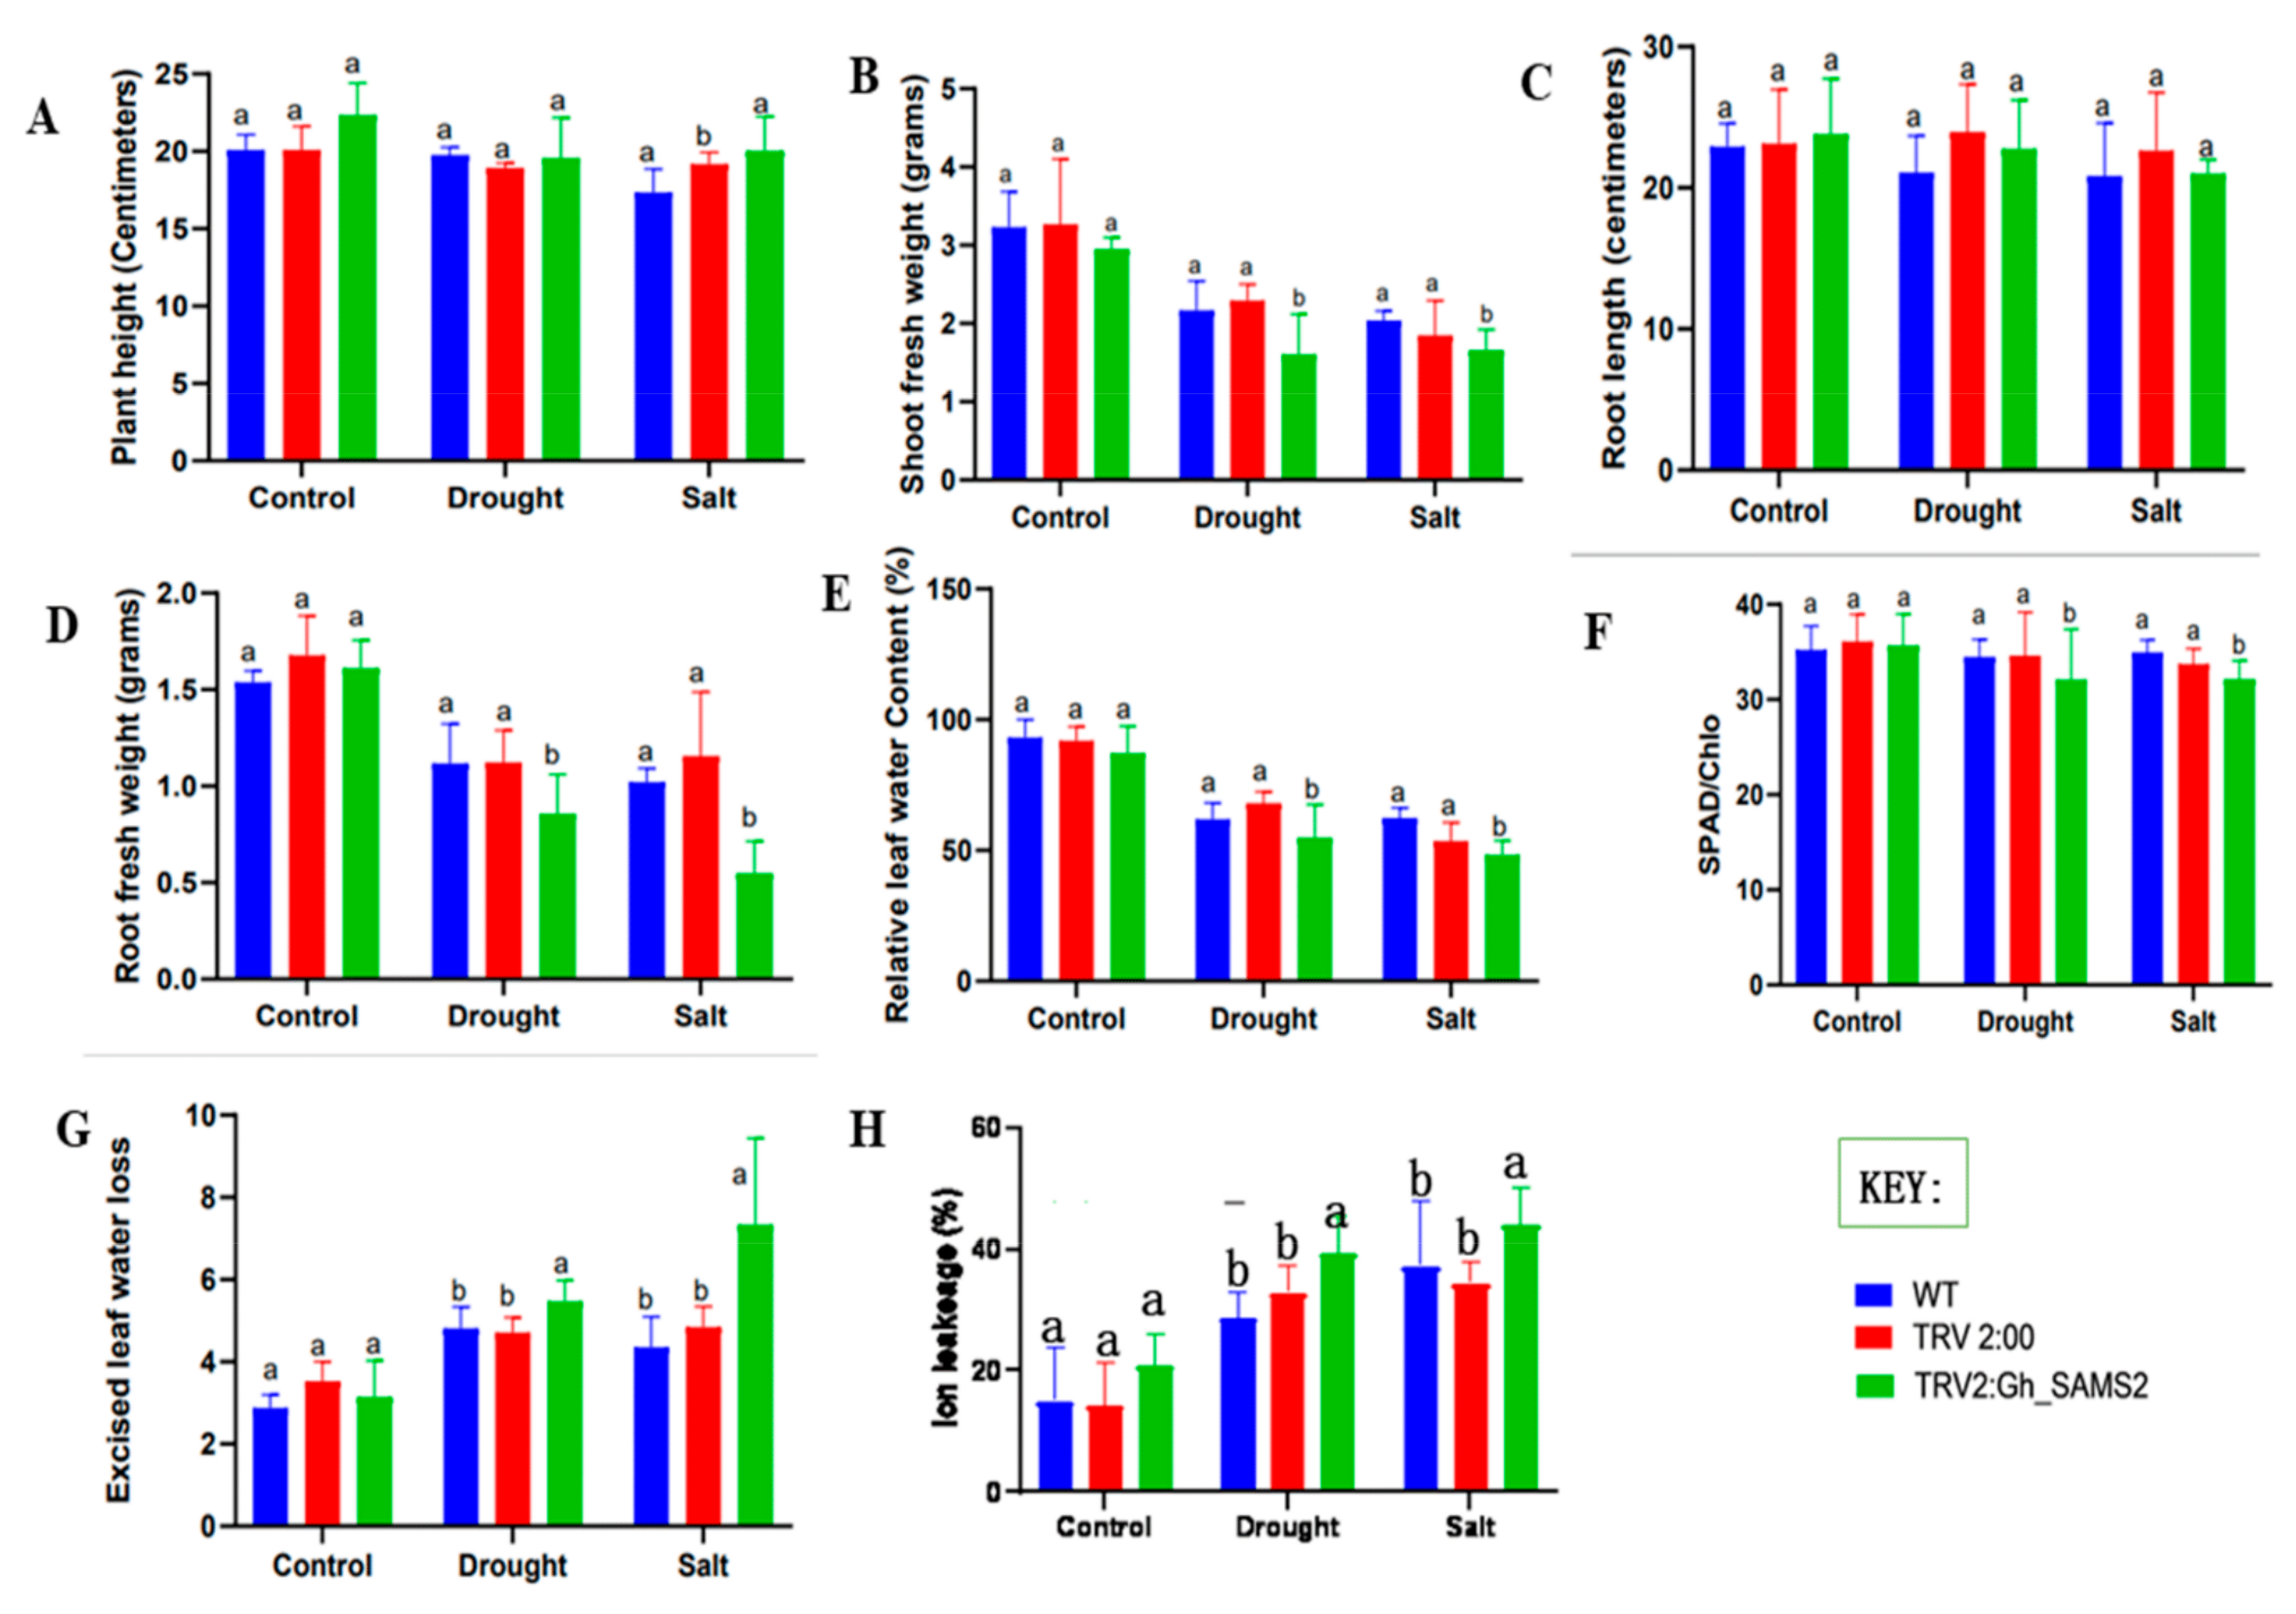
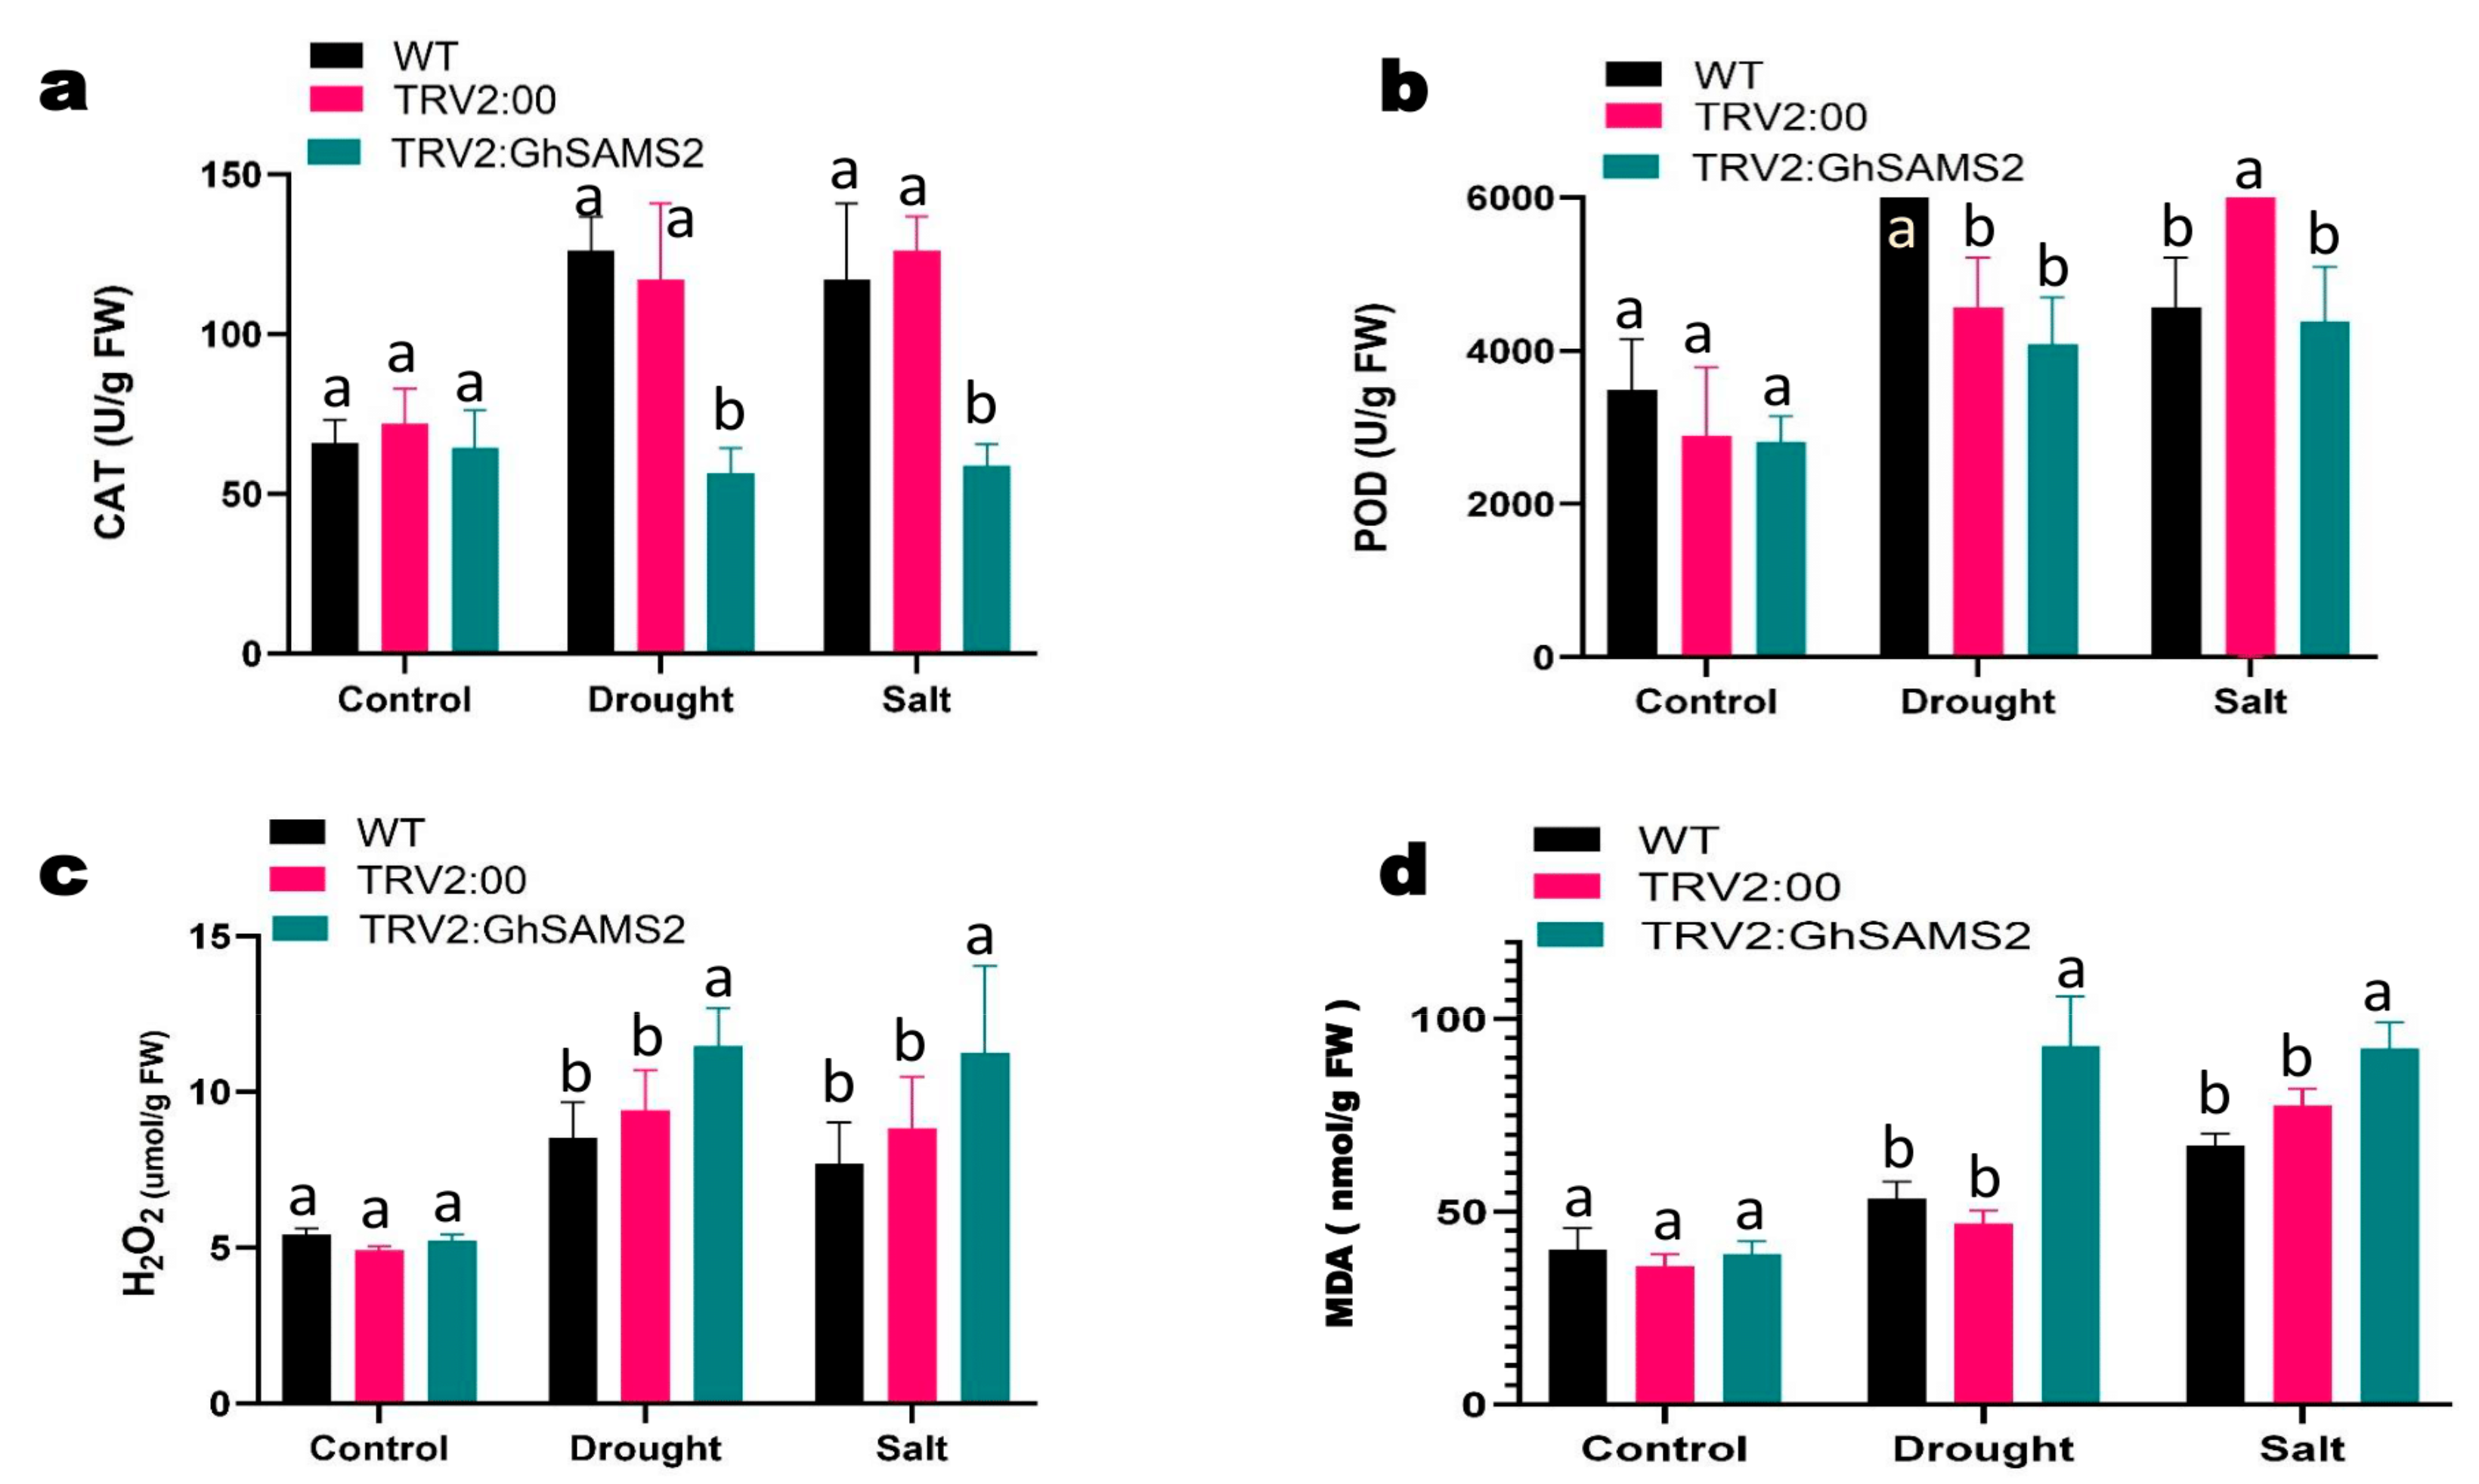
3.5. GhSAMS2 Gene Silencing Significantly Increased Sensitivity to Drought and Salt Stress

To verify the function of GhSAMS2 in response to abiotic stresses, it was knocked down through VIGS in cotton seedlings, and the plants’ morphological and physiological characteristics were analyzed under drought and salt stress conditions. The phenotypes of the cotton seedlings grown in hydroponics under various conditions are shown in Figure S3. The plants infiltrated with pTRV2: PDS exhibited photo-bleached leaves after 14 days of post-inoculation (Figure S3a). The WT- and TRV2:00-infected seedlings had rapid growth and, morphologically, looked much healthier after three weeks of inoculation (Figure S3b,c). To confirm that GhSAMS2 was effectively silenced, we analyzed its expression in the different cotton seedlings via RT-qPCR assays (Figure S3e). The results confirmed that the expression of GhSAMS2 in WT was significantly higher than that in TRV2:GhSAMS2 VIGS plants. Figure S4 presents the phenotypes of the WT, TRV2:00, and TRV2:GhSAMS2 plants under the drought and salt stresses.
We investigated various morphological and physiological parameters under stress conditions. We found minimal differences in the plant heights and root lengths between the VIGS plants and the controls (Figure 4A,C). The control plants had slightly longer roots compared to the treated ones. The root fresh weight and shoot fresh weight of WT were significantly higher than those of the silenced Gh_A08G1067 plants after stress treatment (Figure 4B,D). The TRV2:GhSAMS2 plants showed a significant reduction in leaves’ RLWC (relative water content) and chlorophyll content compared to the controls (Figure 4E,F). As expected, the Gh_SAMS2-infiltrated leaves exhibited a significantly increased ELWL (excised leaf water loss) and ion leakage compared to the WT and TRV2:00 plants (Figure 4G,H), indicating the deterioration of biological membranes.
We further analyzed biochemical parameters, including malondialdehyde (MDA) and H2O2 contents and the activity of antioxidant enzyme peroxidase (POD) and catalase (CAT). The contents of MDA and H2O2 in the TRV2:GhSAMS2 plants were significantly higher than those in the WT under the drought and salt stress conditions (Figure 5c,d). Supportively, the antioxidative activities of POD and CAT were significantly lower in the VIGS plants compared to those in the WT under the conditions of drought and salt stress (Figure 5a,b).

4. Discussion

Crop production is negatively affected by salinity and alkalinity in semi-arid and arid regions. It is estimated that 831 million hectares of soils in the world are affected by excessive salinity and alkalinity, of which 397 million hectares are saline soils compared to 434 million hectares of alkaline soils [51]. Hence, propagating cultivars that are salt-tolerant to utilize saline soils is of absolute urgency [52]. Previous studies in cotton have pointed out that cotton may have thousands of putative functional genes, but since it is labor-intensive and ineffective to carry out the stable genetic transformation of cotton, the majority of these genes have not yet been characterized [1]. The SAMS2 gene from previous studies has been found to play a crucial role in plant development regulation, metabolism, and abiotic and biotic stress tolerance mechanisms [12]. The SAMS gene family has been well studied in many different dicot and monocot plants such as tomato, Arabidopsis, sunflower, eggplant, soybean, Medicago truncatula, barley, sorghum, Triticum urartu, and rice [11]. This study identified and functionally characterized the cotton SAMS2 gene for the targeted enhancement of multiple abiotic stresses tolerance in G. hirsutum.
According to the prediction of the subcellular localization, cytoplasm and cytoskeleton are the key sites where GhSAMS genes are localized. Besides the cytoplasm, cytosol and chloroplasts also contain substantial SAMS proteins, as previously reported [53]. Interestingly, all the sixteen cotton SAMS genes lacked introns in their gene structure. It is reported that, in eukaryotic organisms, many genes are intronless [54]. Additionally, intronless genes are enriched in plant species such as Populus, Arabidopsis, and rice [6]. Therefore, the datasets provided by intronless genes have great potential for comparative genomics and evolutionary studies in eukaryotic organisms. However, studies within a phylogenetic framework on intronless genes are limited to few species, based on the previous evolutionary studies that have been carried out [55]. The lack of intron in the GhSAMS genes suggests that they might play important roles in biotic and abiotic stress acclimation mechanisms [56]. The results of the cis-acting regulatory elements analysis support this statement. Key abiotic stress responsiveness cis-elements were detected within the promoter regions of the GhSAMS genes [57]. The specific function of each GhSAMS gene could be predicted through the phylogenetic relationships.
The GhSAMS proteins recorded negative GRAVY values, indicating that they are hydrophilic [33]. Hydrophilic proteins have been highly linked to plant protection through antioxidants and membrane stabilizers during water stress conditions [58]. Furthermore, they prevent the collapse of cells in deficient water conditions by acting as space fillers [59]. Additionally, the presence of hydrophilic proteins in certain plants, invertebrates, and microorganisms has been highly associated with their adaptations to water-scarce ecological conditions [60]. GhSAMS genes are stable proteins, as shown by the instability index values, a property that allows cellular biochemical reactions to proceed despite unfavorable environmental conditions. Enzymes’ stability within cells is often shown by the instability index of various proteins involved in multiple reactions for a particular time [61]. Moreover, the proteins encoded by GhSAMSs have significantly higher thermal stability, as recorded in high aliphatic index values [62].
Gene expression analysis revealed that most of the GhSAMS genes are significantly induced by abiotic stresses. These findings are consistent with previous reports on SAMS genes in various crops such as tomato, Arabidopsis, rice, and soybean [63]. Among upland cotton SAMS genes, GhSAMS2 exhibited the highest expression under both salt and drought stress conditions, suggesting its pivotal role in the plant’s adaptation to unfavorable environmental conditions. Supportively, GhSAMS2 exhibited the highest stability index and interaction frequency with the GhCBL10 bait protein. The gene’s function has been previously studied in many plant species via knocking down using the VIGS tool [64]. The down-regulation of GhSAM2 via VIGS and the post-exposure of VIGS plants to drought and salt stress confirmed the key role of this gene in moderating abiotic stress tolerance. The TRV2:GhSAMS2 plants showed growth and biomass accumulation defects compared to the controls under drought and salt stress conditions. Their leaves contained less chlorophyll and exhibited higher ion leakage, indicating the high sensitivity of VIGS-GhSAM2 plants to abiotic stresses. In general, plants exhibit wilting behaviors when exposed to drought and salt stress [65]. The disruption of stress tolerance mechanisms by abiotic stress in plants often exacerbates the transpiration rate, biological membrane deterioration, and cells’ function perturbation [66]. Damage to the phospholipid membrane structure due to oxidation is mainly induced by drought and salt stresses. Hydrogen peroxide and Malondialdehyde contents are the biochemical parameters usually used to determine the cellular damage within the organism’s tissues [3]. Oxidative stress in living organisms is dictated by the level of MDA and ROS contents accumulated at a particular time [14]. ROS production is often promoted by reducing the usage of absorption light energy caused by Calvin cycle enzyme inhibition under abiotic stress conditions. [67]. The GhSAMS2 knockdown in VIGS plants incapacitated the scavenging ability of excess ROS, resulting in acute oxidative stress and high H2O2 and MDA accumulation. The VIGS-GhSAMS2 plants showed deficiency in terms of CAT and POD activities compared to the control plants, supporting the deterioration of enzymatic oxidation defense systems [68]. These results demonstrate that GhSAMS2 (Gh_A08G1067) is a promising gene for enhancing upland cotton and other crops’ tolerance to drought and salt stress through molecular breeding. Moreover, they confirm the successful gene knockdown and effectiveness of the tobacco virus rattle vector [3,32]. Further functional characterization of identified GhSAMSs via subsequent knockout and overexpression coupled with transcriptomic and metabolomic analyses is required to understand cotton plant stress response mechanisms better.

5. Conclusions

This study identified sixteen (16) SAMS genes in upland cotton and comprehensively explored their chromosomal locations, gene structure, phylogenetic relationships, cis-acting elements, conserved motifs, and expression under drought and salt stress conditions. We found that GhSAMS genes might be primarily involved in the network’s regulation of various environmental stresses. Particularly, GhSAMS2 was identified as a promising candidate gene for the targeted improvement of upland cotton’s tolerance to multiple abiotic stresses. The downregulation of GhSAMS2 expression via VIGS confirmed its pivotal role in mediating the plant’s response to abiotic stress. Our findings provide reference information for the in-depth investigation of GhSAMS genes’ functions and for dissecting the complex molecular networks associated with abiotic stress tolerance in cotton.

Supplementary Materials

The following supporting information can be downloaded at: https://www.mdpi.com/article/10.3390/agronomy13020612/s1, Additional file 1, Table S1: SAMS genes from other plant species analyzed in this study; Table S2: List of primers used for the RT-qPCR analysis; Table S3: List of primers used in Y2H experiments; Table S4: Cis-regulatory elements detected within the promoter region of GhSAMS genes. Additional file 2, Figure S1: Heat maps showing GhSAMS genes’ differential expression in G. hirsutum under drought and salt stress conditions; Figure S2: Self-auto-activation state, toxicity test, verification of interactions, and mating efficiency determination of the GhCBL10 bait gene in a Yeast Two-Hybrid system; Figure S3: Phenotypic observation of cotton seedlings under VIGS and GhSAMS2 expression analysis via RT-qPCR; Figure S4: Morphology of VIGS and wild type plants under the conditions of drought and salt stress.

Author Contributions

Conceptualization, methodology, and validation, J.W.K., T.G.M., Y.W. (Yangyang Wei), Y.X. and F.L.; formal analysis, data curation, and writing—original draft preparation, M.J.U., R.O.M., M.L.S., J.N.K. and R.P.; writing—review and editing, Y.H., Y.W. (Yuhong Wang), X.C. and J.W.K.; supervision, F.L. and Z.Z.; project administration and funding acquisition, F.L. All authors have read and agreed to the published version of the manuscript.

Funding

This research was funded by the National Natural Science Foundation of China (32171994, 32072023) and the National Key R&D Program of China ((2021YFE0101200), PSF/CRP/18th Protocol (07).

Informed Consent Statement

Informed consent was obtained from all subjects involved in this study.

Data Availability Statement

The data presented in this study are available on request from the corresponding author.

Conflicts of Interest

The authors declare no conflict of interest. The funders had no role in the design of the study; in the collection, analyses, or interpretation of data; in the writing of the manuscript; or in the decision to publish the results.

References

  1. Gu, Z.; Huang, C.; Li, F.; Zhou, X. A versatile system for functional analysis of genes and microRNAs in cotton. Plant Biotechnol. J. 2014, 12, 638–649. [Google Scholar] [CrossRef] [Green Version]
  2. Kim, S.H.; Kim, S.H.; Palaniyandi, S.A.; Yang, S.H.; Suh, J.W. Expression of potato S-adenosyl-l-methionine synthase (SbSAMS) gene altered developmental characteristics and stress responses in transgenic Arabidopsis plants. Plant Physiol. Biochem. 2015, 87, 84–91. [Google Scholar] [CrossRef]
  3. Mehari, T.G.; Xu, Y.; Umer, M.J.; Shiraku, M.L.; Hou, Y.; Wang, Y.; Yu, S.; Zhang, X.; Wang, K.; Cai, X.; et al. Multi-Omics-Based Identification and Functional Characterization of Gh_A06G1257 Proves Its Potential Role in Drought Stress Tolerance in Gossypium hirsutum. Front. Plant Sci. 2021, 12, 2092. [Google Scholar] [CrossRef]
  4. Turan, M.A.; Elkarim, A.H.A.; Taban, N.; Taban, S. Effect of salt stress on growth, stomatal resistance, proline and chlorophyll concentrations on maize plant. Afr. J. Agric. Res. 2009, 4, 893–897. [Google Scholar]
  5. Shi, D.; Sheng, Y. Effect of various salt-alkaline mixed stress conditions on sunflower seedlings and analysis of their stress factors. Environ. Exp. Bot. 2005, 54, 8–21. [Google Scholar] [CrossRef]
  6. Yang, C.W.; Xu, H.H.; Wang, L.L.; Liu, J.; Shi, D.C.; Wang, D.L. Comparative effects of salt-stress and alkali-stress on the growth, photosynthesis, solute accumulation, and ion balance of barley plants. Photosynthetica 2009, 47, 79–86. [Google Scholar] [CrossRef]
  7. Ahmad, S.T.; Sima, N.A.K.K.; Mirzaei, H.H. Effects of sodium chloride on physiological aspects of Salicornia persica growth. J. Plant Nutr. 2013, 36, 401–414. [Google Scholar] [CrossRef]
  8. Ahuja, I.; de Vos, R.C.H.; Bones, A.M.; Hall, R.D. Plant molecular stress responses face climate change. Trends Plant Sci. 2010, 15, 664–674. [Google Scholar] [CrossRef]
  9. Yang, L.; Zhang, Y.; Zhu, N.; Koh, J.; Ma, C.; Pan, Y.; Yu, B.; Chen, S.; Li, H. Proteomic analysis of salt tolerance in sugar beet monosomic addition line M14. J. Proteome Res. 2013, 12, 4931–4950. [Google Scholar] [CrossRef]
  10. He, M.W.; Wang, Y.; Wu, J.Q.; Shu, S.; Sun, J.; Guo, S.R. Isolation and characterization of S-Adenosylmethionine synthase gene from cucumber and responsive to abiotic stress. Plant Physiol. Biochem. 2019, 141, 431–445. [Google Scholar] [CrossRef]
  11. Heidari, P.; Mazloomi, F.; Nussbaumer, T.; Barcaccia, G. Insights into the SAM Synthetase Gene Family and Its Roles in Tomato Seedlings under Abiotic Stresses and Hormone Treatments. Plants 2020, 9, 586. [Google Scholar] [CrossRef]
  12. Roje, S. S-Adenosyl-l-methionine: Beyond the universal methyl group donor. Phytochemistry 2006, 67, 1686–1698. [Google Scholar] [CrossRef]
  13. Bürstenbinder, K.; Rzewuski, G.; Wirtz, M.; Hell, R.; Sauter, M. The role of methionine recycling for ethylene synthesis in Arabidopsis. Plant J. 2007, 49, 238–249. [Google Scholar] [CrossRef]
  14. Ma, C.; Wang, Y.; Gu, D.; Nan, J.; Chen, S.; Li, H. Overexpression of S-adenosyl-L-methionine synthetase 2 from sugar beet M14 increased arabidopsis tolerance to salt and oxidative stress. Int. J. Mol. Sci. 2017, 18, 847. [Google Scholar] [CrossRef] [Green Version]
  15. Jang, S.J.; Wi, S.J.; Choi, Y.J.; An, G.; Park, K.Y. Increased polyamine biosynthesis enhances stress tolerance by preventing the accumulation of reactive oxygen species: T-DNA mutational analysis of Oryza sativa lysine decarboxylase-like protein 1. Mol. Cells 2012, 34, 251–262. [Google Scholar] [CrossRef] [Green Version]
  16. Gupta, K.; Dey, A.; Gupta, B. Plant polyamines in abiotic stress responses. Acta Physiol. Plant. 2013, 35, 2015–2036. [Google Scholar] [CrossRef]
  17. Wang, K.L.C.; Li, H.; Ecker, J.R. Ethylene biosynthesis and signaling networks. Plant Cell 2002, 14, 131–152. [Google Scholar] [CrossRef] [Green Version]
  18. Vandenbussche, F.; Vaseva, I.; Vissenberg, K.; Van Der Straeten, D. Ethylene in vegetative development: A tale with a riddle. New Phytol. 2012, 194, 895–909. [Google Scholar] [CrossRef]
  19. Li, W.; Han, Y.; Tao, F.; Chong, K. Knockdown of SAMS genes encoding S-adenosyl-l-methionine synthetases causes methylation alterations of DNAs and histones and leads to late flowering in rice. J. Plant Physiol. 2011, 168, 1837–1843. [Google Scholar] [CrossRef]
  20. Chen, M.; Chen, J.; Fang, J.; Guo, Z.; Lu, S. Down-regulation of S-adenosylmethionine decarboxylase genes results in reduced plant length, pollen viability, and abiotic stress tolerance. Plant Cell Tissue Organ Cult. 2014, 116, 311–322. [Google Scholar] [CrossRef]
  21. Guo, Z.; Tan, J.; Zhuo, C.; Wang, C.; Xiang, B.; Wang, Z. Abscisic acid, H2O2 and nitric oxide interactions mediated cold-induced S-adenosylmethionine synthetase in Medicago sativa subsp. Falcata that confers cold tolerance through up-regulating polyamine oxidation. Plant Biotechnol. J. 2014, 12, 601–612. [Google Scholar] [CrossRef] [PubMed]
  22. Zhu, H.; He, M.; Jahan, M.S.; Wu, J.; Gu, Q.; Shu, S.; Sun, J.; Guo, S. Cscdpk6, a cssams1-interacting protein, affects polyamine/ethylene biosynthesis in cucumber and enhances salt tolerance by overexpression in tobacco. Int. J. Mol. Sci. 2021, 22, 11133. [Google Scholar] [CrossRef]
  23. Ding, C.; Chen, T.; Yang, Y.; Liu, S.; Yan, K.; Yue, X.; Zhang, H.; Xiang, Y.; An, L.; Chen, S. Molecular cloning and characterization of an S-adenosylmethionine synthetase gene from Chorispora bungeana. Gene 2015, 572, 205–213. [Google Scholar] [CrossRef] [PubMed]
  24. Xu, Y.; Magwanga, R.O.; Yang, X.; Jin, D.; Cai, X.; Hou, Y.; Wei, Y.; Zhou, Z.; Wang, K.; Liu, F. Genetic regulatory networks for salt-alkali stress in Gossypium hirsutum with differing morphological characteristics. BMC Genom. 2020, 21, 15. [Google Scholar] [CrossRef] [PubMed] [Green Version]
  25. Gasteiger, E.; Hoogland, C.; Gattiker, A.; Duvaud, S.; Wilkins, M.R.; Appel, R.D.; Bairoch, A. The Proteomics Protocols Handbook; Humana Press: Totowa, NJ, USA, 2005; pp. 571–608. [Google Scholar] [CrossRef]
  26. Tamura, K.; Peterson, D.; Peterson, N.; Stecher, G.; Nei, M.; Kumar, S. MEGA5: Molecular evolutionary genetics analysis using maximum likelihood, evolutionary distance, and maximum parsimony methods. Mol. Biol. Evol. 2011, 28, 2731–2739. [Google Scholar] [CrossRef] [PubMed] [Green Version]
  27. Thompson, J.D.; Gibson, T.J.; Higgins, D.G. Multiple Sequence Alignment Using ClustalW and ClustalX. Curr. Protoc. Bioinform. 2003, 1, 2–3. [Google Scholar] [CrossRef]
  28. Hortona, P.; Park, K.J.; Obayashi, T.; Nakai, K. Protein subcellular localization prediction with WoLF PSORT. Ser. Adv. Bioinform. Comput. Biol. 2006, 3, 39–48. [Google Scholar] [CrossRef] [Green Version]
  29. Hu, B.; Jin, J.; Guo, A.Y.; Zhang, H.; Luo, J.; Gao, G. GSDS 2.0: An upgraded gene feature visualization server. Bioinformatics 2015, 31, 1296–1297. [Google Scholar] [CrossRef] [Green Version]
  30. Mehari, T.G.; Xu, Y.; Magwanga, R.O.; Umer, M.J.; Kirungu, J.N.; Cai, X.; Hou, Y.; Wang, Y.; Yu, S.; Wang, K.; et al. Genome wide identification and characterization of light-harvesting Chloro a/b binding (LHC) genes reveals their potential role in enhancing drought tolerance in Gossypium hirsutum. J. Cott. Res. 2021, 4, 15. [Google Scholar] [CrossRef]
  31. Hoagland, D.R.; Arnon, D.I. Preparing the nutrient solution. In The Water-Culture Method for Growing Plants Without Soil; Circular California Agricultural Experiment Station: Berkeley, CA, USA, 1950; Volume 347, pp. 29–31. [Google Scholar]
  32. Mehari, T.G.; Xu, Y.; Magwanga, R.O.; Umer, M.J.; Shiraku, M.L.; Hou, Y.; Wang, Y.; Wang, K.; Cai, X.; Zhou, Z.; et al. Identification and functional characterization of Gh_D01G0514 (GhNAC072) transcription factor in response to drought stress tolerance in cotton. Plant Physiol. Biochem. 2021, 166, 361–375. [Google Scholar] [CrossRef]
  33. Magwanga, R.O.; Lu, P.; Kirungu, J.N.; Lu, H.; Wang, X.; Cai, X.; Zhou, Z.; Zhang, Z.; Salih, H.; Wang, K.; et al. Characterization of the late embryogenesis abundant (LEA) proteins family and their role in drought stress tolerance in upland cotton. BMC Genet. 2018, 19, 1–31. [Google Scholar] [CrossRef] [PubMed] [Green Version]
  34. Mustafa, R.; Shafiq, M.; Mansoor, S.; Briddon, R.W.; Scheffler, B.E.; Scheffler, J.; Amin, I. Virus-Induced Gene Silencing in Cultivated Cotton (Gossypium spp.) Using Tobacco Rattle Virus. Mol. Biotechnol. 2016, 58, 65–72. [Google Scholar] [CrossRef] [PubMed]
  35. Kirungu, J.N.; Magwanga, R.O.; Pu, L.; Cai, X.; Xu, Y.; Hou, Y.; Zhou, Y.; Cai, Y.; Hao, F.; Zhou, Z.; et al. Knockdown of Gh_A05G1554 (GhDHN_03) and Gh_D05G1729 (GhDHN_04) Dehydrin genes, Reveals their potential role in enhancing osmotic and salt tolerance in cotton. Genomics 2020, 112, 1902–1915. [Google Scholar] [CrossRef]
  36. Livak, K.J.; Schmittgen, T.D. Analysis of relative gene expression data using real-time quantitative PCR and the 2−ΔΔCT method. Methods 2001, 25, 402–408. [Google Scholar] [CrossRef]
  37. Shiraku, M.L.; Magwanga, R.O.; Cai, X.; Kirungu, J.N.; Xu, Y.; Mehari, T.G.; Hou, Y.; Wang, Y.; Wang, K.; Peng, R.; et al. Knockdown of 60S ribosomal protein L14-2 reveals their potential regulatory roles to enhance drought and salt tolerance in cotton. J. Cott. Res. 2021, 4, 27. [Google Scholar] [CrossRef]
  38. Chen, Y.; Li, C.; Zhang, B.; Yi, J.; Yang, Y.; Kong, C.; Lei, C.; Gong, M. The Role of the Late Embryogenesis-Abundant (LEA) Protein Family in Development and the Abiotic Stress Response: A Comprehensive Expression Analysis of. Genes 2019, 10, 148. [Google Scholar] [CrossRef] [Green Version]
  39. Lei, K.; Liu, A.; Fan, S.; Peng, H.; Zou, X.; Zhen, Z. Identification of TPX2 Gene Family in Upland Cotton and its Functional Analysis in Cotton. Genes 2019, 10, 508. [Google Scholar] [CrossRef] [Green Version]
  40. Fu, D.Q.; Zhu, B.Z.; Zhu, H.L.; Jiang, W.B.; Luo, Y.B. Virus-induced gene silencing in tomato fruit. Plant J. 2005, 43, 299–308. [Google Scholar] [CrossRef]
  41. Gao, X.; Britt, R.C.; Shan, L.; He, P. Agrobacterium-mediated virus-induced gene silencing assay in cotton. J. Vis. Exp. 2011, 54, e2938. [Google Scholar] [CrossRef] [Green Version]
  42. Dupadahalli, K. A modified freeze-thaw method for the efficient transformation of Agrobacterium tumefaciens. Curr. Sci. 2007, 93, 770–772. [Google Scholar]
  43. Tuttle, J.R.; Haigler, C.H.; Robertson, D. Method: Low-cost delivery of the cotton leaf crumple virus-induced gene silencing system. Plant Methods 2012, 8, 27. [Google Scholar] [CrossRef] [PubMed] [Green Version]
  44. Kirungu, J.N.; Magwanga, R.O.; Lu, P.; Cai, X.; Zhou, Z.; Wang, X.; Peng, R.; Wang, K.; Liu, F. Functional characterization of Gh-A08G1120 (GH3.5) gene reveal their significant role in enhancing drought and salt stress tolerance in cotton. BMC Genet. 2019, 20, 62. [Google Scholar] [CrossRef] [PubMed] [Green Version]
  45. Yang, X.; Jawdy, S.; Tschaplinski, T.J.; Tuskan, G.A. Genome-wide identification of lineage-specific genes in Arabidopsis, Oryza and Populus. Genomics 2009, 93, 473–480. [Google Scholar] [CrossRef] [PubMed] [Green Version]
  46. Magwanga, R.O.; Kirungu, J.N.; Lu, P.; Yang, X.; Dong, Q.; Cai, X.; Xu, Y.; Wang, X.; Zhou, Z.; Hou, Y.; et al. Genome wide identification of the trihelix transcription factors and overexpression of Gh_A05G2067 (GT-2), a novel gene contributing to increased drought and salt stresses tolerance in cotton. Physiol. Plant. 2019, 167, 447–464. [Google Scholar] [CrossRef] [PubMed] [Green Version]
  47. Agarie, S.; Hanaoka, N.; Kubota, F.; Agata, W.; Kaufman, P.B. Measurement of Cell Membrane Stability Evaluated by Electrolyte Leakage as a Drought and Heat Tolerance Test in Rice (Oryza sativa L.). J. Fac. Agric. Kyushu Univ. 1995, 40, 233–240. [Google Scholar] [CrossRef]
  48. Rehman, S.U.; Bilal, M.; Rana, R.M.; Tahir, M.N.; Shah, M.K.N.; Ayalew, H.; Yan, G. Cell membrane stability and chlorophyll content variation in wheat (Triticum aestivum) genotypes under conditions of heat and drought. Crop Pasture Sci. 2016, 67, 712–718. [Google Scholar] [CrossRef]
  49. Magwanga, R.O.; Lu, P.; Kirungu, J.N.; Dong, Q.; Cai, X.; Zhou, Z.; Wang, X.; Hou, Y.; Xu, Y.; Peng, R.; et al. Knockdown of cytochrome P450 genes Gh_D07G1197 and Gh_A13G2057 on chromosomes D07 and A13 reveals their putative role in enhancing drought and salt stress tolerance in Gossypium hirsutum. Genes 2019, 10, 226. [Google Scholar] [CrossRef] [Green Version]
  50. Majidi, M.M.; Rashidi, F.; Sharafi, Y. Physiological traits related to drought tolerance in Brassica. Int. J. Plant Prod. 2015, 9, 541–560. [Google Scholar] [CrossRef]
  51. Parihar, P.; Singh, S.; Singh, R.; Singh, V.P.; Prasad, S.M. Effect of salinity stress on plants and its tolerance strategies: A review. Environ. Sci. Pollut. Res. 2015, 22, 4056–4075. [Google Scholar] [CrossRef]
  52. Flowers, T.J. Improving crop salt tolerance. J. Exp. Bot. 2004, 55, 307–319. [Google Scholar] [CrossRef]
  53. Hazarika, P.; Rajam, M.V. Biotic and abiotic stress tolerance in transgenic tomatoes by constitutive expression of S-adenosylmethionine decarboxylase gene. Physiol. Mol. Biol. Plants 2011, 17, 115–128. [Google Scholar] [CrossRef] [PubMed] [Green Version]
  54. Bhandari, B.; Roesler, W.J.; DeLisio, K.D.; Klemm, D.J.; Ross, N.S.; Miller, R.E. A functional promoter flanks an intronless glutamine synthetase gene. J. Biol. Chem. 1991, 266, 7784–7792. [Google Scholar] [CrossRef]
  55. He, S.; Zou, M.; Guo, B. The roles and evolutionary patterns of intronless genes in deuterostomes. Comp. Funct. Genom. 2011, 2011, 680673. [Google Scholar] [CrossRef] [Green Version]
  56. Shiraku, M.L.; Magwanga, R.O.; Cai, X.; Kirungu, J.N.; Xu, Y.; Mehari, T.G.; Hou, Y.; Wang, Y.; Agong, S.G.; Peng, R.; et al. Functional Characterization of GhACX3 Gene Reveals Its Significant Role in Enhancing Drought and Salt Stress Tolerance in Cotton. Front. Plant Sci. 2021, 12, 1120. [Google Scholar] [CrossRef]
  57. Zhou, M.L.; Ma, J.T.; Pang, J.F.; Zhang, Z.L.; Tang, Y.X.; Wu, Y.M. Regulation of plant stress response by dehydration responsive element binding (DREB) transcription factors. Afr. J. Biotechnol. 2010, 9, 9255–9269. [Google Scholar] [CrossRef]
  58. Gao, J.; Lan, T. Functional characterization of the late embryogenesis abundant (LEA) protein gene family from Pinus tabuliformis (Pinaceae) in Escherichia coli. Sci. Rep. 2016, 6, 19467. [Google Scholar] [CrossRef] [Green Version]
  59. Tunnacliffe, A.; Wise, M.J. The continuing conundrum of the LEA proteins. Naturwissenschaften 2007, 94, 791–812. [Google Scholar] [CrossRef]
  60. Chakrabortee, S.; Boschetti, C.; Walton, L.J.; Sarkar, S.; Rubinsztein, D.C.; Tunnacliffe, A. Hydrophilic protein associated with desiccation tolerance exhibits broad protein stabilization function. Proc. Natl. Acad. Sci. USA 2007, 104, 18073–18078. [Google Scholar] [CrossRef] [Green Version]
  61. Heidari, P.; Ahmadizadeh, M.; Izanlo, F.; Nussbaumer, T. In silico study of the CESA and CSL gene family in Arabidopsis thaliana and Oryza sativa: Focus on post-translation modifications. Plant Gene 2019, 19, 100189. [Google Scholar] [CrossRef]
  62. Bachmair, A.; Finley, D.; Varshavsky, A. In vivo half-life of a protein is a function of its amino-terminal residue. Science 1986, 234, 179–186. [Google Scholar] [CrossRef]
  63. Gong, B.; Li, X.; Vandenlangenberg, K.M.; Wen, D.; Sun, S.; Wei, M.; Li, Y.; Yang, F.; Shi, Q.; Wang, X. Overexpression of S-adenosyl-l-methionine synthetase increased tomato tolerance to alkali stress through polyamine metabolism. Plant Biotechnol. J. 2014, 12, 694–708. [Google Scholar] [CrossRef] [PubMed]
  64. Singh, B.; Kukreja, S.; Salaria, N.; Thakur, K.; Gautam, S.; Taunk, J.; Goutam, U. VIGS: A flexible tool for the study of functional genomics of plants under abiotic stresses. J. Crop Improv. 2019, 33, 567–604. [Google Scholar] [CrossRef]
  65. Ma, Y.; Dias, M.C.; Freitas, H. Drought and Salinity Stress Responses and Microbe-Induced Tolerance in Plants. Front. Plant Sci. 2020, 11, 1750. [Google Scholar] [CrossRef] [PubMed]
  66. Suzuki, N.; Rivero, R.M.; Shulaev, V.; Blumwald, E.; Mittler, R. Abiotic and biotic stress combinations. New Phytol. 2014, 203, 32–43. [Google Scholar] [CrossRef]
  67. Zago, E.; Morsa, S.; Dat, J.F.; Alard, P.; Ferrarini, A.; Inzé, D.; Delledonne, M.; Van Breusegem, F. Nitric oxide- and hydrogen peroxide-responsive gene regulation during cell death induction in tobacco. Plant Physiol. 2006, 141, 404–411. [Google Scholar] [CrossRef] [Green Version]
  68. Asada, K. The water-water cycle in chloroplasts: Scavenging of active oxygens and dissipation of excess photons. Annu. Rev. Plant Biol. 1999, 50, 601–639. [Google Scholar] [CrossRef]
Figure 1. Chromosomal distribution, phylogenetic analysis, and subcellular localization of GhSAMS genes. (ac) Distribution of GhSAMS genes on the chromosomes of G. hirsutum, G. arboreum, and G. raimondii, respectively. (d) Phylogenetic tree of GhSAMS genes and their homologs from A. thaliana, T. cacao, Soya bean, Rice, Tomato, Medicago truncatula, Sorghum, Maize, and Barley. (e,f) Subcellular localization of GhSAMS genes. The neighbor-joining method was used to construct the phylogenetic tree with replicates of 1000 bootstrap values in the MEGA 7.0 software.
Agronomy 13 00612 g001
Figure 2. GhSAMS genes’ structure (a), and conserved motifs in their promoter region (b).
Agronomy 13 00612 g002
Figure 3. Heat maps showing GhSAMS genes’ differential expression in G. hirsutum under drought and salt stress conditions. RT-qPCR analysis of the expression of GhSAMS genes under drought stress in the leaf (a) and roots (b). RT-qPCR analysis of the expression of GhSAMS genes under salt stress in the leaf (c) and roots (d). The higher expression level, the lower expression level, and no expression of the GhSAMS genes at a particular time are depicted by red, green, and black colors, respectively.
Agronomy 13 00612 g003
Figure 4. VIGS and WT plants’ physiological and morphological traits analyzed under the conditions of drought and salt stress. (A) Plant height. (B) Shoot fresh weight. (C) Root length. (D) Root fresh weight. (E) Relative leaf water content. (F) Leaves’ chlorophyll content. (G) Excised leaf water loss. (H) Ion leakage in the leaf. TRV2:00, Positive control; WT, Wild type; and TRV2:GhSAMS2, VIGS plants. Different letters above the bars indicate statistically significant differences at p < 0.05.
Agronomy 13 00612 g004
Figure 5. Oxidant and antioxidant enzyme biochemical assays in the leaves of WT and VIGs plants after 24 h post-stress-exposure. (a) Determination of catalase quantity. (b) Determination of peroxidase quantity. (c) Determination of hydrogen peroxide quantity. (d) Determination of Malondialdehyde quantity. TRV2:00, Positive control; WT, Wild type; and TRV2:GhSAMS2, VIGS plants. Different letters above the bars indicate statistically significant differences at p < 0.05.
Agronomy 13 00612 g005
Table 1. The bait auto-activation and toxicity test sampling.
ReactionPlasmid 1Plasmid 2
Positive ControlpGBKT7-53pGADT7-T
Negative ControlpGBKT7-LamGADT7-T
BD (Target gene)pGBKT7-GhCBL10
Empty vectorpGADT7
Table 2. The physicochemical properties of cotton SAMS genes.
Transcript IDLength (aa)MW (kDa)ChargePIGRAVYInstability IndexSubcellular Localization
Gh_A02G0578.139343.061−45.941−0.308StableCytoplasm
Gh_A04G0603.139042.8553.56.983−0.326StableCytoplasm
Gh_A07G1193.125628.1278.974−0.326StableCytoplasm
Gh_A08G1067.139343.091−55.772−0.325StableCytoplasm
Gh_A09G1368.139042.6147.118−0.299StableCytoskeleton
Gh_A11G0966.139343.026−6.55.579−0.36StableCytoplasm
Gh_A11G2886.139042.68226.786−0.332StableCytoplasm
Gh_A12G1098.139343.071−65.594−0.335StableCytoplasm
Gh_D02G0636.139343.044−4.55.909−0.3StableCytoplasm
Gh_D04G1064.139042.8123.56.983−0.306StableCytoplasm
Gh_D07G1294.139343.039−65.594−0.328StableCytoplasm
Gh_D08G1348.139343.04−5.55.618−0.338StableCytoskeleton
Gh_D09G1369.139042.69547.118−0.294StableCytoskeleton
Gh_D11G1117.139343.062−65.596−0.358StableCytoplasm
Gh_D11G3272.139042.61626.786−0.32StableCytoskeleton
Gh_D12G1222.139343.042−65.594−0.321StableCytoplasm
Table 3. Isolated prey proteins from the Y2H system’s AD library of cotton leaves.
Transcript IDNameGene DescriptionChrStartingEndingLength
Gh_D06G1756.1PRA1B1PRA1 family protein B1D0657,193,27657,193,932657
Gh_A11G0688.1DSP8Putative dual-specificity protein DSP8 phosphataseA116,717,9436,719,957945
Gh_A07G1725.1CAB-151Chlorophyll a-b binding protein 151, chloroplasticA0770,403,37970,404,266798
Gh_AO8G1067.1SAMS2S-adenosylmethionine synthase-2A0873,601,85773,603,0381182
Gh_D12G0158.1PYD3Beta-ureidopropionaseD122,003,6682,006,2541251
Gh_D04G1908.1RPL3460S ribosomal protein L34D0451,393,19251,394,076363
Gh_D02G0037.1UBC28Ubiquitin-conjugating enzyme E2 28D02190,259192,000447
Gh_D06G1538.1PSAFPhotosystem I reaction center subunit III, chloroplasticD0651,265,73151,266,405675
Gh_D08G1752.1LON2Lon protease homolog 2, peroxisomalD0853,762,84653,770,0012670
Gh_D02G0914.1PAH2Phosphatidate phosphatase PAH2D0219,402,61719,409,2042934
Gh_A11G2956.1BEE3Transcription factor BEE 3scaffold2723_A1167,01968,759708
Gh_D12G0965.1Rnf25E3 ubiquitin-protein ligase RNF25D1235,117,73435,120,3551026
Gh_A13G2030.1RAX2Transcription factor RAX2A1379,732,24679,733,388903
Gh_A12G2413.1ALMT9Aluminum-activated malate transporter 9A1286,624,24886,627,5771839
Gh_D11G0245.1ARF9Auxin response factor 9D112,017,7542,033,3733696
Gh_D11G2402.1NANAD1147,820,68947,823,8711290
Gh_D09G1701.1NANAD0944,755,34444,757,7342070
Gh_A05G3519.1At1g54200Protein BIG GRAIN 1-like BA0590,846,17790,847,4661290
Gh_D08G0705.1NAEnt-copalyl diphosphate synthase, chloroplasticD089,782,7329,788,2962538
Gh_A04G1028.1At4g26680Pentatricopeptide repeat-containing, containing protein At4g26680A0460,318,57760,320,1871611
Gh_D05G3560.1RH32DEAD-box ATP-dependent RNA helicase 32D0558,950,10658,954,4302262
Gh_D13G0219.1AN11010Putative GTPase-activating proteinD132,155,2132,163,5232538
Gh_A12G0039.1NANAA12598,420600,7871281
Disclaimer/Publisher’s Note: The statements, opinions and data contained in all publications are solely those of the individual author(s) and contributor(s) and not of MDPI and/or the editor(s). MDPI and/or the editor(s) disclaim responsibility for any injury to people or property resulting from any ideas, methods, instructions or products referred to in the content.

