1. Introduction
Insect-proof screens (IPS) are a physical barrier used as protection from insects in ventilation openings such as buildings and greenhouses. This element is typically built as interlaced threads forming a fabric-like screen, with warp and weft threads [
1]. The use of these screens is extensive in greenhouses on the Mediterranean coast. For instance, they are used in greenhouses at the southeast of the Spanish peninsula [
2], where IPSs are placed in ventilation openings. Thanks to the installation of IPSs, harmful insects are prevented from entering [
3,
4] and beneficial insects are prevented from leaving [
3]. The main drawback of its use is the reduction of natural ventilation capacity in greenhouses [
5,
6,
7], due to the significant pressure drop caused by their presence [
1] also leads to a drastic reduction in airflow energy passing through the IPS [
8]. e.g., In a greenhouse with IPSs it was identified more temperature and humidity levels [
6], and lower airflow velocity [
9], than in a greenhouse without IPSs. The scenario described for greenhouses is actually quite similar in standard homes with IPSs installed in windows (although with different temperature and humidity levels). Thus, other important applications of these screens are homes to get a passive protection of humans from insects [
10], or even in farms with the purpose of protecting animals from diseases transmitted by insects and bugs [
11]. Another important consequence of using insect-proof screens is mixing enhancement [
8]. However, mixing is not as strong as in other more intense mixing applications [
12,
13].
Once the importance of IPSs has been identified, there is a real need to characterise them geometrically and aerodynamically, due to their impact in ventilation. The design of the IPSs pursues two counterpart objectives: (i) to define an adequate pore geometry to prevent the passage of small insects; (ii) to ensure that such pore geometry has the least possible effect on ventilation capacity. It is essential to accurately study the geometry of the pores, their effect on the passage of particles/objects/insects and their effect on the flow that passes through them, in order to use this information to optimise the design of these elements according to the performance that is required.
The first step to characterise the aerodynamics of IPSs is to get information of their geometry. In [
14,
15] a methodology was published to obtain the 2D geometric parameters of screens. From digital images of IPSs, the thread density, diameter of the threads in both directions (
and
), length of the pores in both directions or separation between x and y-threads (
and
), surface of the pores (
), the diameter of the circumference inscribed in the pore (
), and the two-dimensional porosity (
) is obtained. Despite the strong interest on these parameters to classify screens, this two-dimensional characterization is insufficient, since IPSs are three-dimensional structures. For this reason, we recently released an innovative software [
16,
17] that allows, from the two-dimensional parameters mentioned above plus the measurement of the thickness of the IPS (
e), to reconstruct the geometry of the IPS in three-dimensions. The software is also able to accurately calculate the 3D volumetric porosity (
) [
17], a parameter never considered before, due to the complexity in its analytical modelling. An example is shown in
Figure 1.
The second step to characterise the aerodynamics of IPSs is to use the geometric data plus experimental data to build up models to predict the performance of screens. Wind tunnel tests have been carried out to determine the pressure drop caused by the IPSs as a function of airflow velocity [
1,
18,
19,
20,
21]. Pressure drop caused by an IPS can be expressed as a second degree polynomial [
1,
22]:
where
a and
b are coefficients which depend on two parameters: (i) permeability,
, which is a function of the geometry of screens; and (ii) inertial factor,
Y, which is a function of the nature of the porous medium [
23].
As
and
Y are widely used in aerodynamics, to know more about their impact on ventilation is a must. For this reason, there are many works in the literature which are focused on the development of models characterise the IPS aerodynamics on this basis [
1,
3,
18,
24,
25,
26]. In these works, amongst all the important parameters to build their models, porosity of the screens has been found the most influential one. This is so because it has a strong relation to permeability
, and thus, on the inertial factor
Y present in the Forchheimer equation (which is derived from the Darcy equation). This equation can be then further modelled by including
and
Y to fit a second degree polynomial as [
1]:
where
and
stand for the density and viscosity of air, respectively,
e is the thickness of the screen, and
u is the airflow velocity.
Thus, to determine the value of
and
Y of an IPS experimentally, a wind tunnel is required. Another option is to use models that permit to estimate these aerodynamic parameters based on geometric characteristics only. One of the first attempts to obtain models for
and
Y was the investigation by Miguel [
18], who obtained the expressions:
; and
. In a recent work [
1], we showed that these equations do not fit well to the IPS performance, and one of the main reasons is that Miguel [
18] used data from different types of screens (8 IPS with rectangular pores and circular section wires; and 6 shade screens with irregular pores and flat fibers), thus not being appropriate to obtain generalised models. In a porous medium, the permeability
can be expressed as a function that depends on the porosity and the diameter of the fibres/yarns, by using the Kozeny equation [
23]:
where
is a constant that depends on the porous medium. From this equation, Lopez et al. [
1] obtained a novel expression to estimate
as a function of the two-dimensional porosity and thread diameters:
The inertial factor
Y can be expressed as a function that depends on the diameter of the fibres of a porous medium and the size of the pore [
23,
27]. For an IPS, the proposed expression [
23,
27] can be used by adapting the diameter of the threads and the diameter of the inner circumference of the pores [
1]:
where
A and
B are two constants that depend on the porous medium. From this equation, Lopez et al. [
1] developed the following expression:
Both
and
Y aforementioned expressions by Lopez et al. [
1] allow to predict values much closer to the measured data (from wind tunnel tests) compared to the predicted values from Miguel [
18] equations. These models, as all models developed in the literature, are obtained by fitting directly
and
Y data. However, despite the improvements in Lopez et al. [
1], large errors are still taking place. The present investigation aims at solving this research gap, by proposing novel models for
and
Y based on three-dimensional porosity of the screens (generalisable to any IPSs) by modelling through the coefficients of the Forchheimer equation (Equation (
2)) with three-dimensional porosity, which provide a much higher level of accuracy and demonstrates that the classical two-dimensional modelling approach is insufficient. No studies have been found in the literature in which permeability and inertial factor models have been developed to estimate the aerodynamic properties of IPSs based on 3D volumetric porosity through pressure drop coefficients. The present work is highly innovative in the characterisation of IPSs, as their aerodynamic performance can be predicted with high accuracy by means of the models proposed for permeability and inertial factor (and thus, pressure drop) in this manuscript. The models are fully parametric and interpretable. Instead of fitting models directly on observed values of permeability and inertial factor, as done by all previous authors in the literature (e.g., [
1,
3,
18,
24,
25,
26]), an innovative approach has been tested by finding models for the constants derived from the pressure drop in Forchheimer equation, and by including the three-dimensional porosity of screens. This has demonstrated to be an important contribution as the predictive accuracy of aerodynamic models is highly enhanced.
All works in the literature (specially agroengineering applications outlined in the literature review) model porosity as a 2D property, by calculating porosity as the ratio between the projected pore surface area,
, and the surface area,
:
However, as remarked in this introduction, porosity is actually a 3D (volumetric) property. An accurate estimation of volumetric porosity can be achieved by calculating the volume ratio of the pore thorough the complex geometry:
where
is the volume of the pore, and
is the total volume. Therefore, the present investigation is of high relevance in the prediction of the performance of screens without even requiring to test them experimentally, which is also an important contribution to design
a la carte IPSs, according to a desired performance and exclusion of insects/objects of a specific size. The impact of this in terms of applications is quite large, from ventilation of greenhouses or homes, to protective mesh for gas turbine compressors [
28] or control of turbulence intensity [
29].
This manuscript is structured as follows. In
Section 2, the mathematical approach to estimate the three-dimensional shape of the screen and the estimation of volumetric porosity is introduced. In
Section 3 the models are developed and applied to estimate the behaviour of real-life insect-proof screens, showing the outstanding performance with respect to previous literature to estimate permeability and inertial factor. A discussion section can be found in
Section 4. Finally, in
Section 5, the conclusions from this work are given.
2. Insect-Proof Screen Model and Estimation of 3D Porosity
The model for inextensible, incompressible and round cross-section interlaced threads was first introduced by Peirce [
30]. This model assumes no deformation, which is a good approximation since the threads in typical daily applications are made of hard plastic (usually High-Density Polyethylene in greenhouses applications [
31]). The model developed by Peirce is adapted to measurements of IPSs in the present work to make it fully dependent on measurable quantities (thread spacings, thread diameters, and thickness). The full set of equations consists of seven non-linear equations with eleven parameters (unknowns), from which at least seven must be measured/known to solve the system:
where
is the spacing between centres of threads (
),
is the fractional crimp,
is the total length of the thread,
are the contact angles/inclination of the central straight part of the threads,
is the horizontal spacing of threads,
is the angle with respect to the horizontal plane, and
is the vertical displacement of the threads. The subscript
is used to differentiate the warp and weft threads by their coordinates (see
Figure 2). All the dimensions are relatable by trigonometric relations, not shown in this work for the sake of simplicity, but we suggest the reader to see [
17] for further details.
By solving the non-linear set of Equations (
9)–(
13), Equation (
8) can be further developed. The calculation of the volumetric porosity can be then finally written as:
where
and
are measurements, and
and
are obtained from the calculations. Equation (
14) represents a function to connect all the required geometric parameters to know the volumetric porosity analytically. Although there are few softwares out there to obtain certain geometric characteristics of the screens and their two-dimensional porosity [
14], the only software in the literature to obtain the three-dimensional porosity is Poro3D v1.0 [
16]. From certain geometric inputs, this software estimates the volumetric porosity of screens, as well as the 3D representation of the interlaced threads, as shown in
Figure 1.
3. Modelling Results
A total of 31 IPSs have been used in this work. Different steps were necessary to develop the models. First, the two-dimensional geometric characteristics have been obtained by using the Euclides software [
14]. Second, in order to calculate the three-dimensional porosity, it is necessary to know the thickness of the IPSs. The thickness was measured with non-contact measuring equipment (non-contact optical measurement) [
1]. Third, the 31 IPSs were tested experimentally in a low-speed wind tunnel, by obtaining the values of the parameters
a and
b from Equation (
1), and determining the values of
and
Y for each IPS, by following the approach explained in Lopez et al. [
1].
Table 1 and
Table 2 present the geometric and aerodynamic characterization of the 31 IPS, respectively. Pressure drop caused by the presence of the insect-proof screens has been measured experimentally in a wind tunnel designed&manufactured at the University of Almeria [
1,
20,
32]. The wind tunnel is 4.74 m long, with a diameter test section of 0.388 m. For each IPS, three tests were carried out with three random samples. To measure the pressure drop, two Pitot pipes (Airflow Developments Ltd; 4 mm of diameter) and a differential pressure transducer SI727 (Special Instruments; operational range of 0–200 Pa and accuracy of ±0.25%) were used. To measure the velocity and temperature of air, a hot-wire anemometer EE70-VT32C5 (Elektronik Engerwitzdorf, measurement range of 0–10 m s
and 0–50
C; accuracy of ±0.2 m s
+ 2% of measuring value and ±0.2
C) was used. For further information on the wind tunnel characteristics, please see [
21].
As outlined before, the main purpose of the present investigation is to improve the classical modelling based on two-dimensional data only by adding a three-dimensional estimation of porosity. In
Figure 3, the 2D and 3D characteristics of the 31 IPSs are explored by the projected pore area vs exact 3D area of screens according to [
33] (
Figure 3a) and the 2D vs. 3D porosities (
Figure 3b). In these Figures, it can be seen that the variation of two-dimensional parameters is different from the variation of three-dimensional parameters amongst the same screens. There may be scenarios in which two screens with equal two-dimensional geometric parameters, when compared to three-dimensional geometric parameters, are actually different. For instance, two IPSs that have the same two-dimensional porosity but different thicknesses may have a different effect on the airflow through them, since they present different three-dimensional porosity characteristics [
17]. Thus, the conclusion is that the real porosity (three-dimensional) is not the same between these two IPSs, and thus the performance cannot be the same, as always considered in previous literature.
3.1. 3D-Based Permeability Model for Insect-Proof Screens
Permeability is one of the most influential aspects in the estimation of the aerodynamic performance of screens, as denoted in the Forchheimer equation (Equation (
2)). In Lopez et al. [
1] a new model for the permeability of insect-proof screens was proposed, which had a very acceptable performance. This model has the form in Equation (
4), where
stands for the average diameter of the threads and
stands for the two-dimensional porosity. The model demonstrated to be a much more accurate option than the models provided in [
18] (dependent solely on two-dimensional porosity
). However, the models proposed in Lopez et al. [
1], still have room for improvement. In their work, the modelling was focused on experimental
data directly by improving the empirical
equation previously suggested by Kozeny (Equation (
3)). Although this is a good approach, they omitted an interesting and relevant point: since the observed (experimental) values of
are originally obtained from using experimental pressure drop data and substitution in the Forchheimer equation (see Equation (
2)), it is smarter to find a way to estimate the Forchheimer equation coefficients directly. Moreover, a volumetric estimation of porosity would be more accurate than a superficial one. Thus, in the present work, an improvement on the permeability model is suggested, in terms of estimation (directly modelling the Forchheimer equation coefficients) and modelling porosity as a three-dimensional property.
The suggested
model is of the form
, either denoted as
or
depending on the chosen porosity
:
where a linear fit with coefficients
was tested succesfully for
b. The only coefficient involved in the
equation is
b, and to model this coefficient is a much better option than modelling
observed values as in the previous literature because we have observed a very strong linearity in this estimated coefficient in
fits (see
Figure 4). This is an important improvement, because to model a linear behaviour is always less prone to errors and usually much more generalisable. This
model was tested for
being either a two-dimensional (
) or three-dimensional porosity (
). Similarly to the model in Equation (
4), the two-dimensional approach to porosity provided a model
that failed at predicting
for the two values of highest superficial porosity (
and 17), see outliers in
Figure 5. However, the use of the three-dimensional porosity led to a very promising model
for permeability. This model outperforms by far the one given in Lopez et al. [
1], which had a
. The new model yields an outstanding
, with the fitting constants:
. The coefficients are estimated by means of a non-linear least squares algorithm [
34] with a tolerance of 10
and a maximum of 1 × 10
iterations, to ensure a converged solution to the inverse problem. The mean relative errors in the prediction (
) were
and
, respectively. Must be outlined that despite other more mainstream methods such as deep learning neural networks or similar could be deployed and possibly better predictions could be found, this is not a recommended practice when looking for models in engineering, since these deep learning models are like black-boxes [
35] and nobody knows how to interpret the underlying relations between variables because of the impenetrability [
36,
37]. Actually, in certain fields of finance, these models are forbidden by regulators because they are not interpretable [
38]. Researchers are spending great efforts into making it more interpretable [
39], but this is still (and perhaps will always be) an issue. Our proposed parametric equations are low degree polynomials, which also guarantee no overfitting, another potential inconvenient in other mentioned methods.
Therefore, the new proposed model for
can be written as:
This model is simpler than previous works in the literature (see, for instance [
1,
18,
23]), and surpassed the predictive performance of the best model to date, the one proposed in Lopez et al. [
1]. From
Figure 5 can be seen the performance of the
model with two-dimensional (
Figure 5a) and three-dimensional porosity (
Figure 5b). To use two-dimensional porosity has been found very unacceptable in our proposed model, as
Figure 5a shows two screens very far from the trend (
and 17, the ones with highest porosity), one of them even yielding a non-positive value for permeability. But even more surprisingly, also in the model proposed by Lopez et al. [
1], those screens are also appearing as outliers in
Figure 5b. However, when the three-dimensional porosity is used in the development of our proposed model, most screens lay within a
error band. Thus, it is evident that the use of
in the models is wrong and leads to misleading models. Next, to fully describe the aerodynamics of IPSs, the inertial factor
Y must be also modelled including the three-dimensional porosity as parameter.
3.2. 3D-Based Inertial Factor Model for Insect-Proof Screens
The modelling scenario for the other parameter necessary to characterise the aerodynamics of these screens, the inertial factor
Y, has been frequently considered independent from
in the literature. For instance, in [
1] a new model for
Y was validated (Equation (
4)). Similar models are actually found in other works from the literature such as Betchen et al. [
40], where a model
is suggested, where
and
stand for the coefficients of the model. The model in Equation (
6) suggested in Lopez et al. [
1] provided superior performance to the models also shown in Miguel [
18]. However, as observed e.g., in the review on non-Darcy coefficients (equivalent to inertial coefficients) shown in Li & Engler [
41], some scientists observed that
Y has strong relation with
and
and included this term in their empirical correlations for
Y. Thus, the correlation model given in Equation (
6) from Lopez et al. [
1] can be improved by including more influential parameters in the modelling. In [
1] is also suggested from fitting the Forchheimmer equation with experimental data that
Y can be written as:
where
a is the fitting constant in the term of
of the Forchheimmer equation and
is the fluid density. By using the model found in Equation (
15), the equation can be rewritten as:
Thus the expression can be only dependent on porosity and geometry if the
a coefficient is modelled suitably. For this aim, the coefficient has been modelled by means of relations of
, and the diameter ratio
as in Equation (
6). After testing several combinations, the best equation to model
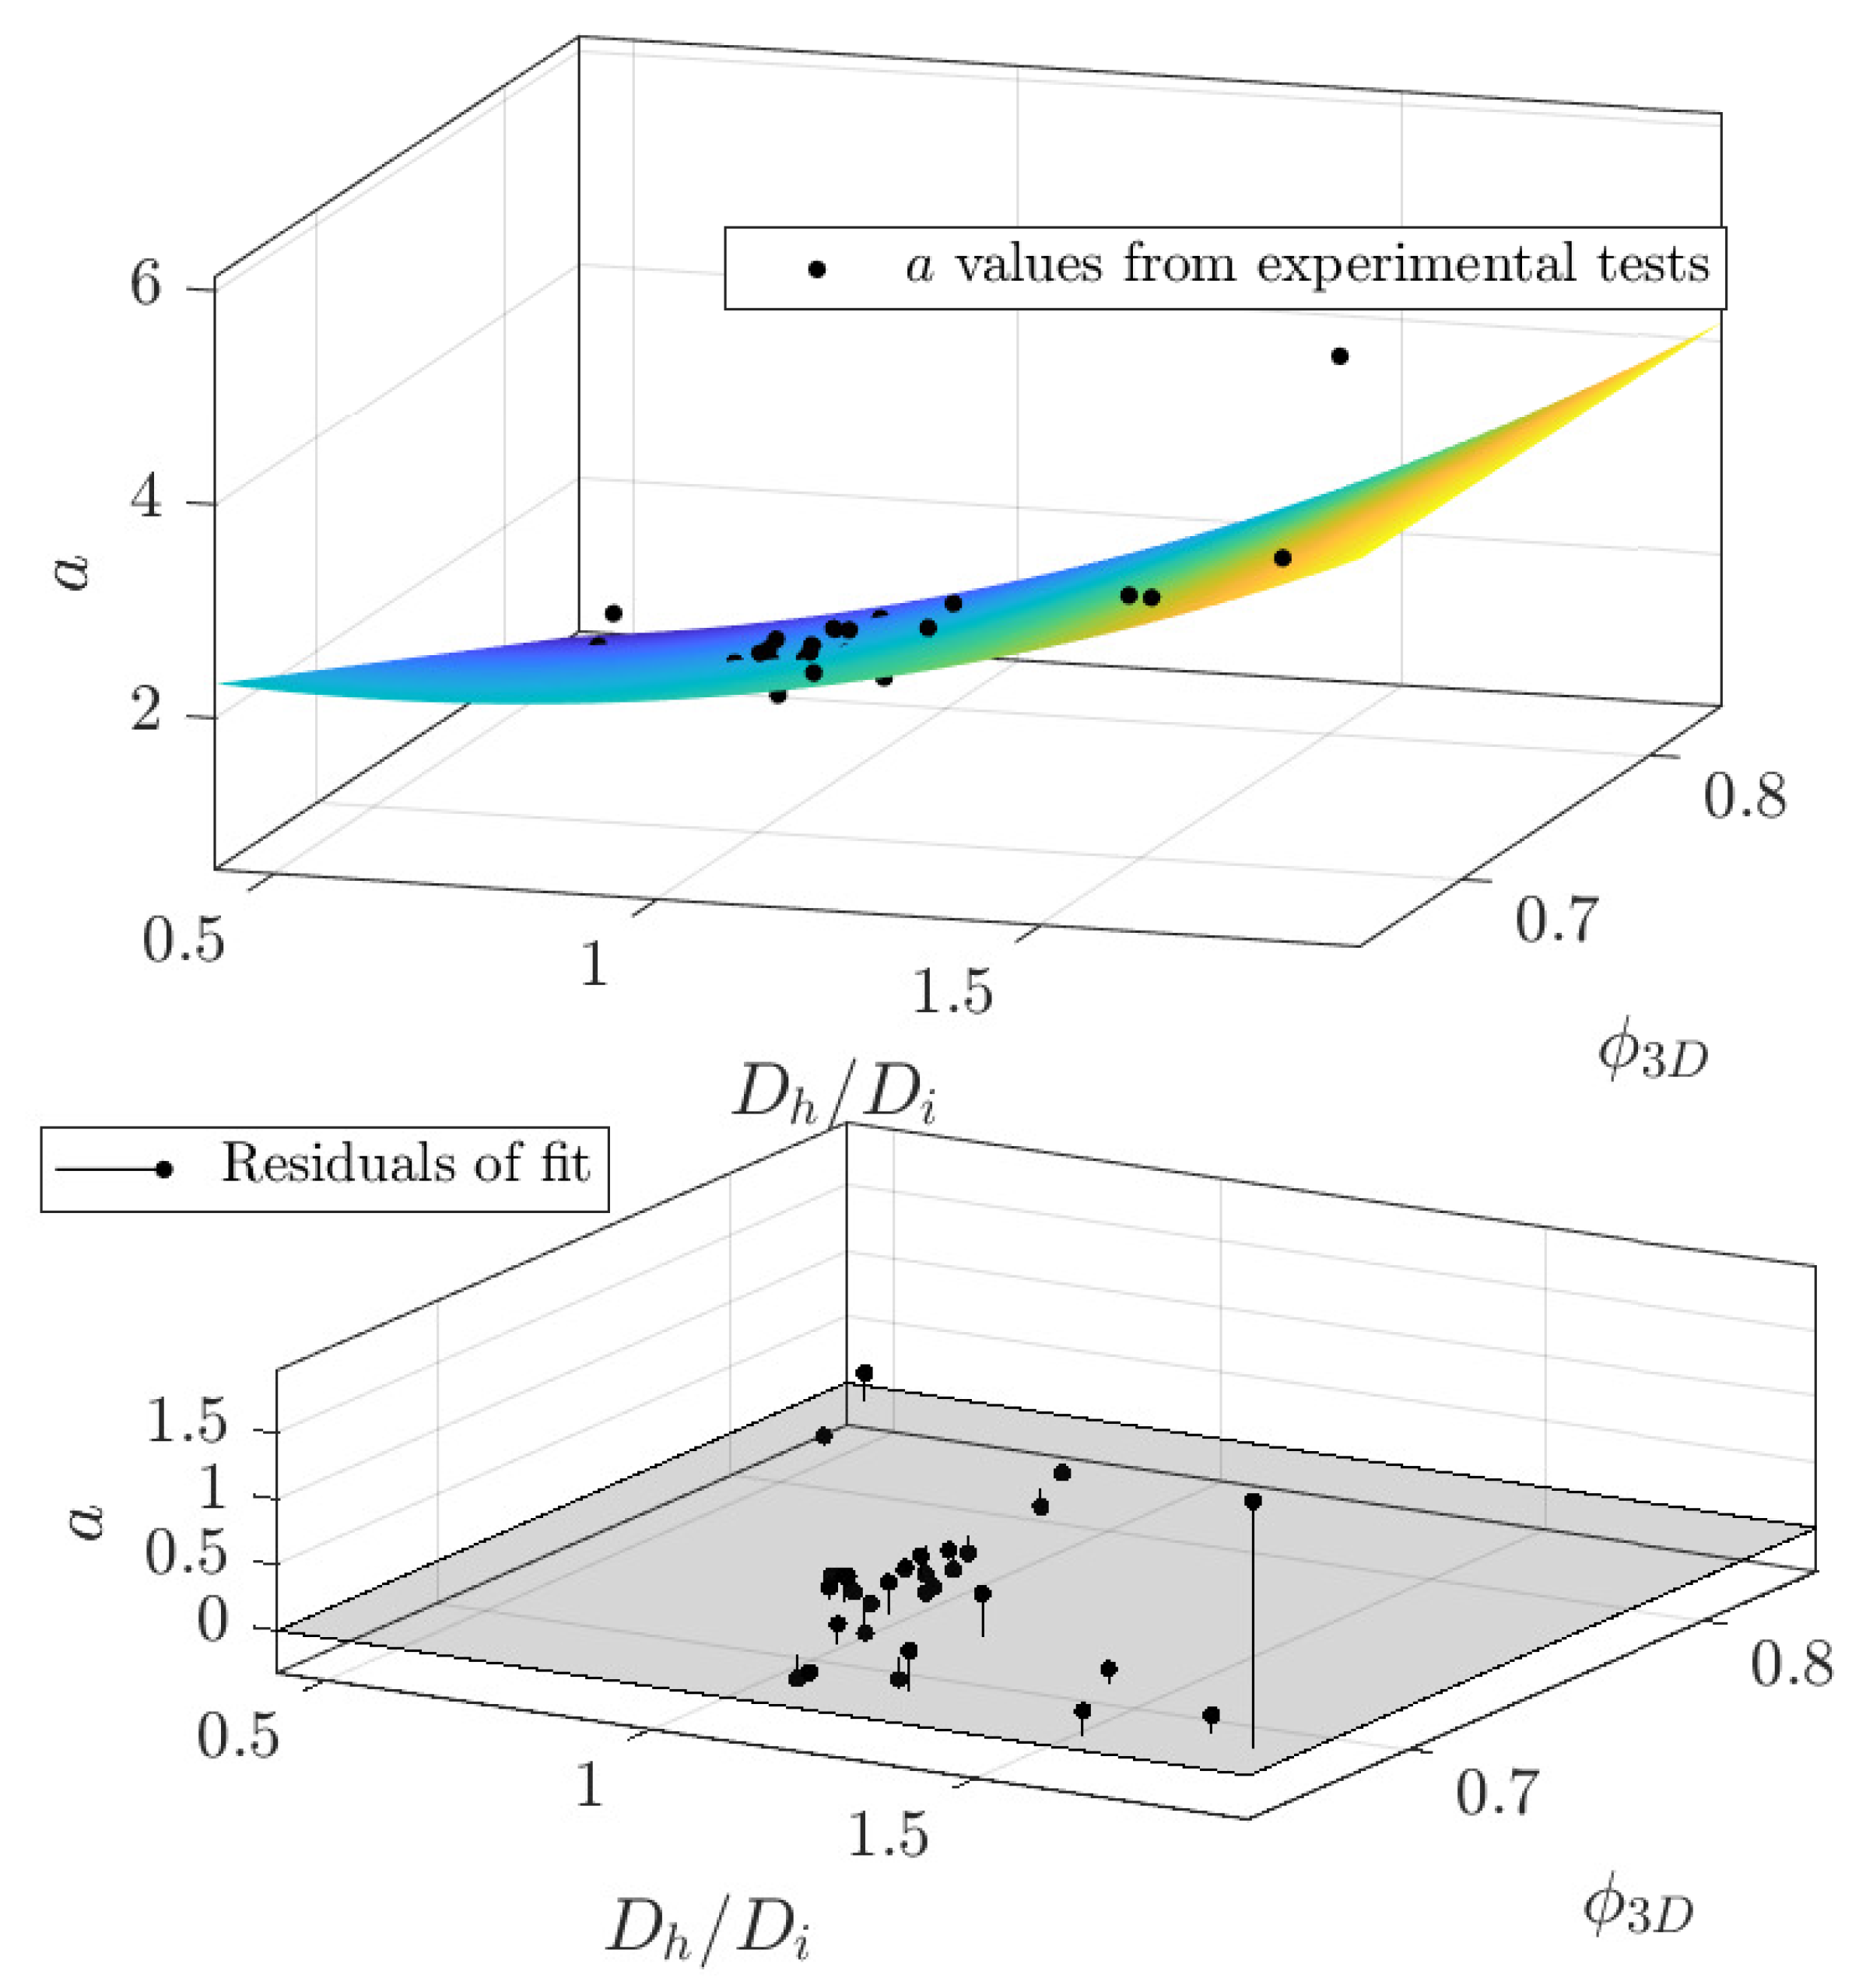
a has been selected as a second degree polynomial for
and first degree for
, plus a nonlinear interaction between both variables:
where
are the fitting coefficients. The coefficients are estimated by means of a Levenberg-Marquardt nonlinear least squares algorithm [
34,
42] with a tolerance of 1E-6 and a maximum of 400 iterations and 600 function evaluations. The fitness function is shown in
Figure 6, whose fitting coefficients are:
Must be outlined that, since the proposed model actually depends on
, the prior modelling errors are propagated to the new prediction, being difficult to improve the model for
Y from this base. Actually, the
goodness of fit for the
a coefficient according to Equation (
19) and shown in
Figure 6 reaches a
. The goodness of fit could even reach a
if the highest residual in
Figure 6 is deleted, but it is kept in the analysis for consistency reasons. The model found for
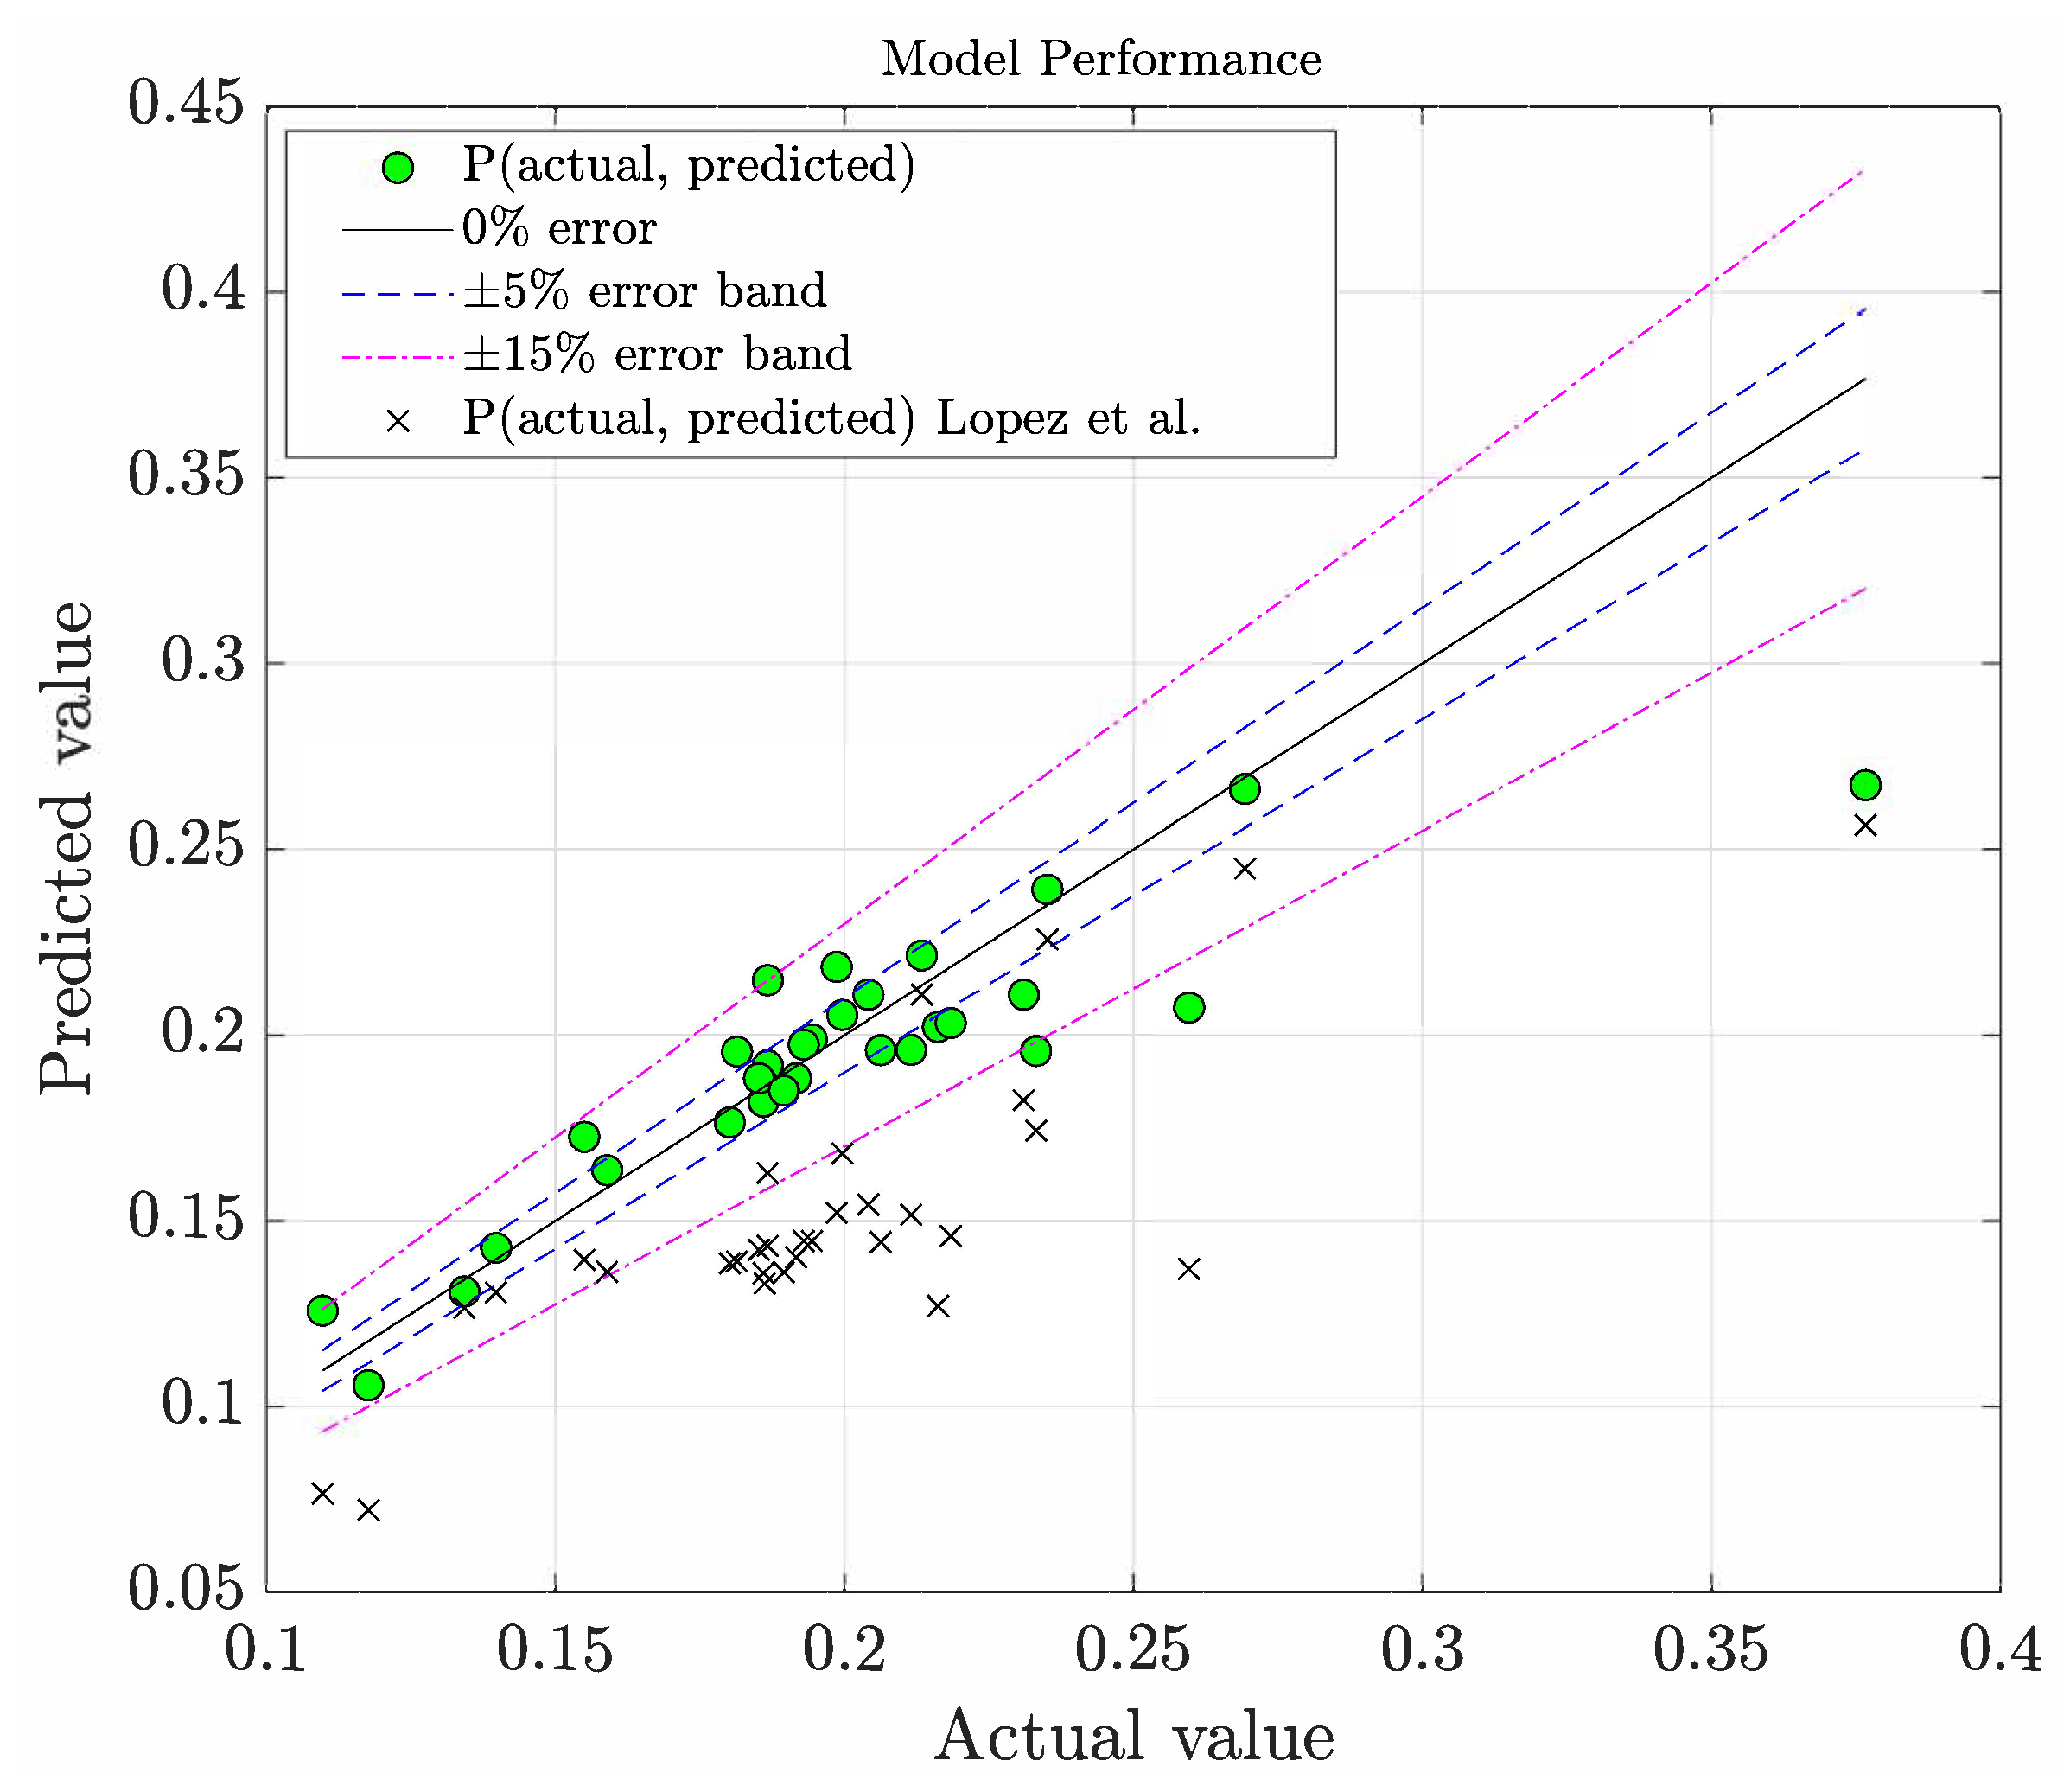
Y has a mean relative error in the prediction of
only and the performance is shown in
Figure 7 against predictions by the
Y model published in Lopez et al. [
1].
In
Figure 7 can be seen that the performance of our proposed model is outstanding, with most data within the
error band, whilst most predictions of Lopez et al. [
1] lay outside the
error band. Thus, the new equation for
Y enables a relationship
, from a
two-step modelling (
was previously modelled) which clearly outperforms the model given in Equation (
6) from Lopez et al. [
1]. An important improvement we did with respect to the model given in Lopez et al. [
1] (as well as those provided in Nield & Bejan [
23], Miguel [
18], Beavers et al. [
27], and Ergun [
43]), is that our proposed model is dependent on porosity, which is a parameter of strong influence in the inertial factor, whilst the equation provided in Lopez et al. only depends on
and
(Equation (
6)). Therefore, generally speaking, since it is very intuitive that the inertial factor has strong dependence on the said parameters (thickness of the screen, density, viscosity, average diameter of threads, inner circumference diameter of the pore, and porosity), we can undoubtedly say that our new proposed model for
Y is more descriptive of the actual values and provides a more complete explanation of this parameter by adapting more to reality.
4. Discussion
The present work has been focused on the improvement of models for the two most influential parameters in the modelling of pressure drop of flow-past-screens: permeability and inertial factor. Pressure drop can be modelled as a second degree polynomial, as shown in Equation (
2), thus a nested-like model approach has been intended to model the pressure drop coefficients aiming to find good models to estimate permeability and inertial factor.
To model permeability, it has been observed that the diameter of the inner circumference of the pore
is a very good candidate for the model, as done in [
1]. Other pore and thread related parameters such as the average diameter of threads
, the
thread ratio, or the
ratio have been tried as model parameter, but these performed considerably worse than
. It was also very relevant the improvement found when a three-dimensional porosity was used as model parameter instead of the two-dimensional one. Specially because there are some IPSs performances which are difficult to be predicted, possibly because the duality found in the thickness: two screens may have the same 2D porosity, but different thickness, which leads to different pressure drop. Therefore, a model dependent on two-dimensional quantities may struggle to predict the performance of certain screens.
For the inertial factor, it has been investigated that to add porosity as model parameter is of strong importance. This is in contrast to other previous works, which modelled this parameter with simpler parameter relations, and did not include porosity nor permeability as relevant features (see, for instance, Equations (
5) and (
6)). It was obvious to us that permeability must be included, since
Y is actually defined upon this parameter in the Forchheimer model in Equation (
2). In addition, it was also clear to us that porosity should be included in the model of
Y, and the outstanding modelling results obtained form this investigation confirmed this guess. To model the inertial factor, it is necessary to use the permeability model and a model for the
a coefficient. Despite of the expected propagation of modelling errors, it is very surprising that this new model outperforms by far the best model to date from the literature, as seen in
Figure 7.
To sum up, the new models for and Y based on the three-dimensional porosity of screens provide an important contribution to the characterisation of screens, as they allow to estimate the aerodynamic performance of IPSs with high accuracy. Both models are based on relevant parameters, and are fully parametric with no black-box predictions as deep learning algorithms do, being often the performance quite obscure as it is not possible to interpret what happens inside the decision algorithms.
5. Conclusions
This investigation has been focused on the development of novel models for permeability
and inertial factor
Y, for the characterisation of the performance of insect-proof screens (IPSs) as a three-dimensional porous medium. Instead of fitting models directly on observable training data values of
and
Y (as done by all previous authors in the literature), a smarter approach was carried out, which was based on focusing the modelling efforts on finding models for the constants in the pressure drop of Forchheimer equation. This modelling approach includes the three-dimensional porosity as modelling parameter for the first time, since the software Poro3D [
16,
17] allows to obtain this parameter analytically for any screen.
The combination of all these aspects has led to models that obtain much better predictions than the existing ones by Lopez et al. [
1] in the literature, which are the best to date. In the performance of the proposed models for
, it has been observed that the new models have most data within a
error band (the relative error of this proposed model is a 14.34%), whilst the model introduced in Lopez et al. [
1] has only few data within this error band. In terms of
Y, the predictive performance of our proposed model is even more outstanding (even though it is a two-step modelled parameter upon the
model), with only two predictions out of 31 laying outside the
error band, and most data within the
error band; whilst most predictions of Lopez et al. [
1] laid outside the
error band. Another important aspect in our proposed model for
Y is that this model combines more relevant parameters in the inertial factor dynamics than previous models in the literature, which were too simple (the vast majority of them not even dependent on porosity nor permeability).
The performance of the suggested models is, therefore, an important contribution in the field, since more reliable characterisation of insect-proof screens could be developed. This means that their aerodynamic characteristics can be even predicted before fabrication at design stages. A limitation of the present work is that the size of the training data set could be increased with more different geometries of screens by means of an extensive experimental study. In our opinion, to study experimentally at least 1000 screens could lead to models built upon more geometries and, therefore, one can be more confident with the generalisation of these models. A future study collecting such information could be useful to update the model coefficients of the models suggested in the present work.


 ,
, 


