Article

Patterns of Influence of Meteorological Elements on Maize Grain Weight and Nutritional Quality

College of Agronomy, Inner Mongolia Agricultural University, Hohhot 010019, China
*
Authors to whom correspondence should be addressed.
Agronomy 2023, 13(2), 424; https://doi.org/10.3390/agronomy13020424
Submission received: 8 November 2022 / Revised: 14 January 2023 / Accepted: 17 January 2023 / Published: 31 January 2023
(This article belongs to the Topic Crop Ecophysiology: From Lab to Field)

Abstract

:
Meteorological factors are one of the important factors that determine maize kernel weight and grain nutritional quality. Analyzing the influence of meteorological factors before and after anthesis on maize kernel weight and nutritional quality components is of great significance for improving corn yield and quality. Therefore, five different maize hybrids and conducted continuous experiments from 2018 to 2021 were selected in this study, to explore the response of maize kernel weight and grain nutritional quality to meteorological factors in different growth periods, and to quantify the linear relationship between grain nutritional quality parameters, grain weight, and meteorological factors. The main results were as follows: the 100-grain weight reached the maximum value of 39.53 g in 2018; the contents of crude protein, total starch, and crude fat in grains reached the maximum in 2018, 2020, and 2018, respectively, which were 9.61%, 69.2%, and 5.1%. Meteorological factors significantly affected the maize grain weight (p < 0.05). Before anthesis, total sunshine duration, average temperature, relative humidity, and the accumulated temperature had strong effects on grain weight. After anthesis, average daily temperature, total rainfall, temperature difference, accumulated temperature, average daily highest temperature, and total sunshine hours had strong effects on grain weight. There was also a significant correlation between grain weight and grain nutritional quality components (p < 0.05). The multivariate polynomial equation analysis revealed that further potential for maize grain weight could be exploited by adjusting the content of each quality component of the kernels under the current test conditions. Meteorological elements can indirectly affect the 100-grain weight through their relationship with the nutritional quality of the grains, with accumulated temperature before anthesis, average temperature after anthesis, and accumulated temperature after anthesis having the greatest indirect effect on the 100-grain weight. Therefore, the effects of pre-anthesis accumulation temperature, post-anthesis average temperature, and post-anthesis accumulation temperature on the nutritional quality of the grains can be harmonized by the application of hybrids of different lengths of vegetation and by adjusting the sowing time in agricultural production. Ultimately, maize grain weight can be increased on the basis of optimizing the content of various quality components in the grains.

1. Introduction

With the improvement of people’s living standards, the requirements of crop yield and quality have become higher and higher. As a multi-purpose crop and as the largest grain crop in China, maize’s yield and nutritional quality are related to the food security of the country and the quality of life of residents [1,2]. The grain weight of maize is closely related to the grain nutritional quality attributes, and different nutritional components make crop grain weight different. Generally, the starch content, protein content, and oil content of maize grains at the physiological maturity stage are 60–72%, 8–11%, and 4–6%, respectively [3], and the yield and quality are greatly affected by environmental conditions [4,5,6]. Yu et al. [7] concluded that the balanced use of pre-anthesis and post-anthesis heat resources in heat-limited areas and achieving adequate accumulation of pre-anthesis population biomass are key. In heat-rich areas, tapping into post-anthesis material production, building suitable density populations, and delaying post-anthesis leaf senescence are central. According to the study of Tao et al. [8], photosynthesis will be inhibited under high temperature stress, which will reduce the supply of photosynthates to grains, leading to a significant decrease in grain weight and even grain yield. Babel et al. [9] found that the impact of climate change on maize yield per unit area could be alleviated by supplementary irrigation and adjustment of sowing date, and a 16-day earlier sowing date is expected to increase the yield by 17.9%. Walne et al. [10] believe that biomass resources are preferentially distributed in roots under low temperature and in leaves under high temperature, and the optimal temperature for root growth is lower than that for root development and aboveground growth and development. Lu et al. [11] showed that drought would reduce the content of starch and increase the content of crude protein in the grain of many crops. During the period from anthesis to grain filling, adequate irrigation can also improve the grain yield and protein content of maize, and the appropriate low temperature is conducive to the increase of the crude fat content of maize, at this stage [12]. Barutcula et al. [13] found that water stress at grain filling stage reduced grain yield, but had little effect on grain protein and oil content, while Ali et al. [14] believed that water stress would increase grain crude fat content, at later vegetative growth stage. In addition, environmental temperature also affects grain nutritional quality. Yang et al. [15] found that heat stress in maize could inhibit grain weight and grain starch accumulation by reducing starch synthetase activity, and increase grain protein content by increasing glutamate synthetase activity. Mayer et al. [16] found that extreme high temperature could change the protein composition of grain endosperm by increasing the relative abundance of glutelins and β-plus γ-zeins and decreasing the relative abundance of α-zeins. The above research results showed that climate factors had a significant impact on maize yield and quality, but the previous findings were mostly single meteorological elements within one to two years and under abnormal climate conditions, and the formation of crop yield and quality was the result of the interaction of multiple meteorological factors under normal climate conditions.
In order to define the relationship among meteorological factors, grain weight, and grain nutritional quality, this study was carried out in a continuous monitoring trial at the same location for four years. The effects of meteorological factors on maize grain weight and grain nutrient quality were analyzed, and the quantitative relationship between nutrient quality components of grain and grain weight and meteorological factors was determined at the same time. It provides an important basis for the adoption of rational cultivation methods to harmonize meteorological elements, grain weight, and nutritional quality of the grains in the agricultural production process and to make better use of climatic resources.

2. Materials and Methods

2.1. Description of Research Location

Field experiment were carried out at the Tumet Right Banner Experimental Station of the Inner Mongolia Agricultural University, China (40°59′51″ N, 110°57′76″ E) during 2018–2021. The soil type of the test field was sandy loam, and the 0–30 cm soil layer basic fertility of the test area during the test is containing 22.27 g kg−1 organic matter, 103.75 mg kg−1 available nitrogen, 15.76 mg kg−1 available phosphorus, and 219.60 mg kg−1 available potassium (pH 8.23). The previous crop was maize. Based on the pH value (determined in H
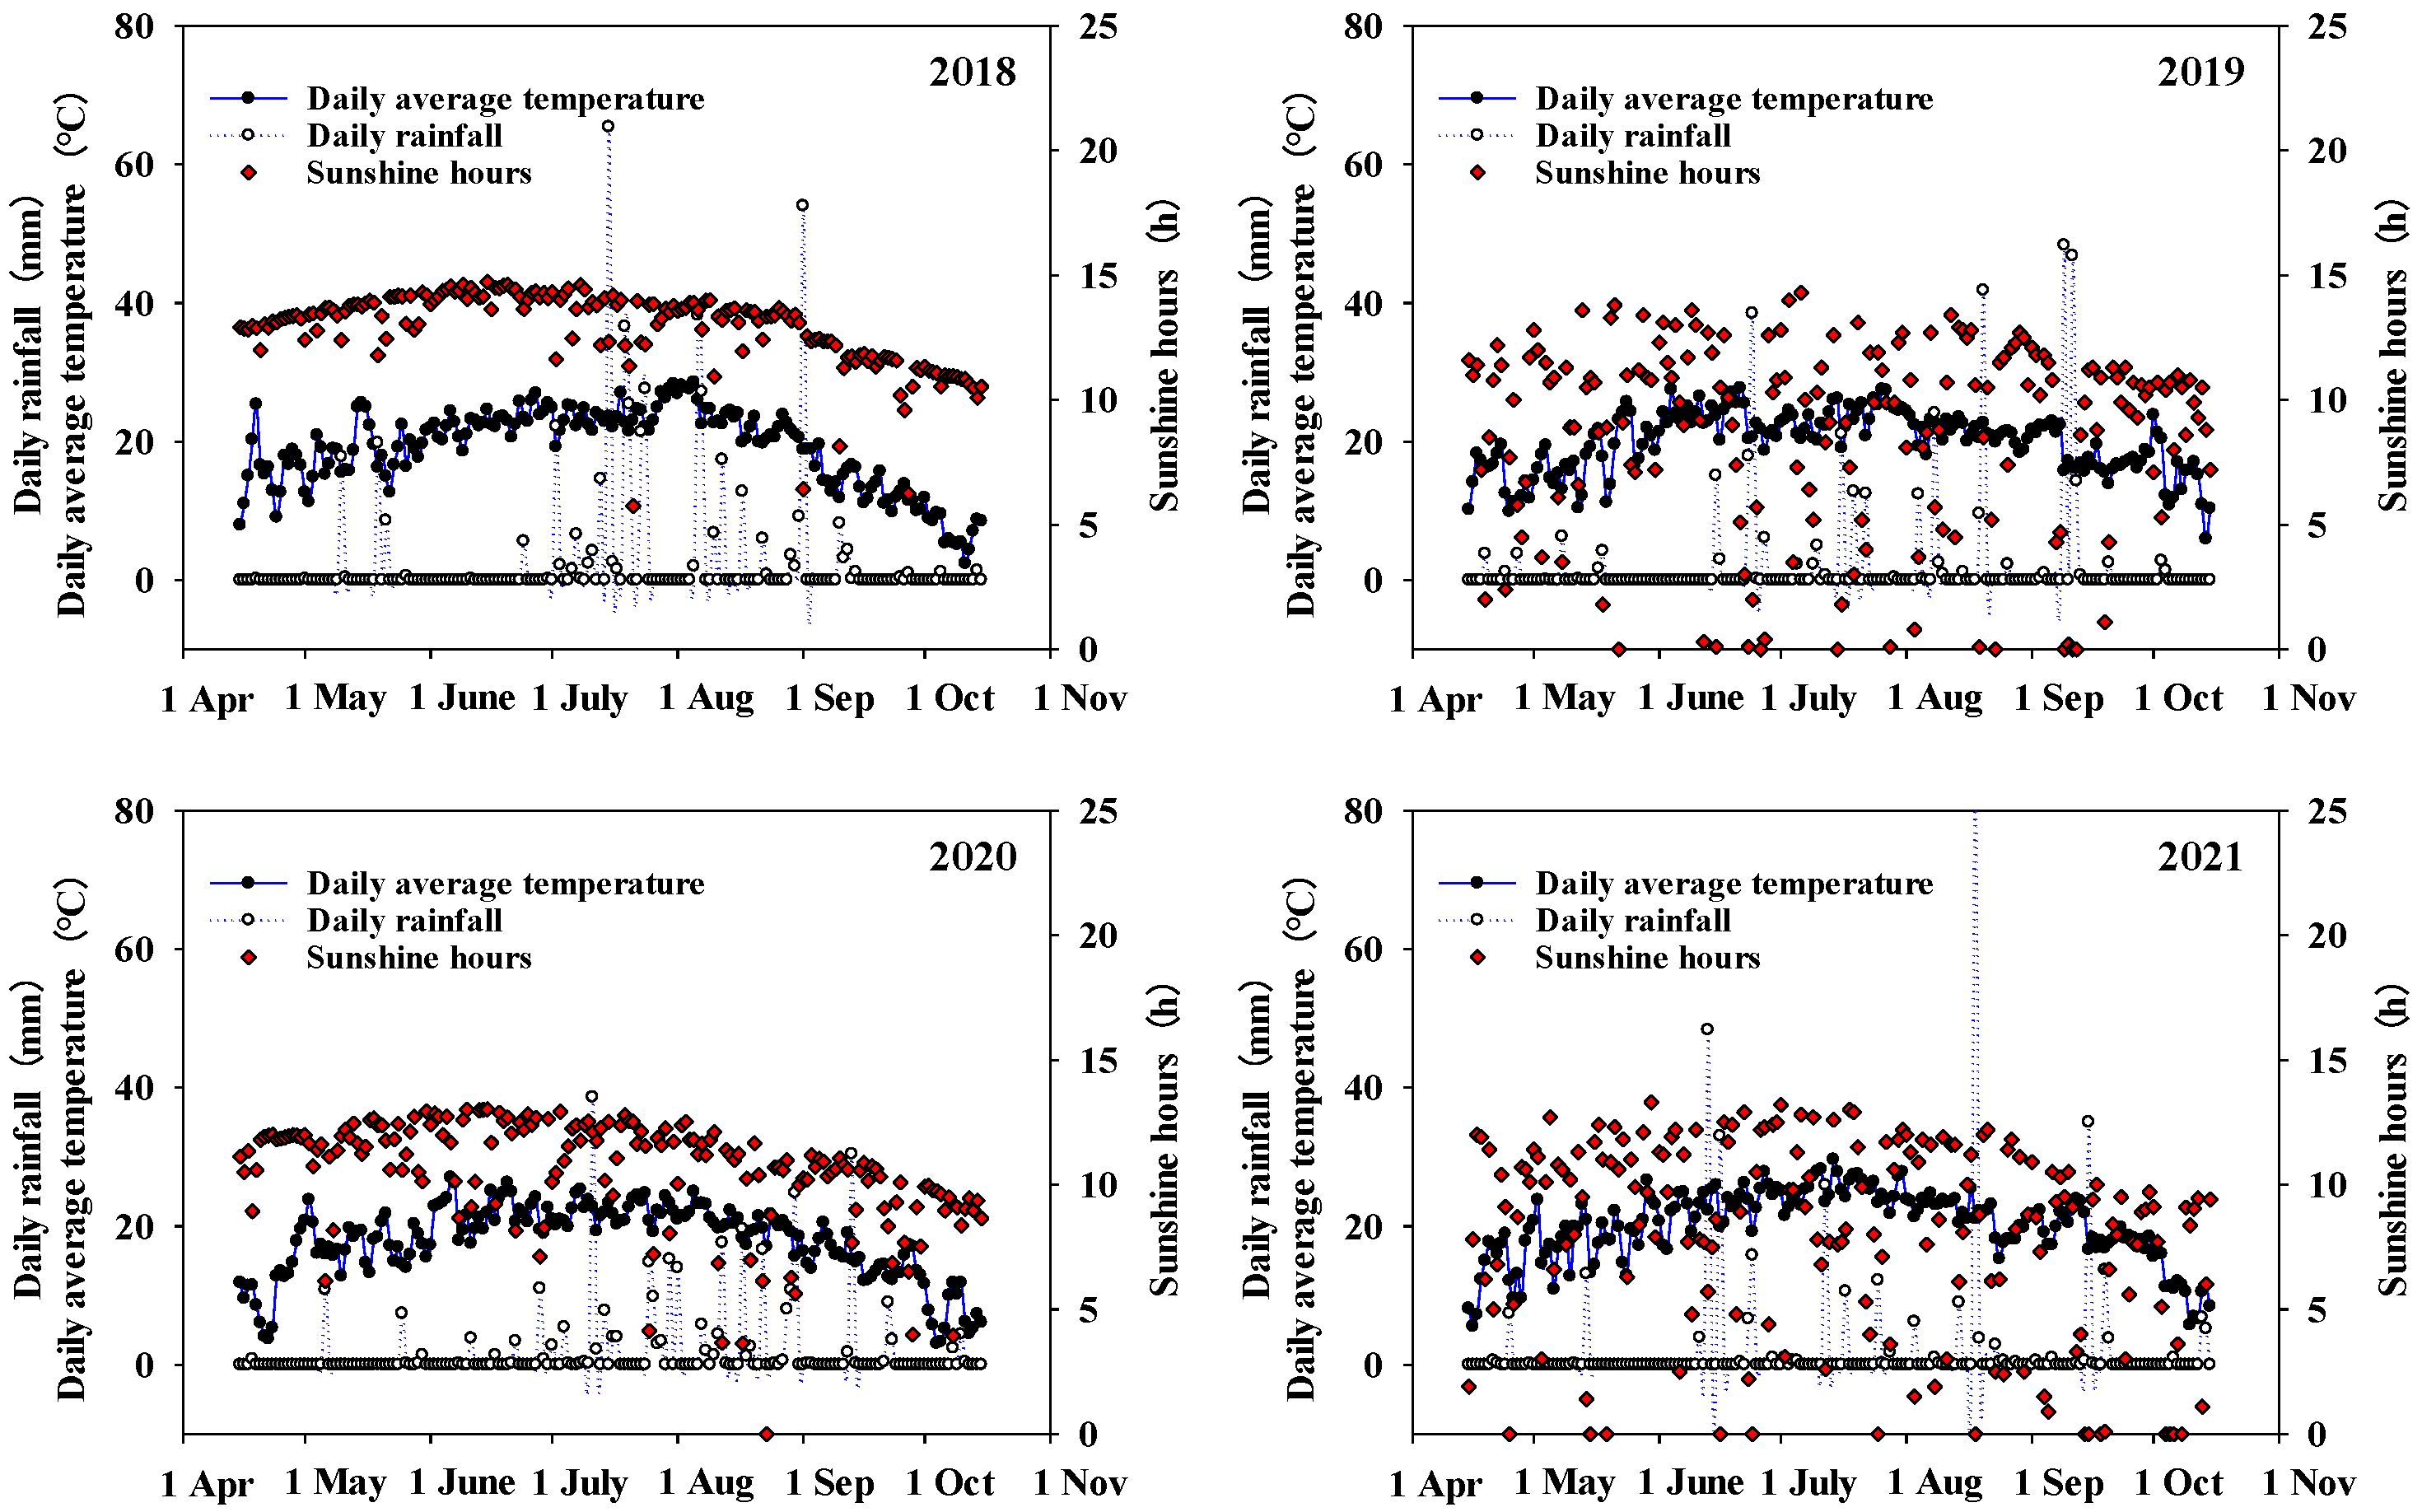
2O), the soil can be classified as alkaline. The main meteorological factors during the maize growth period are given in Figure 1, and the main growth duration of different maize hybrids is given in Table 1. The average annual accumulated temperature for maize growth was 2997.5 °C in 2013–2017, the average annual rainfall during the growing season was 343.2 mm in 2013–2017, and the average annual total sunshine hours during the growing season were 1417.0 h in 2013–2017.

2.2. Experimental Design

Five common maize hybrids, Zhongdan 2 (ZD2), Danyu 13 (DY13), Yedan 13 (YD13), Xianyu 335 (XY335), and Denghai 618 (DH618), were selected. The random block design is adopted. Each hybrid was repeated three times. The length and width of the plot are 6 m and 6 m, respectively, a plot area is 36 m2, and the total site area is 540 m2. The crops were planted with equal row spacing of 0.6 m and with 37 cm spacing between plants in a row. Soil tillage practices: subsoiling with a depth of 35 cm. The planting density was 45,000 plants ha−1. The dosages of pure N (ammonium phosphate dibasic, 18%; urea, 46%), P (ammonium phosphate dibasic, 46%), and K (potassium sulphate, 50%) were 225 kg ha−1, 210 kg ha−1, and 202.5 kg ha−1. Ammonium phosphate dibasic and potassium sulphate were applied as basal fertilizer before seeding. The proportion of nitrogen (urea, 46%) top-dressing was 30% at V6 (sixth leaf) and 70% at V12 (twelfth leaf), respectively. The trial area was irrigated with drip irrigation four times during the whole growing period: at V6, V12, R1 (silking), and R2 (blister). Each irrigation was 750 m3 ha−1. The other management measures were the same as those typically used in large-scale farming.

2.3. Meteorological Data Collection

The TRM-ZS2 full-factor automatic weather station was used to measure and record daily average temperature, total rainfall, daily average highest temperature, daily average lowest temperature, total sunshine hours, daily average relative humidity, daily temperature difference, and cumulative temperature (≥10 °C) before anthesis (s1–s8) and after anthesis (s9–s16) in the experimental area. The daily measurements were recorded.

2.4. Measurement

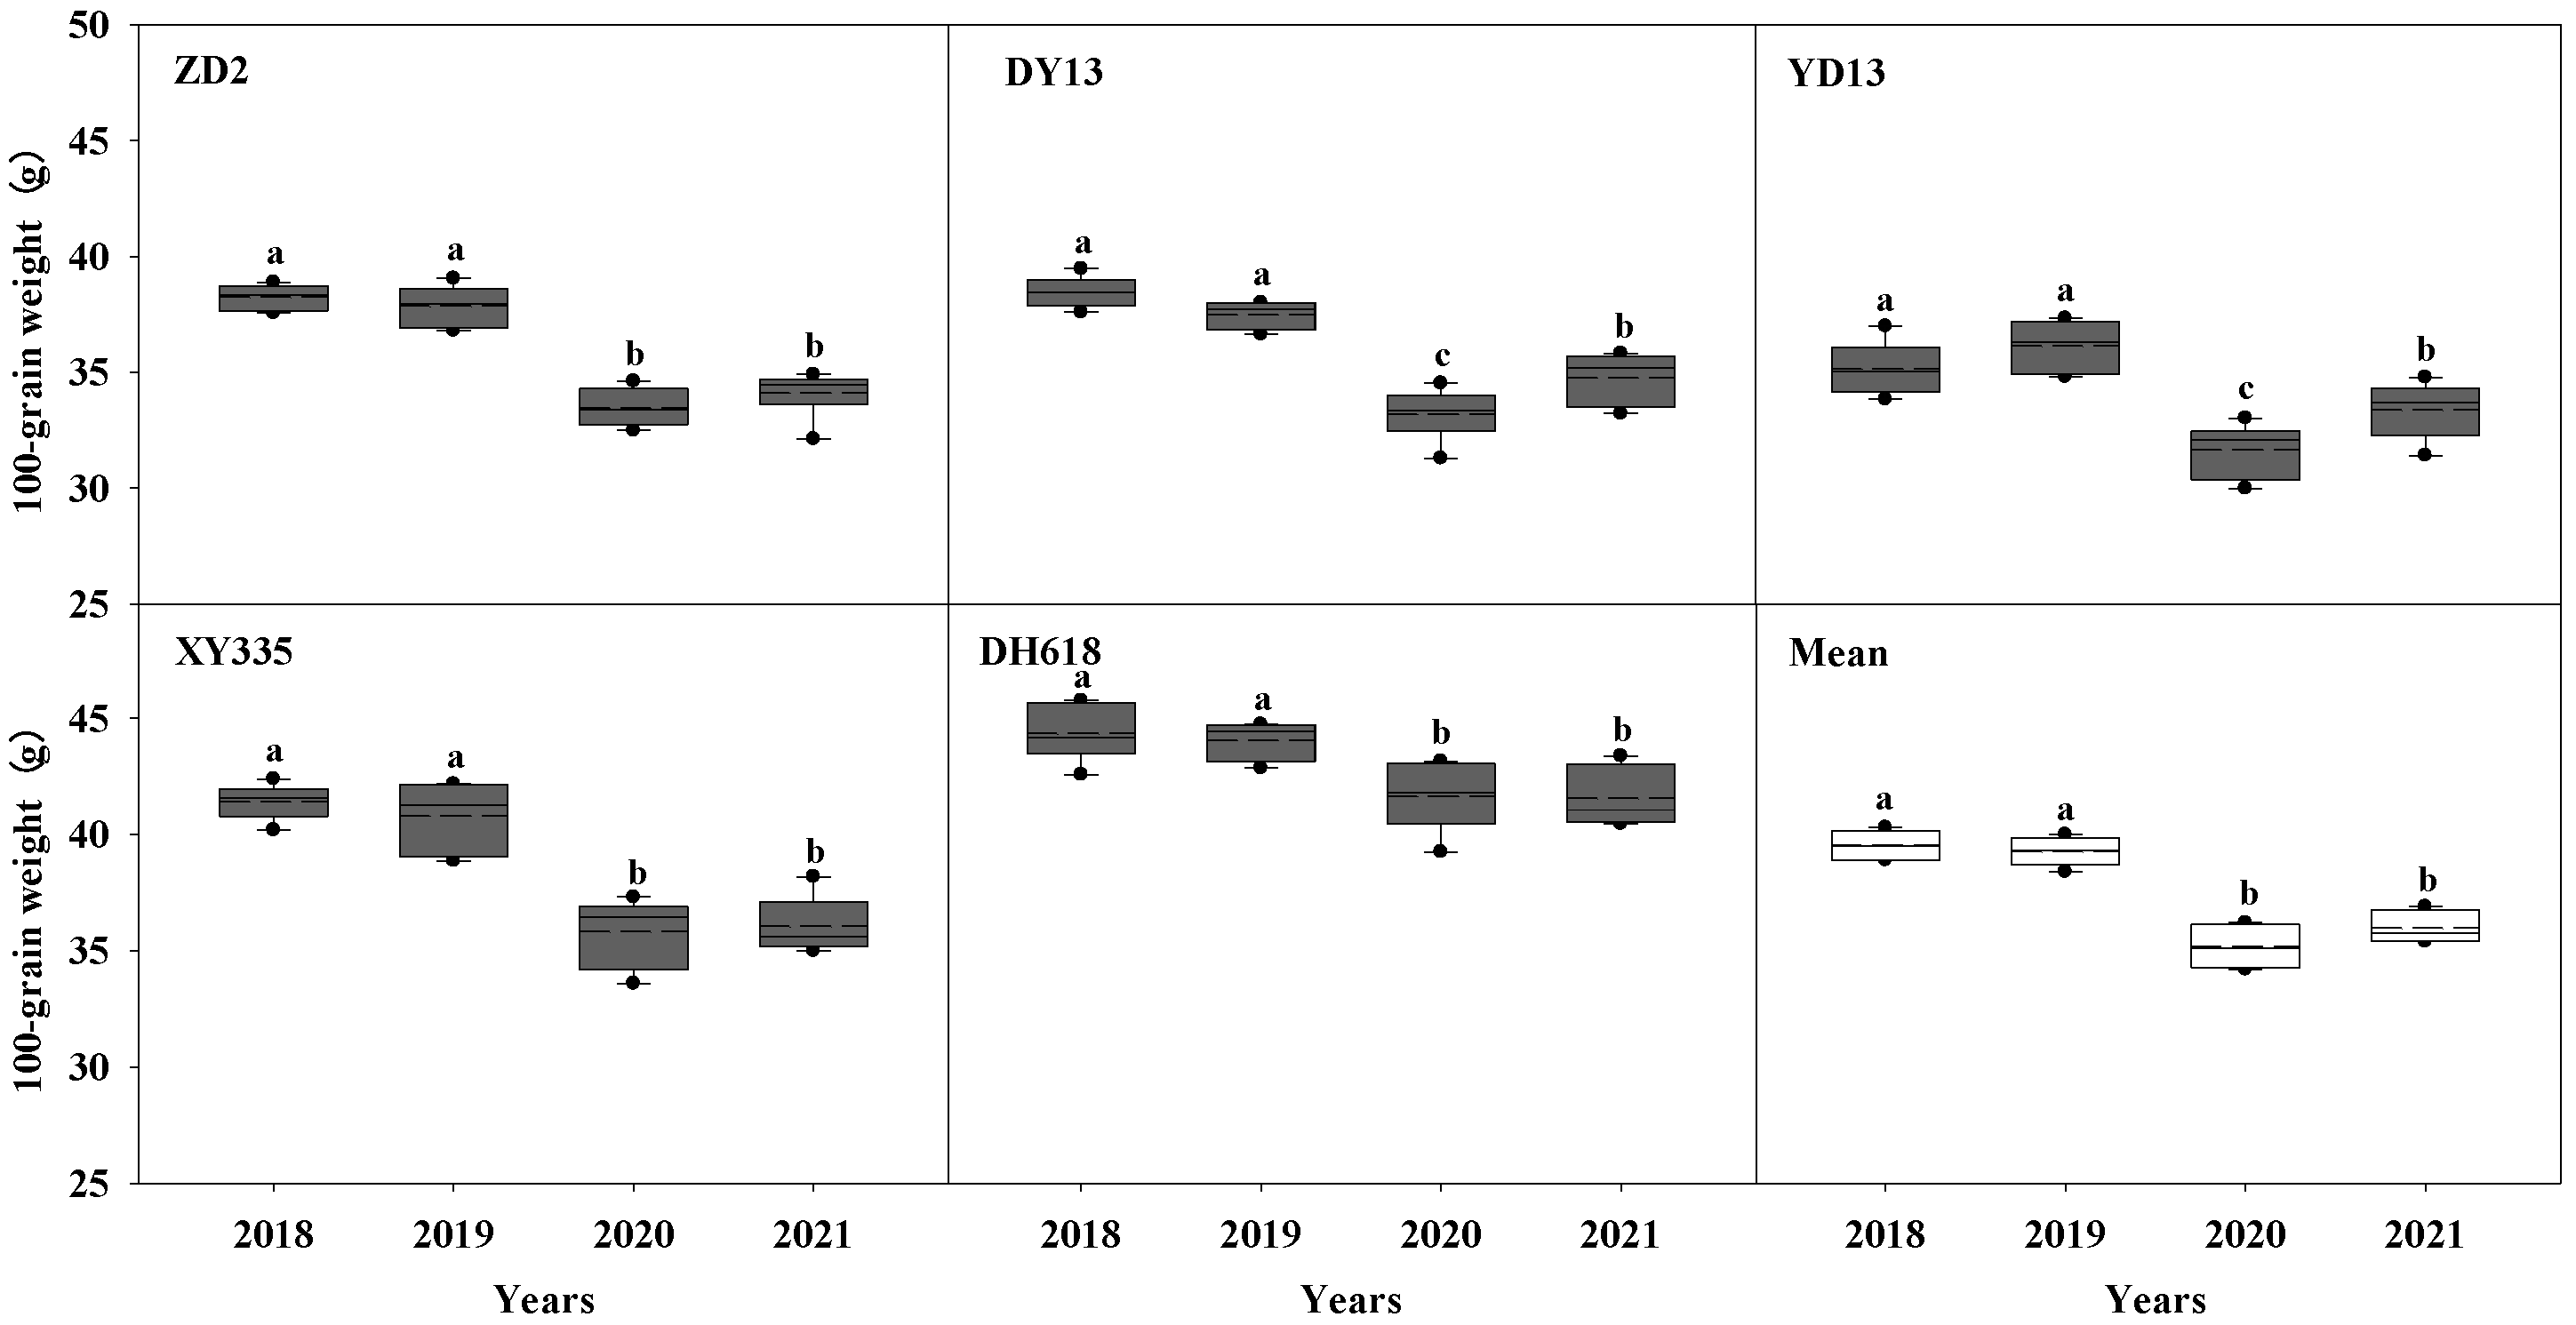
Ten ears were randomly selected from each plot for natural air drying at the physiological maturity stage. Then, 100 grains from the middle of the ear were selected for calculating the 100-grain weight (converted to 14% moisture content).
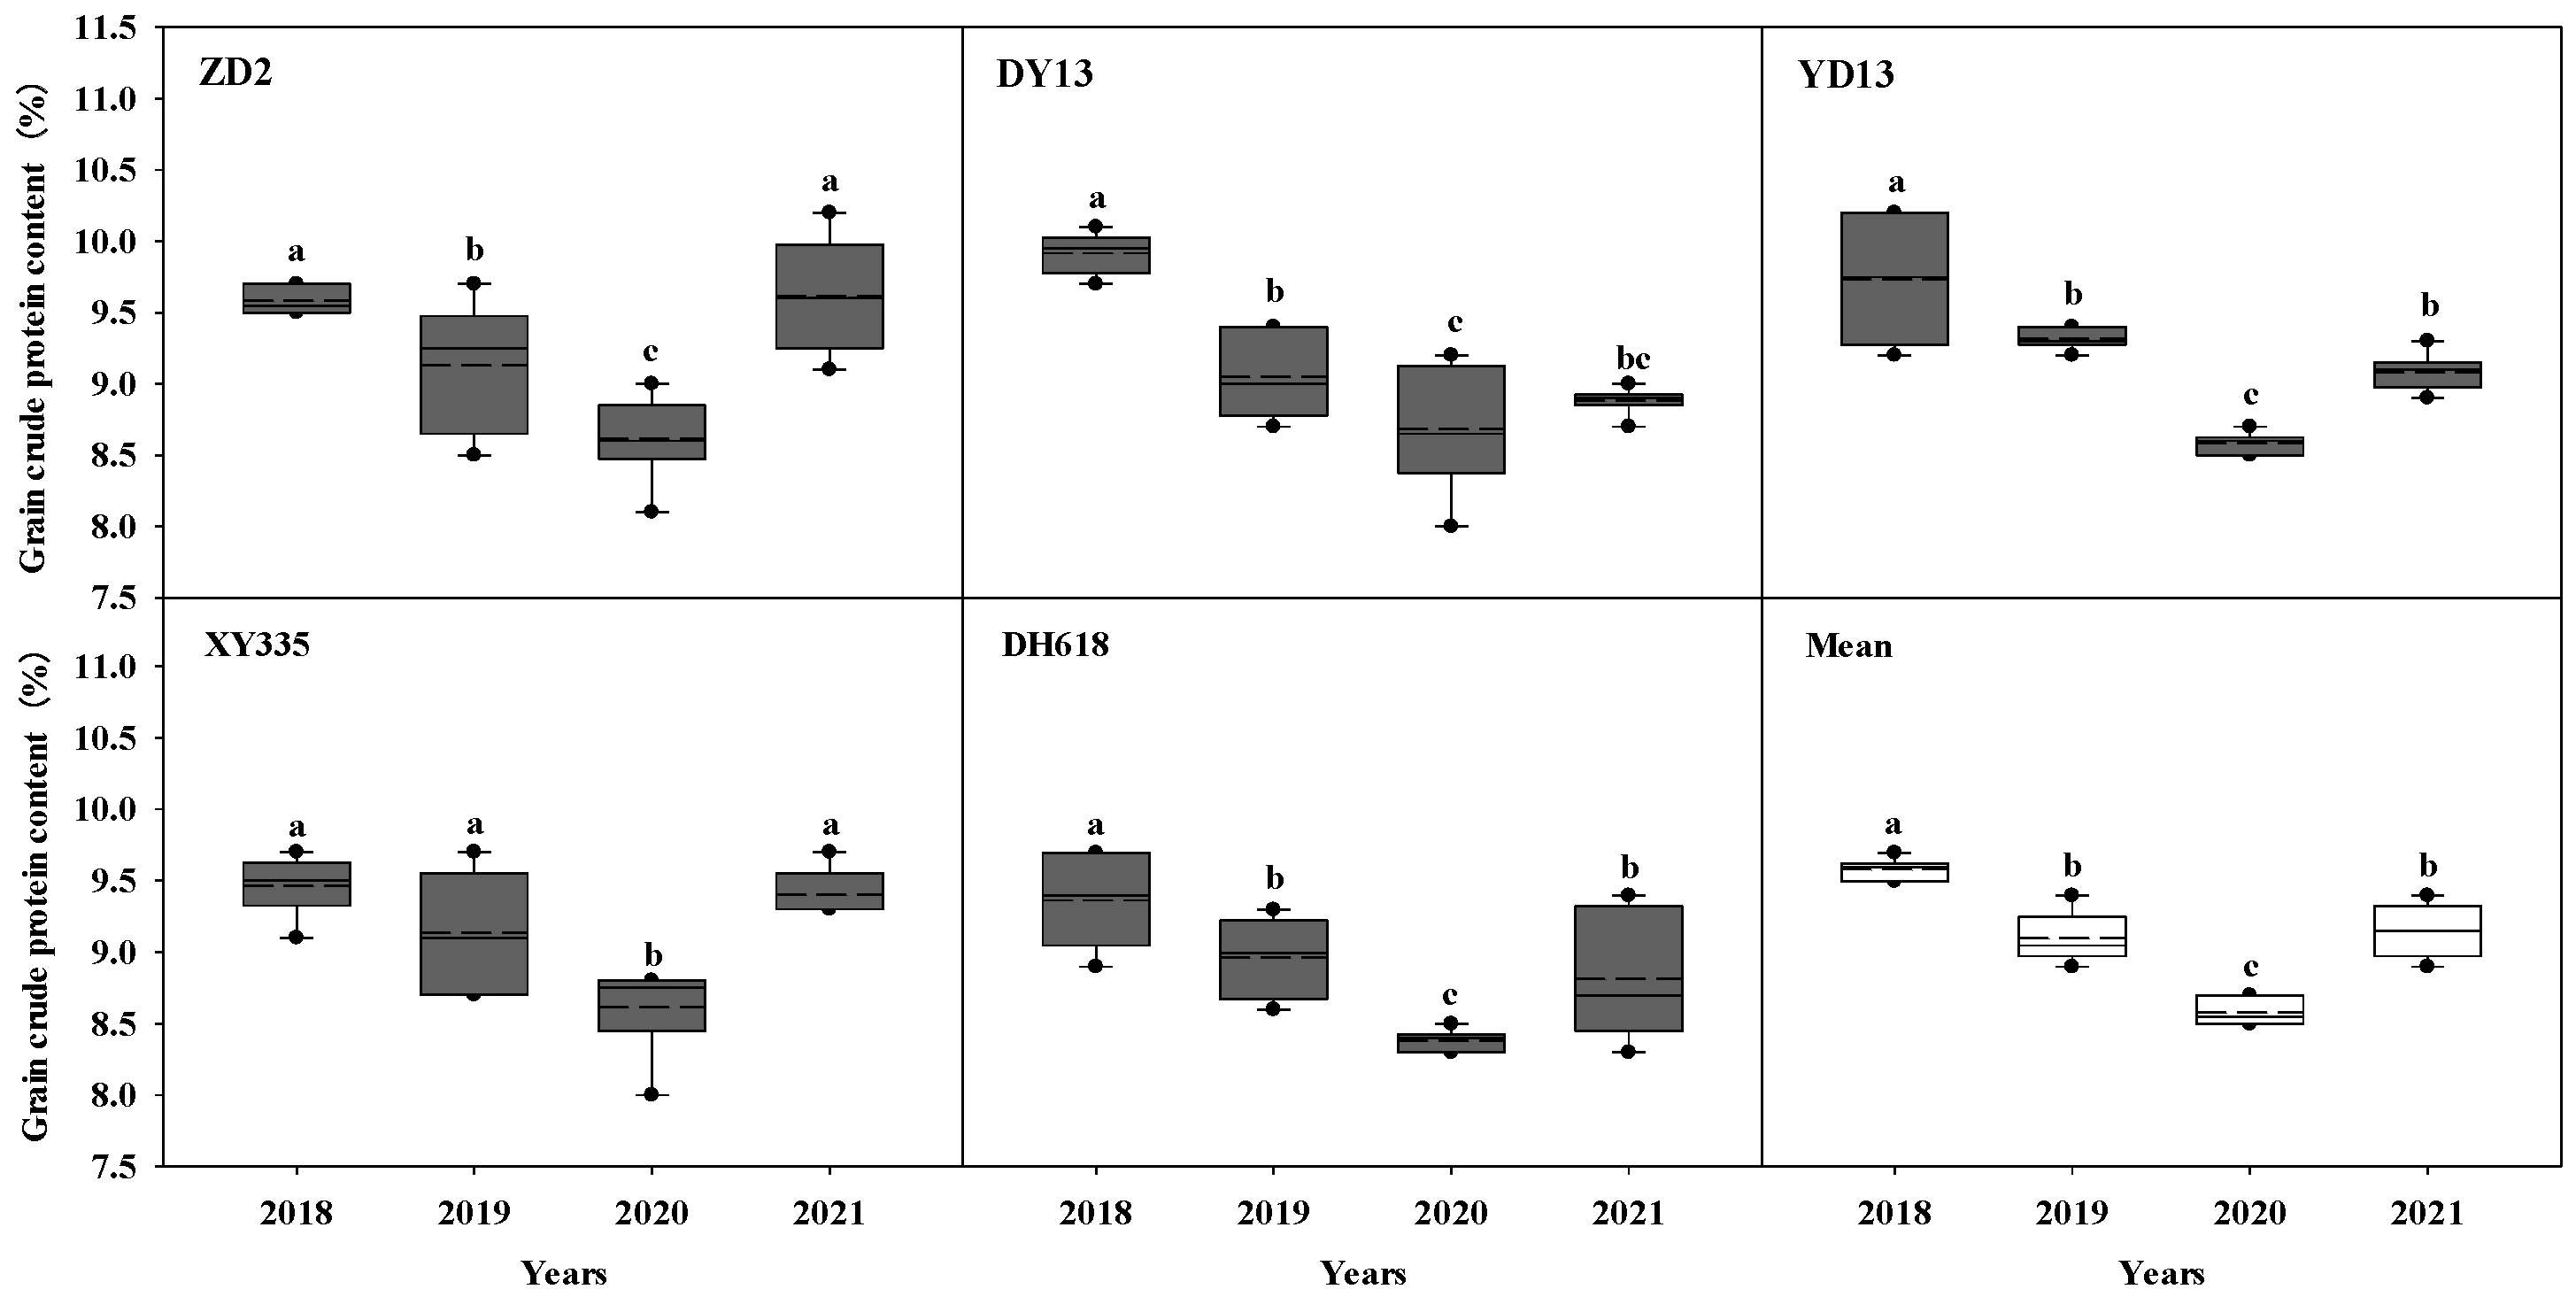
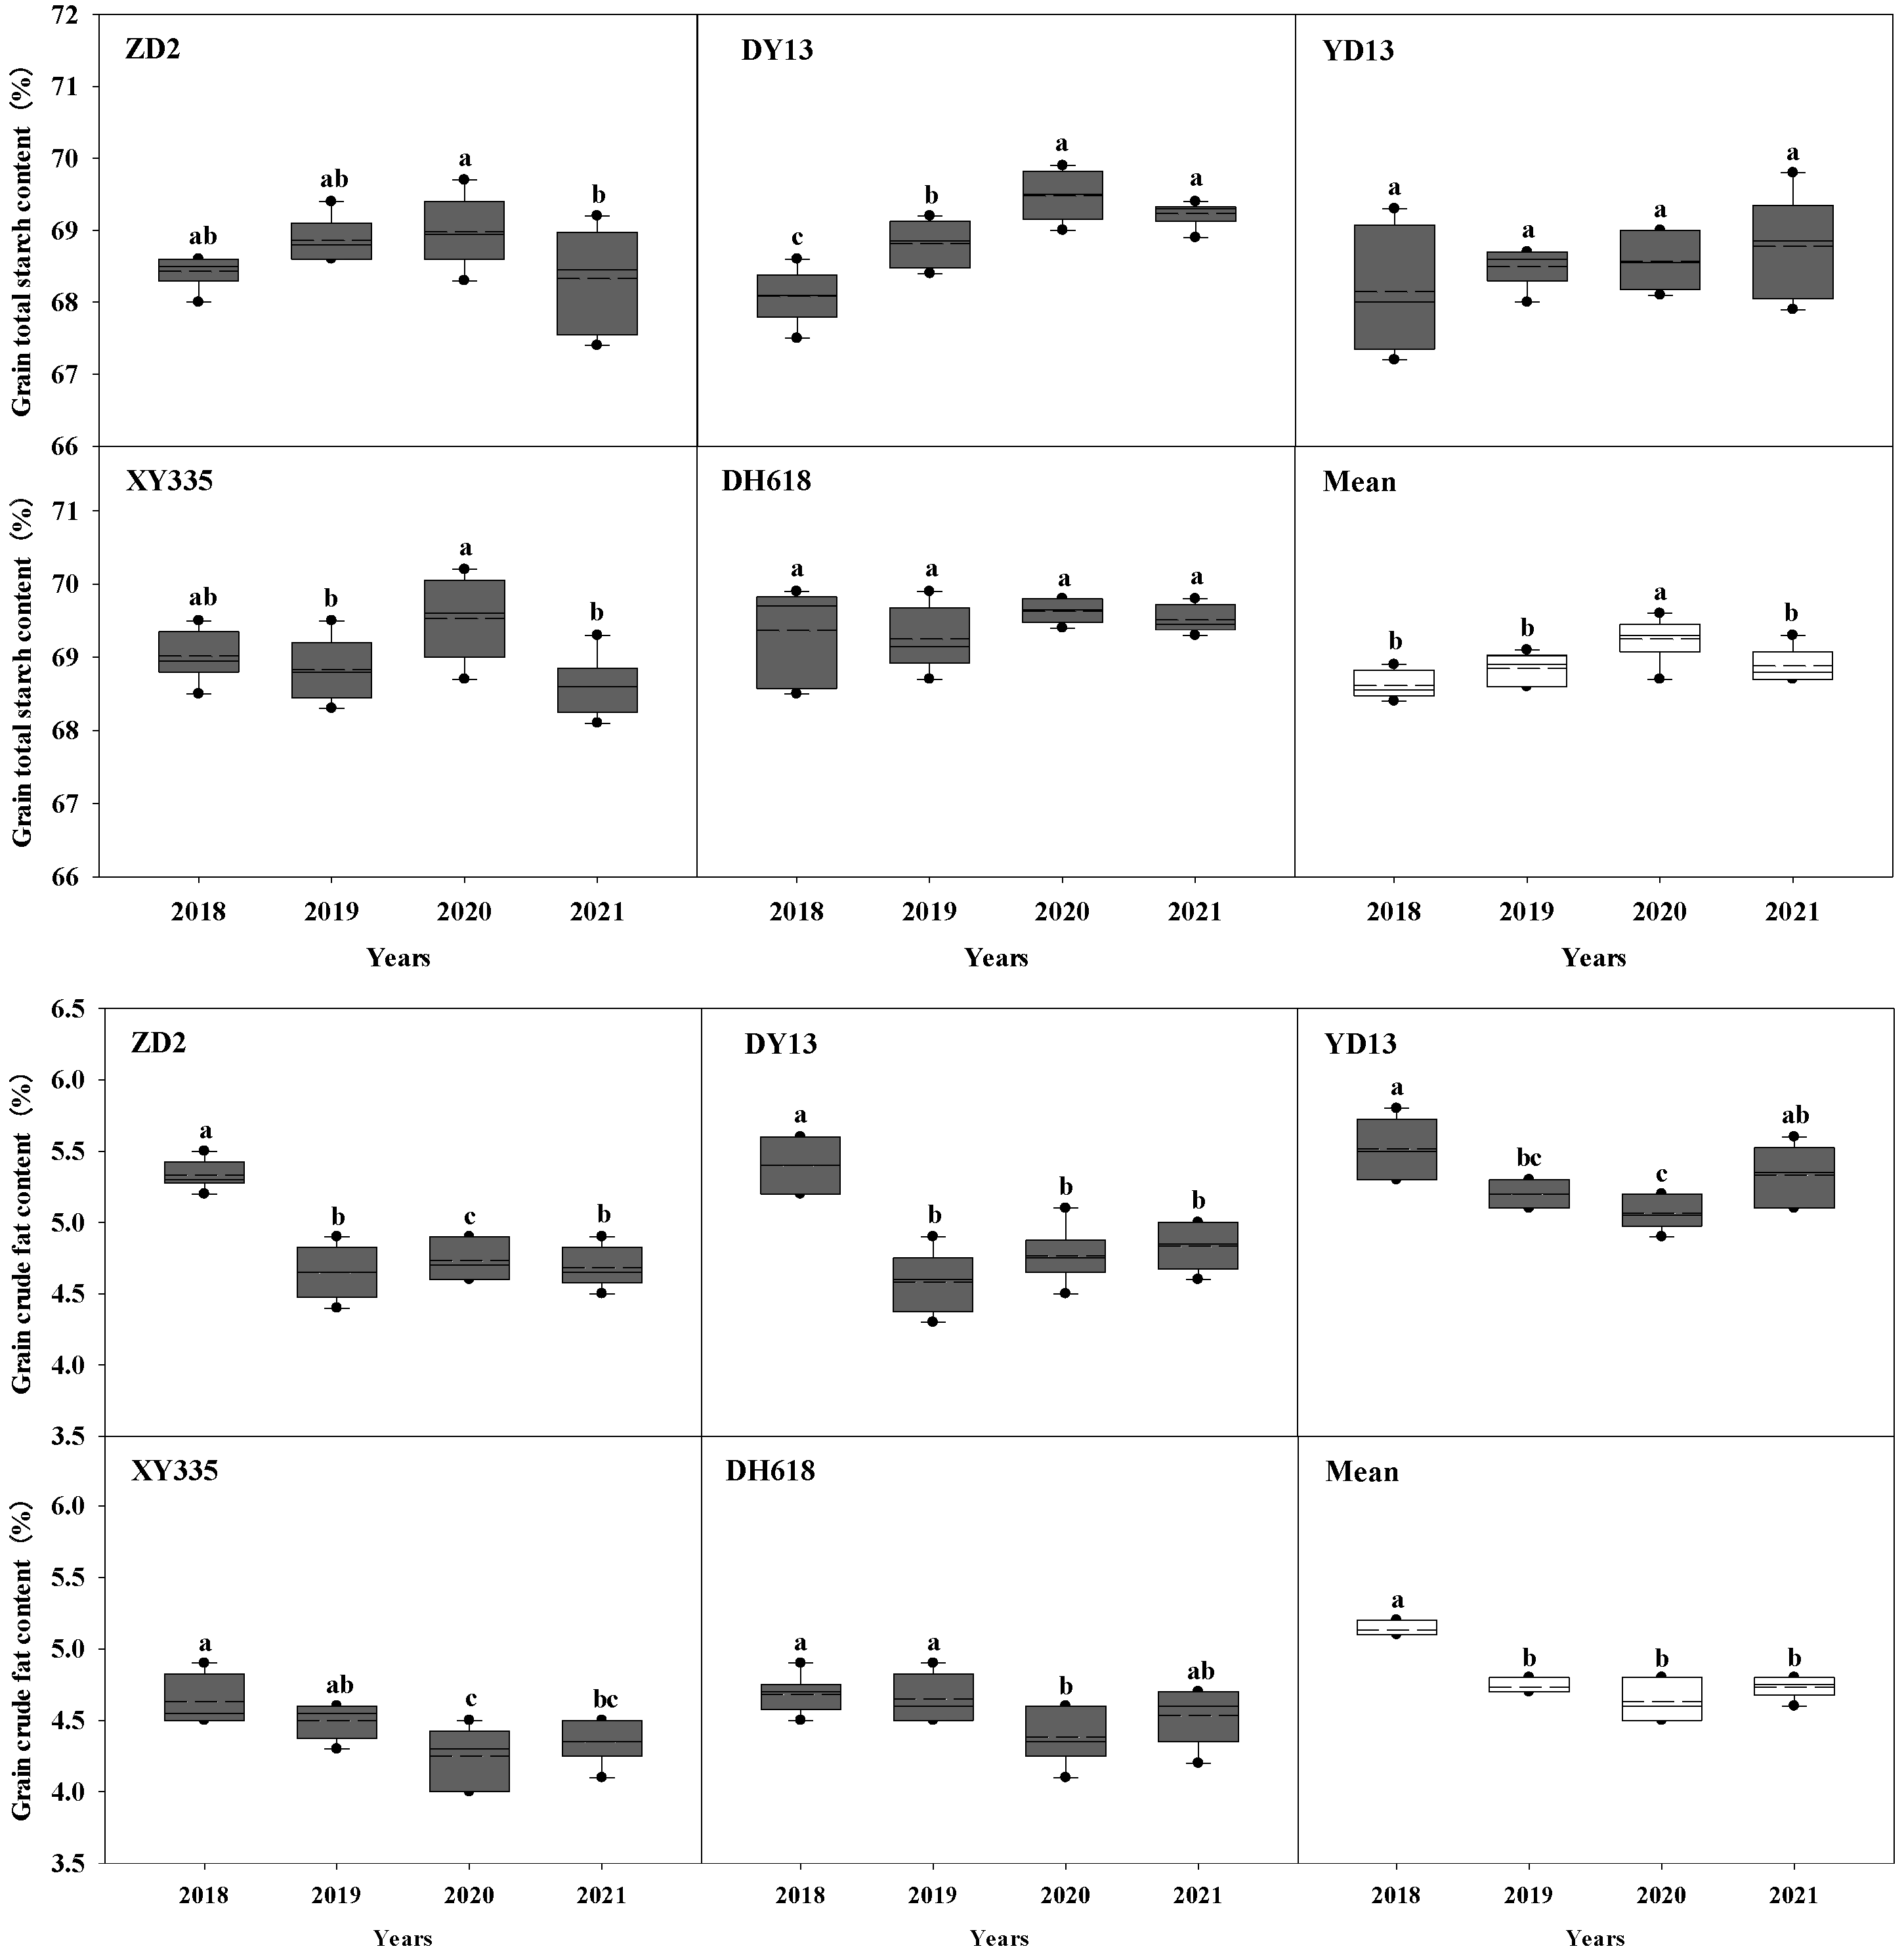
At physiological maturity, a representative cob was selected, and the middle grains of the cob were placed into an oven at 105 °C for 30 min, then dried to a constant weight at 60 °C, and crushed for measurement. The whole nitrogen content of the grains was determined using the semi-micro Kjeldahl method (crude protein content of the grains = whole nitrogen content of the grains × 6.25); the crude fat content was determined by the Soxhlet extraction-residue method, and the total starch content was determined by the anthrone sulfate colorimetric method.

2.5. Statistical Analysis

Microsoft Excel 2019 (Microsoft, Inc., Redmond, WA, USA) was used for data processing, and SAS 9.4 (SAS Institute Inc., Raleigh, CA, USA) statistical software was used for data variance, path analysis, stepwise regression, correlation analysis, and multivariate polynomial equation fitting. A one-way ANOVA was used to compare the grain weight and nutritional quality components of the grains among five hybrids in each year during the same growth stage. A two-way ANOVA was used to investigate the effect of climatic conditions on the grain weight and nutritional quality components of the grains among five hybrids. LSD (Least-Significant Different) and Duncan’s method was used for the significance test. The stepwise regression method was used for multiple linear regression, and Pearson’s correlation was used for correlation analysis. Additionally, Sigmaplot 12.5 (Systat Software, Inc., San Jose, CA, USA) was used to create the figures.

3. Results

3.1. Variation of the 100-Grain Weight of Maize under Different Meteorological Elements

ANOVA and LSD test results indicated that there were highly significant different in the 100-grain weight among years, hybrids, and hybrids × year (p < 0.01) (Table 2). According to Figure 2, there was no significant difference in the mean grain weight of the five hybrids in 2018 and 2019, and no significant difference in the mean grain weight of the five hybrids in 2020 and 2021 (p > 0.05), while there were significant differences in 2018 and 2019 from 2020 and 2021, respectively. The mean grain weight of 5 hybrids in 2018 was significantly increased by 12.41% and 9.86% compared with 2020 and 2021, and the mean grain weight of five hybrids in 2019 was significantly increased by 11.69% and 9.16% compared with 2020 and 2021 (p < 0.05). The grain weight of DH618 was the highest among hybrids in all years, and the range of grain weight among hybrids was significantly different between different years, especially in 2020. Compared with other hybrids, DH618 grain weight increased by 24.41%, 25.44%, 31.54%, and 16.25% (2022).

3.2. Variation of Grain Nutritional Quality of Maize under Different Meteorological Elements

ANOVA and LSD test results indicated that the crude protein content, total starch content, and crude fat content of grains were significantly different among years, hybrids, and year × hybrids (p < 0.01) (Table 3). As shown in Figure 3, the average crude protein content in grains of the five hybrids was the highest in 2018, which was significantly increased by 5.41%, 12.09%, and 4.95% compared with that in 2019–2021 (p < 0.05). In 2018 and 2020, the grain crude protein content of DY13 was the highest among hybrids, the grain crude protein content of YD13 was the highest among hybrids in 2019, and the grain crude protein content of ZD2 was the highest among hybrids in 2021. The mean value of total starch content in grains of the five cultivars in 2020 was the highest, significantly increasing by 0.92%, 0.56%, and 0.50% compared with 2018, 2019, and 2021 (p < 0.05), respectively. The total starch content among hybrids was the highest in DH618. The range of total starch content among hybrids was significantly different in different years, with the most significant difference between hybrids in 2018 and 2021. The average crude fat content of grains in 2018 was the highest, significantly increasing by 8.41%, 10.20%, and 7.72% compared with 2019–2021, respectively (p < 0.05). The crude fat content of grains among hybrids is the highest in YD13, and the range of crude fat content among hybrids is also significantly different between different years. The difference was the largest in 2021.

3.3. Correlation between the 100-Grain Weight and Grain Nutritional Quality

The correlation analysis between the 100-grain weight and grain nutritional quality showed (Figure 4) that the 100-grain weight was significantly negatively correlated with grain crude protein content (−0.4200), extremely significantly negatively associated with grain crude fat content (−0.8108), and exceptionally significantly positively correlated with grain total starch content (0.6268), in 2018. In 2019, there was no significant correlation between the 100-grain weight and grain crude protein content, but a significant negative correlation with grain crude fat content (−0.4224), and a very significant positive correlation with grain total starch content (0.4747). In 2020, there was no significant correlation between the 100-grain weight and grain crude protein content, but a very significant negative correlation with grain crude fat content (−0.5982), and a significant positive correlation with grain total starch content (0.4389). In 2021, the 100-grain weight was significantly negatively correlated with crude protein content (−0.3786), significantly negatively correlated with crude fat content (−0.4866), and significantly positively associated with total starch content (0.5059). The comprehensive analysis of each year showed that the grain weight was negatively correlated with the content of crude protein and crude fat, and positively correlated with the content of total starch.

3.4. Multiple Linear Regression Analysis of Meteorological Elements and the 100-Grain Weight

In order to clarify the contribution of meteorological elements before and after anthesis to grain weight, eight meteorological parameters before and after anthesis were used to carry out stepwise regression of grain weight. The results are shown in Table 4 and Table 5. The multiple linear equations between grain weight (y) and before anthesis meteorological factors (s) was y = 213.22 − 1.81 s1 + 0.03 s5−3.19 s6 − 0.02 s8, in which the average temperature, total sunshine duration, relative humidity, and the accumulated temperature had strong effects on grain weight. The multiple linear equations of grain weight (y) and post-anthesis meteorological factors (s) were y = 427.27 + 40.64 s9 + 0.10 s10 − 52.87 s11 − 0.09 s13 + 10.68 s15 + 0.07 s16, in which average temperature, total rainfall, temperature difference, accumulated temperature, daily highest temperature, and total sunshine hours had strong effects on grain weight.

3.5. Multiple Linear Regression Analysis of Grain Nutritional Quality and Meteorological Elements

In order to clarify the contribution degree of pre-anthesis and post-anthesis meteorological elements to grain nutritional quality, eight meteorological elements at two periods—before and after anthesis—were used to perform stepwise regression. The results are shown in Table 6, Table 7 and Table 8. The multivariate linear equation between grain crude protein content (g1) and meteorological elements (Table 6) was g1 = −29.73 − 6.78 s1 + 0.03 s2 + 5.02 s3 + 1.79 s4 + 0.18 s6 + 0.02 s10. The pre-anthesis average temperature, post-anthesis total rainfall, pre-anthesis average daily highest temperature, pre-anthesis average daily lowest temperature, pre-anthesis relative humidity, and post-anthesis total rainfall had strong effects on the crude protein content in grains. The multivariate linear equation of total starch content in grain (g2) and meteorological factors (Table 7) was g2 = 170.05 + 11.43 s1 − 13.65 s3 + 6.63 s7 − 0.01 s13 − 0.91 s14 + 0.01 s16. The pre-anthesis average temperature, pre-anthesis average daily highest temperature, and pre-anthesis temperature difference, as well as the post-anthesis total sunshine hours, post-anthesis relative humidity, and post-anthesis accumulated temperature, had strong effects on the total starch content in grains. The multivariate linear equation of crude fat content (g3) and meteorological elements (Table 8) was g3 = −4.08 + 7.06 s1 − 5.48 s4 + 0.01 s5 − 5.64 s7 − 0.01 s8 + 0.02 s10 − 24.09 s11 + 25.05 s12 − 0.01 s13 + 27.64 s15. The pre-anthesis average temperature, pre-anthesis average daily lowest temperature, pre-anthesis total sunshine hours, pre-anthesis temperature difference, and pre-anthesis accumulated temperature, as well as post-anthesis the total rainfall, post-anthesis average daily highest temperature, post-anthesis average daily lowest temperature, post-anthesis total sunshine hours, and post-anthesis temperature difference, had strong effects on the crude fat content of grains.

3.6. Path Analysis of Meteorological Factors, Grain Nutritional Quality, and the 100-Grain Weight

Based on the results of stepwise regression, path coefficient analysis was conducted using meteorological factors (s) at two periods—before anthesis and after anthesis—grain nutritional quality (g), and grain weight (y) (Table 9). The results showed that the direct effect of grain crude protein content on the 100-grain weight is negative (−0.037). Among the indirect effect of meteorological factors on the 100-grain weight through the crude protein content of the grain, the indirect effect of average temperature after anthesis (s9) was the largest (−0.031). The direct effect of total grain starch content on the 100-grain weight was positive (0.294). The indirect effect of meteorological factors on the 100-grain weight through the total starch content of the grain, the indirect effect of accumulated temperature before anthesis (s8) was the largest (−0.165). The direct effect of the grain’s crude fat content on the 100-grain weight was negative (−0.419). The indirect effect of meteorological factors on 100-grain weight through the content of crude fat in the grain, the indirect effect of accumulated temperature after anthesis (s16) was the largest, which was 0.203.

3.7. Quantitative Analysis of Grain Nutritional Quality and the 100-Grain Weight

In order to further quantitatively analyze the relationship between grain nutritional quality and the 100-grain weight, taking grain crude protein content (g1), grain total starch content (g2), and grain crude fat content (g3) as independent variables and grain weight as the dependent variable (y), a ternary quadratic polynomial regression equation was obtained: y = −1412.173 − 678.929 g1 + 58.400 g2 + 980.618 g3 − 0.706 g12 + 9.426 g1g2 − 0.529 g22 + 10.419 g3g1 − 13.942 g3g2 − 12.535g32 (R2 = 0.690). By deriving this polynomial, it is clear that when the contents of crude protein, total starch, and crude fat in grains were 9.68%, 69.35%, and 4.75%, respectively, the maximum weight of 100 grains could reach 47.03 g. By reducing the dimension of this equation (Figure 5), within the test range, with the increase of grain crude protein content, the 100-grain weight first increased and then decreased. Before reaching the peak, the grain crude protein content increased by one percentage point, and the grain weight increased by 2.25 g. With the increase of total starch content in grains, the grain weight first decreased slightly and then increased rapidly. After the lowest point, the total starch content in grains increased by one percentage point, and the grain weight increased by 3.45 g. The grain weight gradually decreased with the increase of crude fat content. Before reaching the lowest point, the grain weight decreased by 3.63 g for every 1% grain crude fat content increase.

3.8. Quantitative Analysis of Meteorological Elements and Grain Nutritional Quality

In order to further quantitatively analyze the relationship between meteorological elements and grain nutritional quality, in view of the results of path analysis, the cumulative temperature before anthesis (s8), average temperature after anthesis (s9), and cumulative temperature after anthesis (s16) were taken as independent variables, and the contents of crude protein (g1), total starch (g2), and crude fat (g3) in grains of various hybrids were taken as dependent variables for regression analysis, obtaining the regression equation of the ternary quadratic polynomial: g1 = 8.495 − 0.004 s8 + 2.533 s9 − 0.034 s16 + 0.001 s9s8 − 0.151 s92 + 0.002 s16s9 (R2 = 0.906), g2 = 74.516 + 0.034 s8−13.245 s9 + 0.138 s16 − 0.003 s9s8 + 0.527 s92 − 0.003 s16s9 (R2 = 0.795), g3 = −36.968 − 0.003 s8 + 1.235 s9 + 0.040 s16 + 0.001 s9s8 − 0.071 s92 + 0.001 s16s9 (R2 = 0.739). By deriving this polynomial, it is clear that within the test range, when the accumulated temperature before anthesis (s8), the average temperature after anthesis (s9), and the accumulated temperature after anthesis (s16) were 1635.90 °C, 21.04 °C, and 1294.00 °C, respectively, the optimal value of the grain crude protein content was 9.86%; at 1697.50 °C, 19.01 °C, and 1561.84 °C, respectively, the optimum value of total starch content in grains was 71.83%; at 1835.51 °C, 20.88 °C, and 1367.25 °C, respectively, the optimum value of crude fat content in grains was 6.06%. According to the dimension reduction treatment of this equation (Figure 6), within the test range, the grain crude protein content gradually linearly increases with the increase of pre-anthesis accumulated temperature. For every 1 °C increase of pre-anthesis accumulated temperature, the grain crude protein content increases by 0.0015 percentage points; with the rise in average temperature after anthesis, the content of crude protein in grains increases gradually; with the rise of accumulated temperature after anthesis, the crude protein content of grains gradually slightly decreased. For every 1 °C increase of accumulated temperature after anthesis, the crude protein content of grains decreased by 0.0001 percentage points. With the increase of pre-anthesis accumulated temperature, the total starch content in grains gradually linearly decreased. With the rise in pre-anthesis accumulated temperature by 1 °C, the total starch content in grains decreased by 0.0030 percentage points; with the increase of average temperature after anthesis, the total starch content in grains decreased gradually; with the increase of accumulated temperature after anthesis, the total starch content of grains steadily increased. For every 1 °C increase of accumulated temperature after anthesis, the total starch content of grains increased by 0.0010 percentage points. With the increase of pre-anthesis accumulated temperature, the crude fat content of grains gradually increased. For every 1 °C increase of pre-anthesis accumulated temperature, the crude fat content of grains increased by 0.0017 percentage points; with the rise of average temperature after anthesis, the content of crude fat in grains decreased first and then increased; with the increase of accumulated temperature after anthesis, the crude fat content of grains linearly gradually reduced. For every 1 °C increase of accumulated temperature after anthesis, the crude protein content of grains decreased by 0.0016 percentage points.

4. Discussion

Crop yield and quality were the core of crop cultivation and genetic breeding discipline research. Achieving the highest yields and quality was the main objective of crop genetic improvement and regulation of cultivation environments and practices [17]. Crop yield and quality were formed in the same process of accumulation and distribution of photosynthetic products, so there was an inseparable relationship between yield and quality. Genetically determined yield potential and product physicochemical traits vary greatly from crop to crop and hybrid, coupled with the interaction of genetic factors and environment, making the relationship between yield and quality complex and variable. Maize yield is made up of the number of ears, the number of grains on the ears and the grain weight, and different meteorological elements play different roles in yield [18]. Under the condition of a certain number of ears, kernel number per ear and kernel weight of maize determine the yield of maize, of which the contribution was influenced by various factors, such as environmental conditions, genotype, and yield level [19]. The number of grains depends on the rate of flowering and fertilization and the extent to which photosynthetic products are transferred to the grains after fertilization. Flowering and fertilization are very sensitive to environmental conditions and if the period is characterized by water deficit or unfavorable climatic conditions, such as excessive precipitation, humidity, low temperatures, and nutritional deficiencies, the fruit set is reduced, resulting in grain number deficiency. Grain weight was a comprehensive reflection of the external growth and development and internal physiological and metabolic status of maize, an essential prerequisite for crops to achieve high yield [20] and was also susceptible to the impact of the ecological environment [21,22]. For example, high-temperature stress at the filling stage can affect the source-sink ratio of grains, reduce the filling rate of grains, and significantly reduce grain weight [23,24,25]. Although low-temperature stress has no significant effect on grain volume, it can also considerably reduce grain weight [26]. In addition, inappropriate soil water conditions can also affect the growth and development of the ear and the accumulation of grain inclusions in maize [27,28]. Light and temperature radiation are closely related to plant biomass and grain weight, and insufficient light and temperature resources also affect grain dry matter accumulation and yield formation [29,30]. This paper shows that the yield components of each maize hybrid responded differently to meteorological factors in different growing years, which led to differences in grain yield between maize hybrids in different growing years (Figure S1). Under normal climatic conditions, the pre-anthesis meteorological elements of total sunshine hours, average temperature, relative humidity, and accumulated temperature have a strong influence on grain weight, while the post-anthesis meteorological elements of average daily temperature, total rainfall, temperature difference, accumulated temperature, average daily highest temperature, and total sunshine hours have a strong influence on grain weight.
The content of grain quality components was one of the most important indicators for evaluating the nutritional quality of grains [
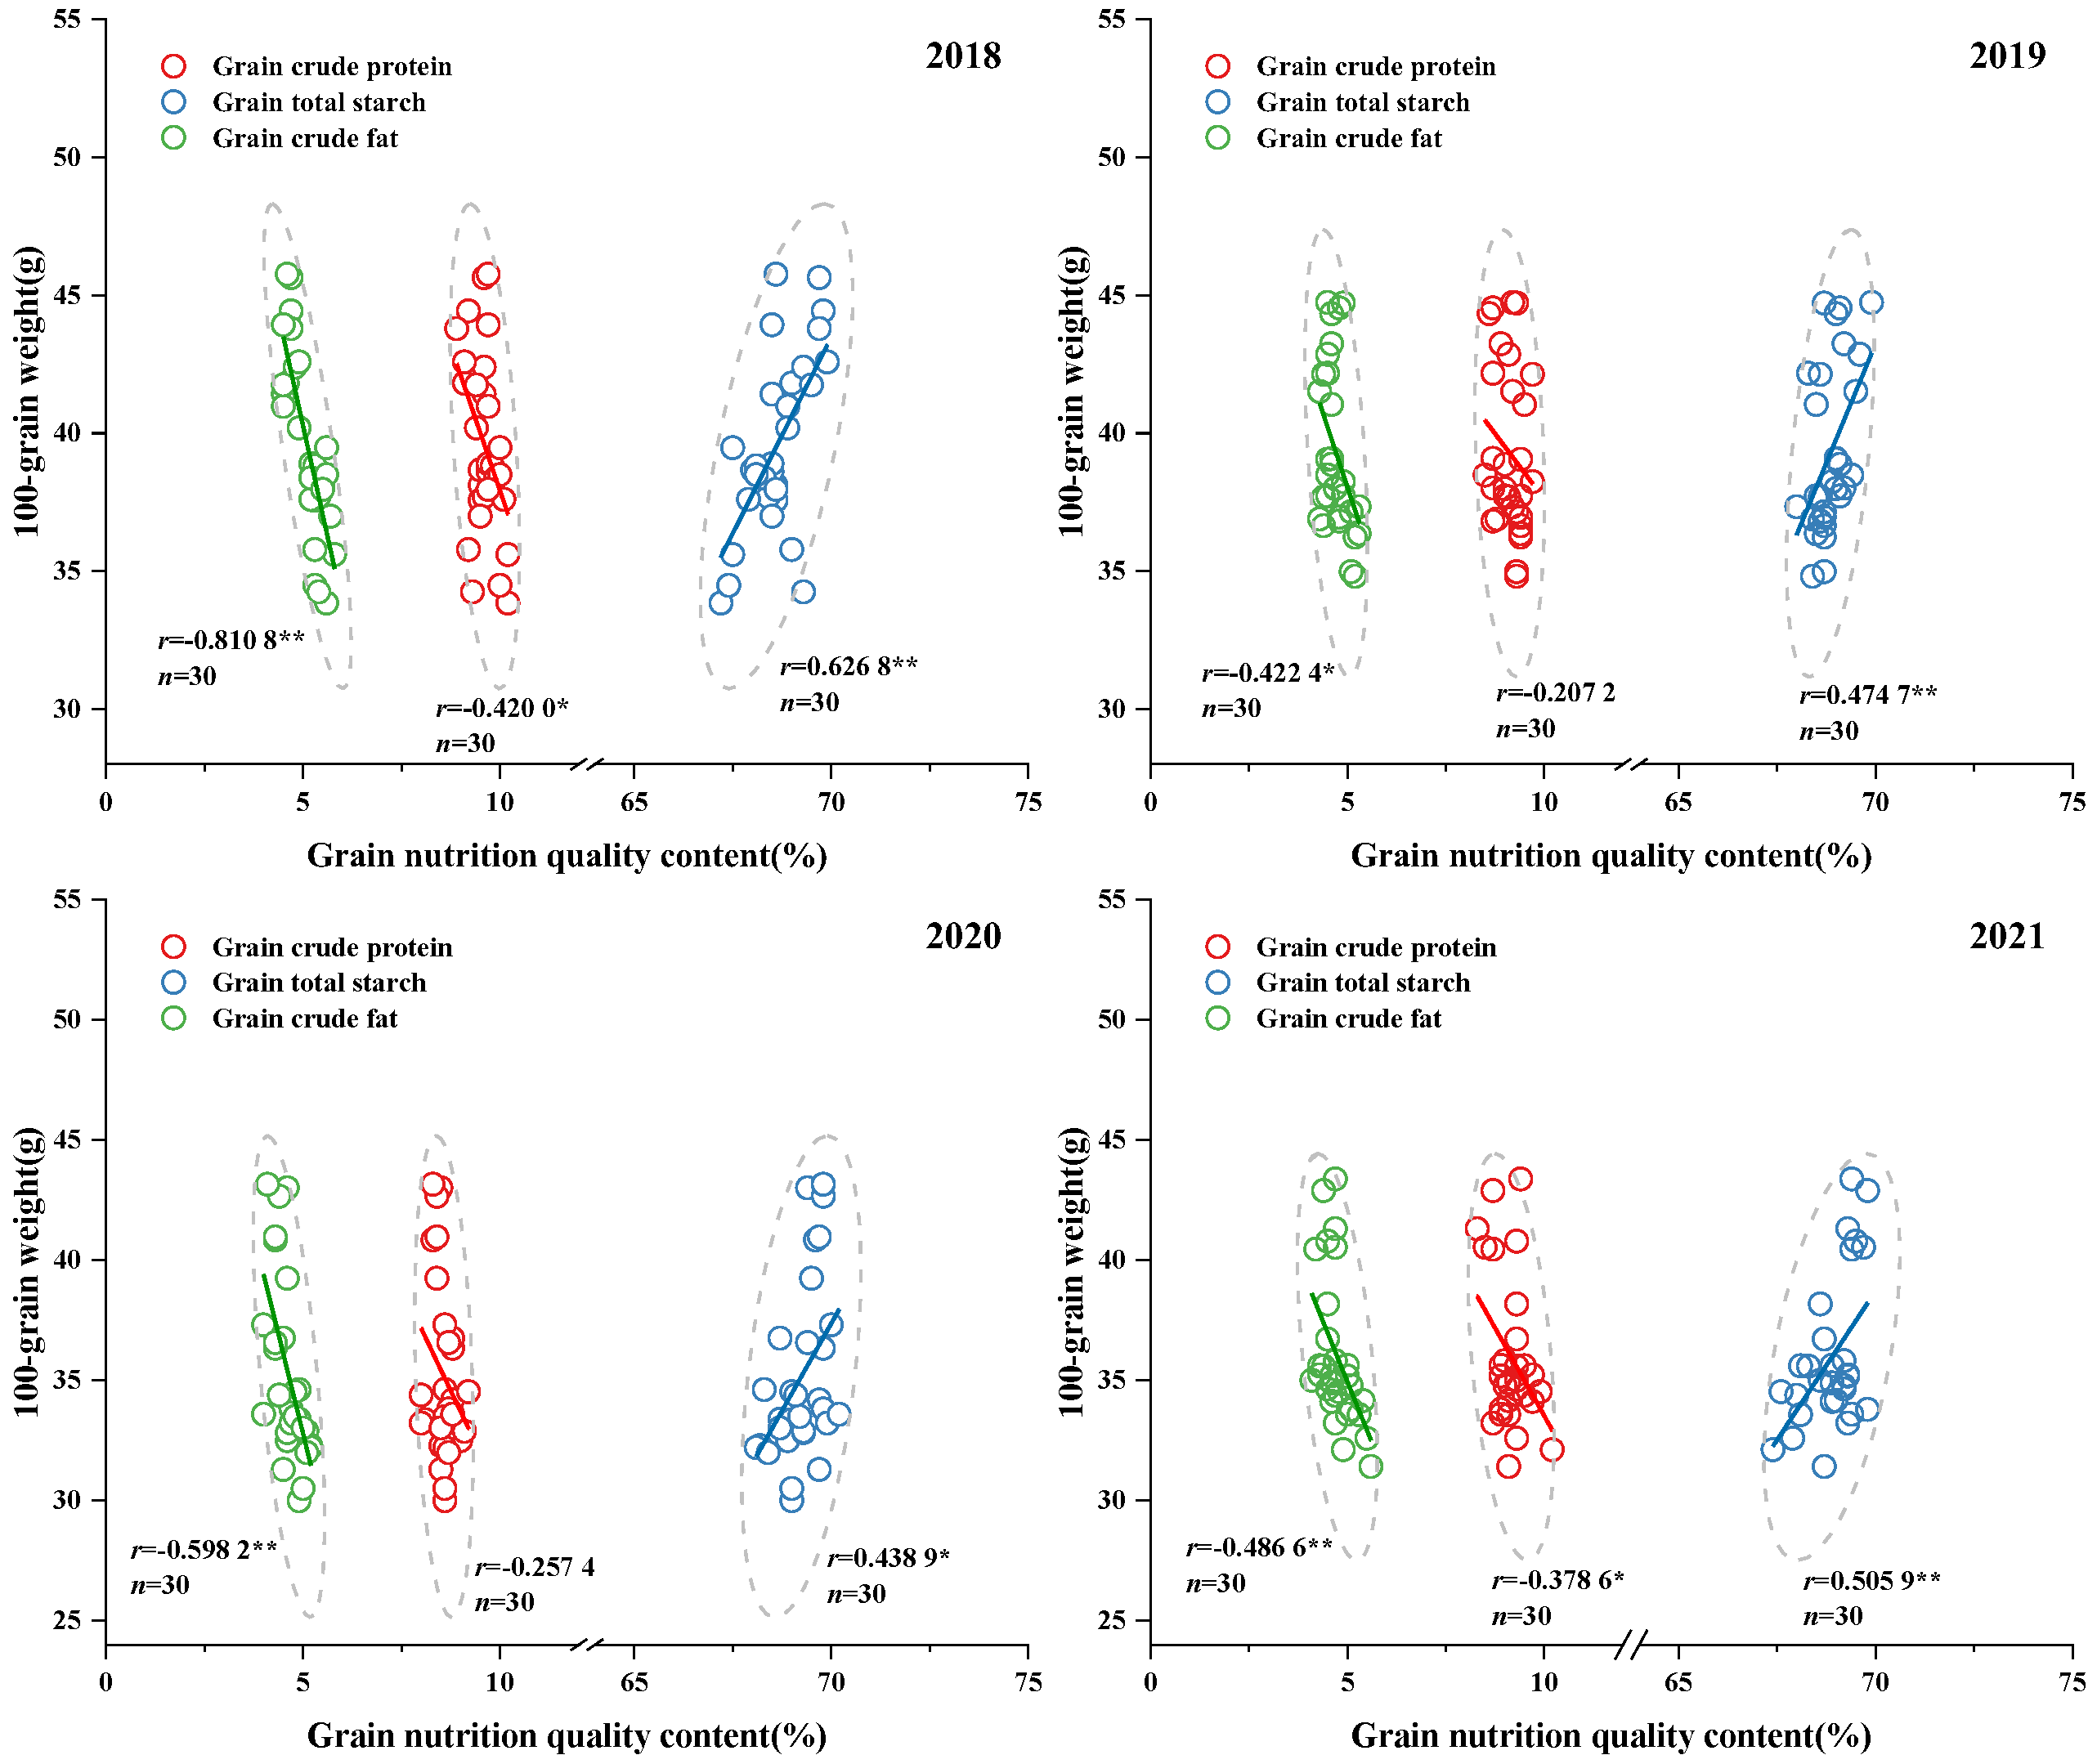
31]. There have been studies on the relationship between 100-kernel weight and the content of crude protein, total starch, and crude fat in grains. For example, Chen et al. [
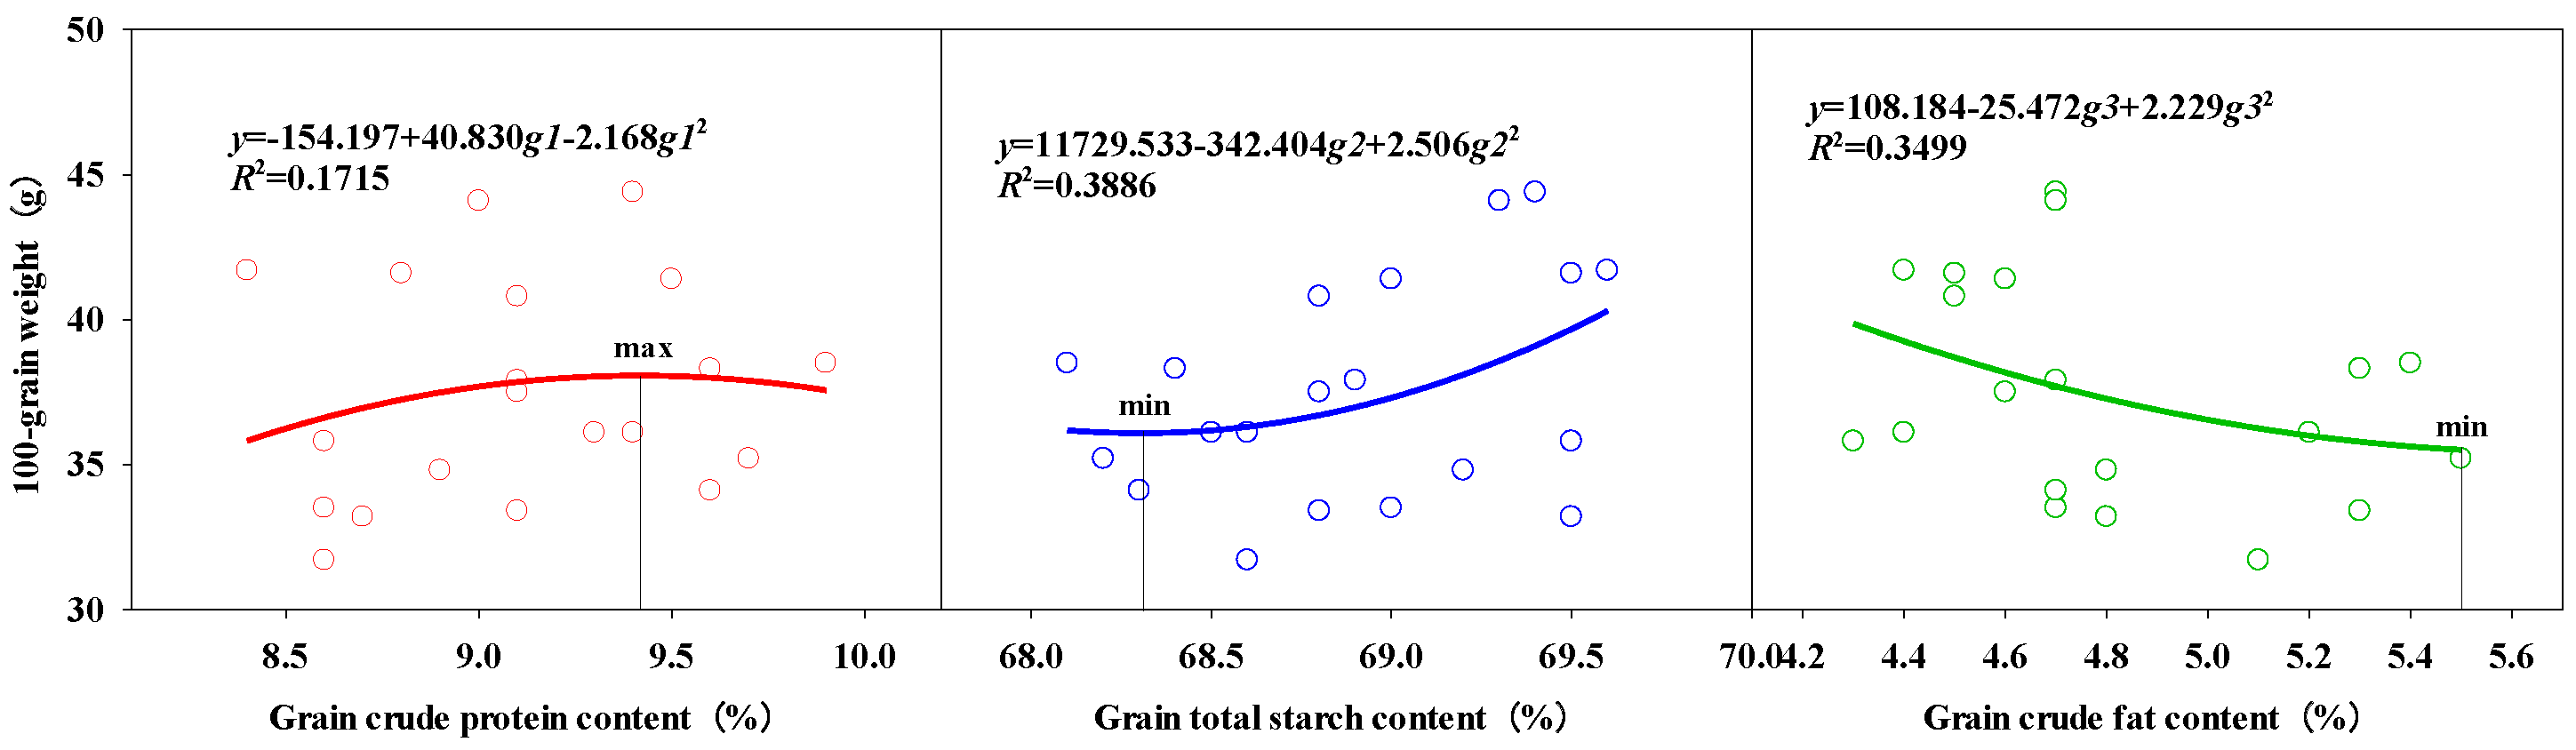
4] studied the quality traits of maize hybrids under national review and the 100-grain weight was positively correlated with the crude starch content. It was significantly negative correlated with crude protein and lysine content and negatively correlated with crude fat content. This study also found that there was a highly significant positive correlation between the 100-grain weight and total starch content, a highly significant negative correlation with crude fat content, and an overall significant negative correlation with the crude protein content of the grains. Nutrient quality components in grain are synthesized by further conversion of glucose, the initial product of photosynthesis. Yang et al. [15] found that different amounts of glucose are required for the formation of different organic compounds in the grains. In other words, maize hybrids with a high starch content in the kernel must have a higher grain weight than those with a high crude protein and crude fat content in the kernel, when the glucose produced by photosynthesis is equal. It can be seen that if the crude protein and crude fat content of the grains are increased, their yield will be affected unless the photosynthetic efficiency of the crop is further improved and the material production capacity of the crop is enhanced. Based on this, a quantitative analysis of the crude protein, total starch, and crude fat content of the grains in relation to the 100-grain weight showed that the maximum 100-grain weight of 47.03 g was achieved when the crude protein, total starch, and crude fat content of the grains were 9.68%, 69.35%, and 4.75%, respectively. Under the current test conditions, the maximum 100-grain weight of each hybrid in each year was only 44.36 g. It can be found that the grain weight potential of maize hybrids can still be further exploited by optimizing the content of each quality component of the grain.
As mentioned earlier, both environmental and cultivation practices have a significant impact on crop yield and quality, and it is generally accepted that unfavorable environmental conditions tend to increase grain crude protein content and that agronomic practices that increase grain crude protein content also tend to result in lower crop yields [32]. However, the relationship between grain weight and crude protein content of the grains is not linear. A suitable ecological environment and reasonable cultivation measures are conducive to both increasing grain weight and improving the nutritional quality of the grains, such as combining reasonable fertilization with reasonable irrigation [33]. Meteorological factors stress at different growth stages also can cause differences in grain content, starch structure, and nutritional quality [34,35,36]. Mariem et al. [37] concluded that drought led to a significant reduction in starch content in maize grain and a significant increase in amino acid and mineral content. In turn, Shi et al. [38] concluded that drought stress increased starch content in grain and the clear protein, glutenin, and alcoholic protein in the protein fraction were significantly reduced. Regarding this, Chen et al. [39] believed that the difference might be caused by the difference in stress period (joining, tasseling, flowering, fruit-bearing period, etc.), water control method (pot planting, pond planting, etc.), duration of stress, etc. Mayer et al. [16] also found that heat stress during the growth period of maize grains would increase the protein content after encountering extremely high-temperature conditions at the early stage of grain growth. Martínez et al. [
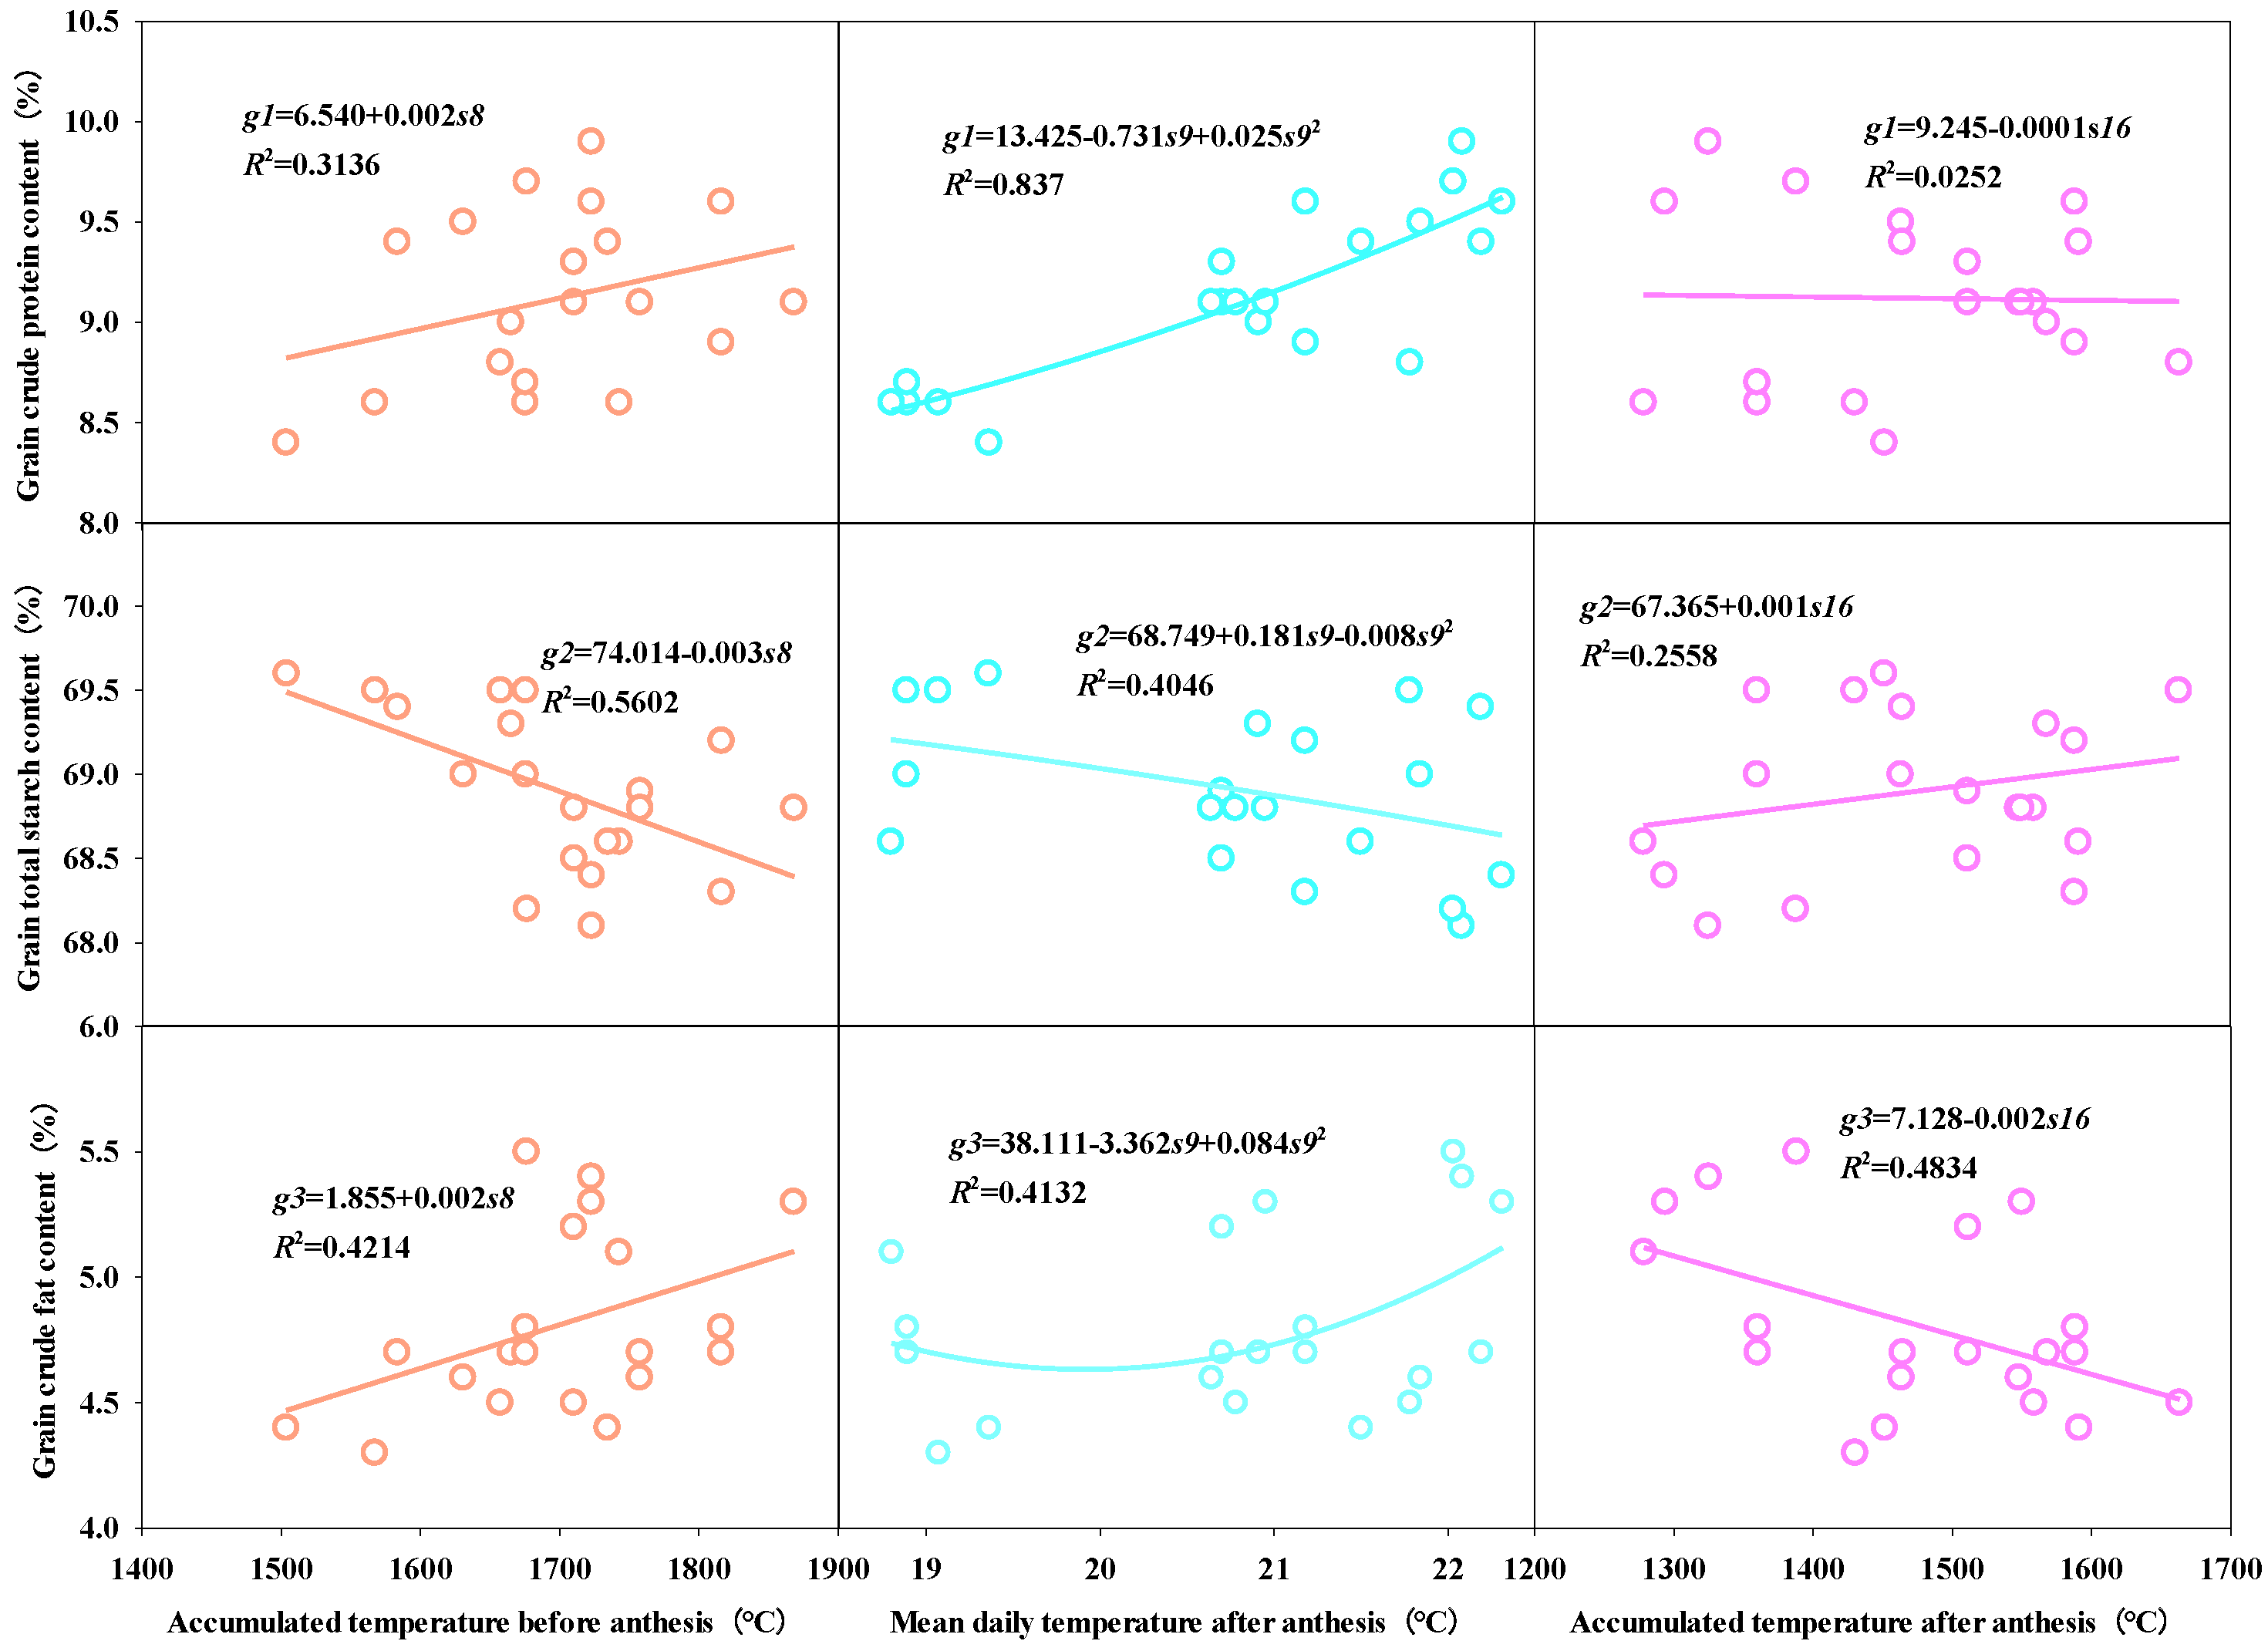
40] found that the amylose percentage and amylose/total starch ratio of grains were significantly affected by environmental conditions, and the lowest temperature during the active grain filling period was an environmental factor that could better explain the differences in grain starch composition. This study shows that pre-anthesis cumulative temperature, mean post-anthesis temperature, and post-anthesis cumulative temperature can indirectly influence the 100-grain weight through their relationship with grain nutritional quality, but that these three meteorological elements have different effects on different nutritional quality components. The after-anthesis average temperature had the greatest indirect effect on crude protein content, the before-anthesis accumulated temperature had the greatest indirect effect on total starch content, and the after-anthesis accumulated temperature had the greatest indirect effect on crude fat content. As for the differences in the response of grain starch and crude protein contents to temperature, we believe that these differences may be caused by starch and protein deposition in endosperm tissues [21] and the different sensitivity of enzyme systems related to material transformation to heat stress. The quantitative analysis of pre-anthesis accumulated temperature, post-anthesis average temperature, and post-anthesis accumulated temperature was found that the current test under the condition of grain crude protein, crude fat, and total starch content and there is still a large gap between the theoretical value Therefore, the effects of pre-anthesis accumulation temperature, post-anthesis average temperature, and post-anthesis accumulation temperature on the nutritional quality of the grains can be harmonized by the selection of suitable sowing periods and the application of hybrids of different growth stages. Ultimately, maize grain weight can be increased on the basis of optimizing the content of various quality components in the grains. Additionally, previous studies have found that in maize kernels, drought stress modified the food and feed quality by increasing the concentrations of nitrogen, magnesium, zinc, and prolamin and by reducing concentrations of potassium and glutelin [41]. The changes in rain-fall patterns at critical growth maize stages seemed to be a more important factor than temperature in regulating the response of maize cultivars in terms of grain yield and quality to various fertilization regimes [42]. In this study, the relationship between grain nutritional quality fractions and rainfall was small, which we believe may be due to the fact that supplemental irrigation and other measures during cultivation reduced the effect of rainfall on grain nutritional quality fractions. Wang et al. [43] reported that shading improved protein content but limited starch deposition and suggested that the lower IAA content led to reduced starch and protein synthase activity. In this study, the relationship between radiation and grain nutritional quality fractions was also small, which may be due to the fact that this experiment was conducted in only one ecological zone and the differences in radiation levels were small. Future research could be carried out in multiple ecological zones over a number of years to further refine the pattern of response of the nutritional quality components of the grains to meteorological elements.
Given the relationship between grain weight and nutritional quality and meteorological factors, it is easy to see that it is possible to improve the nutritional quality of maize seeds while ensuring high yields by adapting hybrids to their ecological suitability and creating optimum conditions for the interaction of genetic and non-genetic factors through the regulation of cultivation techniques under different ecological conditions.

5. Conclusions

Among the pre-anthesis meteorological elements, total sunshine hours, mean temperature, relative humidity, and the cumulative temperature had a strong effect on grain weight; among the post-anthesis meteorological elements, mean daily temperature, total rainfall, temperature difference, cumulative temperature, mean daily highest temperature, and total sunshine hours had a strong effect on grain weight. There was a significant correlation (p < 0.05) between the 100-grain weight and the nutritional quality components of the kernels, and the grain weight potential of each maize hybrid can be further explored by optimizing the grain quality component content. For example, in the process of increasing the total starch content of the grains, the weight of the grains also increases significantly. Average post-anthesis temperature, pre-anthesis accumulated temperature, and post-anthesis accumulated temperature can have a greater indirect effect on the 100-grain weight through their relationship with the nutritional quality components of the grains, but these three meteorological elements have different effects on the different nutritional quality components, with the average post-anthesis temperature having the greatest negative indirect effect on the crude protein content of the grains, the pre-anthesis accumulated temperature having the greatest negative indirect effect on the total starch content of the grains, and the post-anthesis accumulated temperature having the greatest positive indirect effect on the crude fat content of the grains. Therefore, the effects of pre-anthesis accumulation temperature, post-anthesis average temperature, and post-anthesis accumulation temperature on the nutritional quality of the grains can be harmonized by the selection of suitable sowing periods and the application of hybrids of different growth stages. Ultimately, maize grain weight can be increased on the basis of optimizing the content of various quality components in the grains.

Supplementary Materials

The following supporting information can be downloaded at: https://www.mdpi.com/article/10.3390/agronomy13020424/s1, Figure S1: Differences in yield and component factors of maize varieties under different meteorological conditions.

Author Contributions

Performed the experiments: L.W., J.G. and S.H. Analyzed the data: L.W., D.M. and X.Y. Revised the manuscript critically for important intellectual content: X.Y., J.G. and D.M. Wrote the paper: L.W., H.G. and X.Y. All authors have read and agreed to the published version of the manuscript.

Funding

This study was supported by the Key Program of Action Plan to Revitalize Inner Mongolia through Science and Technology (KJXM2020001-06), Science and Technology Innovation Projects for High Yield and Efficiency of Grain (Grant No. 2017YFD0300804), Key Laboratory of Crop Cultivation and Genetic Improvement of Inner Mongolia Autonomous Region (None), National Maize Industrial Technology Systems (Grant No. CARS-02-50), Inner Mongolia Science and Technology Major Special Project (2021ZD0003-1), and the Crop Science Observation and Experiment Station in Loess Plateau of North China, Ministry of Agriculture, P.R. of China (Grant No. 25204120).

Conflicts of Interest

The authors declare no conflict of interest.

References

  1. Ureta, C.; González, E.J.; Espinosa, A.; Trueba, A.; Piñeyro, N.A.; Elena, R.Á. Maize yield in Mexico under climate change. Agric. Syst. 2020, 177, 102697–102707. [Google Scholar] [CrossRef]
  2. Simić, M.; Dragičeví, V.; Drinić, S.M.; Vukadinović, J.; Kresoví, B.; Tabaković, M.; Brankov, M. The Contribution of Soil Tillage and Nitrogen Rate to the Quality of Maize Grain. Agronomy 2020, 10, 976–989. [Google Scholar] [CrossRef]
  3. Jahangirlou, M.R.; Akbari, G.A.; Alahdadi, I.; Soufizadeh, S.; Parson, D. Grain Quality of Maize Cultivars as a Function of Planting Dates, Irrigation and Nitrogen Stress: A Case Study from Semiarid Conditions of Iran. Agriculture 2021, 11, 11–26. [Google Scholar] [CrossRef]
  4. Chen, X.M.; Liang, X.G.; Zhao, X.; Gao, Z.; Wu, G.; Sheng, S.; Ling, S.; Zhou, L.L.; Zhou, S.L. Analysis on the trends of yield and quality related traits for maize hybrids released in China over the past years. Sci. Agric. Sin. 2018, 51, 4020–4029. (In Chinese) [Google Scholar]
  5. Correndo, A.A.; Fernandez, J.A.; Prasad, P.V.; Ciampitti, I.A. Do Water and Nitrogen Management Practices Impact Grain Quality in Maize. Agronomy 2021, 11, 1851–1864. [Google Scholar] [CrossRef]
  6. Stutts, L.; Wang, Y.; Stapleton, A.E. Plant growth regulators ameliorate or exacerbate abiotic, biotic and combined stress interaction effects on Zea mays kernel weight with inbred-specific patterns. Environ. Exp. Bot. 2018, 147, 179–188. [Google Scholar] [CrossRef]
  7. Yu, S.N.; Gao, J.L.; Ming, B.; Wang, Z.; Zhang, B.L.; Yu, X.F.; Sun, J.Y.; Liang, H.W.; Wang, Z.G. Quantification planting density based on heat resource for enhancing grain yield and heat utilization efficiency of grain mechanical harvesting maize. Chin. J. Eco-Agric. 2021, 29, 2046–2060. (In Chinese) [Google Scholar]
  8. Tao, Z.Q.; Chen, Y.Q.; Li, C.; Zou, J.X.; Yan, P.; Yuan, S.F.; Wu, X.; Sui, P. The causes and impacts for heat stress in spring maize during grain filling in the North China Plain—A review. J. Integr. Agric. 2016, 15, 2677–2687. [Google Scholar] [CrossRef] [Green Version]
  9. Babel, M.S.; Turyatunga, E. Evaluation of climate change impacts and adaptation measures for maize cultivation in the western Uganda agro-ecological zone. Theor. Appl. Climatol. 2014, 119, 239–254. [Google Scholar] [CrossRef]
  10. Walne, C.H.; Reddy, K.R. Temperature Effects on the Shoot and Root Growth, Development, and Biomass Accumulation of Corn (Zea mays L.). Agriculture 2022, 12, 443–463. [Google Scholar] [CrossRef]
  11. Lu, D.L.; Cai, X.M.; Zhao, J.Y.; Shen, X.; Lu, W.P. Effects of drought after pollination on grain yield and quality of fresh waxy maize. J. Sci. Food. Agric. 2015, 95, 210–215. [Google Scholar] [CrossRef]
  12. Butts, W.C.; Seebauer, J.R.; Singleton, L.; Below, F.E. Weather During Key Growth Stages Explains Grain Quality and Yield of Maize. Agronomy 2019, 9, 16–30. [Google Scholar] [CrossRef]
  13. Barutçular, C.; Dizlek, H.; EL-Sabagh, A.; Sahin, T.; Elsabagh, M.; Islam, M.S. Nutritional quality of maize in response to drought stress during grain-filling stages in mediterranean climate condition. J. Exp. Biol. Agric. Sci. 2016, 4, 644–652. [Google Scholar] [CrossRef]
  14. Ali, Q.; Ashraf, M.; Anwar, F. Seed Composition and Seed Oil Antioxidant Activity of Maize Under Water Stress. J. Am. Oil Chem. Soc. 2010, 87, 1179–1187. [Google Scholar] [CrossRef]
  15. Yang, H.; Gu, X.T.; Ding, M.Q.; Lu, W.P.; Lu, D.L. Heat stress during grain filling affects activities of enzymes involved in grain protein and starch synthesis in waxy maize. Sci. Rep. 2018, 8, 15665–15673. [Google Scholar] [CrossRef] [Green Version]
  16. Mayer, L.I.; Savin, R.; Maddonni, G.A. Heat Stress during Grain Filling Modifies Kernel Protein Composition in Field-Grown Maize. Crop Sci. 2016, 56, 1890–1903. [Google Scholar] [CrossRef]
  17. Kayad, A.; Sozzi, M.; Gatto, S.; Whelan, B.; Sartori, L. Ten years of corn yield dynamics at field scale under digital agriculture solutions: A case study from North Italy. Comput. Electron. Agric. 2021, 185, 106126–106137. [Google Scholar] [CrossRef]
  18. Yang, B.; Wu, S.; Yan, Z. Effects of Climate Change on Corn Yields: Spatiotemporal Evidence from Geographically and T emporally Weighted Regression Model. ISPRS Int. J. Geoinf. 2022, 11, 433–454. [Google Scholar] [CrossRef]
  19. Borrás, L.; Gambín, B.L. Trait dissection of maize kernel weight: Towards integrating hierarchical scales using a plant growth approach. Field Crops Res. 2010, 118, 1–12. [Google Scholar] [CrossRef]
  20. Wu, Y.W.; Zhao, B.; Li, X.L.; Liu, Q.L.; Feng, D.J.; Lan, T.Q.; Kong, F.L.; Li, Q.; Yuan, J.C. Nitrogen application affects maize grain filling by regulating grain water relations. J. Integr. Agric. 2022, 21, 977–994. [Google Scholar] [CrossRef]
  21. Lu, D.L.; Sun, X.L.; Yan, F.B.; Lu, W.P. Effects of high temperature during grain filling under controlconditions on the physicochemical properties of waxy maize flour. Carbohydr. Polym. 2013, 98, 302–310. [Google Scholar] [CrossRef] [PubMed]
  22. Bonelli, L.E.; Monzon, J.P.; Cerrudo, A.; Rizzalli, R.H.; Andrade, F.H. Maize grain yield components and source-sink relationship asaffected by the delay in sowing date. Field Crops Res. 2016, 198, 215–225. [Google Scholar] [CrossRef]
  23. Gambín, B.L.; Borrás, L.; Otegui, M.E. Source–sink relations and kernel weight differences in maize temperate hybrids. Field Crops Res. 2006, 95, 316–326. [Google Scholar] [CrossRef]
  24. Edreira, J.R.; Otegui, M.E. Heat stress in temperate and tropical maize hybrids: A novel approach for assessing sources of kernel loss in field conditions. Field Crops Res. 2013, 142, 58–67. [Google Scholar] [CrossRef]
  25. Sun, H.Y.; Zhang, X.Y.; Chen, S.Y.; Pei, D.; Liu, C.M. Effects of harvest and sowing time on the performance of the rotation of winter wheat–summer maize in the North China Plain. Ind. Crops Prod. 2007, 25, 239–247. [Google Scholar] [CrossRef]
  26. Huang, M.; Jiang, L.G.; Zou, Y.B.; Zhang, W.X. On-farm assessment of effect of low temperature at seedling stage on early-season rice quality. Field Crops Res. 2013, 141, 63–68. [Google Scholar] [CrossRef]
  27. Liu, L.M.; Klocke, N.; Yan, S.P.; Rogers, D.; Schlegel, A.; Lamm, F.; Chang, S.I.; Wang, D.H. Impact of Deficit Irrigation on Maize Physical and Chemical Properties and Ethanol Yield. Cereal Chem. 2013, 90, 453–462. [Google Scholar] [CrossRef] [Green Version]
  28. Yang, H.; Huang, T.Q.; Ding, M.Q.; Lu, D.L.; Lu, W.P. Effects of Waterlogging Around Flowering Stage on the Grain Yield and Eating Properties of Fresh Waxy Maize. Cereal Chem. 2016, 93, 605–611. [Google Scholar] [CrossRef]
  29. Xue, J.; Gou, L.; Zhao, Y.S.; Yao, M.N.; Yao, H.S.; Tian, J.S.; Zhang, W.F. Effects of light intensity within the canopy on maize lodging. Field Crops Res. 2016, 1, 133–141. [Google Scholar] [CrossRef]
  30. Paweł, R.; Wioleta, W.D.; Tomasz, K.; Anna, D.; Maksymilian, Z.; Małgorzata, K.; Elżbieta, R. Photosynthesis and organization of maize mesophyll and bundle sheath thylakoids of plants grown in various light intensities. Environ. Exp. Bot. 2019, 162, 72–86. [Google Scholar]
  31. Zhang, C.H.; Gu, K.J.; Gu, D.X.; Zhang, S.M.; Wu, J.J. Quantifying the effect of low-temperature events on the grain quality formation of wheat. J. Cereal Sci. 2021, 100, 103257–103265. [Google Scholar] [CrossRef]
  32. Wang, G.F.; Chen, G.Z.; Si, L.Y.; Jin, Y.; Hao, Y.C.; Zhang, R.H.; Zhang, X.H.; Xue, J.Q.; Lu, H.D. Effects of Grain Yield and Nutritional Quality of Different Maize Varieties under High Densities. J. Maize Sci. 2019, 27, 88–94. (In Chinese) [Google Scholar]
  33. Dhillon, A.K.; Sharma, N.; Dosanjh, N.K.; Goyal, M.; Mahajan, G. Variation in the nutritional quality of rice straw and grain in response to different nitrogen levels. J. Plant Nutr. 2018, 41, 1946–1956. [Google Scholar] [CrossRef]
  34. Wang, Y.X.; Frei, M. Stressed food—The impact of abiotic environmental stresses on crop quality. Agric. Ecosyst. Environ. 2011, 141, 271–286. [Google Scholar] [CrossRef]
  35. Thitisaksakul, M.; Jiménez, R.C.; Arias, M.C.; Beckles, D.M. Effects of environmental factors on cereal starch biosynthesis and composition. J. Cereal Sci. 2012, 56, 67–80. [Google Scholar] [CrossRef]
  36. Patindol, J.A.; Siebenmorgen, T.J.; Wang, Y.J. Impact of environmental factors on rice starch structure: A review. Starch 2015, 67, 42–54. [Google Scholar] [CrossRef]
  37. Mariem, S.B.; Soba, D.; Zhou, B.W.; Loladze, I.; Morales, F.; Aranjuelo, I. Climate Change, Crop Yields, and Grain Quality of C3 Cereals: A Meta-Analysis of [CO2], Temperature, and Drought Effects. Plants 2021, 10, 1052–1070. [Google Scholar] [CrossRef]
  38. Shi, L.J.; Wen, Z.R.; Zhang, S.B.; Wang, Y.; Lu, W.P.; Lu, D.L. Effects of water deficit at flowering stage on yield and quality of fresh waxy maize. Acta Agron. Sin. 2018, 44, 1205–1211. (In Chinese) [Google Scholar] [CrossRef]
  39. Chen, N.N.; Ji, R.P.; Jia, Q.Y.; Feng, R.; Mi, N.; Zhang, S.J.; Zhang, Y.S.; Yu, W.Y. Effects of drought stress at key growth stages on yield and grain quality of spring maize. Chin. J. Eco. 2021, 40, 1687–1694. (In Chinese) [Google Scholar]
  40. Martínez, R.D.; Cirilo, A.G.; Cerrudo, A.; Andrade, F.H.; Reinoso, L.; Valentinuz, O.R.; Balbi, C.N.; Lzquierdo, N.G. Changes of starch composition by post flowering environmental conditions in kernels of maize hybrids with different endosperm hardness. Eur. J. Agron. 2017, 86, 71–77. [Google Scholar] [CrossRef]
  41. Erbs, M.; Manderscheid, R.; Liane, H.; Schenderlein, A.; Wieser, H.; Dänicke, S.; Weigel, H.J. Free-air CO2 enrichment modifies maize quality only under drought stress. Agron. Sustain. Dev. 2014, 35, 203–212. [Google Scholar] [CrossRef] [Green Version]
  42. Djalovic, I.; Riaz, M.; Akhtar, K.; Bekavac, G.; Paunovic, A.; Pejanovic, V.; Zaheer, S.; Prasad, P.V. Yield and Grain Quality of Divergent Maize Cultivars under Inorganic N Fertilizer Regimes and Zn Application Depend on Climatic Conditions in Calcareous Soil. Agronomy 2022, 12, 2705–2716. [Google Scholar] [CrossRef]
  43. Wang, J.; Shi, K.; Lu, W.P.; Lu, D.L. Effects of Post-silking Shading Stress on Enzymatic Activities and Phytohormone Contents During Grain Development in Spring Maize. J. Plant Growth Regul. 2020, 40, 1060–1073. [Google Scholar] [CrossRef]
Figure 1. Daily values of main meteorological factors in the analyzed years during the growth period in the experimental area.
Agronomy 13 00424 g001
Figure 2. The difference of the 100-grain weight of maize hybrids in different years. Note: In the boxplot, the solid line represents the median, the dotted line represents the average, and the top and bottom of the box represent the upper and lower quartiles. Different letters indicate significant difference (p < 0.05).
Agronomy 13 00424 g002
Figure 3. The difference of grain nutritional quality of maize hybrids in different years. Note: In the boxplot, the solid line represents the median, the dotted line represents the average, and the top and bottom of the box represent the upper and lower quartiles. Different letters indicate significant difference (p < 0.05).
Agronomy 13 00424 g003aAgronomy 13 00424 g003b
Figure 4. Correlation analysis between grain nutritional quality and the 100-grain weight. Note: “n” = the number of samples. “*” significant at p < 0.05, “**” significant at p < 0.01.
Agronomy 13 00424 g004
Figure 5. Regression analysis of grain nutritional quality and the 100-grain weight.
Agronomy 13 00424 g005
Figure 6. Regression analysis of selected meteorological factors and grain nutritional quality.
Agronomy 13 00424 g006
Table 1. The main growth duration days of different periods of analyzed maize hybrids.
PeriodHybridYears
2018201920202021
Sowing periodAll4/214/234/264/29
Sowing period–Silking periodZD284 d86 d83 d82 d
DY1384 d88 d83 d82 d
YD1382 d86 d86 d84 d
XY33580 d84 d78 d79 d
DH61878 d82 d75 d76 d
Silking period–Mature periodZD258 d73 d71 d74 d
DY1360 d75 d71 d74 d
YD1363 d73 d67 d73 d
XY33567 d75 d75 d74 d
DH61866 d75 d75 d75 d
Harvest periodAll10/110/610/710/15
Table 2. ANOVA results for the 100-grain weight measured between the growing year and hybrids.
Source of VariationDF100-Grain Weight (F-Value)
Years (Y)3150.30 **
Hybrids (H)4280.48 **
Y × H123.19 **
Error MS1001.19
Note: “**” significant at p < 0.01.
Table 3. ANOVA results for grain nutritional quality measured between the growing year and hybrids.
Source of VariationDFGrain Crude Protein Content (F-Value)Grain Total Starch Content (F-Value)Grain Crude Fat Content (F-Value)
Years (Y)361.56 **9.20 **44.08 **
Hybrids (V)45.10 **14.30 **85.60 **
Y × V122.72 **2.70 **4.47 **
Error MS1000.0880.2190.030
Note: “**” significant at p < 0.01.
Table 4. Multiple linear regression analysis of pre-anthesis meteorological factors and the 100-grain weight.
ModelB (Coefficient)Standard ErrorF-ValuePr > F
Intercept213.2223.3683.33<0.0001
s1−1.830.834.860.044
s50.030.0135.69<0.0001
s6−3.190.4452.09<0.0001
s8−0.020.016.850.019
Note: Variables s2, s3, s4, and s7 were removed. The significance of the variables retained in the model was less than 0.1. s1–s8 represent the eight meteorological factors (average temperature, total rainfall, average daily highest temperature, average daily lowest temperature, total sunshine hours, relative humidity, temperature difference, and accumulated temperature (≥10 °C)) before the anthesis, the same below.
Table 5. Multiple linear regression analysis of the 100-grain weight and after anthesis meteorological factors.
ModelB (Coefficient)Standard ErrorF-ValuePr > F
Intercept427.27156.127.490.017
s940.6414.947.400.018
s100.100.054.150.062
s11−52.8718.238.410.012
s13−0.090.037.160.019
s1510.684.086.850.021
s160.070.0127.500.000
Note: Variables s12 and s14 were removed. s9–s16 represent the eight meteorological factors (average temperature, total rainfall, average daily highest temperature, average daily lowest temperature, total sunshine hours, relative humidity, temperature difference, and accumulated temperature (≥10 °C)) after the anthesis, the same below.
Table 6. Multiple linear regression analysis of meteorological elements and crude protein content in grains.
ModelB (Coefficient)Standard ErrorF-ValuePr > F
Intercept−29.7317.592.860.115
s1−6.783.573.600.080
s20.030.015.420.037
s35.022.663.580.081
s41.790.874.210.061
s60.180.094.270.059
s100.020.017.370.018
Note: Variables s5, s7, s8, s9, s11, s12, s13, s14, s15, and s16 are excluded.
Table 7. Multiple linear regression analysis of meteorological factors and total starch content in grains.
ModelB (Coefficient)Standard ErrorF-ValuePr > F
Intercept170.0534.8723.790.000
s111.434.127.680.016
s3−13.654.728.370.013
s76.632.149.600.009
s13−0.010.006.820.022
s14−0.910.318.540.012
s160.010.0011.840.004
Note: Variables s2, s4, s5, s6, s8, s9, s10, s11, s12, and s15 are excluded.
Table 8. Multiple linear regression analysis of meteorological factors and grain crude fat content.
ModelB (Coefficient)Standard ErrorF-ValuePr > F
Intercept−4.088.780.220.653
s17.061.0842.740.000
s4−5.481.1223.790.001
s50.010.009.050.015
s7−5.640.7556.67<0.0001
s8−0.010.0031.840.000
s100.020.00195.46<0.0001
s11−24.994.8426.680.001
s1225.054.8926.200.001
s13−0.010.00185.68<0.0001
s1527.645.0829.670.000
Note: Variables s2, s3, s6, s9, s14, and s16 are excluded.
Table 9. Path analysis of meteorological factors, grain nutritional quality, and the 100-grain weight.
IndexDirect Path CoefficientIndirect Path Coefficient
g1 − yg2 − yg3 − y
g1−0.037 −0.217−0.213
g20.2940.027 0.282
g3−0.419−0.019−0.198
s1−0.293−0.009−0.060−0.019
s50.055−0.013−0.073−0.200
s6−0.017−0.002−0.050−0.171
s8−0.202−0.012−0.165−0.177
s91.835−0.031−0.119−0.131
s102.254−0.020−0.060−0.154
s11−1.719−0.029−0.113−0.110
s13−1.995−0.0070.020−0.049
s150.3580.0300.1200.113
s160.5150.0010.0720.203
Note: y stands for the 100-grain weight; g1 − g3 showed the contents of crude protein, total starch, and crude fat in grains.
Disclaimer/Publisher’s Note: The statements, opinions and data contained in all publications are solely those of the individual author(s) and contributor(s) and not of MDPI and/or the editor(s). MDPI and/or the editor(s) disclaim responsibility for any injury to people or property resulting from any ideas, methods, instructions or products referred to in the content.

