Article

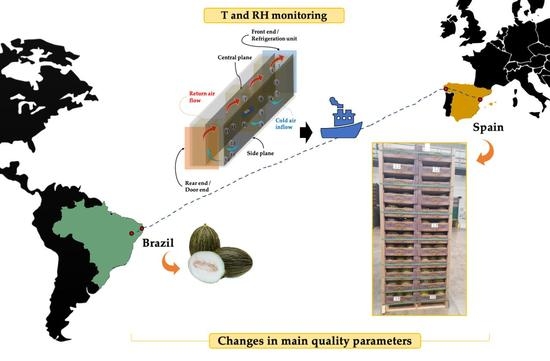
Environmental and Qualitative Monitoring of a Transoceanic Intermodal Transport of Melons

by
Eva Cristina Correa
1,
Noelia Castillejo
2,3,
Pilar Barreiro
1,
Belén Diezma
1,
Miguel Garrido-Izard
1,
Jossivan Barbosa Menezes
4 and
Encarna Aguayo
2,3,*
1
Laboratorio de Propiedades Físicas y Técnicas Avanzadas en Agroalimentación, ETSIAAB, Universidad Politécnica de Madrid, Avda. Puerta de Hierro 2, 28040 Madrid, Spain
2
Postharvest and Refrigeration Group, Universidad Politécnica de Cartagena (UPCT), 30202 Cartagena, Spain
3
Food Quality and Health Group, Institute of Plant Biotechnology (UPCT), Campus Muralla del Mar, 30202 Cartagena, Spain
4
Departamento de Ciências Ambientais, Universidade Federal Rural do Semi-Árido, Av. Fco Mota Bairro, 572, Pres. Costa e Silva, Mossoró 59625-900, Brazil
*
Author to whom correspondence should be addressed.
Agronomy 2023, 13(1), 33; https://doi.org/10.3390/agronomy13010033
Submission received: 29 November 2022 / Revised: 16 December 2022 / Accepted: 19 December 2022 / Published: 22 December 2022
(This article belongs to the Collection Advances of Agricultural Robotics in Sustainable Agriculture 4.0)

Abstract

:
To supply the off-season melon market, Europe imports from distant markets in other countries, mainly Brazil. Cold transportation takes at least 15–20 days, thus increasing the risk of quality losses. Moreover, product deliveries, especially in international markets, can result in supply chain inefficiencies that negatively affect carbon footprint and expected freshness. Implementing quality sensors and advanced cold chain management could help to reduce these problems. The objective of this work was to monitor a real transoceanic intermodal transport of melons (Brazil to Spain), through the implementation of multi-distributed environmental sensors (15 ibuttons loggers) to evaluate the remaining shelf-life (RSHL) of melons at destination. The sensors’ location within the cargo reached a maximum variability range of 4 °C. Using digital sensors to track temperature variations, it was verified that in different locations in the container, the melon RSHL at the end of the journey, was nine days and 19 h in colder spots, while in the hottest spot, the RSHL was reduced to five days and 22 h. This fact has substantial implications for improved tracking of temperature to maintain fruit quality for market, potentially reducing waste, and contributing to higher profit margins for international food supply chains.

Graphical Abstract

1. Introduction

The world production of melon (Cucumis melo L.) was 28,467,920 tons in 2020 [1]. To supply the off-season melon market, Europe imports melons from distant markets in other countries, mainly from Brazil. That country has favourable melon-growing climate conditions, which has made it one of the leading suppliers of melons to European consumers. Cold transportation of the melons usually takes at least 15–20 days, plus additional periods before the fruit finally reach consumers [2]. This long distance increases the risk of quality losses; this is particularly critical in fresh products such as melon where temperature control is essential to maintain the quality.
However, nowadays, irregularities in the global food system mean that product deliveries are not flowing, especially in international markets, resulting in supply chain inefficiencies that negatively affect the carbon footprint, food waste, consumer prices, and expected freshness. Although visibility and transparency will be key to business success in the next ten years, companies are slow to adopt digital tools that could enable better matching of supply and demand and identify critical points that generate product losses. In fact, the implementation of quality sensors and advanced cold chain management, and the application of big data and artificial intelligence still remains quite low.
In most studies, the estimation of the remaining shelf-life of fruits and vegetables is carried out by applying generic models and assuming standard values for parameters such as the temperature increase factor (Q10) or the reference shelf-life and average temperatures throughout the supply chain. These simplistic assumptions can lead to unrealistic predictions of quality and shelf-life evolution. Therefore, firstly, it is essential to monitor actual temperatures to identify their temporal and spatial fluctuations using multi-distributed sensors in the cargo, to more accurately predict changes in the quality and the remaining shelf-life [3]. In addition, this monitoring, together with sensory and instrumental evaluations of the products, would enable species- and variety-specific adjustments to be made to the parameters of the remaining shelf-life estimation models [4]. Changes in melon quality during cold storage have previously been studied: to evaluate the degree of sensitivity to chilling injury of different Piel de Sapo melon cultivars by exposing the fruit to temperatures between 2 °C and 9 °C [5]; to establish the susceptibility to postharvest physiological disorders and decay in Piel de Sapo melons [6]; and to report the effect of postharvest fruit sanitation treatments and different packaging formats in a nine-day shipment of oriental melons at 3 °C [7]. However, few authors have studied the evolution of fruit quality during transoceanic transport, not only by comparing the final and initial state of a representative sample, but also by considering the effect that different locations of the product in an intermodal container may have on that evolution.
In this context, the objective of this work was to monitor a real transoceanic intermodal transport of melons, by implementing multi-distributed environmental sensors to evaluate the effects that postharvest conditions have on the quality and remaining shelf-life of melons at destination. This monitorisation would help to improve supply chain inefficiencies, thereby reducing food waste and hence, the carbon footprint.

2. Materials and Methods

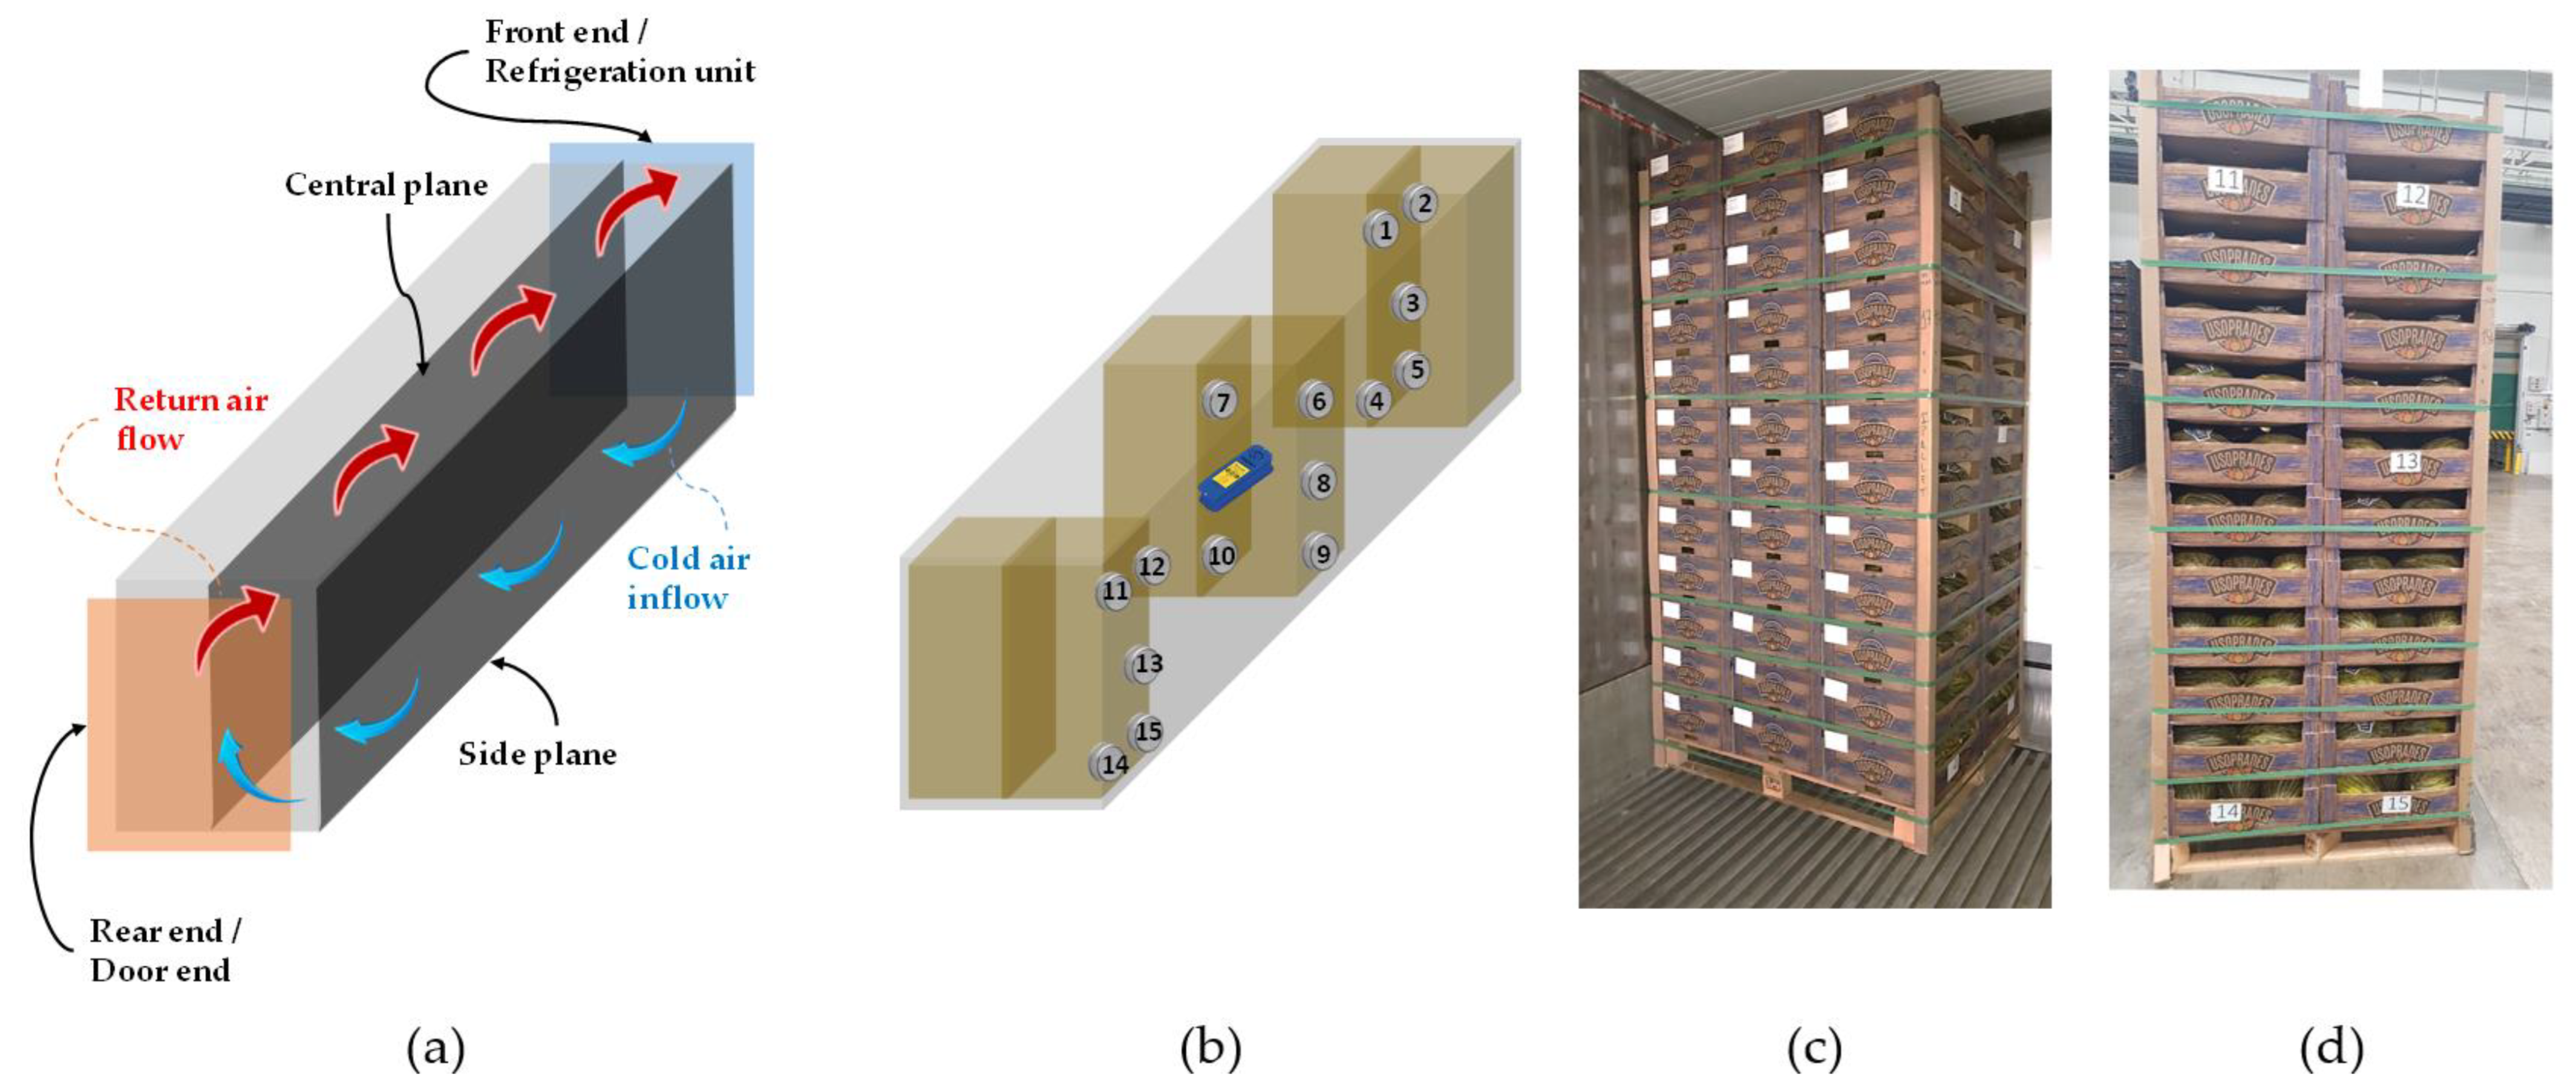
2.1. Experimental Setup

Twenty-one pallets with 23,760 kg of Piel de Sapo melons (Cucumis melo var. inodorus H. Jacq.), ‘Ricura’ cv., loaded in a 40′ reefer (11.6 × 2.3 × 2.2 m for internal dimensions), were monitored in a multimodal shipment from Jandaíra (Brazil) to Castellón (Spain). From a physiological point of view, Piel de Sapo melon behaves as a non-climacteric fruit, with a low respiration rate during development and ripening. However, ‘Ricura’ cv. is partially climacteric because one of its parents is climacteric (seed company personal information). The Piel de Sapo melon is recommended to be kept at 8–9 °C (85–90% RH) to avoid chilling injury and to extend its shelf-life [5].
Table 1 shows the complete itinerary of 20.5 days followed by the reefer. The first 11 days of travel were made in a vessel from the port of Natal (Brazil) to the port of Vigo (Spain), where the reefer was on standby for eight days, then the container was transferred to a truck. This stage of the journey lasted one day, finally arriving at the fruit packinghouse in Castellón (Spain).
The cold chain data was stored for the cargo owner by an Xsense® logger (Xsense Ltd., Migdal Tefen, Israel) located in the geometric centre of the container (GCC). In this experiment, only one Xsense® logger was placed, although it is recommended to use a minimum of two. In addition, a multi-distributed sensor network consisting of 15 ibutton loggers (Measurement Systems Ltd., Berkshire, UK) was set up. The ibuttons were distributed along the cargo and were attached to the inner surface of the cartons (Figure 1): ibuttons 1, 2, 3, 4, and 5 were located next to the refrigeration unit, ibuttons 6, 7, 8, 9, and 10 were located in the centre of the reefer, and ibuttons 11, 12, 13, 14, and 15 were located next to the reefer door. At their locations, ibuttons 1, 2, 3, 4, 5, 7, and 10 were oriented towards the central plane of the container and ibuttons 6, 8, 9, 11, 12, 13, 14, and 15 were oriented to the side plane of the container.
Table 2 shows the technical characteristics of both types of loggers, equipped with temperature (T) and relative humidity (RH) sensors, autonomous in power supply, and with on board data memory. The Xsense® wireless datalogger operates in the 433 MHz frequency band and supports mesh connectivity; when the logger is in the presence of an Xsense® wireless control unit, it will connect to the control unit and then transfer its readings to it. For ibuttons, the information transfer between the logger and the PC is carried out by wire with momentary connection using a Blue Dot™ receptor; transmission is at 125 kbps, using a 1-wire RJ45 to USB adaptor. An ibutton with an internal memory of 4096 data points enables the information of the T and RH to be gathered with a high temporal resolution (9 min/data point in this experiment) versus the resolution showed by Xsense® (60 min/data point) with an internal memory available of 1000 data points.
When the reefer arrived in Castellón, the pallets were unloaded from the truck. The loggers were then recovered to download the information.

2.2. Quality Parameters: Firmness, Soluble Solids Content, Individual Organic Acids and Sugars, Vitamin C

For quality parameter analysis, two melon boxes (six fruits/box) were selected for each ibutton position. A total of 30 melon boxes were transported by car (350 km) to the Postharvest and Refrigeration laboratory (Universidad Politécnica de Cartagena). Since these melons were packed in Brazil for commercial objectives and no mechanical or fungus damage was found in the melons, no fruit was discarded and the whole melon boxes were used for quality analysis.
Firmness was measured at two points in the external equatorial zone of each whole melon using universal testing equipment (Ibertest SAE, Madrid, Spain). The method chosen for measuring the firmness of the whole melon was non-destructive and consisted in gently compressing the fruit using two 100 mm diameter plates. A preload of 1 N was applied to carry out a maximum deformation of 2.2 mm with a velocity of 15 mm·s1. The data obtained were reported in terms of force (N). A total of 12 melons (two melon boxes) per ibutton position were analysed.
After measuring their firmness, half of the fresh melons were peeled, the seeds removed and the melons were chopped into pieces which were homogenised into juice using a blender (Robot Coupe, (J80 Ultra, Vincennes, Île-de-France, France). Soluble solids content (SSC) was determined for that melon juice, using a handheld digital refractometer (Atago N1; Tokyo, Kanto, Japan) at 20 °C. Results were expressed as °Brix. Part of these juices were frozen and stored at −80 °C until analysis.
For individual organic acids and sugars, 20 mL of melon juice was thawed and centrifuged at 3220× g for 15 min at 4 °C. Then, 5 mL of the supernatant was transferred into a Sep-Pack cartridge (Waters, Wexford, Ireland), previously activated with 5 mL of methanol, 5 mL of ultrapure water, and 5 mL of air. The purified sample was filtered through a 0.2 µm nylon filter. For organic acid content, 20 µL of diluted extract (1:10, v:v) was injected into ultra-high-performance liquid chromatograph (UHPLC) equipment (Shimadzu, Kyoto, Japan) as previously described by Silveira et al. [8] and with a Rezex RAM column (250 mm × 4.6 mm, 2.6 μm particle size; Phenomenex, Macclesfield, UK) using a mobile phase of 2.5 mM sulfuric acid with a flow rate of 0.6 mL min1 for 30 min. Chromatograms were recorded at 210 nm using a diode array detector (DAD). Commercial standards (Merck KGaA, Darmstadt, Germany) of citric, malic, succinic, and fumaric acids were used for identification and quantification. Organic acid content was expressed in g kg1 fresh weight (fw). For individual sugar content, the diluted extract (1:100, v:v) was analysed by ion chromatography (Metrohm 871 Advanced Bioscan) and by amperometric detection (945 Professional Detector Vario) for carbohydrate determination, as previously described by Salas-Millán et al. [9]. The mobile phase consisted of a solution of 300 mM NaOH and 1 mM NaOAc and its flow rate was 0.5 mL min1. The elution time was 15 min and the injection volume was 10 µL. Individual sugars were identified and quantified using commercial standards (glucose, fructose, and sucrose). The results were expressed in g kg1 fw.
Vitamin C analysis was performed as previously described by Castillejo et al. [10] with slight modifications. For that, 0.5 g of freeze-dried melon powder was homogenised with 10 mL of cold buffer (0.1 M citric acid, 0.05% EDTA, 4 mM sodium fluoride, and 5% methanol) using an ultraturrax® (IKA, Berlin, Germany). The mixture was protected from light exposure and kept on ice throughout the process. After that, the sample was filtered through a 4-layer gauze and the pH of the extract was rapidly adjusted to 2.35–2.40. The sample was then centrifuged at 10,500× g for 5 min at 4 °C. The supernatant was purified using Sep-Pak C18 cartridges (Waters, Dublin, Ireland) previously activated with 10 mL methanol, 10 mL ultrapure water, and 10 mL air and filtered with 0.45 µm nylon filter. The 750 µm filtered extract was derivatised with 250 µm 1,2-phenylenediamine (OPDA) and incubated at room temperature for 37 min. Then, the 20 µm extract was analysed with an HPLC (1100 series, Agilent Technologies, Waldbronn, Germany) equipped with a G1322A degasser, a G1311A quaternary pump, a G1313A autosampler, a G1316A column heater, and a G1315B photodiode array detector. The flow was isocratic at 1.8 mL min1 of 5 mM hexadecyltrimethylammonium bromide (CTAB) and 50 mM potassium dihydrogen phosphate in methanol:ultrapure water (5:95, v/v). Chromatograms were recorded at 261 nm for ascorbic acid (AA; Merck-Sigma, Darmstadt, Germany) and 348 nm for dehydroascorbic acid (DHA; Merck-Sigma, Darmstadt, Germany). Total vitamin C was quantified as the sum of AA and DHA, and results were expressed as mg kg1 fw. For SSC, organic acids, individual sugars, and vitamin C, two melon boxes (six fruits/box) were analysed for each ibutton position. These 12 melons were grouped into four replicates (three melons/replicate).
The sensory quality (internal appearance, aroma, taste, texture, and overall quality) was assessed by eight members (four men and three women, aged 25 to 55) of a trained sensory panel. This analysis was performed at departure (Brazil) and on arrival (Spain). The internal melon quality was evaluated using a nine-point scale to record their perceptions, 1 = inedible, 3 = poor, 7 = good, and 9 = excellent [11]. The overall quality (OQ) refers to the overall appreciation which is reported here. A score between 5 and 6 indicates a melon was in a ready-to-eat state. Each sensorial sample contained a quarter from each of the 12 melons analysed per ibutton position. The samples were coded with a random three-digit number to mask the treatment identity in order to minimise subjectivity.

2.3. Data Analysis

In order to analyse the data from the sensor recording, the psychrometric model based on the ASABE model which computes from T (temperature) and RH (relative humidity) data, complex parameters such as air enthalpy (h, kJ kgas−1) was used. The psychrometric data ASAE/ASABE D271.2, defined in April 1979 and reviewed in 2005 [12] were used to calculate the psychrometric properties of the air. The total accumulated energy (Sum_h, kJ day kgas−1) was calculated as the area under the curve constructed with the time series of enthalpies over time in days, using the Matlab trapz function. The power of the air (energy over time) was calculated as the quotient between enthalpy with respect to the duration of the period considered (days).
On the other hand, the model of Equation (1) was implemented to estimate the remaining shelf-life (RSHL) of the melons in hours. SHLref is the reference shelf-life in hours, Tn is the sampling temperature in °C, Tref is the reference temperature in °C, Q10 is the temperature-increase factor (dimensionless), and ∆tn is the sampling interval in hours. In general, standard values are assumed for Q10, SHLref, and Tref when this generic model is implemented in the logistics process of fruit and vegetables.
R S H L = S H L r e f n ( Q 10 ( T n T r e f ) / 10   ·   Δ t n )
The optimum storage temperature in the case of Piel de Sapo melons is bounded at 8–9 °C [2,5,6], and a Tref of 9 °C was selected in this work. The maximum shelf-life or SHLref generally ranges from 29 to 45 days [2,5,6], a SHLref of 45 days was selected in this work. Concerning the value of Q10, a standard value of 2 was used, which means that the rate of a biological reaction doubles for every 10 °C increase in temperature [13].
All data analysis has been computed using: MATLAB® for data acquisition from loggers and processing of temperature and RH time series, and Statistica software to compute the characteristic statistics of the quality parameters and perform a one-way ANOVA, where the F-value is the ratio of between-group variability to within-group variability and the p-value is the 95% significance level.

3. Results and Discussions

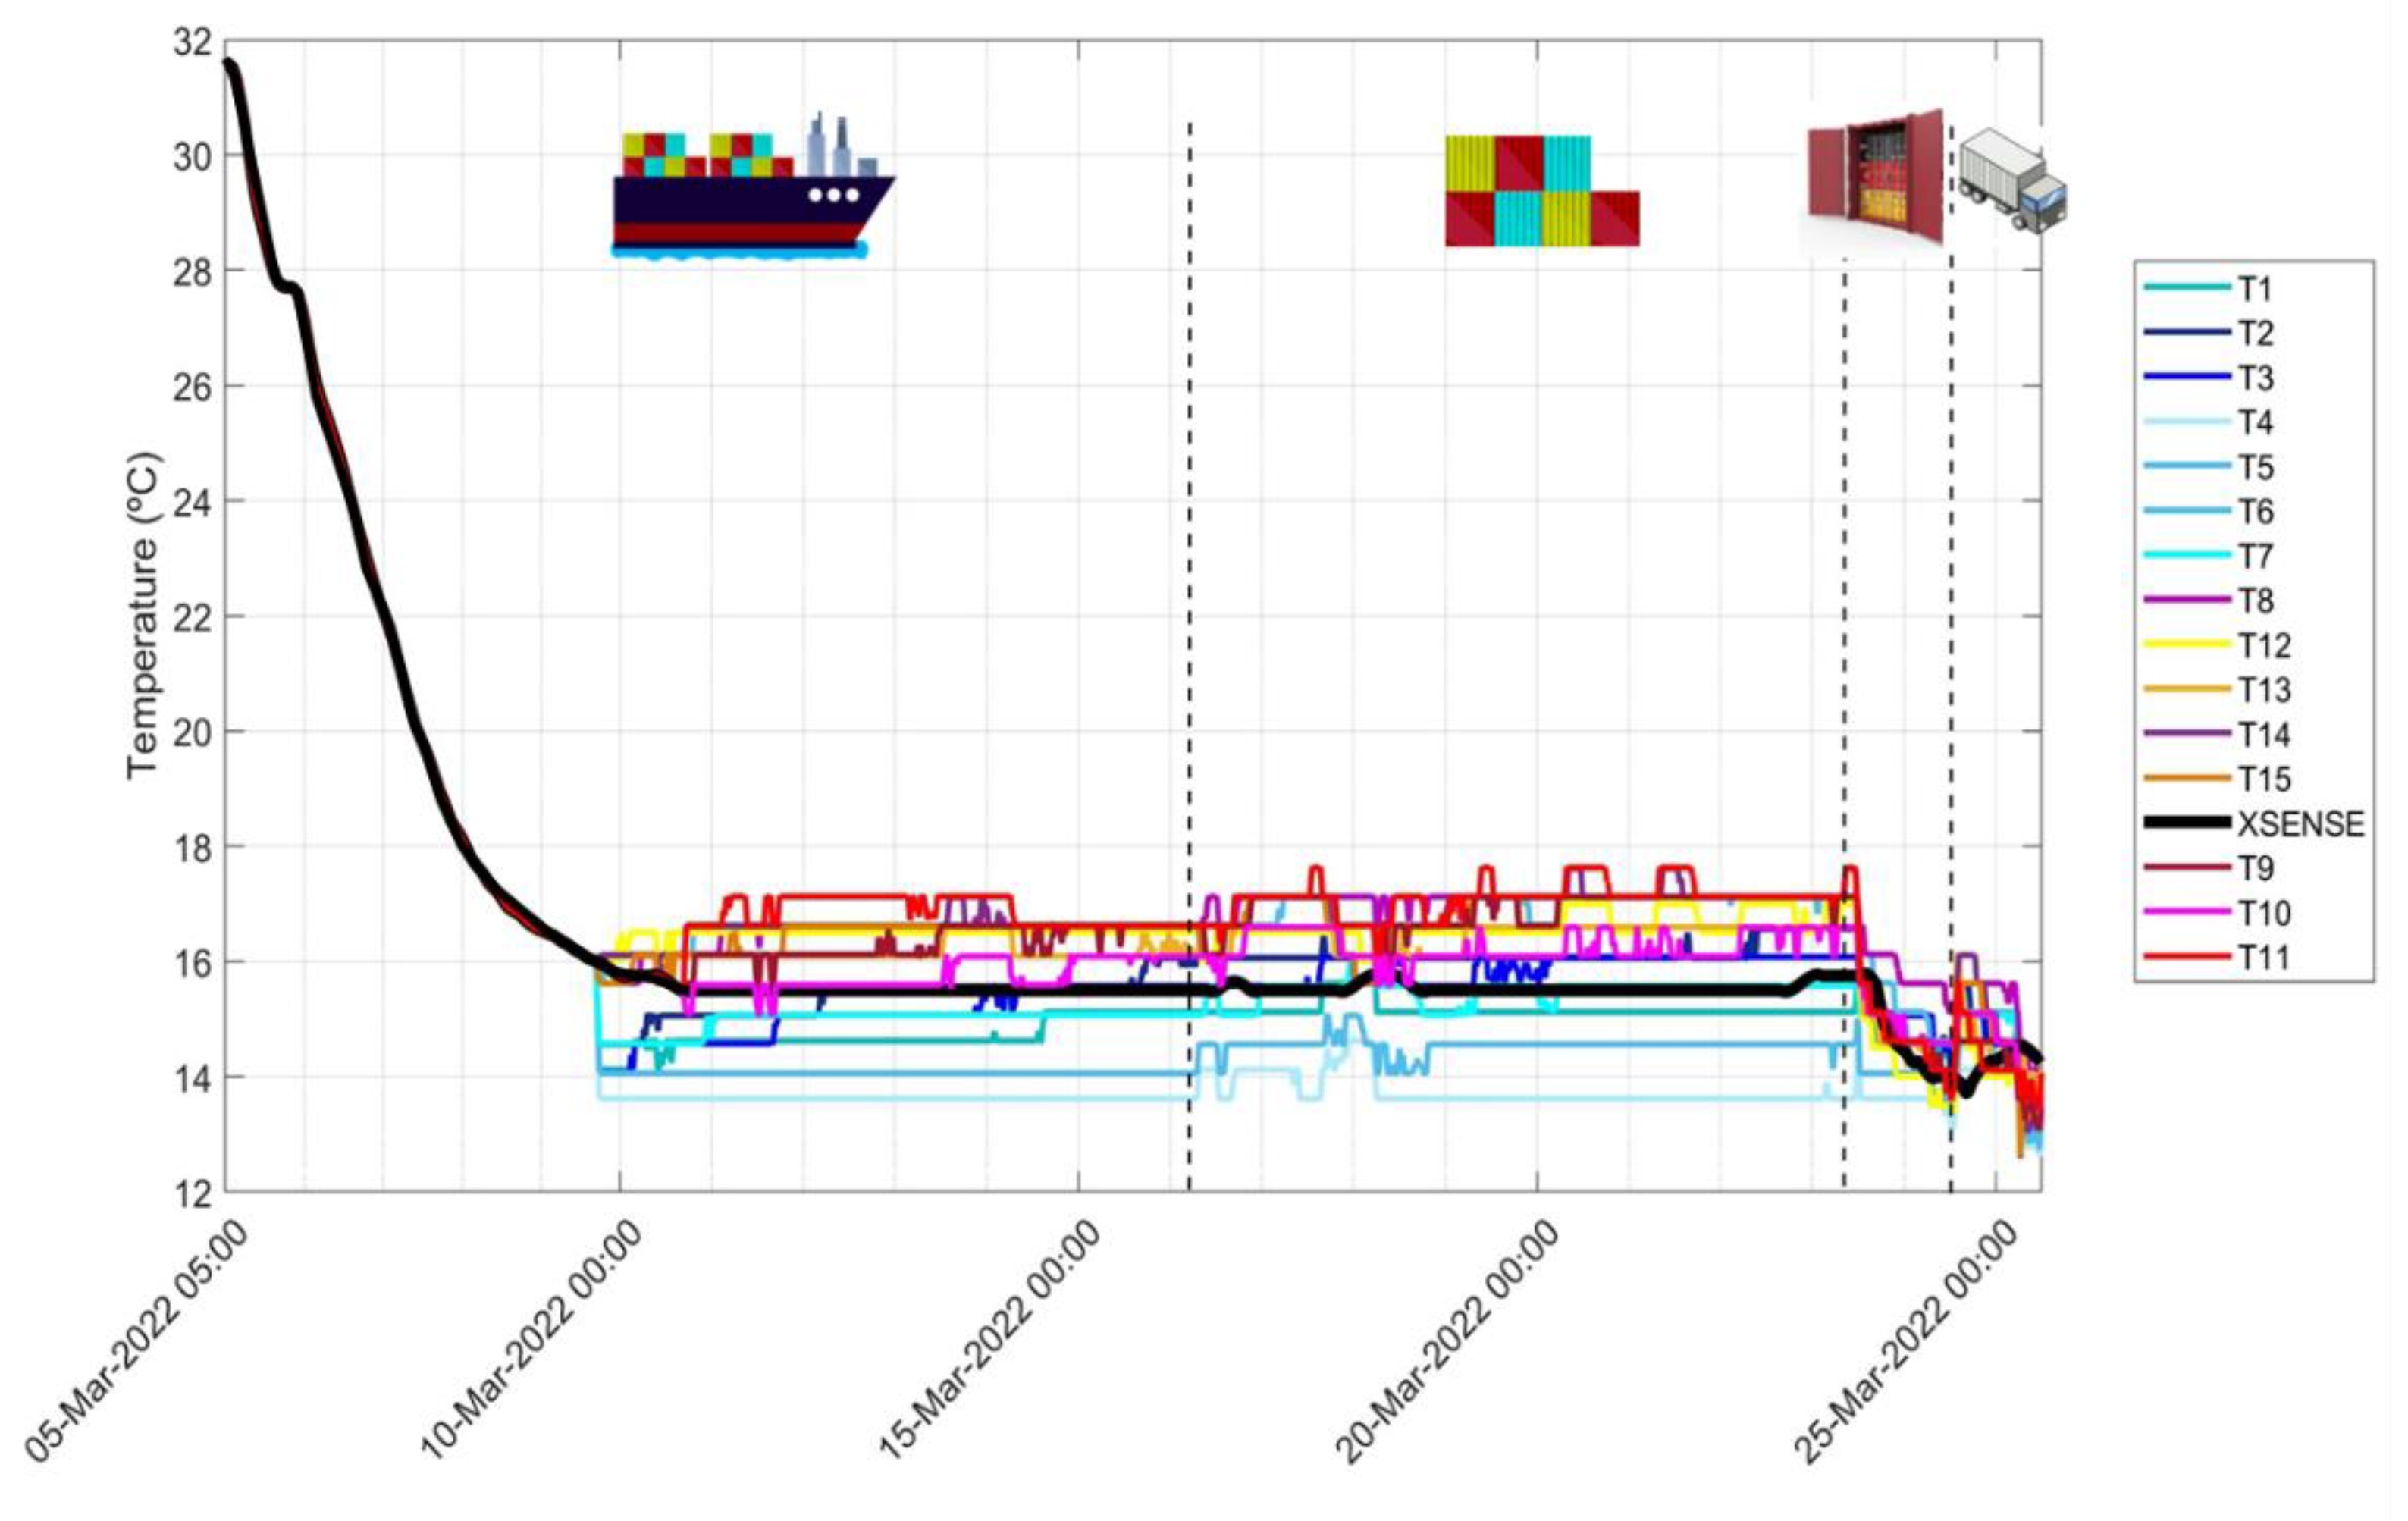
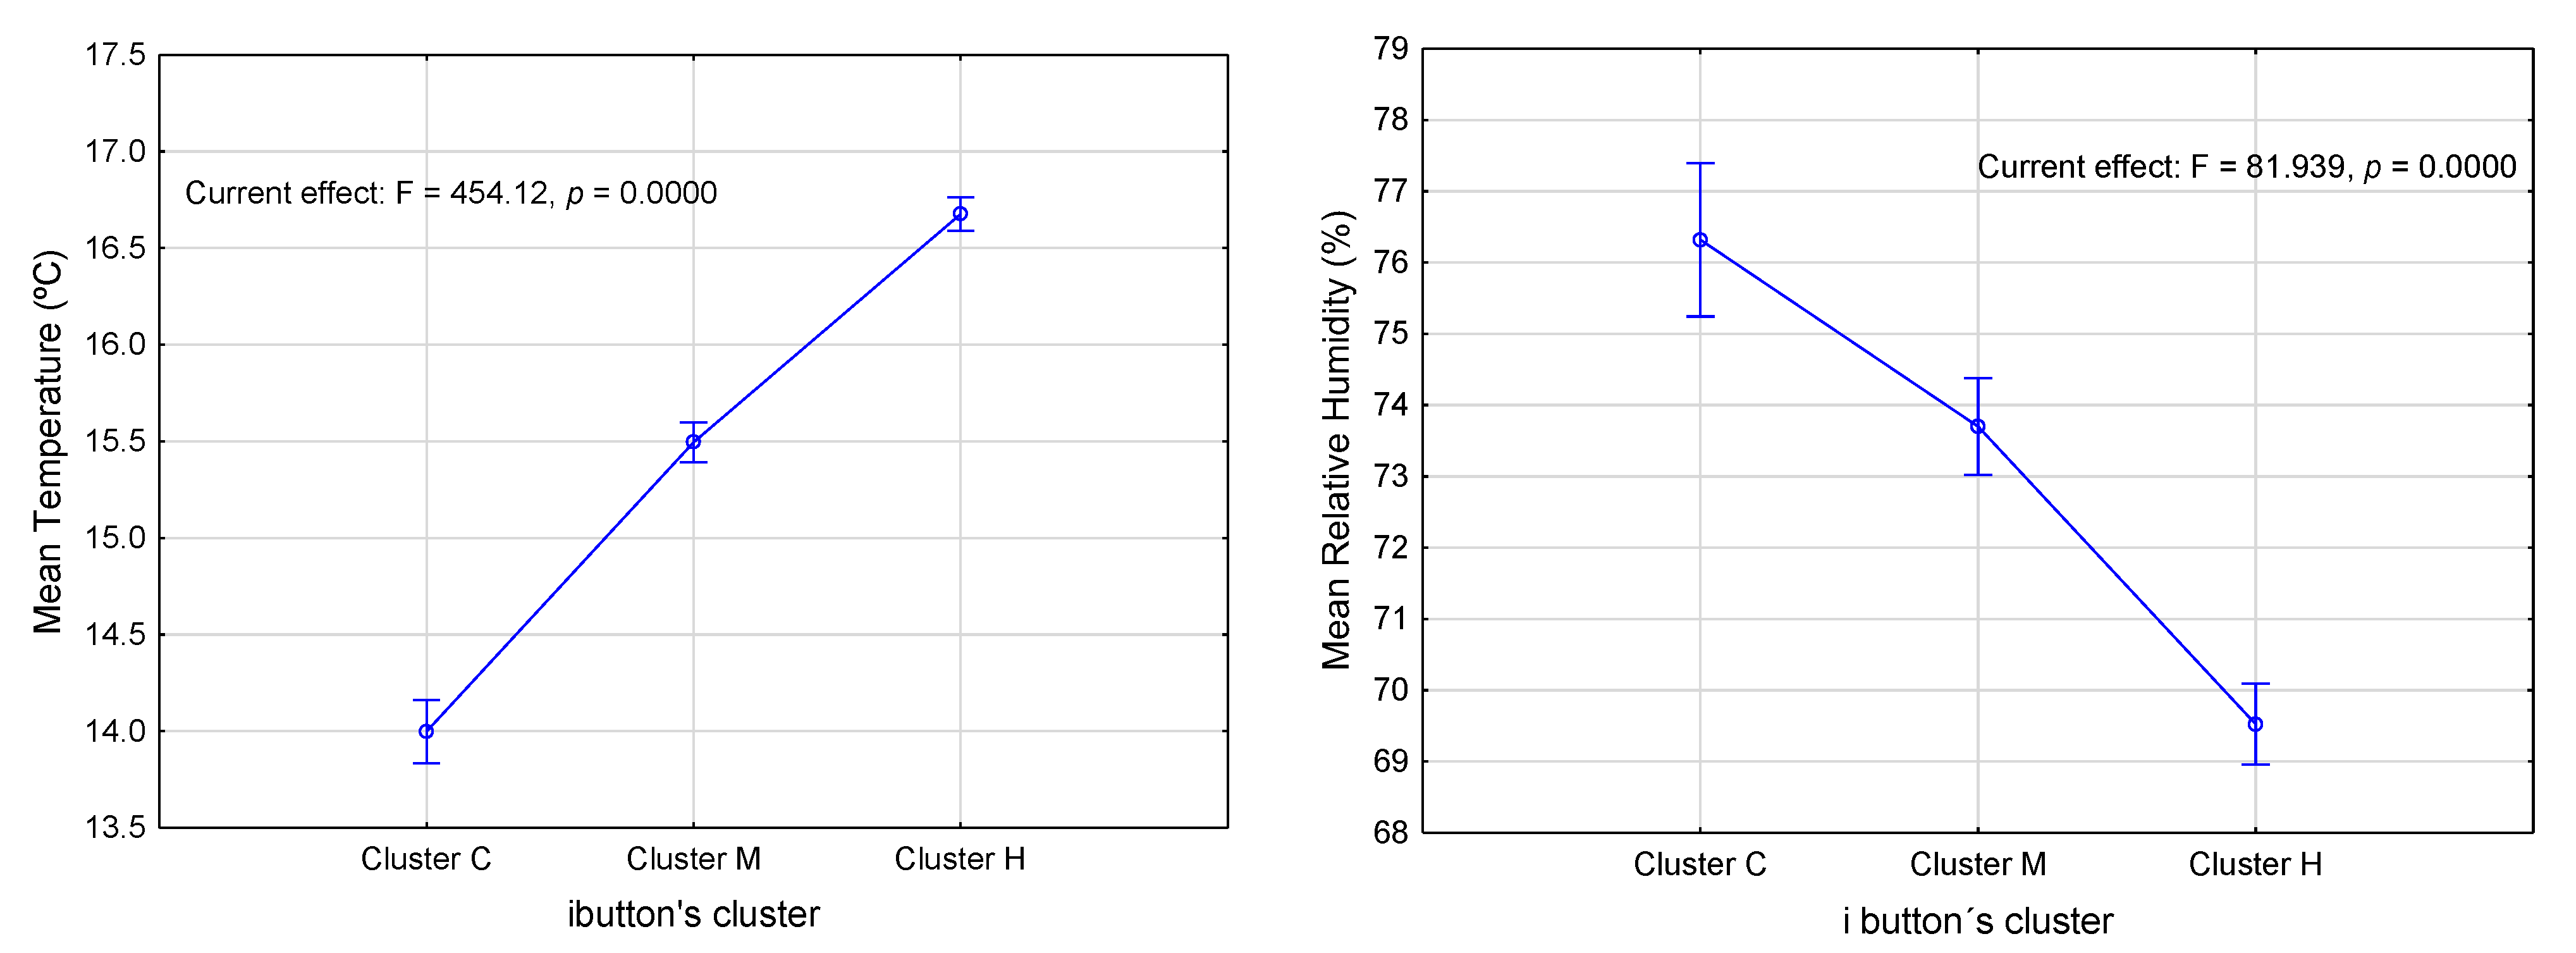
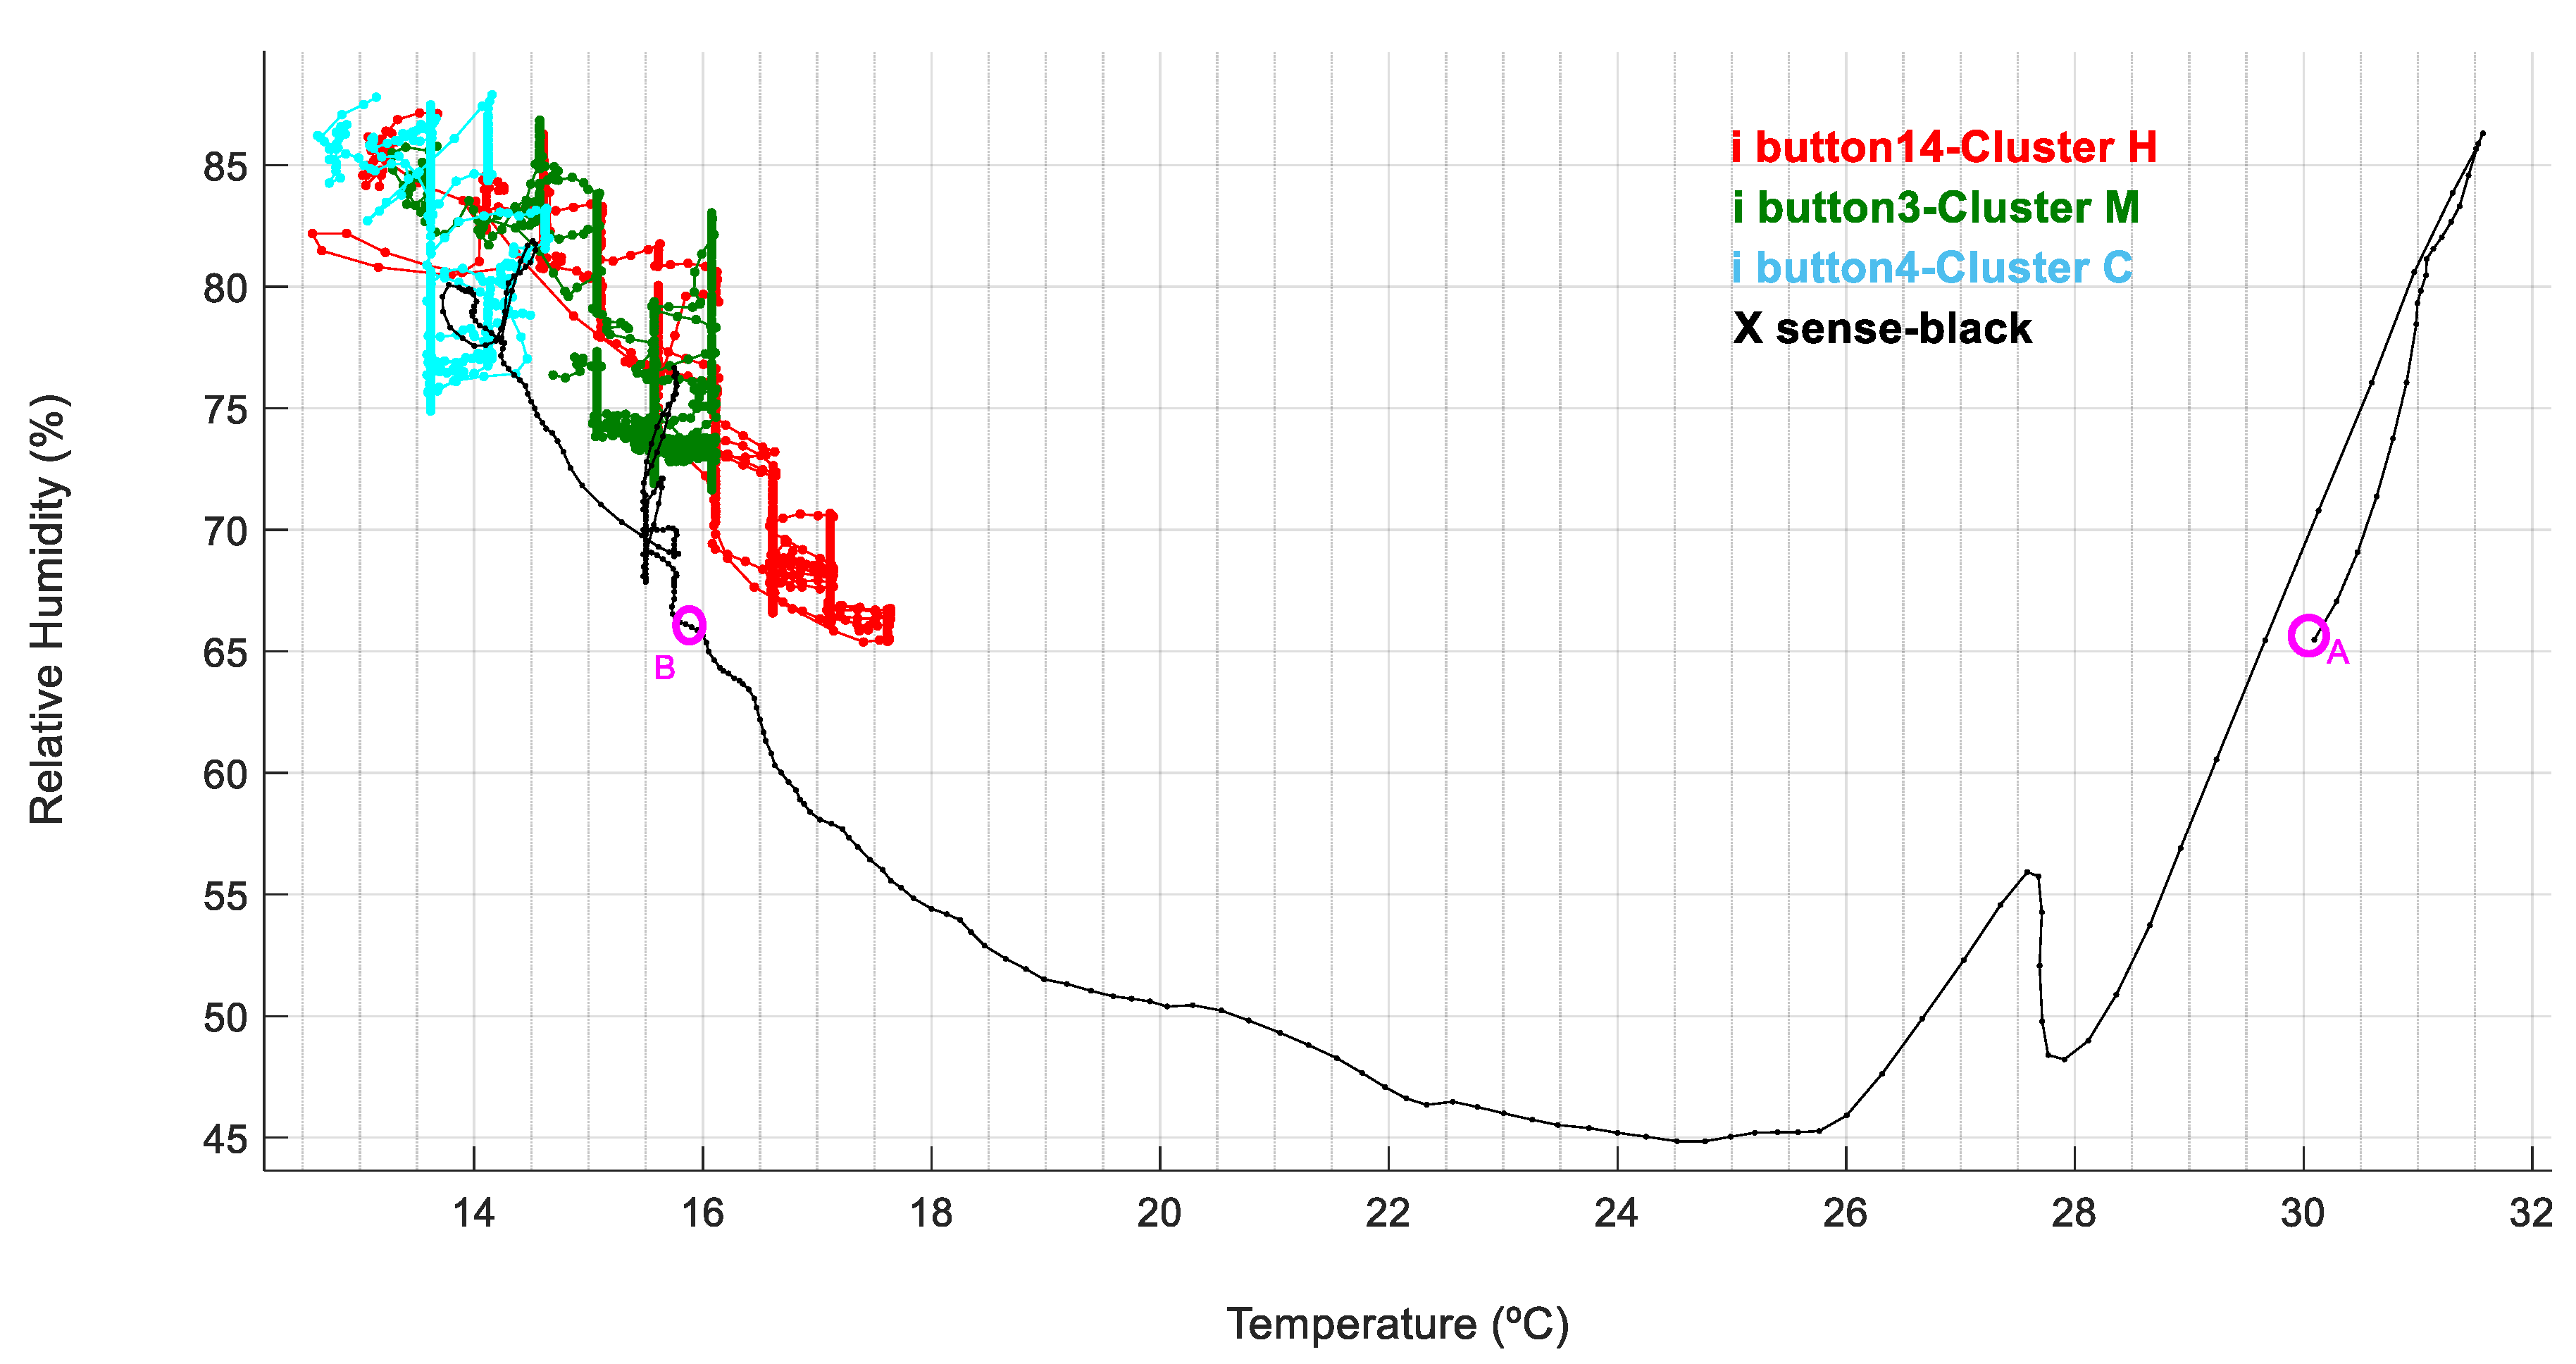
3.1. Reefer Environmental Conditions

The journey of the reefer can be divided into four stages (Table 1): Phase (1) 11 days by ship, in which the start-up or thermal stabilisation period required 36% of the trans-oceanic transport time (Figure 2). Phase (2) Waiting at the reefer terminal (RT) at the port of Vigo in Spain for seven days (34% of the total transport time). Phase (3) Container inspection operations, one day stay at the Border Inspection Posts (BIP). Phase (4) One day of road transport from Vigo to Castellón. Thus, the total journey time was 20.5 days.
It should be noted that the journey duration in this transport (20.5 days) included a waiting period at the port of Vigo (eight days), which accounted for 39% of the transport time. Although that delay was caused by a truck drivers’ strike (rising fuel prices due to the war in Ukraine), similar delays have been reported in previous works as other types of situations can happen during transoceanic transport (roll-over containers, transhipment, delay in inspections, pandemic situation such as COVID-19, etc.). For example, Jiménez-Ariza et al. [14] reported 12.5 days (39.7% of the journey) in different RTs in an intermodal transport of lemons from Uruguay to Spain. Such delays compromise the efficiency of the logistics chain, so the quantification of the standby duration in RT could be used by stakeholders as a key performance indicator (KPI) of transport efficiency.
In the monitored reefer, the set point temperature was 14 °C. The RT facilities were equipped to carry out border controls for fruit and vegetable products; therefore, in Phase 3 the container inspection was conducted under controlled environmental conditions (average ambient temperature of 7 °C). In Phase 4, 25 March in Spain, the weather was cold with a mean temperature of 9.2 °C. These low external temperatures in Phase 4 of the journeys explain the corresponding drop in temperature recorded by the loggers placed in the cargo (Figure 2).
Figure 2 shows the time series of temperatures recorded by the Xsense® logger (GCC) and the 15 ibuttons, whilst Table 3 shows the summary of the statistics for T and RH. Only the Xsense® recorded the T and RH variables throughout the entire journey. The mean T and RH recorded by the Xsense® were 17.03 ± 4.15 °C and 68.45 ± 8.17%, respectively; the coefficients of variation (CV) reached 24.40% for T and 11.94% for RH, indicating a high variability of environmental conditions at the GCC.
The extreme conditions within the container at the start-up were: maximum T of 31.5 °C, and minimum RH of 45%. Such conditions are indicative of the cargo (melons) not being precooled before shipping. Furthermore, considering the environmental conditions (the mean maximum T in Jandaíra for the month of March was 30.3 °C), it is likely that the container had not been precooled either.
The Xsense® T series shows that, within Phase 1, the start-up period had a lag of four days before reaching stable conditions in the transport, with a mean temperature 8.6 °C above the set point. Throughout the rest of Phase 1, and the whole of Phase 2 of the journey, or 14 days (68% of the total transport time), the storage conditions recorded by the Xsense® (GCC) were 15.54 ± 0.09 °C for T and 69.86 ± 1.61% for RH, with the CV dropping to 0.58% and 2.31% for T and RH, respectively, compared to the start-up period. Other authors reported similar results: Lang et al. [15] reported 4–6 days for the cooling down phase (from 28 °C to a set point of 14 °C) in two transports of reefers with bananas from Costa Rica. The duration of the start-up period, however, is strongly conditioned by the seasonal effect, as well as by the quality of the pre-cooling treatment. For example, Jiménez-Ariza et al. [14] in a maritime transport of lemons from Uruguay in autumn verified a shorter duration of the start-up period of approximately 2.5 days.
The ibuttons began to record the data once the steady-state had been reached inside the reefer, that is to say the ibuttons lack the records corresponding to the start-up in Phase 1 (Table 3). Thus, in the steady-state the mean T recorded by the ibutton-set was 15.92 ± 0.36 °C and the mean RH was 71.8 ± 1.98%. The mean CV for the ibutton-set was 2.23% for T and 2.77% for RH. Such CVs are higher than those recorded by the Xsense (GCC), which may be attributed to, on the one hand, the higher sampling frequency of the ibuttons, which enables the recording of short duration perturbations that go undetected by Xsense. On the other hand, they may be attributed to the distribution of the ibuttons along the various locations in the reefer.
At each time stamp (Table 3) along the steady-state the T and RH range was computed for the ibutton-set and then averaged: 3.30 ± 0.37 °C and 9.96 ± 1.75%, for T and RH, respectively. Accordingly, the mean CV reached 6.38 ± 0.56% for T and 4.69 ± 0.60% for RH. These mean CVs were 2.9 times higher than those for each individual ibutton temperature, and 1.7 times for RH.
The above results indicate that the location of the loggers had a very relevant effect on the environmental records. Three clusters of ibuttons are visually identified (Figure 3): Cluster C (cool) constituted by ibuttons 4 and 5, cluster M (medium) with ibuttons 1, 2, 3, 7, and 10, and cluster H (hot) with ibuttons 6, 8, 9, 11, 12, 13, 14, and 15. Figure 3 shows the result of the variance analysis indicating that the mean temperature increased significantly from cluster C to cluster H (F = 454.12), while the RH decreased significantly in the same direction (F = 81.94).
Figure 4 shows T and RH measurements registered during the journey for Xsense® logger (start up from dot A to dot B) and a representative ibutton of each cluster. Cluster C (blue sensor in Figure 4), located at the bottom of the pallet next to the cooling equipment, coincides with places near the cold air outlet of the evaporator; it was the only cluster that remained at mean temperature values close to the set point. Cluster M (green sensor in Figure 4), oriented towards the central plane of the container, registered a mean T of 1.5 °C above the set point. Cluster H (red sensor in Figure 4) oriented towards the right-hand side of the container from the centre to the door-end, on the air return path to the evaporator, registered a mean T 2.7 °C above the set point (the hottest values), and a mean RH below 70%.
The mean specific thermal energy of the air (Sum_h in kJ day kgas−1), integrated throughout the journey, for the ibuttons was 486.36 ± 19.53 kJ day kgas−1. The Sum_h for the start-up phase recorded by Xsense (not available for ibuttons) was 196.77 kJ day kgas−1, which was 40% of the total specific thermal energy required for 20% of the journey. In the locations corresponding to cluster H of the ibuttons, the mean Sum_h was 499 kJ day kgas−1; this energy decreased on average by 3.8% in cluster M and up to 10.9% in cluster C with regard to the Sum_h of cluster H.
A main insight that arises from these preliminary results is that in the steady-state phase, the location within the cargo (spatial variability) was more crucial than the travel duration (time variability), reaching a maximum range of 4 °C (mean range 3.30 ± 0.37). A spatial variability of up to 6 °C has also been verified in several transcontinental transport studies in the last decade [14,16], having in common the use of 40′ reefer containers (12 m long) which are the most common for intercontinental transport.
Regarding the effect of journey time, in the start-up period the temperature range was 15.75 °C, while during the steady-state the mean temperature range for 16 loggers was reduced to 1.68 °C. Similar local temperature deviations, in the range of 2 °C and 12 °C, had been previously found inside trucks and containers [16].
For the most part, postharvest management aims to control the average behaviour of lots and limit biological variability as much as possible [17]. However, the spatial variability of storage conditions in the three identified clusters, in terms of T, RH, and Sum_h is a source of variation that contributes to increased fruit biological variability and thus to lot heterogeneity.

3.2. Quality Parameters

As shown in Table 4, the main quality parameters were affected by transport from Jandaíra (Brazil) to Castellón (Spain). The F and p parameters of the analysis of variance for each variable were determined with respect to the ‘transport’ factor (departure and arrival).
Initial melon firmness was 94.20 ± 1.59 N, decreasing to 68.59 ± 12.75 N at the end of the transportation. After 20.5 days of transport, the softness was 28%, with a high level of significance (p < 0.0001). Sánchez-Bel et al. [5] found 53% of pulp firmness loss in Piel de Sapo melon during storage at 9 °C for 20 days. Loss of firmness is a natural process that occurs during the postharvest period as part of the fruit ripening process, associated with the disintegration of the cell wall by enzymes such as pectinesterase, polygalacturonase, and cellulose, among others, and the consequent softening of the pulp [18].
The SSC also decreased (3%) significantly (p < 0.05). Melon is one of the fruits with a minimum recommended sugar value of 8 °Brix [19]. Although the transport was not in optimal conditions, the SSC was not greatly affected by these conditions since the melons showed a mean of 10.80 ± 0.9 °Brix at the end of the transport.
Regarding individual sugars, sucrose represented 51% of the total sugar content, followed by fructose (26%), and glucose (23%). At the end of the transport period, an increase of glucose levels was found (13%) with a reduction in fructose (9.5%) and sucrose (8.44%). This increase in glucose at the end of the storage can be mostly explained by the hydrolysis of sucrose (invertase enzyme) into monosaccharides (glucose and fructose) and the subsequent utilisation of derived reducing sugar in fruit respiration, in this case, there is a preference of fructose over glucose [11]. The evolution of these individual sugars during storage is very important for melon sensorial quality since the perception of sweetness by the consumer is different depending on the type of sugar. Fructose is the most common sugar found in fruit, which offers the consumer a greater perception of sweetness; in our case, as mentioned before, the level of fructose only decreased by 10% and the total individual sugars by 4% (p < 0.05).
The main organic acids Identified were citric acid (3.65 ± 0.37 g/kg), succinic acid (2.79 ± 0.37 g/kg), and malic acid (1.17 ± 0.31 g/kg). The content of fumaric acid in the melons was very low (0.01 g/kg). All organic acids decreased between the moment of departure and arrival, except the malic acid content which showed no significant difference. At the end of the transport, the melons showed a strong and significant decrease in succinic acid (47%), followed by citric acid (18%), and fumaric acid (13%). Wu et al. [13] reported about 2.6 and 2.3 g kg−1 of citric and malic acid, respectively, in whole melon stored for 12 days at 15 °C. These values are in line with our data. As individual sugars, the organic acids are also substrates of primary metabolism.
Vitamin C is an essential nutrient that is part of enzyme metabolism and has antioxidant properties that protect the plant from oxidative stress. Being an easily degraded compound during processing and storage, it is often used as an indicator of food quality [20]. In our case, vitamin C content decreased significantly (p < 0.0001) from 106.48 ± 9.94 to 80.06 ± 14.10 mg/kg, a 25% reduction. In general, vitamin C from melon ranges from 75 to 443 mg kg−1 depending on the variety [21]; other factors that can affect its concentration are irrigation, plan nutrition, and maturity at harvest [22].
The initial overall quality of the melons was scored 7.53 ± 0.42 with a good quality of melon. However, at the end of the itinerary, this score dropped to 5.74 ± 0.94, affected mainly by the softening of the melon. Piel de Sapo melons show the greatest increase in firmness loss between the physiological maturity period and the full maturity stage [22]. At the end of the transport period all the melons presented the features of the full maturity stage, ready to eat.
Regarding the effect of fruit location in the reefer, most of the quality parameters did not indicate significant differences in the one-way ANOVA taking into account the factor “ibutton cluster”. The only significant difference according to the location within the cargo (spatial variability) was a small but significant effect (F = 17.88, p < 0.0001) found on SSC in melons.
In relation to the differences between clusters, according to the quality parameters in melon, only the SSC and sensorial quality showed significant differences. The SSC ranged with values of 9.57 ± 0.63, 10.60 ± 0.77, and 11.23 ± 0.71 °Brix for cluster C, cluster M, and cluster H, respectively. Total individual sugars content increased in the same way (with values of 38.48 ± 2.27 for cluster C, 40.37 ± 4.02 for cluster M, 41.59 ± 4.50 for cluster H), although the high inter-fruit variability renders this increase not significant. The results of the sensory analysis showed that the sensorial panel found significant differences depending on the location of the fruits, giving a slightly better score to the fruits of cluster H (6.0 ± 0.88) compared to the fruits of cluster C (5.66 ± 0.51) and cluster M (5.0 ± 0.85). The relative increase in SSC in cluster H could be explained by sugar concentration with a low RH (69.5 ± 0.5%) during the transport itinerary (Figure 3). This would also explain the best sensorial score obtained.

3.3. Remaining Shelf-Life

The average RSHL of the cargo at the end of the journey can be estimated using Equation 1, considering the start-up phase temperatures recorded by the Xsense, as well as the time series of temperatures for each of the ibuttons. After 20.5 days of travel, at an average temperature of 17.5 °C (8.5 °C above the optimum storage temperature for melon), the mean RSHL is set at 167.75 ± 34.91 h (7 days). As mentioned in Section 2.3, a SHLref of 45 days was selected in this work for Piel de Sapo. Therefore, during the journey, the RSHL of the melons dropped by 84%. A total of 38 days of shelf-life are lost, with fifteen days being lost in the four-day start-up phase alone, according to the model.
The average RSHL for cluster C was estimated at 235.12 ± 14.56 h (9.8 days), for cluster M it was estimated at 182.33 ± 14.40 h (7.6 days), and for cluster H it was estimated at 141.80 ± 8.38 h (5.9 days), i.e., only five days and 22 h of RSHL compared to nine days and 19 h for cluster C.
This confirms that all fruits do not arrive with the same RSHL, which leads either to a problem of duration in the availability in the market, or, in specific cases, to an advantage in the concept of offering ready-to-eat fruits in the supermarket [23]. In this experiment, sensory analysis corroborated that melons at all reefer locations arrived ready to eat, with small significant differences between clusters, which is normal since the temperature during the transport was above that recommended for this type of melon. The best sensory scores were obtained in melons from cluster H, which had the lowest RSHL.

4. Conclusions

In this study we have quantified a maximum temperature range in the steady-state phase of 4 °C, which is similar to that found in other transoceanic fruit transports. This temperature variation and even RH has also been related to SSC qualitative and sensorial parameters of the melons, as well as regarding their remaining shelf-life (days), with a large coherence between them. This demonstrates that melon was a suitable indicator fruit that could be considered for the transportation of other fruit transoceanic transport and hence this study’s findings can be applied beyond the specific variety and widened to other fruits.
The melon shelf-life model, when extrapolated to real records of a transoceanic transport of melons, has enabled the effect of the temperature variation on the remaining shelf-life to be quantified. In the cold spot of the container, the remaining shelf-life verified at the end of the journey, was nine days and 19 h, while in the hot spot, the remaining shelf-life was reduced to five days and 22 h. This leaves a shorter margin of time to distribute and market the product, which can lead to a loss of expected freshness and even food waste, which would increase the carbon footprint.
On the other hand, the power of the air during the start-up has been quantified as 2.7 times that required for the rest of the journey (80% of the time). This calculation is only possible thanks to the enthalpy of air derived from the psychrometric model, rarely considered in the storage or transport of perishable goods. Therefore, poor pre-cooling treatment compromises not only the quality of the cargo (and its shelf-life), but also the energy efficiency of the transport itself. In other words, the costs of pre-cooling are passed downstream from the upstream link in the supply chain to the transport company.
In this study, we can derive several parameters for transport efficiency characterisation: start-up duration (days), steady-state duration (days), stand-by duration in RT (hours), start-up associated power, steady-state associated power, and transport energy efficiency (%) of the transport as related to the quality of the pre-cooling treatment. Such KPIs will be used in future studies for the definition of transport standards.
The comprehensive analysis of the conditions: time, temperature, relative humidity, and enthalpy, will also enable—in the near future—to analyse the effect of aspects such as air renewal, door opening and closing events, or failures in the refrigeration equipment, and even the control cycles of the refrigeration equipment. All of these aspects, integrated with instrumental quality parameters, sensory quality attributes, and RSHL models, can constitute complex inputs and outputs to be considered for the supply chain virtualisation process, and contribute to the definition of digital twins.

Author Contributions

E.C.C. and E.A.: Conceptualisation, methodology, software, formal analysis, investigation, visualisation, resources, supervision, writing—original draft preparation, writing—review and editing, supervision, funding acquisition, and project administration. B.D. and P.B.: Methodology, visualisation, investigation, formal analysis, and writing—original draft preparation. N.C. and M.G.-I.: Methodology, data curation, and formal analysis. J.B.M.: Conceptualisation, resources, visualisation. All authors have read and agreed to the published version of the manuscript.

Funding

The present study has been financially supported by RTI2018-099139-B-C21 and RTI2018-099139-B-C22 projects from Ministry of Science and Innovation (Spain)—National Research Agency (MCIN/AEI/10.13039/501100011033) and by “ERDF A way of making Europe”, of the European Union.

Data Availability Statement

The datasets supporting the findings of this article are available upon reasonable request.

Acknowledgments

Encarna Aguayo acknowledges the support received during the shipment of the melons from JimboFresh International S.L.L and Xsense companies.

Conflicts of Interest

The authors declare no conflict of interest.

References

  1. FAOSTAT. Available online: https://www.fao.org/faostat/es/#data/TCL (accessed on 12 October 2022).
  2. Obando-Ulloa, J.M.; Moreno, E.; Garcia-Mas, J.; Nicolai, B.; Lammertyn, J.; Monforte, A.J.; Fernandez-Trujillo, J.P. Climacteric or non-climacteric behavior in melon fruit—1. Aroma volatiles. Postharvest Biol. Technol. 2008, 49, 27–37. [Google Scholar] [CrossRef]
  3. Giannakourou, M.; Taoukis, P. Holistic Approach to the Uncertainty in Shelf-life Prediction of Frozen Foods at Dynamic Cold Chain Conditions. Foods 2020, 9, 714. [Google Scholar] [CrossRef] [PubMed]
  4. Diezma, B.; Barreiro, P.; Baltazar, P.; Correa, E.C. A general procedure for predicting the remaining shelf-life of nectarines and peaches for virtualization of the value chain. Postharvest Biol. Technol. 2021, 181, 111677. [Google Scholar] [CrossRef]
  5. Sanchez-Bel, P.; Flores, F.B.; Gomez, J.; Romojaro, F.; Cabello, M.J.; Castellanos, M.T.; Ribas, F.; Martinez-Madrid, M.C. Changes in Quality and Oxidative Status of Two Cultivars of Piel de Sapo Melon Fruit during Cold Storage. In Proceedings of the 6th International Postharvest Symposium, Antalya, Turkey, 8–12 April 2009; pp. 807–813. [Google Scholar]
  6. Fernandez-Trujillo, J.P.; Obando, J.; Martinez, J.A.; Alarcon, A.L.; Eduardo, I.; Arus, P.; Monforte, A.J. Mapping fruit susceptibility to postharvest physiological disorders and decay using a collection of near-isogenic lines of melon. J. Am. Soc. Hortic. Sci. 2007, 132, 739–748. [Google Scholar] [CrossRef] [Green Version]
  7. Choi, J.-W.; Chang, M.-S.; Lee, J.H.; Hong, Y.; Kim, J.G. Changes in Quality of Oriental Melon ‘Smartkkul’ During Vessel Transportation. Hortic. Sci. Technol. 2018, 36, 560–568. [Google Scholar] [CrossRef] [Green Version]
  8. Silveira, A.C.; Aguayo, E.; Artés, F. The suitability of three Galia melon cultivars and different types of cuts for the fresh-cut industry. J. Sci. Food Agric. 2013, 93, 3826–3831. [Google Scholar] [CrossRef] [PubMed]
  9. Salas-Millán, J.Á.; Aznar, A.; Conesa, E.; Conesa-Bueno, A.; Aguayo, E. Fruit Wine Obtained from Melon by-Products: Physico-Chemical and Sensory Analysis, and Characterization of Key Aromas by GC-MS. Foods 2022, 11, 3619. [Google Scholar] [CrossRef] [PubMed]
  10. Castillejo, N.; Benito Martinez-Hernandez, G.; Goffi, V.; Gomez, P.A.; Aguayo, E.; Artes, F.; Artes-Hernandez, F. Natural vitamin B12 and fucose supplementation of green smoothies with edible algae and related quality changes during their shelf-life. J. Sci. Food Agric. 2018, 98, 2411–2421. [Google Scholar] [CrossRef] [PubMed] [Green Version]
  11. Aguayo, E.; Escalona, V.H.; Artes, F. Quality of minimally processed Cucumis melo var. saccharinus as improved by controlled atmosphere. Eur. J. Hortic. Sci. 2007, 72, 39–45. [Google Scholar]
  12. ASAE D271.2 APR1979 (R2005); Psychrometric Data. ASABE Standards: St. Joseph, MI, USA, 2006; pp. 20–27.
  13. Wu, Z.; Tu, M.; Yang, X.; Xu, J.; Yu, Z. Effect of cutting and storage temperature on sucrose and organic acids metabolism in postharvest melon fruit. Postharvest Biol. Technol. 2020, 161, 111081. [Google Scholar] [CrossRef]
  14. Jimenez-Ariza, T.; Correa, E.C.; Diezma, B.; Silveira, A.C.; Zocalo, P.; Arranz, F.J.; Moya-Gonzalez, A.; Garrido-Izard, M.; Barreiro, P.; Ruiz-Altisent, M. The Phase Space as a New Representation of the Dynamical Behaviour of Temperature and Enthalpy in a Reefer monitored with a Multidistributed Sensors Network. Food Bioprocess Technol. 2014, 7, 1793–1806. [Google Scholar] [CrossRef]
  15. Lang, W.; Jedermann, R.; Mrugala, D.; Jabbari, A.; Krieg-Brueckner, B.; Schill, K. The “Intelligent Container”—A Cognitive Sensor Network for Transport Management. IEEE Sens. J. 2011, 11, 688–698. [Google Scholar] [CrossRef] [Green Version]
  16. Tanner, D.J.; Amos, N.D. Temperature variability during shipment of fresh produce. In Proceedings of the Postharvest Unlimited International Conference, Leuven, Belgium, 11–14 June 2002; pp. 193–203. [Google Scholar]
  17. Hertog, M.L.A.T.M.; Lammertyn, J.; De Ketelaere, B.; Scheerlinck, N.; Nicolai, B.A. Managing quality variance in the postharvest food chain. Trends Food Sci. Technol. 2007, 18, 320–332. [Google Scholar] [CrossRef]
  18. Villanueva, M.J.; Tenorio, M.D.; Esteban, M.A.; Mendoza, M.C. Compositional changes during ripening of two cultivars of muskmelon fruits. Food Chem. 2004, 87, 179–185. [Google Scholar] [CrossRef]
  19. UNECE. Standard FFV-23 Concerning the Marketing and Commercial Quality Control of Melons. Available online: https://unece.org/fileadmin/DAM/trade/agr/standard/standard/fresh/FFV-Std/English/23_Melons.pdf (accessed on 5 October 2022).
  20. Miller, F.A.; Fundo, J.F.; Garcia, E.; Santos, J.R.; Miranda Silva, C.L.; Silva Brandao, T.R. Physicochemical and Bioactive Characterisation of Edible and Waste Parts of “Piel de Sapo” Melon. Horticulturae 2020, 6, 60. [Google Scholar] [CrossRef]
  21. Escribano, S.; Lazaro, A. Physicochemical and nutritional evaluation of Spanish melon landraces. Plant Genet. Resour. Charact. Util. 2017, 15, 177–186. [Google Scholar] [CrossRef]
  22. Kyriacou, M.C.; Leskovar, D.I.; Colla, G.; Rouphael, Y. Watermelon and melon fruit quality: The genotypic and agro-environmental factors implicated. Sci. Hortic. 2018, 234, 393–408. [Google Scholar] [CrossRef]
  23. Hertog, M.L.A.T.M.; Uysal, I.; McCarthy, U.; Verlinden, B.M.; Nicolai, B.M. Shelf-life modelling for first-expired-first-out warehouse management. Philos. Trans. R. Soc. A Math. Phys. Eng. Sci. 2014, 372, 20130306. [Google Scholar] [CrossRef] [PubMed]
Figure 1. Diagram of the refrigerated container (a) and distribution of the ibutton loggers (numbered circles) and Xsense® logger (in blue) (b) and pallets (c,d) inside the container.
Agronomy 13 00033 g001
Figure 2. Time series of temperatures recorded by the Xsense logger and the 15 ibuttons, inside the reefer, throughout the whole transport itinerary.
Agronomy 13 00033 g002
Figure 3. Less square mean graphs (vertical bars denote 0.95 confidence intervals) for clusters of ibuttons according to identified temperature and relative humidity inside the reefer during the whole transport itinerary (Jandaíra, Brazil to Castellón, Spain).
Agronomy 13 00033 g003
Figure 4. Records of temperature and relative humidity registered throughout the transport itinerary (Jandaíra, Brazil to Castellón, Spain) for a representative sensor of each cluster and for Xsense logger. Data between point A and point B correspond to start-up period.
Agronomy 13 00033 g004
Table 1. Complete itinerary (Jandaíra, Brazil to Castellón, Spain) of the melon reefer.
Multimodal TransportFromDateToDateDistance (km)Time (days)
Truck (Brazil)Jandaíra (Río Grande do Norte)5 March 2022Port of Natal5 March 20221250.5
Vessel (Brazil-Spain)Port of Natal5 March 2022Port of Vigo16 March 2022599511
Reefer Terminal (Spain)Port of Vigo 16 March 2022Port of Vigo23 March 202217
Port of Vigo23 March 2022Border Inspection Posts (BIP)24 March 202211
Truck (Spain)Vigo BIP reefer terminal24 March 2022Castellón25 March 202210221
TOTAL 714420.5
Table 2. Main characteristics of the loggers used in this experiment.
Sensor
Range ± Accuracy
On-Board Data MemoryInterfaceSize (mm)Test Characteristics
Sensors (Number)Data/
Sensor
Period (min/data)
Agronomy 13 00033 i001
Xsense®
−12 °C to +50 °C ± 0.5 °C
20 to 95% RH ± 5%
1000 per channelRFID at 433.05 MHz28 × 34 × 114151760
Agronomy 13 00033 i002
ibutton®
−20 °C to +85 °C ± 0.5 °C
0 to 100% RH ± 5%
4096 per channel1-wire RJ-45ϕ: 16.25
high: 5.9
1526119
Table 3. Summary of temperature and relative humidity statistics (M: mean, SD: standard deviation, CV: coefficient of variation) inside the reefer throughout the whole transport itinerary (Jandaíra, Brazil to Castellón, Spain).
Temperature (°C)Relative Humidity (%)
Mean SD CV Range Mean SD CV Range
XsenseWhole journey17.03 4.15 24.40 17.75-68.45 8.17 11.94 42
Start up22.61 5.69 25.17 15.75-59.31 11.66 19.66 42
Steady-state15.54 0.09 0.58 0.25-69.86 1.61 2.31 11
MSDMSDMSDMSDMSDMSDMSDMSD
Ibutton-set Start up-- - - -- - -
Agronomy 13 00033 i003Steady-state
(n = 15)
15.920.990.360.102.230.591.680.4371.83.251.980.392.770.6013.732.78
Agronomy 13 00033 i004Steady-state
(n = 2177)
15.920.291.020.0976.380.563.300.3771.81.783.370.424.690.609.961.75
Table 4. Main changes in quality parameters of melons during the transport itinerary (Jandaíra, Brazil to Castellón, Spain). F-values and p-values are the results of the one-way ANOVA for the factor “transport: arrival vs. departure”, red colour indicates significant differences.
VariablesDepartureArrivalRatio Arrival/Departure Fp
MeanSDMeanSD
Firmness (N)94.20 z11.5968.1212.750.72374.440.0000
SSC (°Brix)11.08 y0.9810.800.900.973.910.0495
Glucose (g kg−1)9.78 y0.8011.100.901.1361.290.0000
Fructose (g kg−1)11.02 y0.989.970.820.9030.450.0000
Sucrose (g kg−1)21.68 y1.9619.853.620.9212.440.0006
TOTAL sugars (g kg−1)42.48 y3.5340.634.220.965.860.0171
Citric acid (g kg−1)3.65 y0.372.980.440.8272.970.0000
Malic acid (g kg−1)1.17 y0.311.250.241.061.550.2153
Succinic acid (g kg−1)2.79 y0.371.490.260.53359.210.0000
Fumaric acid (g kg−1)0.01 y0.000.010.000.87138.930.0000
TOTAL acids (g kg−1)7.63 y0.885.720.880.75115.520.0000
Vitamin C (mg kg−1)106.48 y9.9480.0614.100.7593.000.0000
Overall Quality (1–9)7.53 x 0.425.740.941.3189.720.0000
z Mean (n = 12). y Mean (n = 4). x Mean (n = 8).
Disclaimer/Publisher’s Note: The statements, opinions and data contained in all publications are solely those of the individual author(s) and contributor(s) and not of MDPI and/or the editor(s). MDPI and/or the editor(s) disclaim responsibility for any injury to people or property resulting from any ideas, methods, instructions or products referred to in the content.

