Article

Early Identification of Plant Drought Stress Responses: Changes in Leaf Reflectance and Plant Growth Promoting Rhizobacteria Selection-The Case Study of Tomato Plants

1
Centre for Ecology, Evolution and Environmental Changes (cE3c) & Global Change and Sustainability Institute (CHANGE), Faculdade de Ciências da Universidade de Lisboa, Campo Grande, Bloco C-2, Piso 5, Sala 03, 1749-016 Lisboa, Portugal
2
BioISI—Biosystems and Integrative Sciences Institute, Faculdade de Ciências da Universidade de Lisboa, 1749-016 Lisboa, Portugal
*
Author to whom correspondence should be addressed.
Agronomy 2023, 13(1), 183; https://doi.org/10.3390/agronomy13010183
Submission received: 8 December 2022 / Revised: 30 December 2022 / Accepted: 3 January 2023 / Published: 6 January 2023
(This article belongs to the Topic Plant Metabolism under Stress)

Abstract

:
Drought is a worldwide problem, especially in arid and semi-arid regions. Detection of drought stress at the initial stages, before visible signs, to adequately manage irrigation and crop fertilization to avoid crop yield loss, is a desire of most farmers. Here, we evaluated the response of tomato plants to water scarcity, through changes in leaf reflectance due to modification in leaf pigments’ content, which translates into differences in spectral reflectance indices (SRI) values. Our methodology is innovative, as we were able to easily calculate and identify several SRIs for the early detection of drought stress “invisible” responses. We used a handheld spectro-radiometer to obtain SRI values from leaves of tomato plants growing under two different water regimes for 37 days. In an ensemble of 25 SRIs, we identified 12 that showed a consistent trend of significant differences between treatments along the experiment and within these, NDVI, SR, ZMI, Ctr2, GM1, and GM2 were already significantly different between treatments at day 7 after the start of the experiment and Ctr1 at day 9; although, no signs of damage were visible. Therefore, our results pinpoint these SRIs as promising proxies for the early detection of “invisible” responses to drought onset. We also analyzed the relationship between the monitored SRIs and plant morphological parameters measured during the experiment, highlighting a relationship between GM1 and plant height and leaf number. Finally, we observed a high abundance of putative beneficial bacteria among isolates collected from the tomato water-limited rhizo-environment at the terminus of the experiment, suggesting the active recruitment or selection of Plant Growth Promoting Rhizobacteria by tomato roots as a response to drought. Our work may be adapted into an easy protocol, of rapid execution, to be used in small-scale fields for early drought stress detection.

1. Introduction

Drought affects 64% of the global land area, and the percentage of unaffected areas is expected to decrease by more than half by 2050, presenting a great threat to crop yield [1,2]. Water deficit influences soil nutrient availability to plant roots, since under drought nutrient diffusion and the mass flow of water-soluble nutrients are decreased [3]. This results in deleterious effects on plant metabolism and growth, especially during the reproductive phase of crops [4]. Several morphological and physiological changes occur; morphological traits such as root length, leaf morphology and number, fruit number and size, and number of seeds may be affected by drought [5]. Under drought, plants increase the production of ethylene, a mediator in the regulation of plant metabolism under stress [6], and ethylene accumulation can negatively impact plant physiology and growth [3]. Moreover, photosynthesis is negatively affected, primarily due to stomatal closure and the concomitant limitation of internal CO2 availability [7], which can lead to the use of a smaller fraction of the incident radiation in the photosynthetic reactions. This unbalance between light absorption and formation of reducing power (associated with the reactions for CO2 fixation) may lead to the increased production of Reactive Oxygen Species (ROS) such as superoxide radicals, hydrogen peroxide, and hydroxyl radicals, which cause oxidative damage [8,9,10]. A high level of ROS causes lipid peroxidation, membrane deterioration, and degradation of proteins and nucleic acids, leading to cell death [10,11].
The early detection of plant drought stress is of the utmost importance, as it can help in reducing crop losses. A visual inspection, usually performed by farmers, can only detect drought stress at stages at which yield losses may no longer be prevented. Early plant drought stress detection would trigger timely farmer actions, including irrigation adjustments and the application of Plant Growth-Promoting Rhizobacteria (PGPR) [12]. PGPR exert beneficial effects on plant growth and development promoting the synthesis of phytohormones, atmospheric nitrogen fixation, and nutrient acquisition from soil minerals and organic complexes by mechanisms such as the solubilization of inorganic phosphate, the mineralization of organic phosphate, and the synthesis of siderophores for iron and other metal sequestration from soil [13,14]. PGPR enhance not only the efficiency of nutrient acquisition, but also the nutrient use efficiency (yield (biomass) per unit input (fertilizer, nutrient content)) [15]. PGPR properties are particularly important under drought stress, with evidence of increased water use efficiency [16,17] and plant performance amelioration [14].
PGPR can be recruited from the soil in a dynamic process involving plant host genetic control and associated immunity, abiotic factors such as climate and soil chemistry and inter-microbial interactions [18]. As a result of the plant’s physiological responses to drought, which include alterations in root morphology and root exudate profile, the rhizosphere microbial community will change [19]. Drought will change the structure of the rhizosphere towards the selection of assemblages better adapted to this stressor [20], so a drought-adapted rhizosphere can be a source for PGPR isolation [20,21]. In degraded soils with low biodiversity and therefore with low resilience, the recruitment of beneficial bacteria from the soil into the rhizosphere might be promoted by the addition of PGPR [22,23]. If plant drought stress is identified at an initial stage, before the appearance of macroscopic symptoms associated with irreversible plant damage, this may be a relevant amelioration action, and so the soil inoculation with adequate PGPR at the onset of drought [21] is of high importance.
Changes in the spectral signatures of the radiation reflected from plants at specific wavelengths in the visible (400–700 nm), near-infrared (700–1300 nm), and shortwave-infrared (1300–2500 nm) regions give information on the changes that occur in plant biochemical and biophysical parameters induced by stress (e.g., drought stress), such as plant pigment concentrations, photosynthetic efficiency, internal leaf structure, green biomass, vegetative vigor, and plant water status [24,25,26,27]. Such characteristics can be related to stress levels, and spectral reflectance data can be exploited through the calculation of simple normalized difference or ratio spectral reflectance indices (SRIs), for indirect estimation of physiological and agronomic parameters related to either healthy or stressed plants. Several published SRIs have been used to successfully estimate different plant parameters such as aboveground biomass and water content, leaf area index, and ion and pigment contents [26].
Tomato (Solanum lycopersicum L.) is a worldwide crop of economic importance that can be greatly affected by water deficit [28]. The identification of drought stress in tomato and other crops, before it can be detected visually, and using simple measurement procedures, would contribute to a major advance in drought prediction and mitigation. Herein, we used a portable, handheld spectro-radiometer to calculate and monitor SRIs from reflectance spectra of tomato leaves growing under two different watering treatments. We hypothesized that plant drought detection could be anticipated using a combination of SRIs, in which changes could eventually occur before evident physical stress symptoms. We were indeed able to identify SRIs showing significant consistent changes under mild stress conditions. Thus, these SRIs deserve further investigation as early proxies to be used for plant drought detection. We also analyzed the relationship between the monitored SRIs and plant morphological parameters. In addition, we characterized several isolates collected from tomato water-limited rhizo-environment at the terminus of the plant growth experiment, when the previously identified SRIs still showed the same trend of significant differences between treatments, to assess the potential of tomato root for PGPR recruitment as a response to the drought conditions applied.

2. Materials and Methods

2.1. Soil Properties and Determination of Field Capacity

Soil was collected from a seminatural pasture at Ribeira Branca, Portugal (39°29′23.75″ N, 8°34′26.93″ W). Soil physicochemical properties were determined, as a service, by “A2 análises químicas”; relevant properties are listed in Table 1. The soil field capacity was assessed by saturation of pre-weighted soil samples with water. The saturated samples were covered with aluminum foil to prevent evaporation and left to equilibrate for 3 days. The samples were then weighted, and dried at 105 °C until constant weight (after 72 h). The calculated moisture content in the substrate sample is said to be at field capacity.

2.2. Tomato Plant Growth

Tomato (Solanum lycopersicum L. bull’s heart) seeds, acquired from “Flora Lusitana, Lda.” were sowed in small plastic pots (100 mL). Each seedling from a homogeneous set of 40 seedlings with an average weight of 0.2 g was transplanted to a larger pot (500 mL). All seedlings were grown in a controlled-climatic chamber (16 h photoperiod, relative humidity 50%, temperature 25/20 °C for day/night) for 47 days and watered similarly and regularly with demineralized water and/or modified Hoagland solution [29] (doi.org/10.1080/17429145.2020.1766585), which was applied to improve plant nutrition and avoid macro- or micronutrient deficiencies. At this time, different water regimes started to be imposed on the plants, which were allowed to grow for 37 days, under two watering regimes (20 plant replicates for each regime): (A) 80% and (B) 40% field capacity. Watering was performed every two to three days with modified Hoagland solution and demineralized water or only the latter, after weighing each pot to determine the amount of water needed to have the soil moisture at defined field capacity percentages; when Hoagland solution was included, the volume of the solution was the same for both watering regimes and water was added until the soil weight reached a value corresponding to a moisture content at the intended field capacity percentage. Within the periods with no watering, the soil moisture was reduced: after 2 days following the first watering for the different regimes, it decreased to 21% and to 5% of field capacity for (A) and (B) treatments, respectively; for the remainder of the experiment, the soil moisture decreased to similar values for each treatment, to a median of 12% and 4% of field capacity for (A) and (B), respectively.

2.3. Measurement of Plant Parameters

A portable handheld spectro-radiometer (PolyPpen RP410, Photon Systems Instruments-PSI, Drásov, Czech Republic) was used to measure leaf spectral reflectance on 13 different days, spread along the experiment, always approximately at the same hour. PolyPen incorporated software (Drásov, Czech Republic) automatically calculates several SRIs based on the measured reflectance spectra.
Plant physical parameters were also recorded, i.e., number of leaves and height, both known to be affected by drought depending on the tomato cultivar [30]. Photos (Canon EOS 350D, Canon Inc., Tokyo, Japan) of the plants were taken during the experiment to document the visual effects of drought stress. Tomato shoots of 12 plants grown under each watering regime were collected at the end of the experiment, air-dried, and then placed in an oven at 60 °C until a constant weight was measured.

2.4. Isolation and Screening of Putative PGPR

Eight grams of rhizospheric soil (composite sample from 3 rhizospheric soil samples) from tomato grown under each of the two different watering regimes were collected, mixed with 40 mL of a 2.5% (v/v) solution of cold (4 °C) sterile DMSO (Sigma D2660) for 30 min and frozen at −70 °C. For microbial isolation, the soil was diluted in 50 mL of NaCl 0.85%, and the mixture was stirred at 37 °C for 1 h. Following serial dilutions, these were plated both on soil-extract agar [31] and on ½ Nutrient Broth (Biokar) (½ NB) (per L: 5 g tryptone, 2.5 g meat extract, 2.5 g sodium chloride, pH 7.2). After 72 h incubation at 37 °C, colonies obtained from the rhizosphere of plants watered to 40% field capacity, presenting distinct morphology than that of colonies obtained from the rhizosphere of plants watered to 80% field capacity, were chosen, and further purified by successive streaking.
The isolates were screened for several biochemical traits typical of PGPR. For the evaluation of indole-3-acetic acid (IAA) production, a phytohormone, isolates were grown overnight in ½ NB, at 37 °C, 110 rpm, with 5 mM L-tryptophan. After centrifugation to remove the cells, IAA was determined spectrophotometrically at 530 nm, following the addition of 1 mL of Salkowski reagent to 1 mL of supernatant, as described by Yim et al. [32]. IAA production was expressed as µg IAA mg−1 of dry biomass, which was determined for each collected pellet after supernatant removal. To identify phosphate solubilizing bacteria (PSB) among isolates, fresh colonies grown in ½ NB with 15 g L−1 of agar (½ NBA) were resuspended in 200 µL of sterile milli-Q water and a 10 µL drop of the suspension was immediately placed on NBRIP medium—described in [33]—but containing 3 g glucose per L. After 10 days at 37 °C, the plates were observed for the formation of a halo. The PS index was calculated as the (colony diameter + halo zone diameter)/colony diameter. To test the mineralization of organic phosphate, the Ca3(PO4)2 in NBRIP medium was replaced by 1.6 g L−1 of phytic acid sodium salt hydrate (Sigma P8810). To evaluate siderophore production by rhizosphere bacteria, 10 µL of cellular suspensions, prepared as above, were placed in CAS agar medium [34], where Fe-CAS dye complex gives the medium a characteristic blue color; orange halos develop around colonies of siderophore-producing bacteria as siderophores remove Fe from the Fe-CAS dye complex. The size of the halos was compared after incubation at 37 °C for 7 days.

2.5. M13 DNA Fingerprinting

Polymorphic patterns can be detected by PCR using the M13 oligonucleotide, a sequence from M13 bacteriophage (5′GAGGGTGGCGGTTCT3′), as primer and genomic DNA of microorganisms. In the case of bacteria, the strains variation revealed by amplification of this repeated sequence is useful for characterization and exposes the diversity of a group of strains [35,36].
DNA of strains was extracted by the method described by Pitcher et al. [37] and subjected to minisatellite-PCR fingerprinting with M13 [36] with the following amplification conditions: initial denaturation at 94 °C for 3 min; 35 cycles at 94 °C for 1 min; annealing at 35 °C for 2 min and extension at 72 °C for 2 min; and a final extension at 72 °C for 4 min. The reaction mixture was composed of 1X PCR Rxn buffer (Invitrogen, Paisley, UK), 3 mM MgCl2, 0.2 mM dNTPs, 2 µM M13 oligonucleotide and 0.04 U µL−1 of Taq DNA polymerase (Invitrogen). The PCR products (10 µL) were resolved by agarose (1% w/v) gel electrophoresis in 0.5X Tris-Borate-EDTA buffer (TBE: 50 mM Tris, 45 mM boric acid, 0.5 mM EDTA), at 90 V for 2 h. DNA profiles were visualized by UV light after staining with ethidium bromide (0.5 µg mL−1) and photographed with KODAK 1D software (Kodak, Rochester, NY, USA). The similarity between the profiles was analyzed by hierarchical numerical methods with Pearson correlation coefficient and the unweighted pair group method with arithmetic average (UPGMA) as the agglomerative clustering (BioNumerics® 6.6—Applied Maths, Kortrijk, Belgium).

2.6. Statistical Analysis

For each index and for each day of measurements, we calculated the differences between the index values obtained from measurements in pot replicates from the two different water regimes according to Equation (1).
I n d e x i , j = I n d e x   i , j k I n d e x   i , j k + 1
where i is the index (each of the 25 indices shown in Table 2), j is the day of the measurements and k is the number of replicates. For each index and within each day there were 400 differences calculated between replicates of different water regimes.
To evaluate if these differences were significantly different from zero, they were plotted in box and whisker graphics, and differences with 1st and 3rd quartiles above or below zero were considered significant.
The correlation between the different SRIs and the plant morphological parameters measured during the experiment was also assessed through the Spearman coefficient (ρ), using the IBM SPSS statistics software 27.0.1.0 (Amunk, New York, NY, USA). The statistical significance of the correlation was considered at the 0.05 level or at the 0.01 level.
The independent-sample t-test was used to compare tomato biomass means obtained for the different water regimes, using the software SPSS.

3. Results

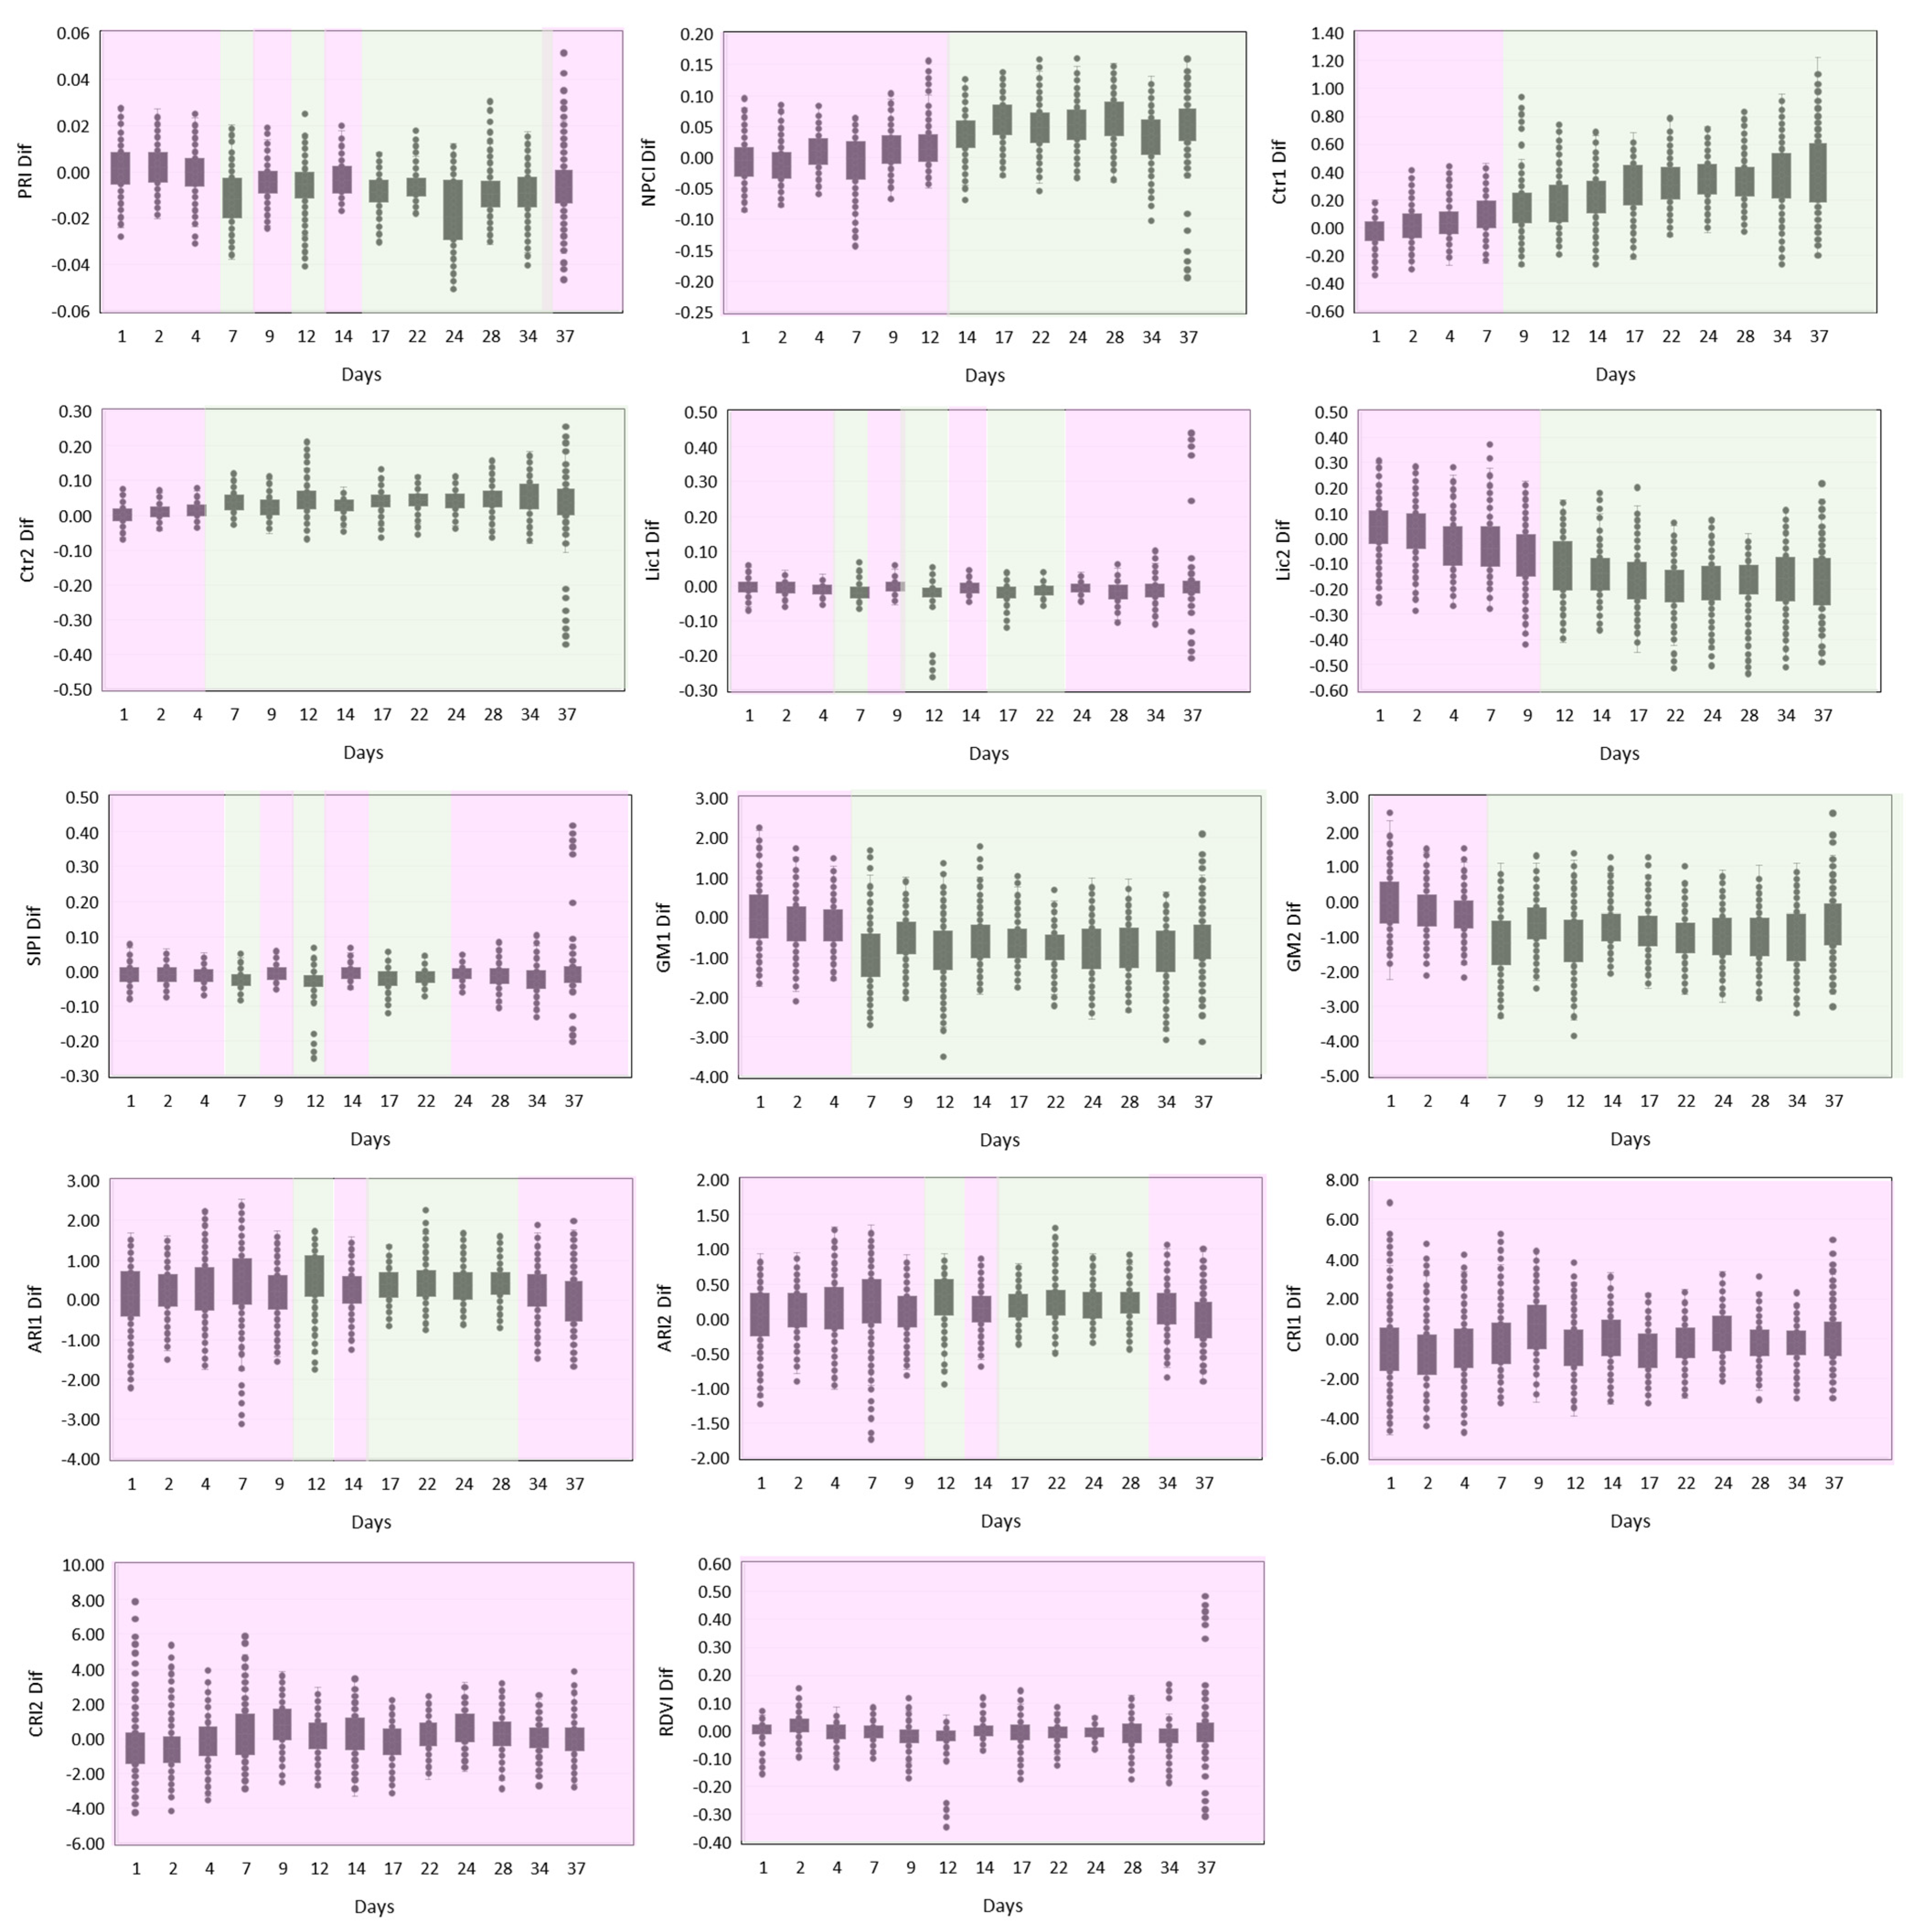
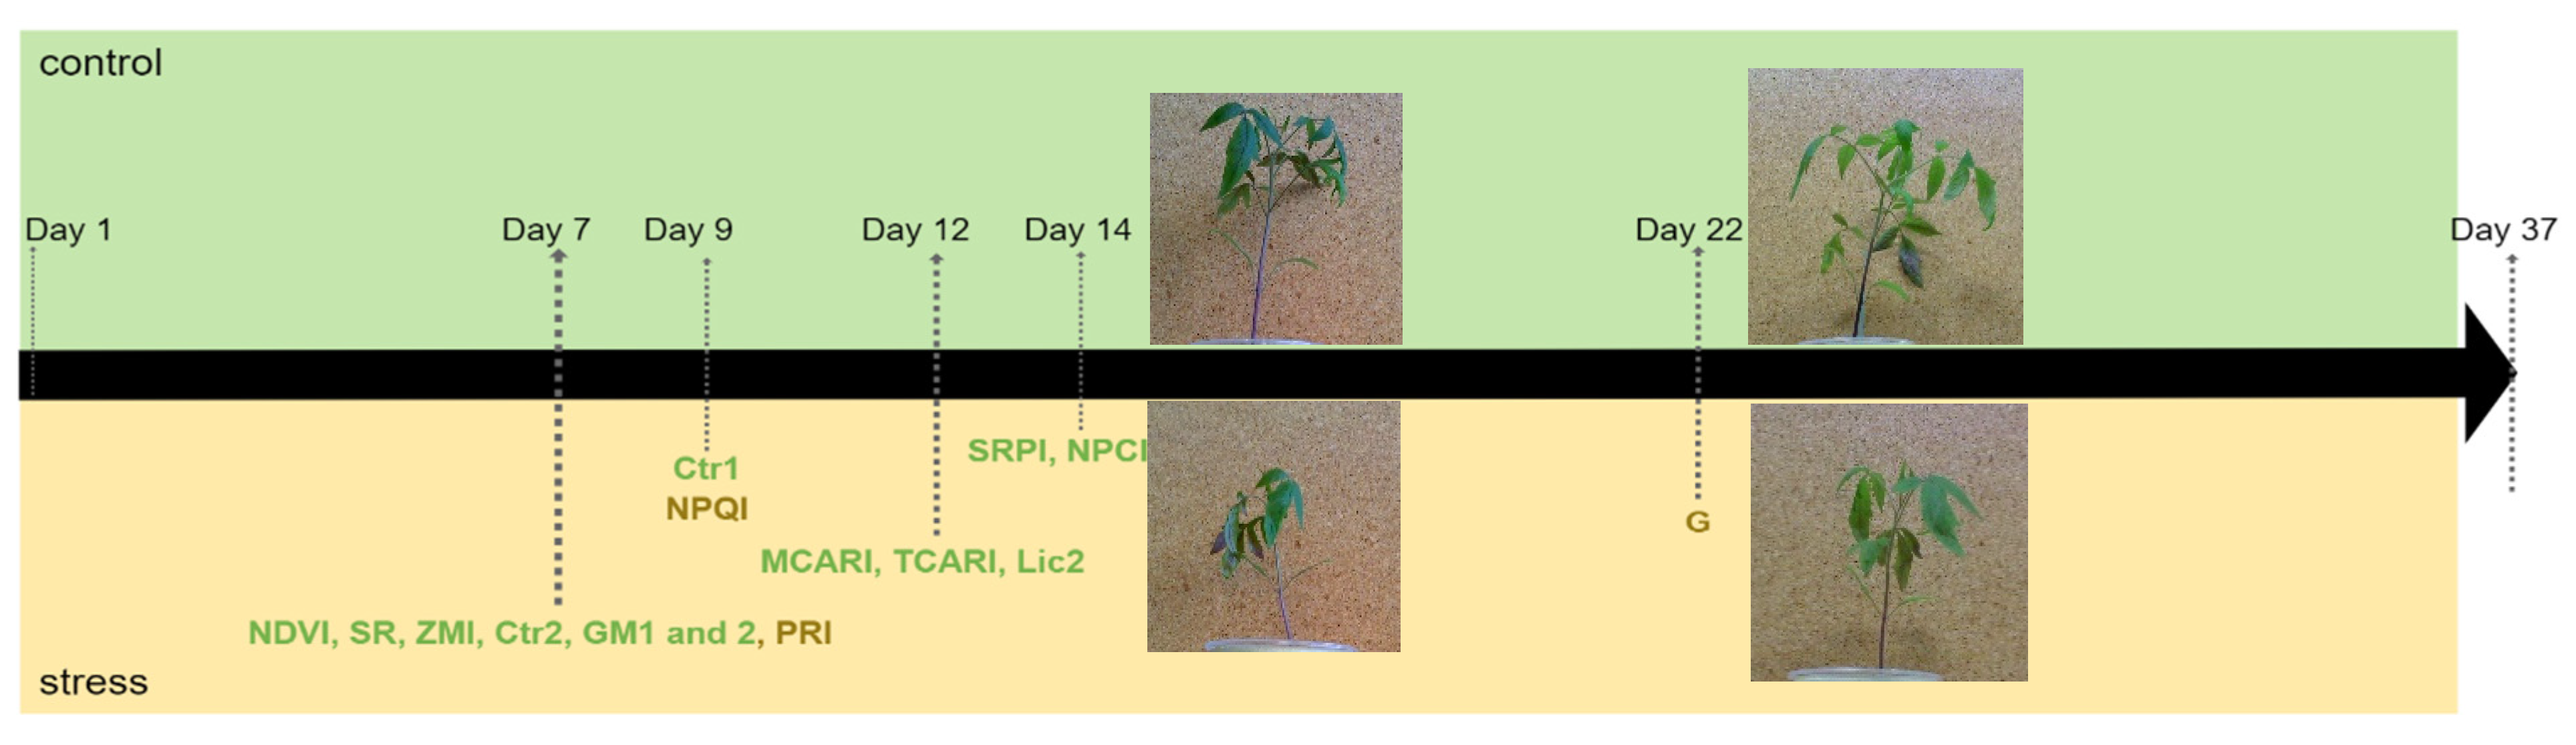
3.1. SRI Differences between the Watering Conditions

Box and whisker graphics plotting the differences between the SRI values from plants watered to 80% and 40% field water capacity showed that while some indices became significantly different between watering treatments during the experiment, others never showed any significant difference over time (Figure 1). NDVI, SR, ZMI, Ctr2, GM1, GM2, SRPI, NPCI, Lic2, and Ctr1 (see Table 2 for unabbreviated terms and definitions) showed an initial period where differences between treatments were not significantly different from zero. However, after a turning point, they all presented a consistent tendency for showing differences significantly different from zero until the end of the experiment. The timing of that turning point was variable, with NDVI, SR, ZMI, Ctr2, GM1, and GM2 being the earlier indices (at day 7) to show significance in the differences; the Ctr1 index showed a turning point at day 9, followed by Lic2, and finally SRPI, and NPCI at day 14. MCARI and TCARI were also included in this indices group, with a turning point at day 12, because the initial period before that point showed only one day (day 7) with significant differences.
Most of the other indices, i.e., MCARI1, OSAVI, TVI, Lic1, SIPI, ARI1, ARI2, CRI1, CRI2, and RDVI, did not show differences, or the days for which these differences showed significance were apparently randomly distributed in the experiment timeline (Figure 1).
Finally, some indices showed an intermediate behavior: G, NPQI, and PRI. In these cases, there was a period of days, at least the last 15 days of the experiment, where differences were significantly different from zero, but these were intercalated with a single-day period where the significance was not observable (Figure 1).

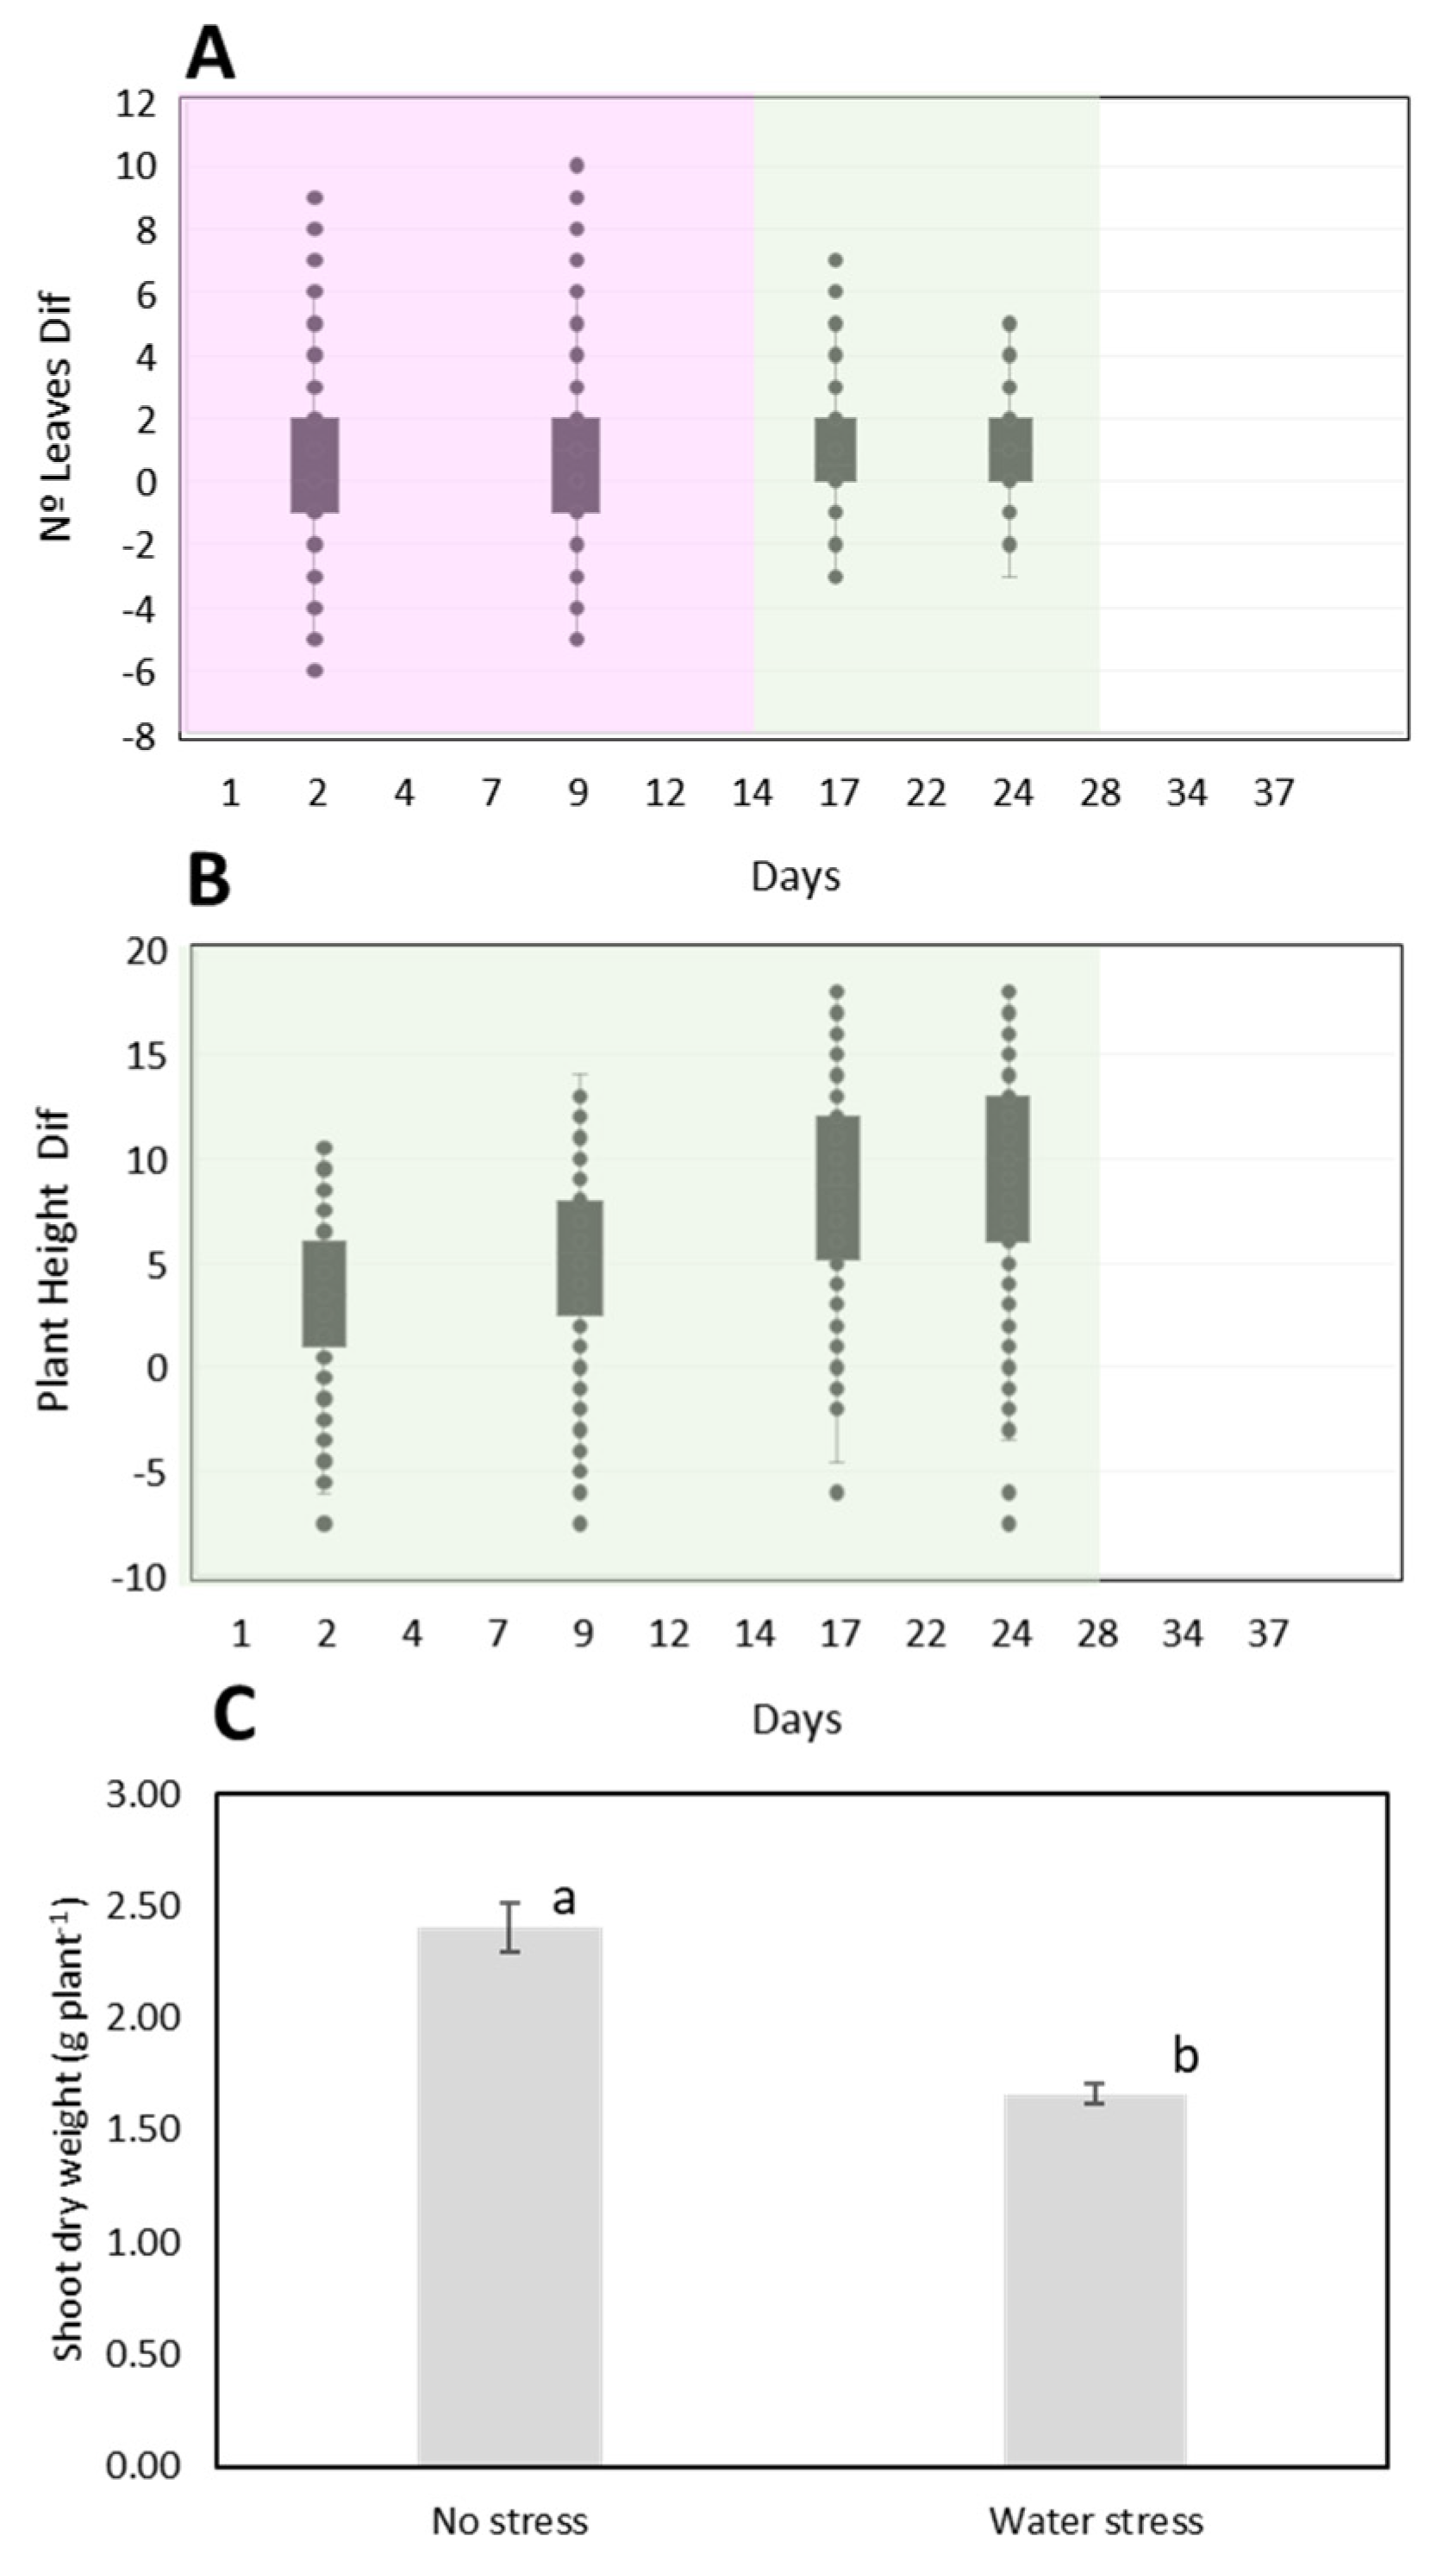
3.2. Plant Morphological Changes under Water Depletion

The two plant morphological parameters measured along the experiment also showed different behaviors when differences between measures from plants watered to 80% and 40% field capacity were plotted as in Section 3.1. The number of leaves in the plants from the different water regimes only became significantly different after day 9, by day 17 (Figure 2A), while the plant height was already significantly different between treatments after 2 days (Figure 2B). Limited water availability caused the plant to lower its height and the number of leaves, compromising plant growth. This resulted in the reduction in tomato shoot dry weight at the end of the experiment; watering to 80% of soil field capacity produced 1.4 times more shoot biomass than watering to 40% field water capacity (Figure 2C).

3.3. Link between SRIs and Plant Morphological Parameters

Although the Spearman correlation between SRIs and plant morphological parameters is in general rather low (ρ < 0.5), its statistical significance is high in many cases, probably due to the high number of measurements (Table 3). The highest statistically significant correlations were obtained for the number of leaves and the following indices: OSAVI, G, TVI, ZMI, SRPI, NPCI, Ctr1, Ctr2, Lic2, GM1, GM2, CRI1, CRI2, and RDVI. Almost all indices were shown to have a statistically significant correlation with plant height, except for MCARI1, TVI, CRI1, and CRI2.

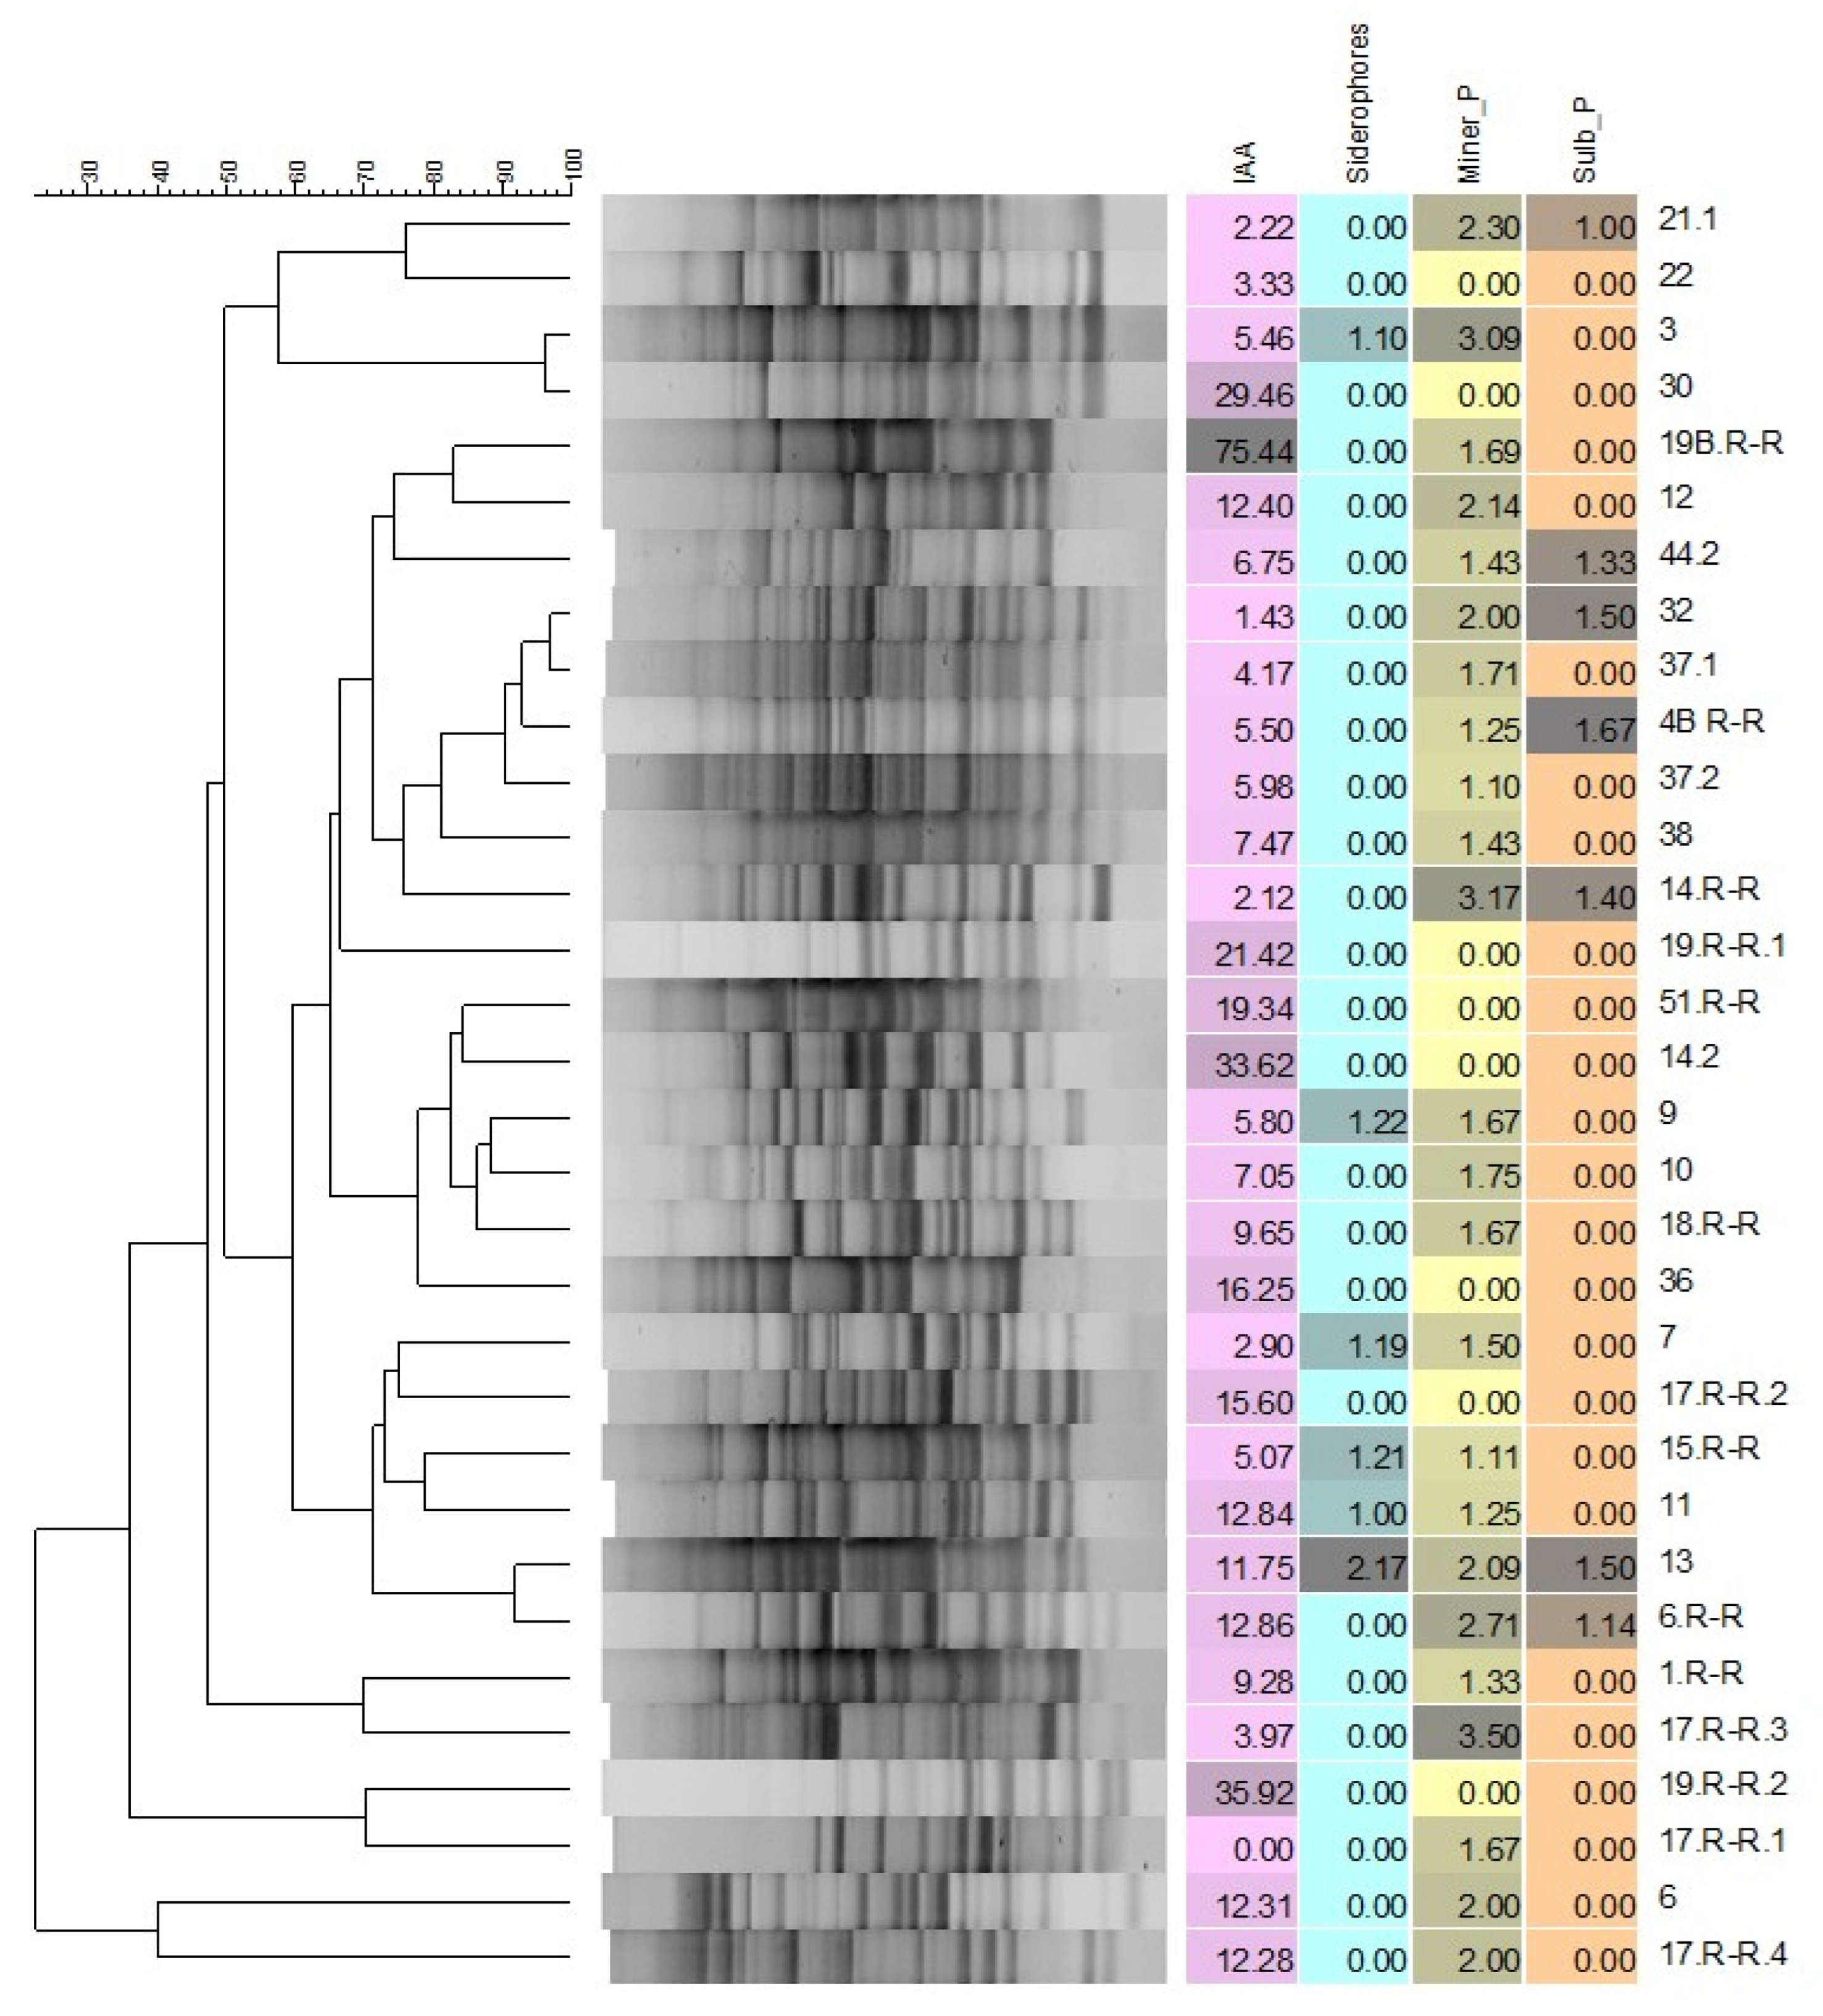
3.4. Characterization of Rhizobacterial Isolates

The M13 fingerprinting showed distinct patterns for the collected rhizospheric isolates, thus indicating different strains (Figure 3). All the 32 isolates collected had at least one of the tested biochemical properties, and 72% of them tested positive for two to three properties. Isolate 13 tested positive for all the PGPR traits.

4. Discussion

4.1. Increased Chlorophyll Content of Tomato under Water Depletion

Our results indicate that seven of the SRIs determined in this experiment were sensitive to drought and, as early as one week after the decrease in water availability, six of these SRI’s values significantly differed between plants from each treatment (Figure 4).
We can relate SRIs to chlorophyll content changes (Table 2). For instance, ZMI positively correlates with the concentration of chlorophyll a + b [45]; thus, the increased ZMI, resulting in lower differences already at day 7 (Figure 1), suggests that these plants had more chlorophyll; at first glance, an unexpected result for plants that achieved lower biomass, although with no severe wilting (see Section 4.3), thereby confirming an imposed moderate stress under the watering to 40% field capacity. However, chlorophyll content can be increased under stress; several studies have reported an increase in chlorophyll content under moisture stress, for example, in cereal grasses [63]. In black gram (Vigna mungo (L.) Hepper), chlorophyll content was increased or decreased under moisture stress depending on the cultivar [64]; this varied response was attributed to the variation in the activities of the enzymes involved in chlorophyll biosynthesis. Similar examples can be found in plants from the Solanaceous family. Exposure of tobacco plants to drought (40% water content in soil) for 12 and 18 days resulted in the elevation of the content of chlorophyll a, chlorophyll b, and total chlorophyll [65]. Statistically significant differences in the total chlorophyll were found between cultivars as well as during deficit progression: in tobacco cv. Bel B, the total chlorophyll content increased ca. 31% after 12 days of water stress treatment and continued to increase to 44% after 18 days. Drought also noticeably increased (over 35%) the chlorophyll content of fully grown tomato leaves of moderately (30% soil water content) drought-stressed plants [66]. Chlorophyll content was also increased in the leaves of lettuce cultivated under blue light stress, which showed increased ZMI [67] (see Section 4.2). Other indices besides ZMI, e.g., NDVI, Ctr1, and Ctr2 and GM1 and GM2, confirm a higher chlorophyll content in stressed tomato plants since day 7 of the experiment.
The higher content of chlorophyll in stressed tomato plants persisted until the end of the experiment. By day 12, MCARI and TCARI indices showed a significant difference between the two water regimes, noteworthy already observed on day 7, but intercalated by one measurement on day 9 (Figure 1). These indices are generally negatively correlated with the total concentration of leaf chlorophyll [45,47], resulting in the consistent trends in the differences observed from day 12 forward. Together with MCARI and TCARI, the Lic2 index also became significantly different between the different watering treatments on day 12. The Lic2 index, similar to other ratios that combine red, red edge, and NIR wavelengths, is sensitive to changes in chlorophyll fluorescence (ChlF), because the ChlF signal is superimposed on the red-edge of leaf reflectance [68]. The fluorescence ratio F440/F690 permits early stress detection in the photosynthetic apparatus [57], as it is based on the inverse relationship between photosynthetic performance and red and far-red chlorophyll fluorescence emission; under many stress conditions, e.g., drought, the proportion of light absorbed by the photosynthetic pigments used for photosynthetic quantum conversion decreases, with a concomitant increase in the proportion being de-excited via emission as heat or chlorophyll fluorescence. Maxima at 690 and 740 nm characterize the red to far-red chlorophyll fluorescence emission spectrum of intact dark-green leaves at room temperature and are ascribed to chlorophyll a in photosystem II (PSII) [68]. The relative height of the chlorophyll fluorescence emission bands F690 and F740 and their exact wavelength position depends upon the leaf’s chlorophyll content; with increasing chlorophyll content, F690 and F740 emissions are changed due to overlap between the emitted F690 fluorescence band and the in vivo absorption bands of chlorophyll a, causing a re-absorption (decrease) of the F690 band. On this basis, the Lic 2 index will increase with higher chlorophyll content; Lic 2 behavior represented in Figure 1 indicates a higher chlorophyll a content in tomato plants under drought, and no damage in PSII.

4.2. Physiological Adaptive Response Mechanisms under Water Depletion

Although we can suggest a plant chlorophyll content augmentation at the early stages of drought stress, we question what might be the plant mechanisms as the basis of the observed correlation between the stress onset and the increased chlorophyll content indicated by the abovementioned seven indices.
In a recent study on the influence of two variants of LED illumination, with increased intensity of red or blue light, on the physiology of lettuce, reflectance indices MCARI, TCARI, ZMI, Ctr1, and GM1 were found to be significantly affected by the different illuminations at all the investigated lettuce cultivation periods [67]. The index values for plants that had been cultivated under the blue illumination variant, as compared with the values for those under the red variant, e.g., decreased MCARI and increased ZMI, indicated, as in our work, an increase in the total concentration of chlorophylls a and b under stress. Indeed, blue light stimulates chloroplast development and the production of photosynthetic pigments, but inhibits growth and decreases productivity; conversely, red light stimulates plant growth and productivity [69,70]. Following the measure of the photosynthetic light reactions, the authors also reported that the increase in the chlorophyll concentration of lettuce leaves under the blue light illumination variant did not result in the increase in Linear Electron Flow (LEF) and the Cyclic Electron Flow around photosystem I (CEF), which are both dependent on light absorption by chlorophyll, but LEF decreased, whereas CEF increased. This was the result of a decrease in the fraction of the absorbed light distributed to PSII, which Yudina et al. [67] postulated to be caused by an increase in the size of the light-harvesting complex of photosystem I (PSI), which would stimulate the flow of the light energy to PSI. Since PSI can absorb light at 710–720 nm wavelengths, but PSII cannot absorb light in this range, the ZMI index (R750/R710) can be representative of changes in the core and light-harvesting complex of PSI. The observed significant increase in this index, which was found to be negatively correlated with the LEF [67], is thus compatible with a decrease in the reflectance at 710 nm due to the potential increase in the size of the PSI core and light-harvesting complex. In the work herein, we also registered a significant increase in the ZMI of stressed tomato plants, which might translate into a redistribution of the light energy between PSI and PSII, likely to modify the rates of LEF and CEF.
The activation of CEF, but the decrease in LEF and in growth and productivity (see Section 4.3) are described as part of plant adaptive responses to stressors [71,72]. CEF increase supports the transthylakoid pH difference and the synthesis of ATP, contributing to the dissipation of excess energy and to the repair of photodamaged PSII [73,74]. It also oxidizes the acceptor side of PSI, and controls ROS generation, hence protecting the photosynthetic machinery [73]. As an example, CEF activation and LEF inhibition played a major role in protecting PSI and PSII from mild drought stress in the resurrection plant Paraboea rufescens, namely by preventing the over-reduction in PSI that leads to the generation of hydroxyl radicals, and so its photo-inhibition [75]. Drought stress was also found to upregulate the expression of genes encoding CEF components [76,77].
Another plant stress response mechanism is linked to the operation of the xanthophyll cycle, when the pigment violaxanthin, in PSII antenna, is converted to antheraxanthin and zeaxanthin via de-epoxidase reactions, resulting in the non-destructively dissipation of excess energy in the pigments associated with PSII [78]. This change in pigment composition has little effect at 570 nm, but leads to a decrease in reflectance at 531 nm, and, thus, the use of these wavebands in the formulated index PRI (Table 2) by Peñuelas et al. [52], who found PRI to be related to the fraction of absorbed quanta used for photosynthetic electron transport and to photosynthetic radiation-use efficiency. Increasing intensities of photosynthetically active radiation (PAR) resulted in an excess of light and a PRI reduction in both control and water-stressed leaves of quinoa plants; however, under a given PAR, PRI was enhanced in water-stressed leaves [79]; the authors associated this increase to a higher concentration of chlorophyll in stressed plants, with a diminished need for protective pigmentation, “at least in short term”. In our study, we also registered a tendential increase in PRI since day 7, compatible with the increase in chlorophyll content indicated by the above-mentioned indices.
Although CEF leads to ATP synthesis, but not to NADPH production, an anaplerotic carbon flux, occurring through the oxidative branch of the pentose phosphate pathway into the Calvin–Benson cycle, which forms NADPH and liberates CO2 further refixed by Rubisco, was recently evidenced for C3 plants [80]. The flux was increased with decreasing intercellular CO2 concentrations; such upregulation was proposed to be a leaf-level response to stress triggered by environmental conditions that cause “source limitations”, e.g., low CO2 and drought. Albeit having a negative ATP, NADPH, and carbon balance, it was suggested that this anaplerotic flux helps to maintain high levels of ribulose 1,5-bisphosphate under stress to ease photorespiratory nitrogen assimilation, required for the biosynthesis of N-compounds used for maintenance and repair [80]. It is possible that this flux was not negligible in tomato leaves under the water stress here applied since our results suggest a CEF increase, known to occur under photorespiratory conditions (lowered CO2), with both processes acting cooperatively to suppress the over-reduction in PSI under stress [81]. Overall, drought stress will result in different metabolic fluxes and metabolite output. It would be very interesting, and of importance for the comprehension of the rhizosphere interactions, to relate the drought “metabolite output” resulting from the increased photorespiratory nitrogen assimilation with plant root exudate composition, which is the primary means of PGPR recruitment. We used the colony’s morphological traits to isolate bacteria only found in the rhizosphere of tomato plants under drought; these isolates were found to be distinct strains by M13 DNA fingerprinting analysis; however, all of them showed at least one of several PGPR biochemical traits (Figure 3) known to be important for plant drought stress mitigation [82]. These results suggest the active recruitment or selection of PGPR by tomato plants, when these are responding to moderate drought, so that those PGPR may help the plant cope with drought.

4.3. The Link between SRIs and the Plant Morphology

In accordance with the plant adaptive answer to drought, we observed a decrease in the number of leaves from tomato watered to 40% field capacity by day 17 and a significant final reduction in the aboveground plant biomass (Figure 2). Importantly, plant height was also diminished in stressed tomato since the first measurement; although, this reduction was only notorious by day 17. On the other hand, a non-perceptible initial bias in the division of samples for each watering treatment, which may have contributed to the registered differences, cannot be discarded. It is, nonetheless, the early identification of water stress, before the plant shows any visual symptoms of drought damage such as wilting (with leaf folding and rolling), and dropping of leaves, which is of much value for an early intervention to reverse drought stress. Severe wilting was not observed, only slight leaf folding was observed after day 9 and accentuated from day 22 on; hence, the identified indices until day 9 are promising proxies for the detection of hydric stress (Figure 4).
The ZMI was one of the reflectance indices proposed herein as proxies for the detection of hydric stress that showed a significant correlation with the number of leaves in tomato (Table 3). This index is closely related to properties of the core and light-harvesting antenna of PSI [67]; since tomato leaves responded to drought stress with a putative increase in chlorophyll content and non-destructively dissipation of excess energy, an increase translated into the augmentation of the ZMI index, then a decrease in the number of leaves could be opposite to this stress response behavior; hence, the correlation is easily understood. On the other hand, a plant height increase, generally associated with higher aboveground biomass, would be contradictory to the leaves’ stress response, explaining the negative correlation between ZMI and plant height. GM1 and GM2 indices, which also exhibited consistent significant differences since day 7 of the experiment, showed a significant positive correlation with the number of leaves, in concurrence with the estimated increase in chlorophyll content in stressed plants, and a significant negative correlation with plant height, which might be explained as above.
Considering both the timeline in the identification of significant reflectance indices (Figure 4) and their correlation with plant morphological traits, which was highest between GM1 and tomato leaves number, and of the strong significance between GM1 and plant height (Table 3), the careful following of these traits and of GM1 would be valuable for the early identification of water stress in tomato.

5. Conclusions

We identified several SRIs that showed significant differences between two watering regimes—80% and 40% of field water capacity—applied on tomato plants. The later regime resulted in moderate drought stress; a set of indices—NDVI, SR, ZMI, Ctr2, GM1, and GM2—were already significantly different between treatments at day 7 after the start of the experiment, and Ctr1 at day 9; although, no signs of plant damage, i.e., wilting, were visible. The correlation analysis between these different SRIs and the plant morphological parameters measured during the experiment highlighted a relationship between the GM1 index and plant height and leaf number. The values of the calculated SRIs suggest that plants responded to the onset of stress with an increase in chlorophyll content and the activation of CEF, as part of a mechanism to increase plant tolerance to the imposed stress. Such a mechanism may result in a distinct metabolite output under stress, which ultimately will change the root exudate and shape the rhizosphere microbial community towards the enrichment in PGPR able to help the plant to cope with drought. In fact, an active recruitment or selection of beneficial bacteria by the tomato water-limited rhizo-environment might be inferred, as most isolates therein recovered—and selected based on the notorious different colony morphology than that observed for colonies obtained from the rhizosphere of well-watered plants—had several of the tested biochemical PGPR traits relevant for drought stress tolerance. These traits included the solubilization of inorganic phosphate, the mineralization of organic phosphate, the synthesis of siderophores, and the production of the phytohormone IAA. In summary, the work herein suggests the above indices may be used as early proxies for the detection of drought stress in tomato and other crops at small-scale fields, within a rapid protocol using a handheld device.

Author Contributions

Conceptualization and investigation, M.M.S., L.B. and C.C.; methodology, A.P.R., L.B. and L.C.; writing—original draft preparation, A.P.R., L.B. and M.M.S.; writing—review and editing, M.M.S. and C.C. All authors have read and agreed to the published version of the manuscript.

Funding

This research was funded by national funds through FCT—Fundação para a Ciência e a Tecnologia—in the frame of FCT R&D Unit funding UIDB/00329/2020. This work was supported by the Fundação para a Ciência e a Tecnologia (FCT) under Grant SFRH/BD/136188/2018, assigned to A.P.R.

Institutional Review Board Statement

Not applicable.

Informed Consent Statement

Not applicable.

Data Availability Statement

Not applicable.

Acknowledgments

M.M.S. acknowledges FCT—Fundação para a Ciência e a Tecnologia—the current research contract.

Conflicts of Interest

The authors declare no conflict of interest.

References

  1. Kasim, W.A.; Osman, M.E.; Omar, M.N.; Abd El-Daim, I.A.; Bejai, S.; Meijer, J. Control of Drought Stress in Wheat Using Plant Growth Promoting Bacteria. J. Plant Growth Regul. 2013, 32, 122–130. [Google Scholar] [CrossRef]
  2. Meena, K.K.; Sorty, A.M.; Bitla, U.M.; Choudhary, K.; Gupta, P.; Pareek, A.; Singh, D.P.; Prabha, R.; Sahu, P.K.; Gupta, V.K.; et al. Abiotic Stress Responses and Microbe-Mediated Mitigation in Plants: The Omics Strategies. Front. Plant Sci. 2017, 9, 172. [Google Scholar] [CrossRef] [Green Version]
  3. Vurukonda, S.S.; Vardharajula, S.; Shrivastava, M.; SkZ, A. Enhancement of Drought Stress Tolerance in Crops by Plant Growth Promoting Rhizobacteria. Microbiol. Res. 2016, 184, 13–24. [Google Scholar] [CrossRef]
  4. Shrivastava, P.; Kumar, R. Soil Salinity: A Serious Environmental Issue and Plant Growth Promoting Bacteria as One of the Tools for its Alleviation. Saudi J. Biol. Sci. 2015, 22, 123–131. [Google Scholar] [CrossRef] [Green Version]
  5. Jaleel, C.A.; Manivannan, P.; Wahid, A.; Farooq, M.; Al-Juburi, H.J.; Somasundaram, R.; Panneerselvam, R. Drought Stress in Plants: A Review on Morphological Characteristics and Pigments Composition. Int. J. Agric. Biol. 2009, 11, 100–105. [Google Scholar]
  6. Khan, N.A.; Khan, M.I.R.; Ferrante, A.; Poor, P. Editorial: Ethylene: A Key Regulatory Molecule in Plants. Front. Plant Sci. 2017, 8, 1782. [Google Scholar] [CrossRef] [PubMed] [Green Version]
  7. Chaves, M.M.; Flexas, J.; Pinheiro, C. Photosynthesis under Drought and Salt Stress: Regulation Mechanisms from Whole Plant to Cell. Ann. Bot. 2009, 103, 551–560. [Google Scholar] [CrossRef] [PubMed] [Green Version]
  8. Cruz de Carvalho, M.H. Drought Stress and Reactive Oxygen Species: Production, Scavenging and Signaling. Plant Signal. Behav. 2008, 3, 156–165. [Google Scholar] [CrossRef] [Green Version]
  9. Alharby, H.F.; Al-Zahrani, H.S.; Alzahrani, Y.M.; Alsamadany, H.; Hakeem, K.R.; Rady, M.M. Maize Grain Extract Enriched with Polyamines Alleviates Drought Stress in Triticum aestivum through Up-Regulation of the Ascorbate–Glutathione Cycle, Glyoxalase System, and Polyamine Gene Expression. Agronomy 2021, 11, 949. [Google Scholar] [CrossRef]
  10. Rady, M.M.; Boriek, S.H.K.; Abd El-Mageed, T.A.; Seif El-Yazal, M.A.; Ali, E.F.; Hassan, F.A.S.; Abdelkhalik, A. Exogenous Gibberellic Acid or Dilute Bee Honey Boosts Drought Stress Tolerance in Vicia faba by Rebalancing Osmoprotectants, Antioxidants, Nutrients, and Phytohormones. Plants 2021, 10, 748. [Google Scholar] [CrossRef]
  11. Tiwari, S.; Lata, C.; Chauhan, P.S.; Nautiyal, C.S. Pseudomonas putida Attunes Morphophysiological, Biochemical and Molecular Responses in Cicer arietinum L. During Drought Stress and Recovery. Plant Physiol. Biochem. 2016, 99, 108–117. [Google Scholar] [CrossRef]
  12. Abedini, D.; Jaupitre, S.; Bouwmeester, H.; Dong, L. Metabolic Interactions in Beneficial Microbe Recruitment by Plants. Curr. Opin. Biotechnol. 2021, 70, 241–247. [Google Scholar] [CrossRef] [PubMed]
  13. Schalk, I.J.; Hannauer, M.; Braud, A. New Roles for Bacterial Siderophores in Metal Transport and Tolerance. Environ. Microbiol. 2011, 13, 2844–2854. [Google Scholar] [CrossRef]
  14. Backer, R.; Rokem, J.S.; Ilangumaran, G.; Lamont, J.; Praslickova, D.; Ricci, E.; Subramanian, S.; Smith, D.L. Plant Growth-Promoting Rhizobacteria: Context, Mechanisms of Action, and Roadmap to Commercialization of Biostimulants for Sustainable Agriculture. Front. Plant Sci. 2018, 9, 1473. [Google Scholar] [CrossRef] [Green Version]
  15. Adesemoye, A.O.; Torbert, H.A.; Kloepper, J.W. Plant Growth-Promoting Rhizobacteria Allow Reduced Application Rates of Chemical Fertilizers. Microb. Ecol. 2009, 58, 921–929. [Google Scholar] [CrossRef] [PubMed] [Green Version]
  16. Le, T.A.; Pék, Z.; Takács, S.; Neményi, A.; Daood, H.G.; Helyes, L. The Effect of Plant Growth Promoting Rhizobacteria on the Water-Yield Relationship and Carotenoid Production of Processing Tomatoes. HortScience 2018, 53, 816–822. [Google Scholar] [CrossRef] [Green Version]
  17. Akhtar, S.S.; Amby, D.B.; Hegelund, J.N.; Fimognari, L.; Großkinsky, D.K.; Westergaard, J.C.; Müller, R.; Moelbak, L.; Liu, F.; Roitsch, T. Bacillus licheniformis FMCH001 Increases Water Use Efficiency Via Growth Stimulation in Both Normal and Drought Conditions. Front. Plant Sci. 2020, 11, 297. [Google Scholar] [CrossRef]
  18. Xun, W.; Shao, J.; Shen, Q.; Zhang, R. Rhizosphere Microbiome: Functional Compensatory Assembly for Plant Fitness. Comput. Struct. Biotechnol. J. 2021, 19, 5487–5493. [Google Scholar] [CrossRef]
  19. Naylor, D.; Coleman-Derr, D. Drought Stress and Root-Associated Bacterial Communities. Front. Plant Sci. 2018, 8, 2223. [Google Scholar] [CrossRef] [PubMed]
  20. Timmusk, S.; Abd El-Daim, I.A.; Copolovici, L.; Tanilas, T.; Kännaste, A.; Behers, L.; Nevo, E.; Seisenbaeva, G.; Stemström, E.; Niinemets, Ü. Drought-Tolerance of Wheat Improved by Rhizosphere Bacteria from Harsh Environments: Enhanced Biomass Production and Reduced Emissions of Stress Volatiles. PLoS ONE 2014, 9, e96086. [Google Scholar] [CrossRef] [Green Version]
  21. Jochum, M.D.; McWilliams, K.L.; Borrego, E.J.; Kolomiets, M.V.; Niu, G.; Pierson, E.A.; Jo, Y.-K. Bioprospecting Plant Growth-Promoting Rhizobacteria that Mitigate Drought Stress in Grasses. Front. Microbiol. 2019, 10, 2106. [Google Scholar] [CrossRef] [PubMed]
  22. Zhang, Y.; Gao, X.; Shen, Z.; Zhu, C.; Jiao, Z.; Li, R.; Shen, Q. Pre-colonization of PGPR Triggers Rhizosphere Microbiota Succession Associated with Crop Yield Enhancement. Plant Soil 2019, 439, 553–567. [Google Scholar] [CrossRef]
  23. Berg, G.; Kusstatscher, P.; Abdelfattah, A.; Cernava, T.; Smalla, K. Microbiome Modulation-Toward a Better Understanding of Plant Microbiome Response to Microbial Inoculants. Front. Microbiol. 2021, 12, 650610. [Google Scholar] [CrossRef]
  24. Erdle, K.; Mistele, B.; Schmidhalter, U. Spectral High-Throughput Assessments of Phenotypic Differences in Biomass and Nitrogen Partitioning During Grain Filling of Wheat Under High Yielding Western European Conditions. Field Crops Res. 2013, 141, 16–26. [Google Scholar] [CrossRef]
  25. Becker, E.; Schmidhalter, U. Evaluation of Yield and Drought Using Active and Passive Spectral Sensing Systems at the Reproductive Stage in Wheat. Front. Plant Sci. 2017, 8, 379. [Google Scholar] [CrossRef] [Green Version]
  26. El-Hendawy, S.E.; Alotaibi, M.; Al-Suhaibani, N.; Al-Gaadi, K.; Hassan, W.; Dewir, Y.H.; Emam, M.A.E.-G.; Elsayed, S.; Schmidhalter, U. Comparative Performance of Spectral Reflectance Indices and Multivariate Modeling for Assessing Agronomic Parameters in Advanced Spring Wheat Lines Under Two Contrasting Irrigation Regimes. Front. Plant Sci. 2019, 10, 1537. [Google Scholar] [CrossRef]
  27. El-Hendawy, S.; Al-Suhaibani, N.; Elsayed, S.; Hassan, W.M.; Dewir, Y.H.; Refay, Y.; Abdella, K.A. Potential of the Existing and Novel Spectral Reflectance Indices for Estimating the Leaf Water Status and Grain Yield of Spring Wheat Exposed to Different Irrigation Rates. Agric. Water Manag. 2019, 217, 356–373. [Google Scholar] [CrossRef]
  28. Wahb-Allah, M.A.; Alsadon, A.A.; Ibrahim, A.A. Drought Tolerance of Several Tomato Genotypes under Greenhouse Conditions. World Appl. Sci. J. 2011, 15, 933–940. [Google Scholar]
  29. Santana, M.M.; Carvalho, L.; Melo, J.; Araújo, M.E.; Cruz, C. Unveiling the Hidden Interaction between Thermophiles and Plant Crops: Wheat and Soil Thermophilic Bacteria. J. Plant Interact. 2020, 15, 127–138. [Google Scholar] [CrossRef]
  30. Zhou, R.; Yu, X.; Ottosen, C.O.; Rosenqvist, E.; Zhao, L.; Wang, Y.; Yu, W.; Zhao, T.; Wu, Z. Drought Stress had a Predominant Effect over Heat Stress on Three Tomato Cultivars Subjected to Combined Stress. BMC Plant Biol. 2017, 17, 24. [Google Scholar] [CrossRef] [Green Version]
  31. Bakken, L.R. Separation and Purification of Bacteria from Soil. Appl. Environ. Microbiol. 1985, 49, 1482–1487. [Google Scholar] [CrossRef] [PubMed] [Green Version]
  32. Yim, W.J.; Poonguzhali, S.; Madhaiyan, M.; Palaniappan, P.; Siddikee, M.A.; Sa, T. Characterization of Plant-Growth Promoting Diazotrophic Bacteria Isolated from Field Grown Chinese Cabbage under Different Fertilization Conditions. J. Microbiol. 2009, 47, 147–155. [Google Scholar] [CrossRef]
  33. Kelel, M.; Abera, G.; Yisma, A.; Molla, B.; Gebre, N.; Adugna, T.; Gary, M.; Wessel, G.M. Isolation of Phosphate Solubilizing Bacteria from Acacia Tree Rhizophere Soil. J. Microbiol. Biotechnol. Res. 2017, 4, 9–13. [Google Scholar]
  34. Alexander, D.B.; Zuberer, D.A. Use of Chrome Azurol S Reagents to Evaluate Siderophore Production by Rhizosphere Bacteria. Biol. Fertil. Soils 1991, 12, 39–45. [Google Scholar] [CrossRef]
  35. Ryskov, A.P.; Jincharadze, A.G.; Prosnyak, M.I.; Ivanov, P.L.; Limborska, S.A. M13 Phage DNA as a Universal Marker for DNA Fingerprinting of Animals, Plants and Microorganisms. FEBS Lett. 1988, 233, 388–392. [Google Scholar] [CrossRef] [Green Version]
  36. Huey, B.; Hall, J. Hypervariable DNA Fingerprinting in Escherichia coli: Minisatellite Probe from Bacteriophage M13. J. Bacteriol. 1989, 171, 2528–2532. [Google Scholar] [CrossRef] [Green Version]
  37. Pitcher, D.G.; Saunders, N.A.; Owen, R.J. Rapid Extraction of Bacterial Genomic DNA with Guanidium Thiocyanate. Lett. Appl. Microbiol. 1989, 8, 151–156. [Google Scholar] [CrossRef]
  38. Rouse, J.W.; Haas, R.H.; Schell, J.A.; Deering, D.W. Monitoring Vegetation Systems in the Great Plains with ERTS. In Proceedings of the 3rd ERTS Symposium, NASA SP-351; Scientific and Technical Information Office, National Aeronautics and Space Administration: Washington, DC, USA, 1973; Volume 1, pp. 309–317. [Google Scholar]
  39. Rouse, J.W.; Haas, R.H.; Deering, D.W.; Schell, J.A.; Harlan, J.C. Monitoring the Vernal Advancement and Retrogradation (Greenwave Effect) of Natural Vegetation, Type III Final Report; NASA Goddard Space Flight Center: Greenbelt, MD, USA, 1974; p. 371. [Google Scholar]
  40. Sellers, P.J. Canopy Reflectance, Photosynthesis, and Transpiration. Int. J. Remote Sens. 1985, 6, 1335–1372. [Google Scholar] [CrossRef] [Green Version]
  41. Birth, G.S.; McVey, G. Measuring the Colour of Growing Turf with a Reflectance Spectrophotometer. Agron. J. 1968, 60, 640–643. [Google Scholar] [CrossRef]
  42. Jordan, C.F. Derivation of Leaf Area Index from Quality of Light on the Forest Floor. Ecology 1969, 50, 663–666. [Google Scholar] [CrossRef]
  43. Haboudane, D.; Miller, J.R.; Pattey, E.; Zarco-Tejada, P.J.; Strachan, I.B. Hyperspectral Vegetation Indices and Novel Algorithms for Predicting Green LAI of Crop Canopies: Modeling and Validation in the Context of Precision Agriculture. Remote Sens. Environ. 2004, 90, 337–352. [Google Scholar] [CrossRef]
  44. Rondeaux, G.; Steven, M.; Barret, F. Optimization of Soil Adjusted Vegetation Indices. Remote Sens. Environ. 1996, 55, 95–107. [Google Scholar] [CrossRef]
  45. Zarco-Tejada, P.J.; Berjón, A.; López-Lozano, R.; Miller, J.R.; Martín, P.; Cachorro, V.; González, M.R.; de Frutos, A. Assessing Vineyard Condition with Hyperspectral Indices: Leaf and Canopy Reflectance Simulation in a Row-Structured Discontinuous Canopy. Remote Sens. Environ. 2005, 99, 271–287. [Google Scholar] [CrossRef]
  46. Daughtry, C.S.T.; Walthall, C.L.; Kim, M.S.; De Colstoun, E.B.; McMurtrey, J.E., III. Estimating Corn Leaf Chlorophyll Concentration from Leaf and Canopy Reflectance. Remote Sens. Environ. 2000, 74, 229–239. [Google Scholar] [CrossRef]
  47. Haboudane, D.; Miller, J.R.; Trembley, N.; Zarco-Tejada, P.J.; Dextraze, L. Integrated Narrow Band Vegetation Indices for Prediction of Crop Chlorophyll Content for Application to Precision Agriculture. Remote Sens. Environ. 2002, 81, 416–426. [Google Scholar] [CrossRef]
  48. Broge, N.H.; Leblanc, E. Comparing Predictive Power and Stability of Broad-Band and Hyperspectral Vegetation Indices for Estimation of Green Leaf Area Index and Canopy Chlorophyll Density. Remote Sens. Environ. 2000, 76, 156–172. [Google Scholar] [CrossRef]
  49. Zarco-Tejada, P.J.; Miller, J.R.; Noland, T.L.; Mohammed, G.H.; Sampson, P.H. Scaling-Up and Model Inversion Methods with Narrow-Band Optical Indices for Chlorophyll Content Estimation in Closed Forest Canopies with Hyperspectral Data. IEEE Trans. Geosci. Remote Sens. 2001, 39, 1491–1507. [Google Scholar] [CrossRef] [Green Version]
  50. Peñuelas, J.; Baret, F.; Filella, I. Semi-Empirical Indices to Assess Carotenoids/Chlorophyll a Ratio from Leaf Spectral Reflectance. Photosynthetica 1995, 31, 221–230. [Google Scholar]
  51. Barnes, J.D.; Balaguer, L.; Manrique, E.; Elvira, S.; Davison, A.W. A Reappraisal of the Use of DMSO for the Extraction and Determination of Chlorophylls a and b in Lichens and Higher Plants. Environ. Exp. Bot. 1992, 32, 85–100. [Google Scholar] [CrossRef]
  52. Peñuelas, J.; Filella, I.; Gamon, J.A. Assessment of Photosynthetic Radiation-Use Efficiency with Spectral Reflectance. New Phytol. 1995, 131, 291–296. [Google Scholar] [CrossRef]
  53. Gamon, J.A.; Serrano, L.; Surfus, J.S. The Photochemical Reflectance Index: An Optical Indicator of Photosynthetic Radiation Use Efficiency across Species, Functional Types, and Nutrient Levels. Oecologia 1997, 112, 492–501. [Google Scholar] [CrossRef] [PubMed]
  54. Peñuelas, J.; Gamon, J.A.; Fredeen, A.L.; Merino, J.; Field, C.B. Reflectance Indices Associated with Physiological Changes in Nitrogen- and Water-Limited Sunflower Leaves. Remote Sens. Environ. 1994, 48, 135–146. [Google Scholar] [CrossRef]
  55. Carter, G.A. Ratios of Leaf Reflectance in Narrow Wavebands as Indicators of Plant Stress. Int. J. Remote Sens. 1994, 15, 697–703. [Google Scholar] [CrossRef]
  56. Carter, G.A.; Cibula, W.G.; Miller, R.L. Narrow-Band Reflectance Imagery Compared with Thermal Imagery for Early Detection of Plant Stress. J. Plant Physiol. 1996, 148, 515–522. [Google Scholar] [CrossRef]
  57. Lichtenthaler, H.K.; Lang, M.; Sowinska, M.; Heisel, F.; Miehé, J.A. Detection of Vegetation Stress Via a New High Resolution Fluorescence Imaging System. J. Plant Physiol. 1996, 148, 599–612. [Google Scholar] [CrossRef]
  58. Gitelson, A.A.; Merzlyak, M.N. Remote Estimation of Chlorophyll Content in Higher Plant Leaves. Int. J. Remote Sens. 1997, 18, 2691–2697. [Google Scholar] [CrossRef]
  59. Gitelson, A.A.; Merzlyak, M.N. Remote Sensing of Chlorophyll Concentration in Higher Plant Leaves. Adv. Space Res. 1998, 22, 689–692. [Google Scholar] [CrossRef]
  60. Gitelson, A.A.; Merzlyak, M.N.; Chivkunova, O.B. Optical Properties and Nondestructive Estimation of Anthocyanin Content in Plant Leaves. Photochem. Photobiol. 2001, 74, 38–45. [Google Scholar] [CrossRef] [PubMed]
  61. Gitelson, A.A.; Zur, Y.; Chivkunova, O.B.; Merzlyak, M.N. Assessing Carotenoid Content in Plant Leaves with Reflectance Spectroscopy. Photochem. Photobiol. 2002, 75, 272–281. [Google Scholar] [CrossRef]
  62. Roujean, J.-L.; Breon, F.-M. Estimating PAR Absorbed by Vegetation from Bidirectional Reflectance Measurements. Remote Sens. Environ. 1995, 51, 375–384. [Google Scholar] [CrossRef]
  63. Estill, K.; Delaney, R.H.; Smith, W.K.; Ditterline, R.L. Water Relations and Productivity of Alfalfa Leaf Chlorophyll Variants. Crop Sci. 1991, 31, 1229–1233. [Google Scholar] [CrossRef]
  64. Ashraf, M.; Karim, F. Screening of Some Cultivars/Lines of Black Gram (Vigna mungo L. Hepper) for Resistance to Water Stress. Trop. Agric. 1991, 68, 57–62. [Google Scholar]
  65. Gubiš, J.; Vaňková, R.; Červená, V.; Dragúňová, M.; Hudcovicová, M.; Lichtnerová, H.; Dokupil, T.; Jureková, Z. Transformed Tobacco Plants with Increased Tolerance to Drought. S. Afr. J. Bot. 2007, 73, 505–511. [Google Scholar] [CrossRef] [Green Version]
  66. Makela, P.; Karkkainen, J.; Somersalo, S. Effect of Glycinebetaine on Chloroplast Ultrastructure, Chlorophyll and Protein Content, and RuBPCO activities in Tomato Grown Under Drought or Salinity. Biol. Plant. 2000, 43, 471–475. [Google Scholar] [CrossRef]
  67. Yudina, L.; Sukhova, E.; Mudrilov, M.; Nerush, V.; Pecherina, A.; Smirnov, A.A.; Dorokhov, A.S.; Chilingaryan, N.O.; Vodeneev, V.; Sukhov, V. Ratio of Intensities of Blue and Red Light at Cultivation Influences Photosynthetic Light Reactions, Respiration, Growth, and Reflectance Indices in Lettuce. Biology 2022, 11, 60. [Google Scholar] [CrossRef]
  68. Lichtenthaler, H.K.; Miehé, J.A. Fluorescence Imaging as a Diagnostic Tool for Plant Stress. Trends Plant Sci. 1997, 2, 316–320. [Google Scholar] [CrossRef]
  69. Chen, X.L.; Li, Y.L.; Wang, L.C.; Guo, W.Z. Red and Blue Wavelengths Affect the Morphology, Energy Use Efficiency and Nutritional Content of Lettuce (Lactuca sativa L.). Sci. Rep. 2021, 11, 8374. [Google Scholar] [CrossRef]
  70. Izzo, L.G.; Mickens, M.A.; Aronne, G.; Gómez, C. Spectral Effects of Blue and Red Light on Growth, Anatomy, and Physiology of Lettuce. Physiol. Plant. 2021, 172, 2191–2202. [Google Scholar] [CrossRef]
  71. Joliot, P.; Joliot, A. Cyclic Electron Flow in C3 Plants. Biochim. Biophys. Acta 2006, 1757, 362–368. [Google Scholar] [CrossRef] [Green Version]
  72. Sukhov, V.; Sukhova, E.; Vodeneev, V. Long-Distance Electrical Signals as a Link between the Local Action of Stressors and the Systemic Physiological Responses in Higher Plants. Prog. Biophys. Mol. Biol. 2019, 146, 63–84. [Google Scholar] [CrossRef]
  73. Sukhov, V. Electrical Signals as Mechanism of Photosynthesis Regulation in Plants. Photosynth. Res. 2016, 130, 373–387. [Google Scholar] [CrossRef]
  74. Murata, N.; Nishiyama, Y. ATP is a Driving Force in the Repair of Photosystem II during Photoinhibition. Plant Cell Environ. 2018, 41, 285–299. [Google Scholar] [CrossRef]
  75. Huang, W.; Yang, S.J.; Zhang, S.B.; Zhang, J.L.; Cao, K.F. Cyclic Electron Flow Plays an Important Role in Photoprotection for the Resurrection Plant Paraboea rufescens Under Drought Stress. Planta 2012, 235, 819–828. [Google Scholar] [CrossRef] [PubMed]
  76. Lehtimäki, N.; Lintala, M.; Allahverdiyeva, Y.; Aro, E.M.; Mulo, P. Drought Stress-Induced Upregulation of Components Involved in Ferredoxin-Dependent Cyclic Electron Transfer. J. Plant Physiol. 2010, 167, 1018–1022. [Google Scholar] [CrossRef]
  77. Suorsa, M. Cyclic Electron Flow Provides Acclimatory Plasticity for the Photosynthetic Machinery Under Various Environmental Conditions and Developmental Stages. Front. Plant Sci. 2015, 6, 800. [Google Scholar] [CrossRef] [PubMed]
  78. Barton, C.V.M.; North, P.R.J. Remote Sensing of Canopy Light Use Efficiency Using the Photochemical Reflectance Index: Model and Sensitivity Analysis. Remote Sens. Environ. 2001, 78, 264–273. [Google Scholar] [CrossRef]
  79. Thenot, F.; Méthy, M.; Winkel, T. The Photochemical Reflectance Index (PRI) as a Water-Stress Index. Int. J. Remote Sens. 2002, 23, 5135–5139. [Google Scholar] [CrossRef]
  80. Wieloch, T.; Augusti, A.; Schleucher, J. Anaplerotic Flux into the Calvin-Benson Cycle: Hydrogen Isotope Evidence for in vivo Occurrence in C3 Metabolism. New Phytol. 2022, 234, 405–411. [Google Scholar] [CrossRef]
  81. Sunil, B.; Saini, D.; Bapatla, R.B.; Aswani, V.; Raghavendra, A.S. Photorespiration is Complemented by Cyclic Electron Flow and the Alternative Oxidase Pathway to Optimize Photosynthesis and Protect against Abiotic Stress. Photosynth. Res. 2019, 139, 67–79. [Google Scholar] [CrossRef]
  82. Ahmad, H.M.; Fiaz, S.; Hafeez, S.; Zahra, S.; Shah, A.N.; Gul, B.; Aziz, O.; Mahmood-Ur-Rahman; Fakhar, A.; Rafique, M.; et al. Plant Growth-Promoting Rhizobacteria Eliminate the Effect of Drought Stress in Plants: A Review. Front. Plant Sci. 2022, 13, 875774. [Google Scholar] [CrossRef]
Figure 1. Differences between vegetation index values determined in treatments with watering to 80% and 40% field capacity, along the 37 days of the experiment (day 1 corresponds to the start of the application of the different watering regimes), in box and whiskers graphics. The “box” includes differences between the 1st and the 3rd quartile. The pink background is used for the period with no significant differences in the index’s values, whereas the green background represents the period when differences were significantly different from zero. Each day of the graphic includes 400 differences calculated between the 20 replicates of the different water regimes.
Agronomy 13 00183 g001aAgronomy 13 00183 g001b
Figure 2. Differences between morphological parameters (No. of leaves—(A) and plant height—(B)) values measured in treatments with watering to 80% and 40% field capacity, along the 37 days of the experiment, in box and whiskers graphics. The “box” includes differences between the 1st and the 3rd quartile. Each day of the graphic includes 400 differences calculated between the 20 replicates of the different water regimes. (C) Tomato shoot’s dry biomass obtained at the end of the experiment for both treatments (n = 12). Values shown are means and error bars represent the standard error of the mean. The different letters above the bars (a and b) indicate means that differ significantly (p < 0.001).
Agronomy 13 00183 g002
Figure 3. Dendrogram of M13 PCR-fingerprint profiles of 32 isolates obtained from the rhizosphere of tomato watered to 40% field capacity (the scale represents the similarity based on Pearson correlation coefficient and UPGMA). Different plant growth-promoting attributes are represented by a different color and darker grey intensity corresponds to higher production or activity; average values of IAA production (µg IAA mg−1), of indices of phosphate solubilization and mineralization and siderophore production (calculated as colony diameter + halo zone diameter)/colony diameter) are indicated (n = 3).
Agronomy 13 00183 g003
Figure 4. Timeline of the tomato plant experiment, showing when the indices became significantly different between the two treatments (watering to 80% and 40% of soil field capacity). “Green” indices indicate significance from that day on, while “gold” indices indicate that although the indices became significantly different between treatments, the significance was not consistent until day 37. Photos of representative plants from each treatment, taken during the experiment, are included.
Agronomy 13 00183 g004
Table 1. Soil physico-chemical properties.
pH (H2O) (20 °C)7.4
σ (mS cm−1)0.583
TextureClay
% Organic matter4.13
% N0.18
Phosphorus (P2O5) mg kg−146.9
Potassium (K2O) mg kg−1220
Sulfur (S) mg kg−115.5
Sodium (Na) mg kg−115.8
Zinc (Zn) mg kg−1<2.20 (LQ) 1
Molybdenum (Mo) mg kg−1<0.400 (LQ) 1
1 LQ—Limit of quantification.
Table 2. Spectral reflectance indices (SRI) calculated with PolyPen RP410.
AcronymNameDescriptionFormulaReference
NDVINormalized Difference Vegetation IndexQuantifies green vegetation by calculating the normalized difference between near-infrared (scattered by green leaves) and red light (absorbed by vegetation); directly related to the photosynthetic capacity of the plant.NDVI = (RNIR − RRED)/(RNIR + RRED)[38,39,40]
SRSimple Ratio IndexQuantifies green vegetation by calculating the ratio between the reflectance in near-infrared and red bands, taking advantage of the increased red-light absorption by chlorophyll, but increased reflectance of near-infrared energy for healthy plants.SR = RNIR/RRED[39,41,42]
MCARI1Modified Chlorophyll Absorption in Reflectance Index 1Less sensitive than MCARI (see below) to the effect of leaf chlorophyll content on the prediction of green leaf area index (LAI).MCARI1 = 1.2 × [2.5 × (R790 − R670) − 1.3 × (R790 − R550)][43]
OSAVIOptimized Soil-Adjusted Vegetation IndexThe index is optimized for agricultural monitoring, being a good estimator of green vegetation in homogeneous canopies such as those from agricultural crops, especially at mid-latitudes.OSAVI = (1 + 0.16) × (R790 − R670)/(R790 − R670 + 0.16)[44]
GGreenness IndexA chlorophyll index for chlorophyll content estimation from leaf optical properties, i.e., from leaf reflectance in the visible and the red edge spectral region.G = R554/R677[45]
MCARIModified Chlorophyll Absorption in Reflectance IndexThe index responds to leaf chlorophyll concentrations, but shows high sensitivity to variations in LAI, being difficult to interpret for low LAI values. It minimizes the confounding background reflectance of soil and non-photosynthetic elements.MCARI = [(R700 − R670) − 0.2 × (R700 − R550)] × (R700/R670)[46]
TCARITransformed Chlorophyll Absorption Reflectance IndexAs MCARI, this index indicates the relative abundance of chlorophyll, but exhibits a better sensitivity at low chlorophyll concentrations. Although relatively less responsive than MCARI to LAI variations, it is still sensitive to the underlying soil reflectance properties, particularly for low LAIs.TCARI = 3 × [(R700- R670) − 0.2 × (R700-R550) × (R700/R670)][47]
TVITriangular Vegetation IndexCalculated as the area of a hypothetical triangle in spectral space that links green peak reflectance, the chlorophyll absorption minimum, and the NIR shoulder. Both chlorophyll absorption causing a decrease in red reflectance, and leaf tissue abundance causing an increase in NIR reflectance, will increase the triangle area. This index is a good estimator of green LAI.TVI = 0.5 × [120 × (R750 − R550) − 200 × (R670 − R550)][48]
ZMIZarco-Tejada and Miller IndexThe index is used to estimate chlorophyll a+b contents at canopy level, minimizing the effect of LAI variation.ZMI = R750/R710[49]
SRPISimple Ratio Pigment IndexThe index is used to assess the ratio between carotenoids and chlorophyll a concentrations.SRPI = R430/R680[50]
NPQINormalized Phaeophytinization IndexThe index estimates relative contents of chlorophyll a and phaeophytin, the primary electron acceptor in PSII.NPQI = (R415 − R435)/(R415 + R435)[49,51]
PRIPhotochemical Reflectance IndexThe index is sensitive to changes in carotenoid pigments (particularly xanthophylls) in live foliage; xanthophyll cycle pigments are closely linked to PSII light use efficiency and PRI is an optical indicator of photosynthetic radiation use efficiency.PRI = (R531 − R570)/(R531 + R570)[52,53]
NPCINormalized Pigment Chlorophyll IndexDefined to evaluate carotenoids/chlorophyll ratio, and particularly applicable to N limitation, when plants develop greater concentration of carotenoids relative to chlorophyll, this index estimates the proportion of total photosynthetic pigments to chlorophyll.NPCI = (R680 − R430)/(R680 + R430)[54]
Ctr1Carter Index 1As a result of decreased absorption by pigments, visible reflectance increases in stressed leaves and is most sensitive to stress in the 535–640 nm and 685–700 nm range; ratios of leaf reflectances Ctr1 and Ctr 2 were those that most strongly indicated plant stress caused by several agents among several species.Ctr1 = R695/R420[55,56]
Ctr2Carter Index 2Ctr2 = R695/R760
Lic1Lichtenthaler Index 1The ratios, namely, blue (440 nm)/red (690 nm) reflectances, are related to chlorophyll fluorescence emission; F440/F690 is very sensitive to environmental changes, permitting an early stress detection in plants’ photosynthetic apparatus.Lic1 = (R790 − R680)/(R790 + R680)[45,57]
Lic2Lichtenthaler Index 2Lic2 = R440/R690
SIPIStructure Intensive Pigment IndexThe index is used to assess the ratio between carotenoids and chlorophyll a concentrations.SIPI = (R790 − R450)/(R790 − R650)[50]
GM1Gitelson and Merzlyak Index 1GM ratios were developed as indices with maximum sensitivity to chlorophyll as they use reflectances corresponding to wavelengths with high sensitivity (550 nm and 700 nm), and insensitivity (750 nm) to variations in chlorophyll content; directly proportional to the leaves’ chlorophyll concentration in several plant species and within a large range of its variation.GM1 = R750/R550[58,59]
GM2Gitelson and Merzlyak Index 2GM2 = R750/R700
ARI1Anthocyanin Reflectance Index 1ARI1 index was developed for the estimation of the accumulation of anthocyanins, which are stress-related pigments. ARI2 corrects for leaf density and thickness, as the near-infrared spectral band (760–800 nm), related to leaf scattering, is added to ARI1.ARI1 = 1/R550 − 1/R700[60]
ARI2Anthocyanin Reflectance Index 2ARI2 = R800 × (1/R550 − 1/R700)
CRI1Carotenoid Reflectance Index 1CRI indices estimate the total carotenoid content in plant leaves; the sensitivity of reciprocal reflectance to carotenoid content was maximal around 510 nm, but since chlorophylls affect reflectance in this spectral range, a reciprocal reflectance at either 550 or 700 nm, linearly proportional to the chlorophyll content, was used to remove their effect.CRI1 = 1/R510 − 1/R550[61]
CRI2Carotenoid Reflectance Index 2CRI2 = 1/R510 − 1/R700
RDVIRenormalized Difference Vegetation IndexThe index uses the difference between near-infrared and red wavelengths, along with NDVI, to spot healthy vegetation, but it is insensitive to the effects of soil reflectance and sun-viewing geometry.RDVI = (R780 − R670)/((R780 + R670)^0.5)[62]
Table 3. Calculated Spearman correlation coefficient to assess the relationship between morphological parameters (No. leaves and plant height) and the reflectance indices along the experiment.
IndexNo. LeavesPlant Height
NDVI0.124−0.721 **
SR0.124−0.721 **
MCARI10.1510.047
OSAVI0.194 *−0.474 **
G−0.195 *0.388 **
MCARI−0.0970.512 **
TCARI0.115−0.504 **
TVI0.214 **−0.011
ZMI0.157 *−0.592 **
SRPI0.195 *−0.575 **
NPQI0.015−0.489 **
PRI0.000−0.525 **
NPCI−0.195 *0.575 **
CTr1−0.196 *0.657 **
CTr2−0.179 *0.708 **
Lic10.068−0.508 **
Lic20.213 **−0.572 **
SIPI0.014−0.432 **
GM10.231 **−0.647 **
GM20.174 *−0.658 **
ARI10.1070.254 **
ARI20.1180.252 **
CRI1−0.200 *−0.063
CRI2−0.178 *0.057
RDVI0.237 **−0.306 **
** Correlation is significant at the 0.01 level, * Correlation is significant at the 0.05 level. The background grey color highlights the statistically significant correlations.
Disclaimer/Publisher’s Note: The statements, opinions and data contained in all publications are solely those of the individual author(s) and contributor(s) and not of MDPI and/or the editor(s). MDPI and/or the editor(s) disclaim responsibility for any injury to people or property resulting from any ideas, methods, instructions or products referred to in the content.

