Article

Beneficial Effects of Biochar Application with Nitrogen Fertilizer on Soil Nitrogen Retention, Absorption and Utilization in Maize Production

1
College of Resources and Environment, Shandong Agricultural University, Tai’an 271018, China
2
Xiazhang Town Economic Management Station, Daiyue District, Tai’an 271023, China
3
Shandong Key Laboratory of Eco-Environmental Science for the Yellow River Delta, Binzhou University, Binzhou 256600, China
4
Shandong Provincial Territorial Spatial Ecological Restoration Center, Jinan 250014, China
*
Authors to whom correspondence should be addressed.
Agronomy 2023, 13(1), 113; https://doi.org/10.3390/agronomy13010113
Submission received: 2 December 2022 / Revised: 24 December 2022 / Accepted: 26 December 2022 / Published: 29 December 2022

Abstract

:
The irrational use of nitrogen (N) fertilizer has become a major threat to soil quality and food security, resulting in serious ecological and environmental problems. Holistic approaches to N fertilizer application are required to maintain a high N utilization efficiency (NUE) and sustainable agriculture development. Biochar is an efficient carbon-rich material for amending soil quality and promoting crop N uptake, but knowledge pertaining to the promoting effects of biochar application on N fertilizers is still limited. In this study, a field plot experiment was designed to detect the combined effects of biochar (0, 15 and 30 t ha−1) and N fertilizer (204, 240 and 276 kg N ha−1) on the soil nutrient levels, NUE, plant growth performance and crop production of maize. The results demonstrated that the combined application of N fertilizer and biochar can significantly decrease the soil pH and increase the contents of soil organic carbon, mineral N, available phosphorus and potassium. The crop N uptake and N content were largely promoted by the addition of N fertilizer and biochar, resulting in higher leaf photosynthetic efficiency, dry matter accumulation and grain yields. The highest yields (14,928 kg ha−1) were achieved using 276 kg N ha−1 N fertilizer in combination with 15 t ha−1 biochar, and the highest NUE value (46.3%) was reached with 204 kg N ha−1 N of fertilizer blended with 30 t ha−1 of biochar. According to structural equation modeling, the beneficial effects of N fertilizer and biochar on the plant biomass of maize were attributed to the direct effects related to soil chemical properties and plant growth parameters. In conclusion, N fertilizer combined with biochar application is an effective strategy to enhance the utilization of N fertilizer and crop production for maize by increasing soil fertility, improving plant crop uptake and promoting plant growth.

1. Introduction

Nitrogen (N) is one of the most indispensable nutrients for plant growth and crop productivity due to its unique role in plant genetic and metabolic processes [1,2]. Up until now, various forms of N fertilizers (e.g., urea, ammonium nitrogen and nitrate nitrogen) have been applied to farmlands to satisfy the high crop demands for N. Although sufficient N fertilizer application can meet the increasing demand of plants [3], the applied fertilizers that can be consumed by plants are less than 50% [4]. Studies have shown that as much as 50–70% of fertilizer N is lost from agricultural systems [5], resulting in a series of ecological and environmental problems [6], such as soil acidification [7], biodiversity reduction [8], water eutrophication [9] and nitrogenous gas emissions [10]. Additionally, the excessive application of N fertilizer and a high loss of N may cause a low N use efficiency (NUE) [11]. It has been reported that the NUE of conventional mineral N fertilizers is only 30–40% [12]. To enhance NUE and decrease the threats to plant health due to improper N fertilizer addition, sustainable agricultural approaches, such as optimizing the N fertilizer application rate, adding slow-releasing N fertilizer and using organic amendments need to be developed [13].
As a carbonaceous material produced via the pyrolysis of organic substances under anaerobic conditions [14], biochar has been widely utilized to amend soil quality [15], promote nutrient uptake [16], remediate organic and inorganic contaminants [17,18], alleviate the adverse effects of environmental stresses [19,20] and improve crop yields [21]. The combined application of N fertilizer and biochar has received considerable attention for its distinct advantages in increasing soil N content and enhancing NUE [22]. The mechanisms by which biochar promotes soil N retention capacity and prevents N loss are presented as follows: (i) a source of N nutrient release from the applied biochar [23]; (ii) improved electrostatic adsorption and retention of NH4+−N due to biochar’s high cation exchange capacity (CEC), rich pores, large surface areas and negatively charged surface [24]; (iii) reduced leaching of NO3−N due to increased soil water holding capacity and reduced soil moisture infiltration [25]; (iv) inhibited volatilization of N2O and NH3 by suppressing the enzyme activities of urease, nitrate reductase and nitrite reductase and the microbial activity of denitrifying bacteria [26]; and (v) increased N immobilization of soil microorganisms by providing labile carbon and a life habitat [27]. The advantages of biochar for N adsorption and retention prevent N losses through volatilization and leaching, causing the gradual release of N for plant uptake and use [28] and resulting in high NUE and crop yields [29]. A recent meta-analysis showed that biochar application enhances NUE by 12.0% and rice yields by 10.7% [30]. Similarly, studies on wheat [31], maize [32], soybean [33] and barley [34] have also revealed the beneficial effects of biochar on the improvement of N fertilizer utilization and crop productivity.
Although studies have demonstrated that treating soil with a combination of N fertilizer and biochar is a useful approach for enhancing soil quality and N available for plants [35,36], the effects are not always consistent [37]. For example, meta-analysis results from 124 published articles pointed out that the addition of biochar has an adverse effect on soil N retention and reduces the contents of available N by 11–12% [38]. In a 6-year field experiment, the application of biochar at 3.0 ton ha−1 per year caused a 10.5% decrease in rice yields due to lower soil available N content and poor soil structure [39]. The contrasting results depended on the soil type and initial nutrient levels, N fertilizer application rate, biochar feedstock, pyrolysis temperature and application rate [40]. Thus, optimizing N fertilizer and biochar application and management practices is important for crop production and environmental safety. This study was conducted on maize to (i) detect the potential effects of biochar on soil retention; (ii) investigate the improving effects of N fertilizer combined with biochar on maize yield, N uptake and NUE; and (iii) explore the optimal biochar and N fertilizer application rate for the cultivation of maize. Our findings will be helpful for formulating effective and sustainable management policies for N fertilizer and biochar use in agricultural production.

2. Materials and Methods

2.1. Experimental Site and Material Preparation

The plot experiments were conducted on farmland (36°10′ N, 117°08′ E) located in Tai’an City, Shandong Province, China. The experimental site has a warm, subtropical climate with four distinct seasons. The annual average temperature and precipitation are approximately 9 °C and 697 mm, respectively. The soil is classified as an Alfisol. The physio-chemical properties of soil before the start of experiment are shown in Table 1.
Maize seeds (c.v. Jinyu No. 1) were purchased from a local market. Biochar was produced from the pyrolysis of corn straw at 500 °C for 2 h under oxygen-limited conditions. The biochar morphology and surface functional groups are presented in Figures S1 and S2 and the physio-chemical properties are given in Table 1. The biochar was ground into powder and filtered through a 2 mm sieve before being applied to the soil.

2.2. Experimental Design

The field experiment consisted of 40 plots arranged as a complete randomized block design. Ten treatments, including N0BC0 (no N fertilization or biochar input), N1BC0 (N fertilization at 204 kg N ha−1, no biochar input), N1BC15 (N fertilization at 204 kg N ha−1, biochar at 15 ton ha−1), N1BC30 (N fertilization at 204 kg N ha−1, biochar at 30 ton ha−1), N2BC0 (N fertilization at 240 kg N ha−1, no biochar input), N2BC15 (N fertilization at 240 kg N ha−1, biochar at 15 ton ha−1), N2BC30 (N fertilization at 240 kg N ha−1, biochar at 30 ton ha−1), N3BC0 (N fertilization at 276 kg N ha−1, no biochar input), N3BC15 (N fertilization at 276 kg N ha−1, biochar at 15 ton ha−1), and N3BC30 (N fertilization at 276 kg N ha−1, biochar at 30 ton ha−1), were designed. Each treatment was repeated four times. An application rate for N fertilization of 240 kg N ha−1 is most conventionally utilized by local farmers. Superphosphate and potassium sulphate fertilizers were utilized to avoid nutrient deficiency, and the application rates were 150 kg P2O5 ha−1 and 75 kg K2O ha−1, respectively. The area of each plot was 21 m2 (5.0 m × 4.2 m), and the plots were spaced 0.5 m apart. The plant population of maize was maintained at 65,000 ha−1. The daily mean temperature and daily precipitation during the period of maize growth are shown in Figure S3.

2.3. Soil and Plant Sampling

In the harvest stage of maize, the plants were harvested, washed with deionized water and divided into roots, stems, leaves and spikes. Then, these fresh plant tissues were oven-dried at 105 °C for 30 min followed by 75 °C for 2 days to obtain a constant weight. After the dry weight (DW) was recorded, these dried plant tissues were ground in a pulverizer and sieved through a 2.5 mm sieve to determine the plant N content. Five soil samples were collected from each plot at the 0–20 cm soil depth, thoroughly mixed, sieved through a 0.15 mm sieve and divided into two parts. The first part was air-dried to determine soil pH and the contents of soil organic carbon (SOC), AP and AK. The second part were stored at −20 °C to determine the contents of mineral N (MN).

2.4. Soil Chemical Analysis

Soil pH was measured in deionized water at a soil:water ratio of 1:5 with a pH meter (PHSJ−3F, Leizi, Shanghai, China). The SOC was determined using the K2Cr2O7-volumetric method described by Olmo et al. [41]. The Olsen method was selected to measure AP [42], while AK was measured using flame emission spectrometry [43]. Fresh soil samples were extracted with 1 M KCl to determine MN using the protocol described by Arnold et al. [44].

2.5. Plant Growth Parameters, Yield and Nitrogen Contents

Before plants were harvested, four plants were randomly selected in each plot to conduct the measurements of plant height (PH) using a ruler with 1.0 mm accuracy. Leaf area (LA) was measured using a leaf area meter (LI-3100, LI-COR, Lincon, NE, USA). Specific leaf area (SLA) was calculated by determining the ratio of LA to leaf dry mass [45]. The measurements of leaf SPAD values and gas exchange parameters were conducted at the flowering stage of maize. A portable SPAD-502 Chlorophyll Metre (SPAD-502, Minolta, Japan) was applied to the leaf Chl measurements. A CIRAS-3 portable photosynthesis system (PP-systems International, Hitchin, Hertfordshire, UK) was used to conduct the measurements of the net photosynthetic rate (Pn), stomatal conductance (Gs), intercellular CO2 concentration (Ci), transpiration rate (Tr) and water use efficiency (WUE). The determination of maize grain yield in each plot was conducted when the grain moisture content reached 12% according to Likhayo et al. [46]. The grains per ear and 100-grain weights were recorded. The obtained grains were weighed and expressed as kg ha−1. The dried samples of maize were digested in a H2SO4 and H2O2 mixture, and then, the total N content in the root (RN), stem (SN), leaf (LN) and grain (GN) were analyzed using a continuous flow auto-analyzer (AAIII, SEAL Analytical, Norderstedt, Germany).

2.6. Statistical Analysis

The mean with standard deviation (± SD) is shown for each treatment. SPSS 22.0 software (IBM, Chicago, IL, USA) was employed to conduct the two-way ANOVA, and Duncan’s multiple test was selected for multiple comparisons. Principal component analysis (PCA) was conducted using Origin 2021 software (Origin Lab, Northampton, MA, USA). A 3D color map graph, which set the N fertilizer application rate as the x-axis, biochar application rate as the y-axis and grain yield of maize as the z-axis, was generated using Origin 2021 software. Correlation analysis, expressed as a heatmap, was carried out using the R program. SmartPLS 3.0 software was applied for building structural equation modeling (SEM) to evaluate the potential effects of biochar and N fertilizer on soil quality, NUE, plant growth and maize crop production.
The following formulas described by Arif et al. [47] were applied to calculate the NUE:
Plant   N   untake   ( kg   ha 1 ) = Plant   N   content   ( kg   ha 1 ) × Plantdryweight   ( kg   ha 1 ) 1000
NUE = N   uptake   in   fertilized   plot   ( kg   ha 1 ) N   uptake   in   control   plot   ( kg   ha 1 ) Total   N   applied   ( kg   ha 1 )

3. Results

3.1. Soil pH and Nutrients

The changes in soil pH, SOC, MN, AP and AK in the different N fertilizer and biochar treatment groups are shown in Table 2. Under the same N fertilizer application conditions, 0.01–0.07 units of soil pH were increased with the addition of biochar. However, the application of N fertilizer caused a significant decrease in soil pH. Under different biochar application conditions, compared to that with the N1 treatment, the soil pH decreased by 0.05–0.07 units with the N2 treatment and by 0.14–0.19 units with the N3 treatment. The addition of N fertilizer and biochar remarkably improved the contents of SOC, MN, AP and AK. Compared to those in the N1BC0 treatment group, the contents of SOC, MN, AP and AK increased by 5.7~57.1%, 49.6~112.2%, 1.3~8.5% and 0.6~20.8%, respectively, in the other N fertilizer and biochar treatment groups. Compared to those with the N3BC0 and N3BC15 treatments, the contents of SOC, MN, AP and AK were markedly reduced with the N3BC30 treatment. Based on the results of two-way ANOVA, the soil pH and four nutrients were significantly affected (p < 0.01) by different N fertilizer or biochar treatments. The interactive effect of the N fertilizer treatments and biochar treatments on pH and AP was not significant (p > 0.05), while it had a notable effect (p < 0.01) on SOC, MN and AK.

3.2. Plant Nitrogen Contents

The total N contents in the roots, leaves, stems and grains of maize in the different N fertilizer and biochar treatment groups are shown in Table 3. The RN, LN, SN and GN were enhanced by the application of N fertilizer and increased with an increasing application rate. However, under the same N fertilizer application-rate conditions, the effects of different biochar treatments on the plant N contents were varied. At 204 kg N ha−1 (N1) and 240 kg N ha−1 (N2), compared to those with BC0, the RN, LN, SN and GN were increased by 6.2–17.8%, 3.4–15.9%, 14.1–25.0% and 9.1–18.9% with BC15 and BC30, respectively. At 276 kg N ha−1 (N3), the LN and SN in the three biochar treatment groups showed no significant differences. For RN and GN, there were no remarkable differences among BC0, BC15 and BC30. Among all N fertilizer and biochar treatment groups, the highest values of RN (4.52 mg g−1), LN (13.10 mg g−1) and SN (13.38 mg g−1) were achieved with the N3BC15 treatment, and N2BC30 resulted in the highest RN (12.64 mg g−1).

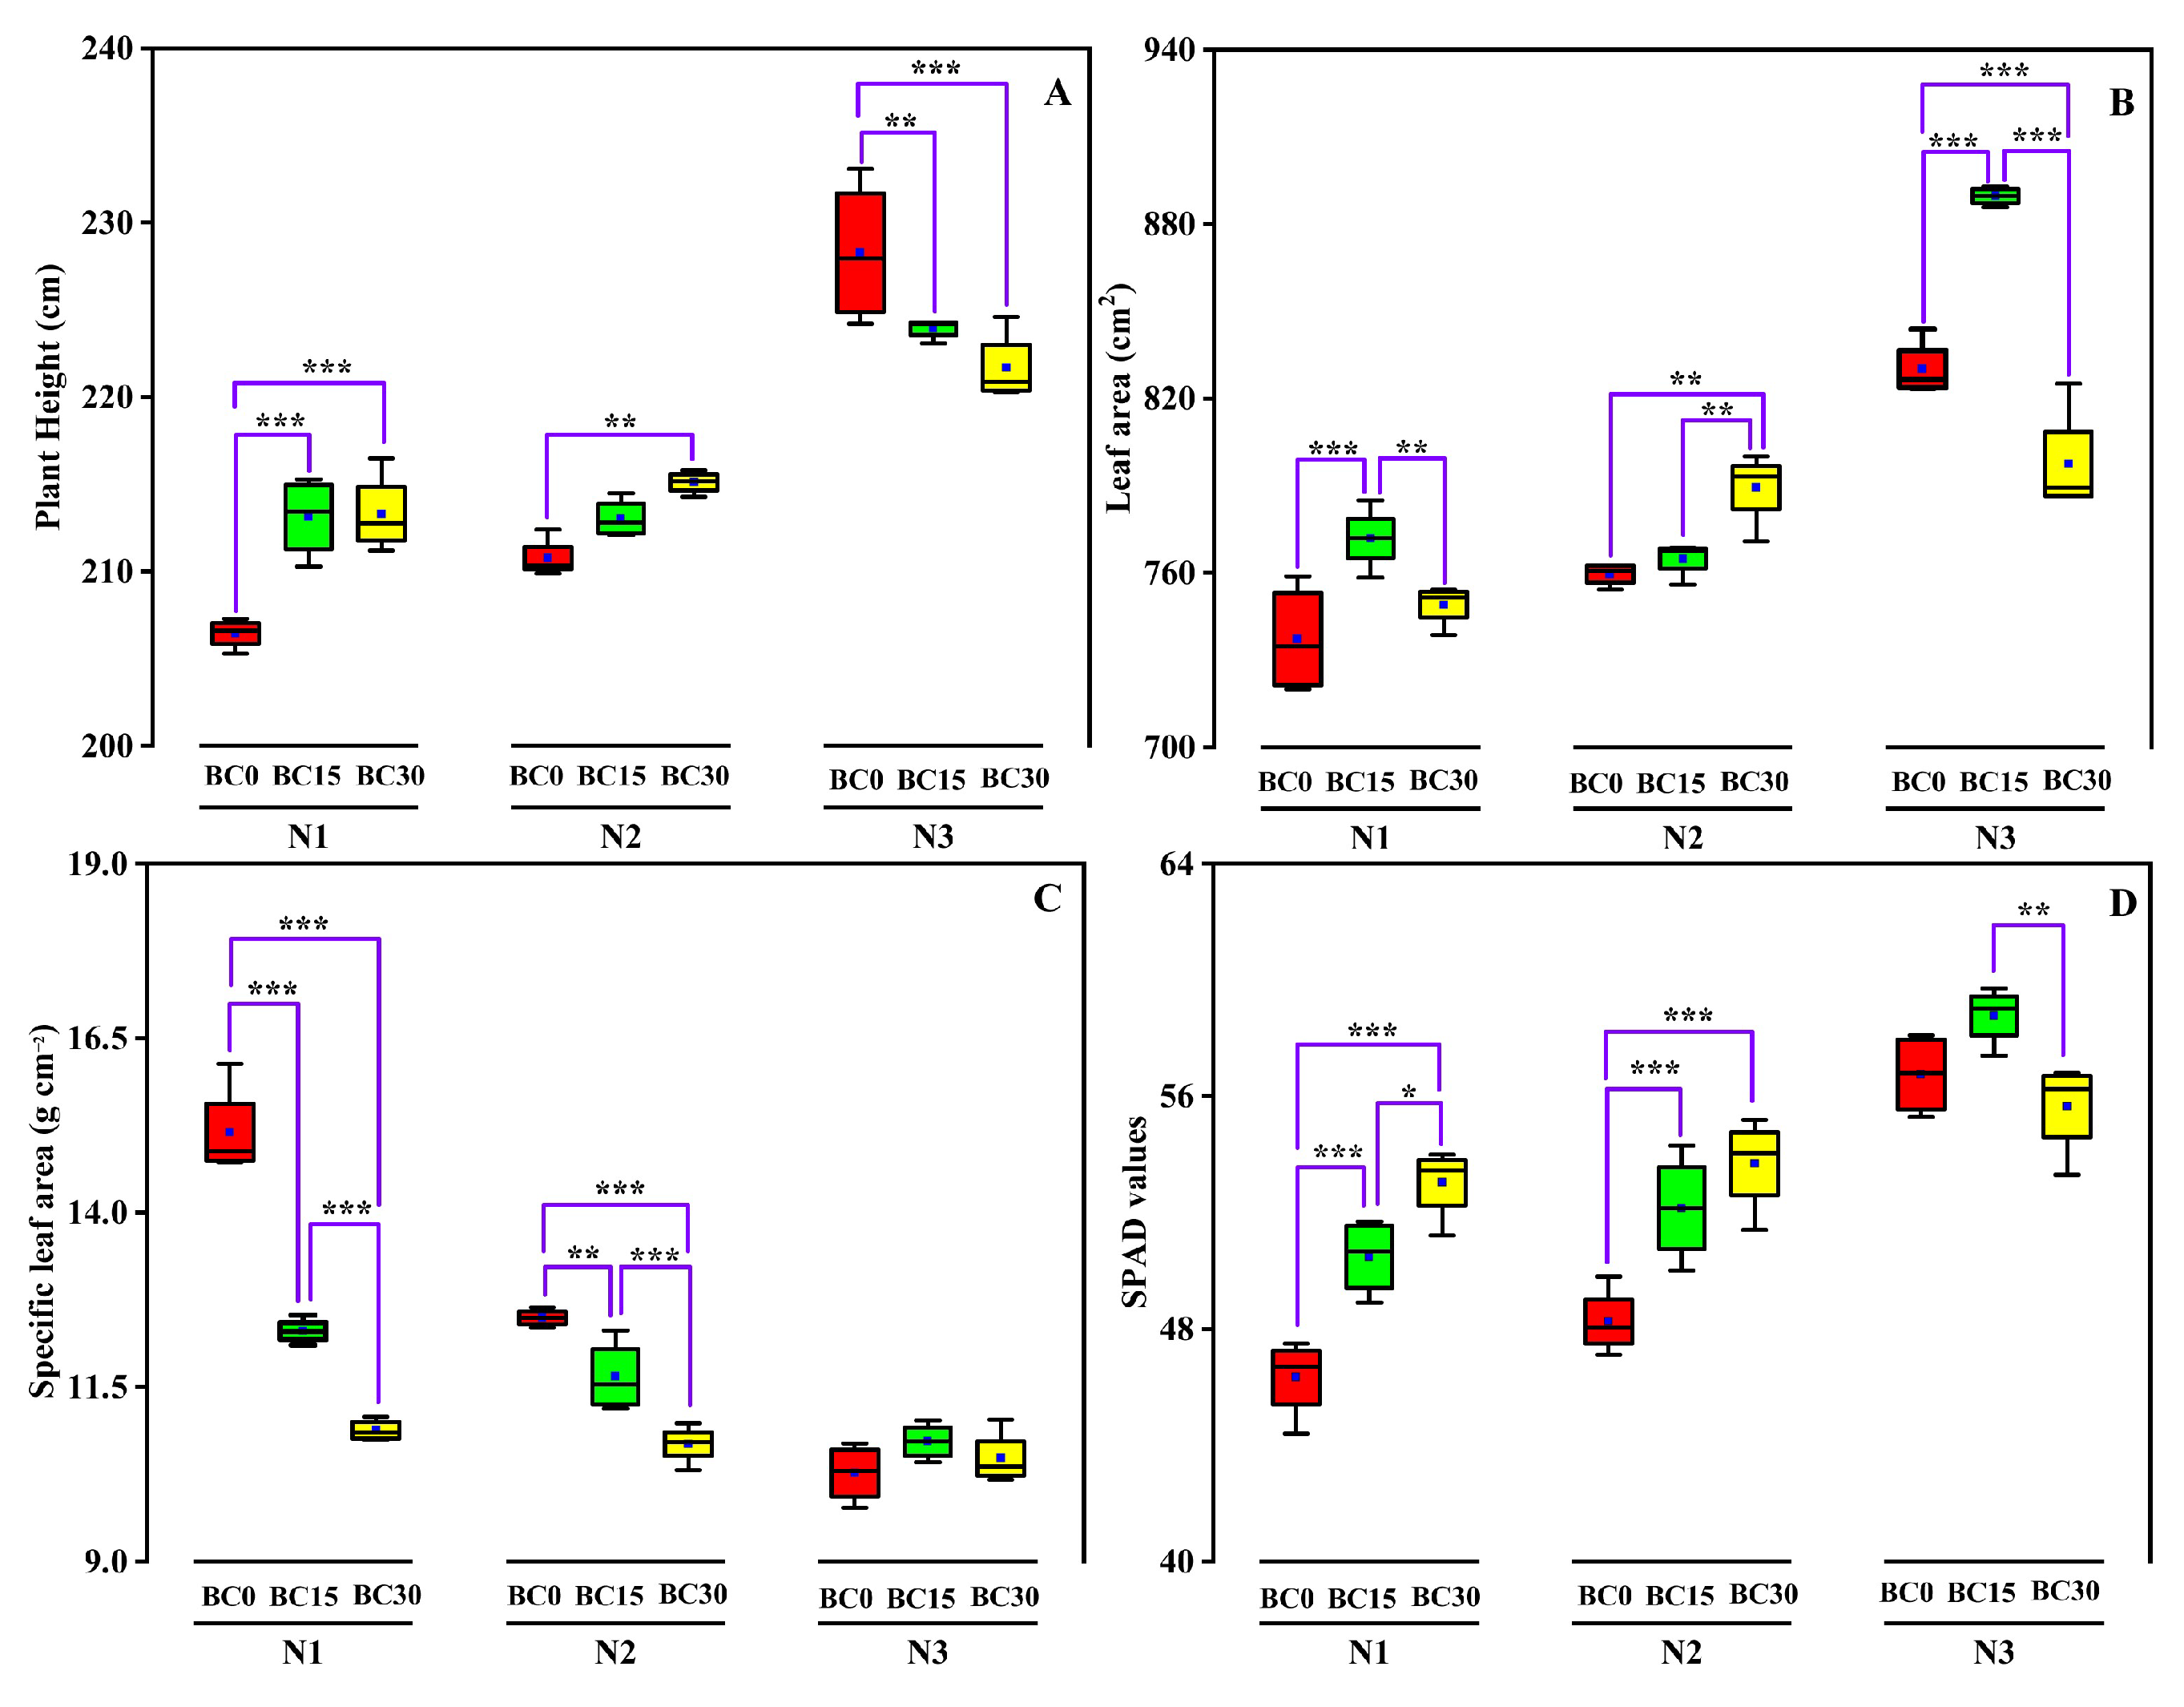
3.3. Plant Growth Parameters

The effects of combined N fertilizer and biochar on the PH, LA, SLA and SPAD of maize are presented in Figure 1. With the addition of N fertilizer, the PH, LA and SPAD increased with an increasing application rate, while SLA showed the opposite trend. At 204 kg N ha−1 (N1), compared to those with B0, the application of biochar significantly increased the PH, LA and SPAD by 3.2–3.3%, 1.6–4.7% and 9.1–14.5%, respectively, and decreased the SLA by 19.1~28.3%. At 240 kg N ha−1 (N2), the PH, LA and SPAD were increased by 1.1–2.0%, 0.7–3.9% and 7.6–10.7%, respectively, and the SLA was decreased by 7.2–14.4% with BC15 and BC30 compared to those with B0. At 276 kg N ha−1 (N3), the PH in the BC0 group was much higher than that in the BC15 and BC30 groups. For LA and SPAD, the highest values were obtained for the BC15 treatment: 889.5 cm2 and 58.8 m, respectively. For SLA, there were no remarkable differences among the different biochar treatment groups.

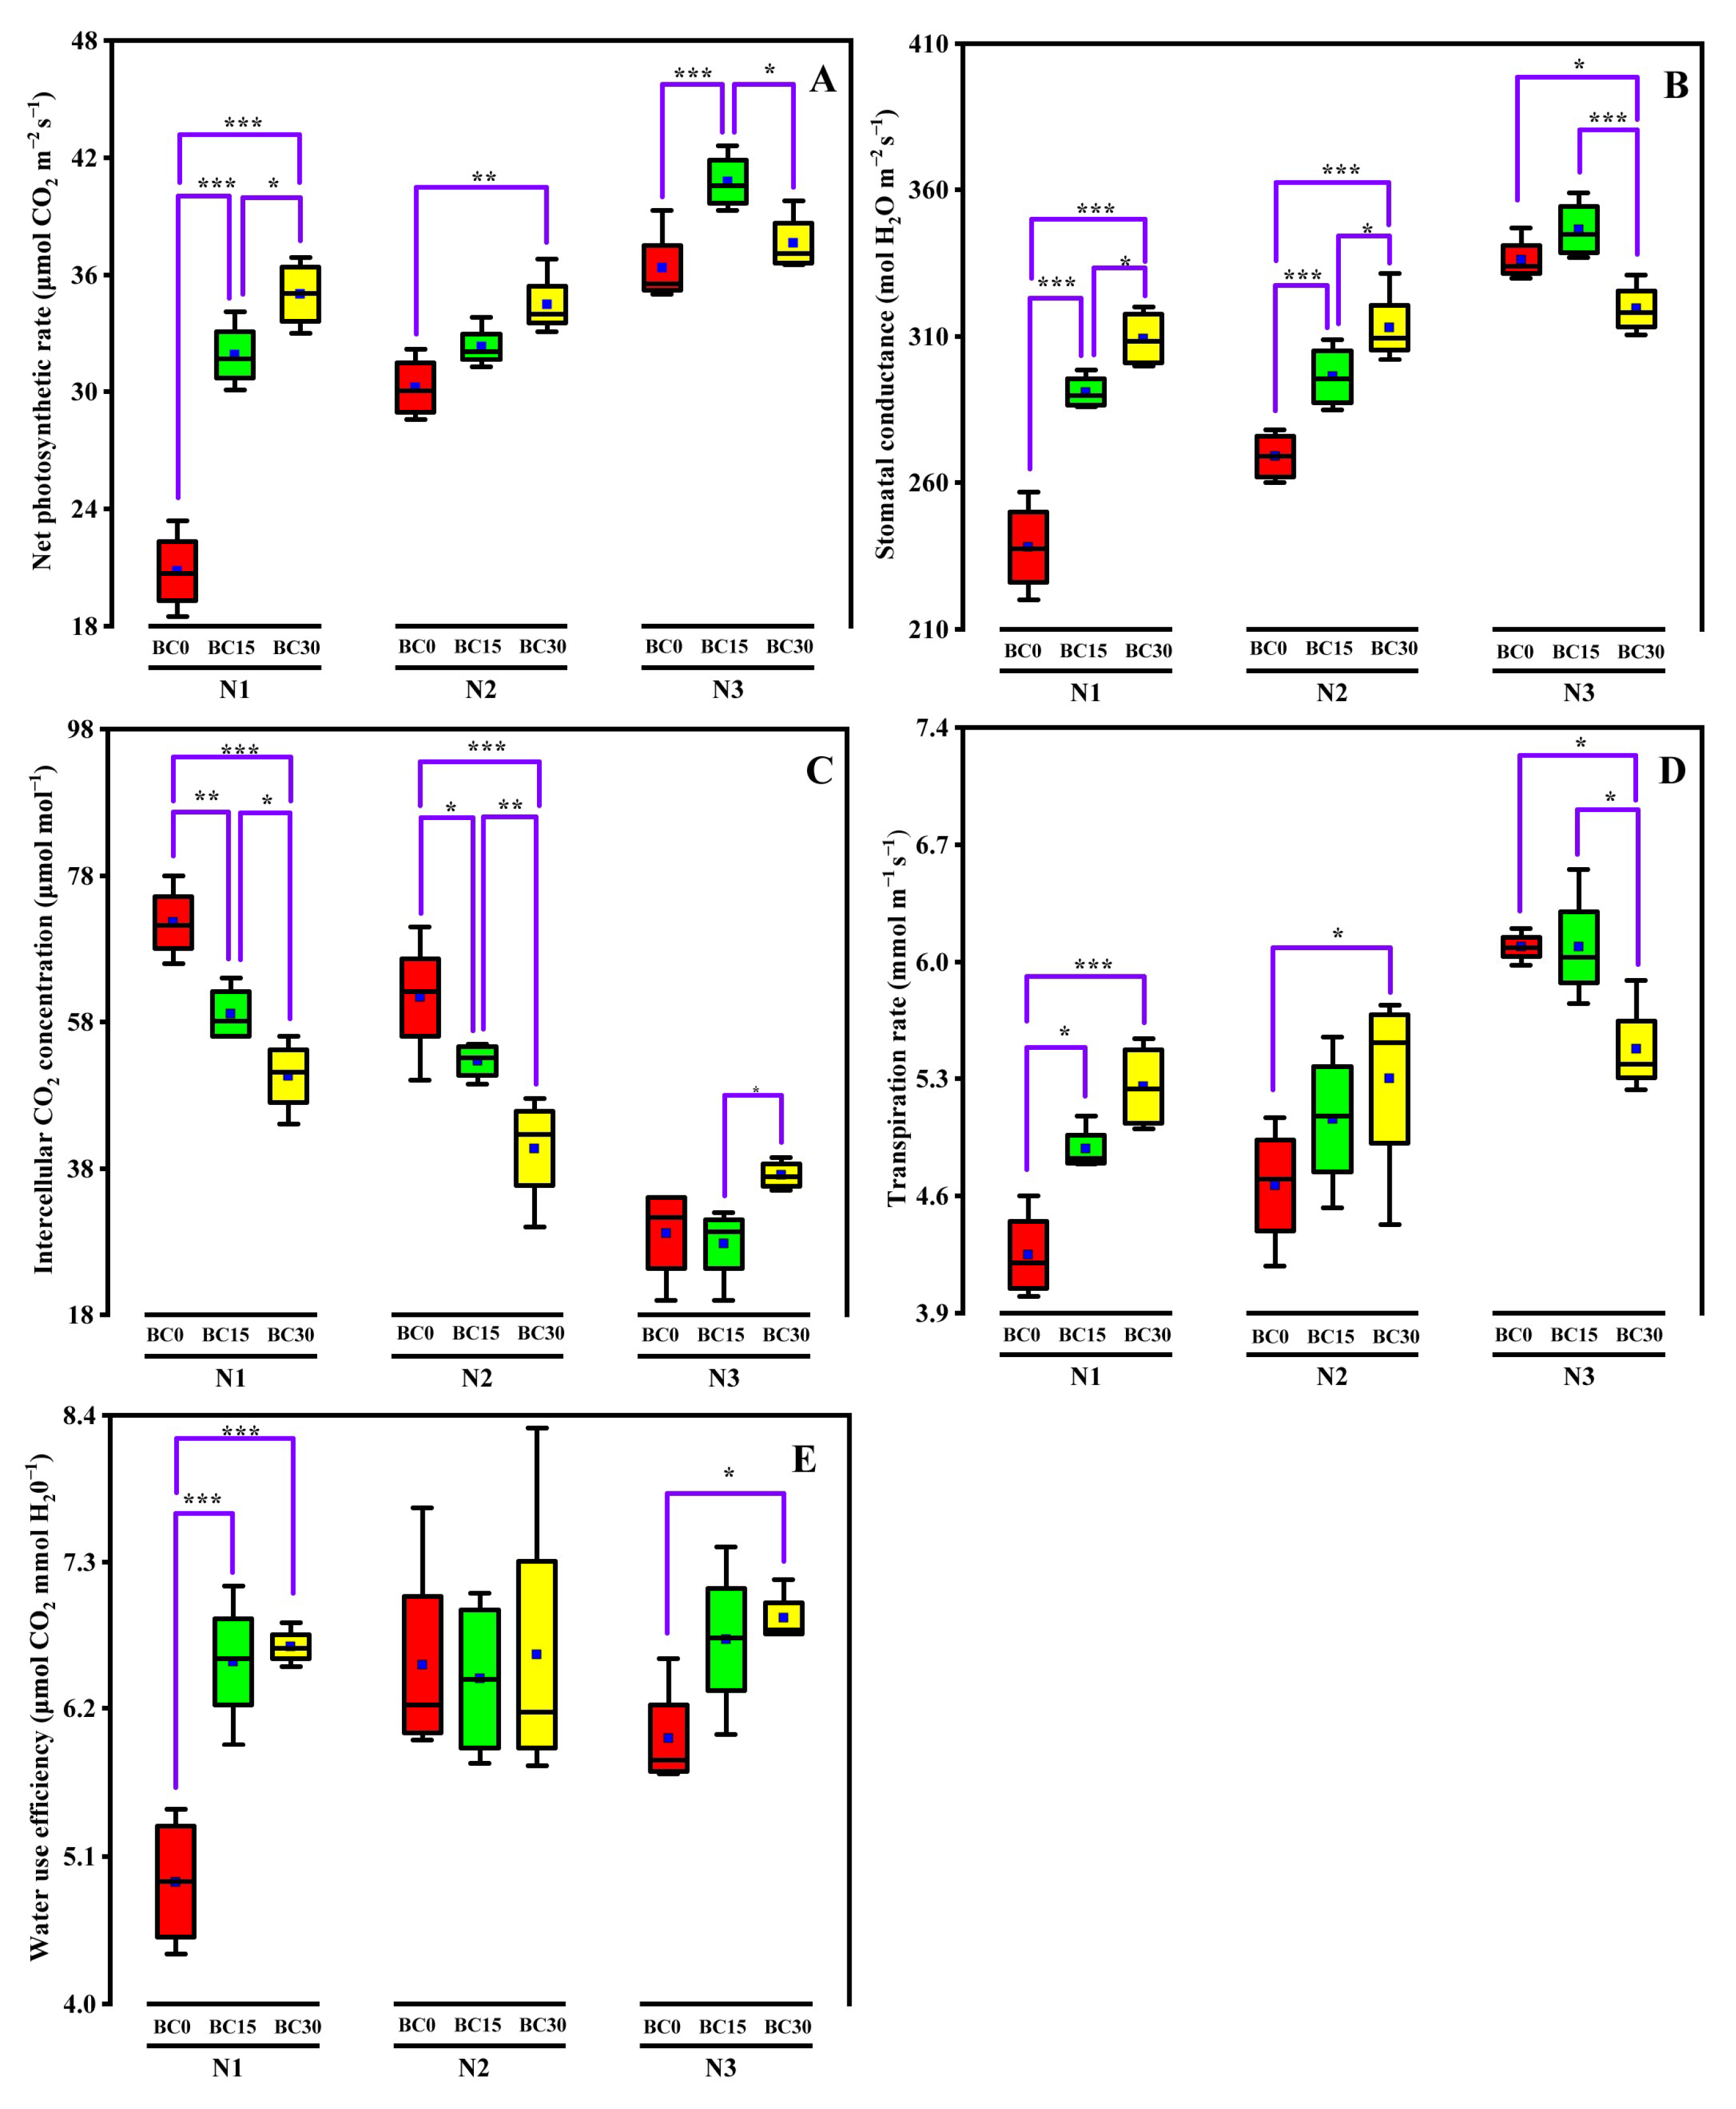
3.4. Leaf Photosynthesis

As shown in Figure 2, the changes in leaf gas exchange parameters scaled with the amount of N fertilizer and biochar addition. In the same biochar treatment groups, compared to those with N1, both N2 and N3 significantly increased the Pn, Gs and Tr and caused a reduction in Ci but had no noticeable effect on WUE. Under N1 conditions, Pn, Gs, Tr and WUE were increased by 53.4–68.3%, 22.3–30.0%, 14.0–23.3% and 32.7–36.7%, respectively, and Ci was decreased by 17.5–29.3% with BC15 and BC30 compared to those with B0. The impact of biochar addition on leaf gas exchange parameters (with the exception of WUE) under N2 conditions were similar to those under N1 conditions. Compared to those with BC0, BC15 and BC30 increased the Pn, Gs and Tr by 7.0–14.2%, 10.1–16.4% and 8.5–12.8%, respectively, and reduced Ci by 14.0–33.6%. Under N3 conditions, compared to those with BC0, soils treated with BC15 and BC30 showed an improvement in the Pn by 12.1% and 3.3% and WUE by 11.7% and 15.0%, respectively. For Gs and Tr, BC15 caused significant enhancement, while BC30 resulted in a remarkable reduction compared to that with BC0. Simultaneously, the Ci in the BC30 treatment group was much higher than that in the BC0 and BC15 treatment groups.

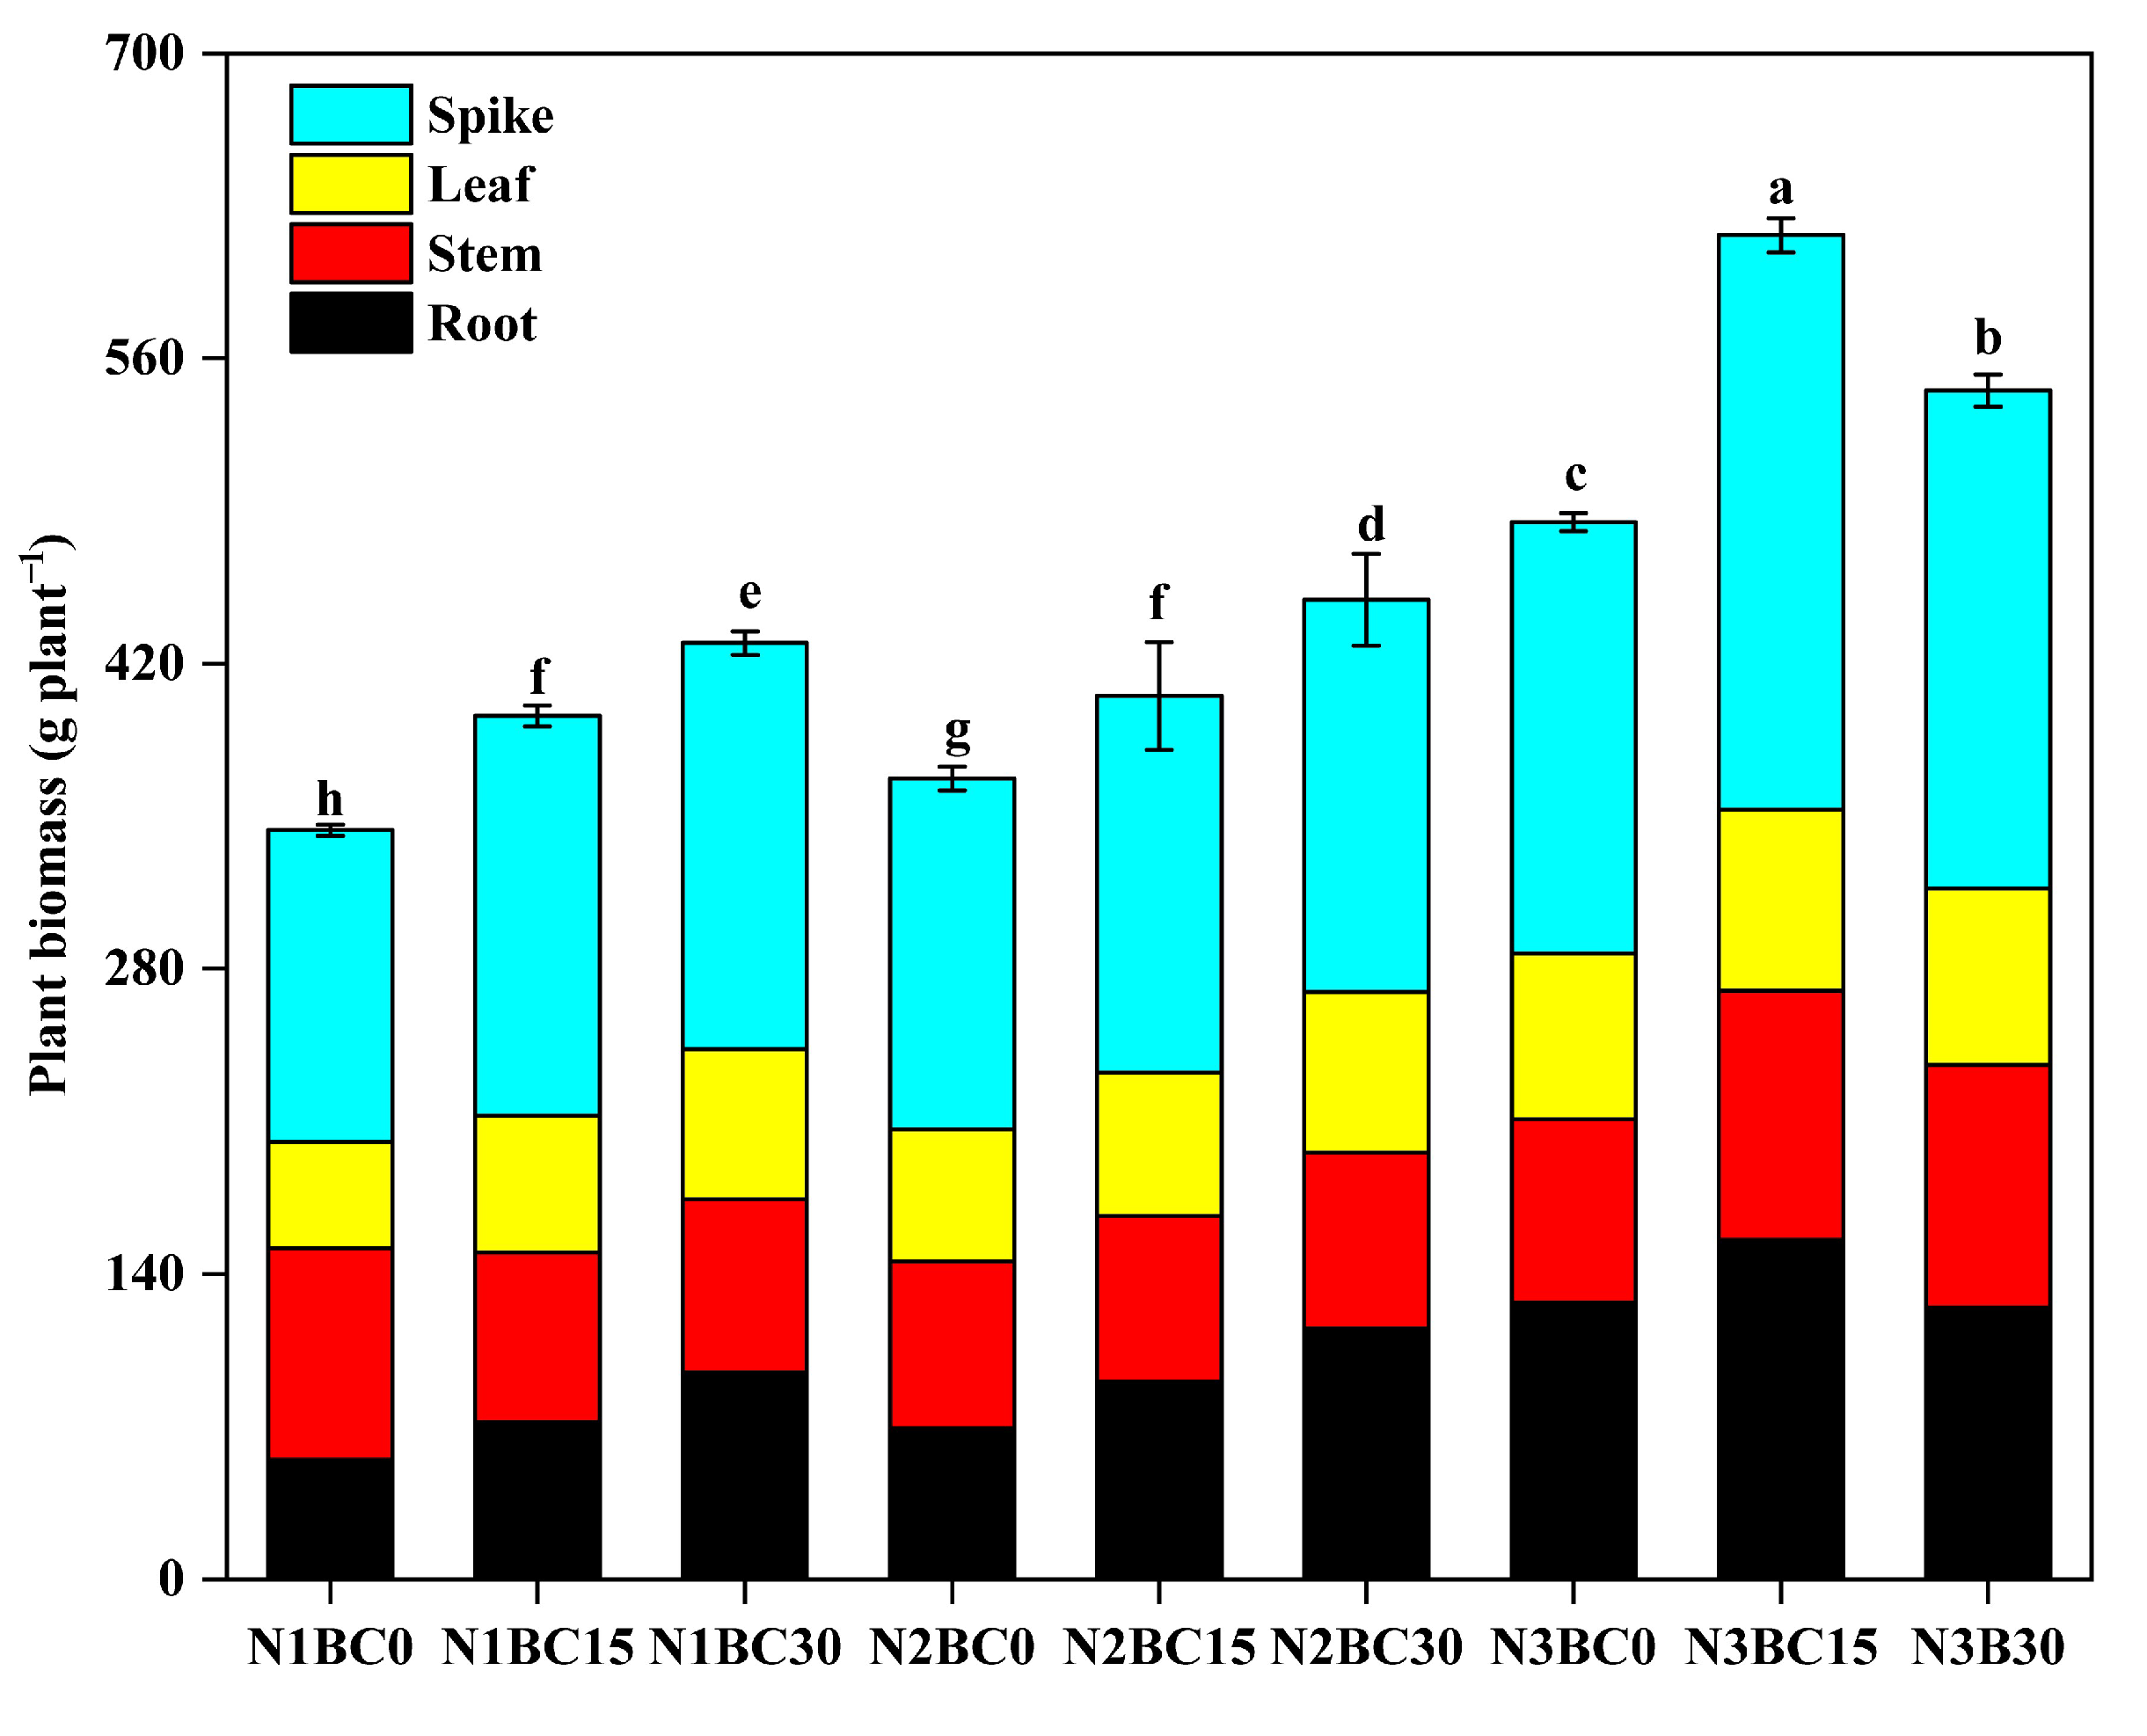
3.5. Plant Biomass and Yield of Maize

The differences in plant biomass of maize are shown in Figure 3. The DW of roots, stems, leaves and spikes was significantly affected by N fertilizer and biochar application, and a significant enhancement was observed after the addition of higher amounts of biochar at the same N fertilizer application level and with higher N fertilizer application rates under the same biochar addition conditions. Compared with that with N1BC0, the total DW of maize increased by 5.5–56.3% with the other combined N fertilizer and biochar treatments. In addition, the highest value (616.42 g plant−1) of plant total DW was obtained with the N3BC15 treatment.
Changes in grains per ear, 100-grain weight and grain yields of maize with different N fertilizer and biochar treatments are shown in Table 4. Different N fertilizers and biochar treatments significantly affected the grains per ear and grain yields but had no remarkable effect on the 100-grain weight. The grains per ear and grain yields of maize were enhanced by the application of N fertilizer and increased with an increasing application rate. The grains per ear and grain yield increased by 1.3% and 1.2% with the N1BC15 treatment compared with 5.6% and 7.4%, respectively, with the N1BC0 treatment. At an N fertilizer application rate of 240 kg N ha−1 (N2), compared to those in the treatment group without biochar application, the grains per ear increased by 6.6–10.4%, and the grain yield increased by 7.3–13.6% after the application of 15–30 t ha−1 biochar. At an N fertilizer application rate of 276 kg N ha−1 (N3), the addition of biochar had no effect on maize production. The grains per ear, 100-grain weight and grain yields were not significantly different among the N3BC0, N3BC15 and N3BC30 treatment groups.

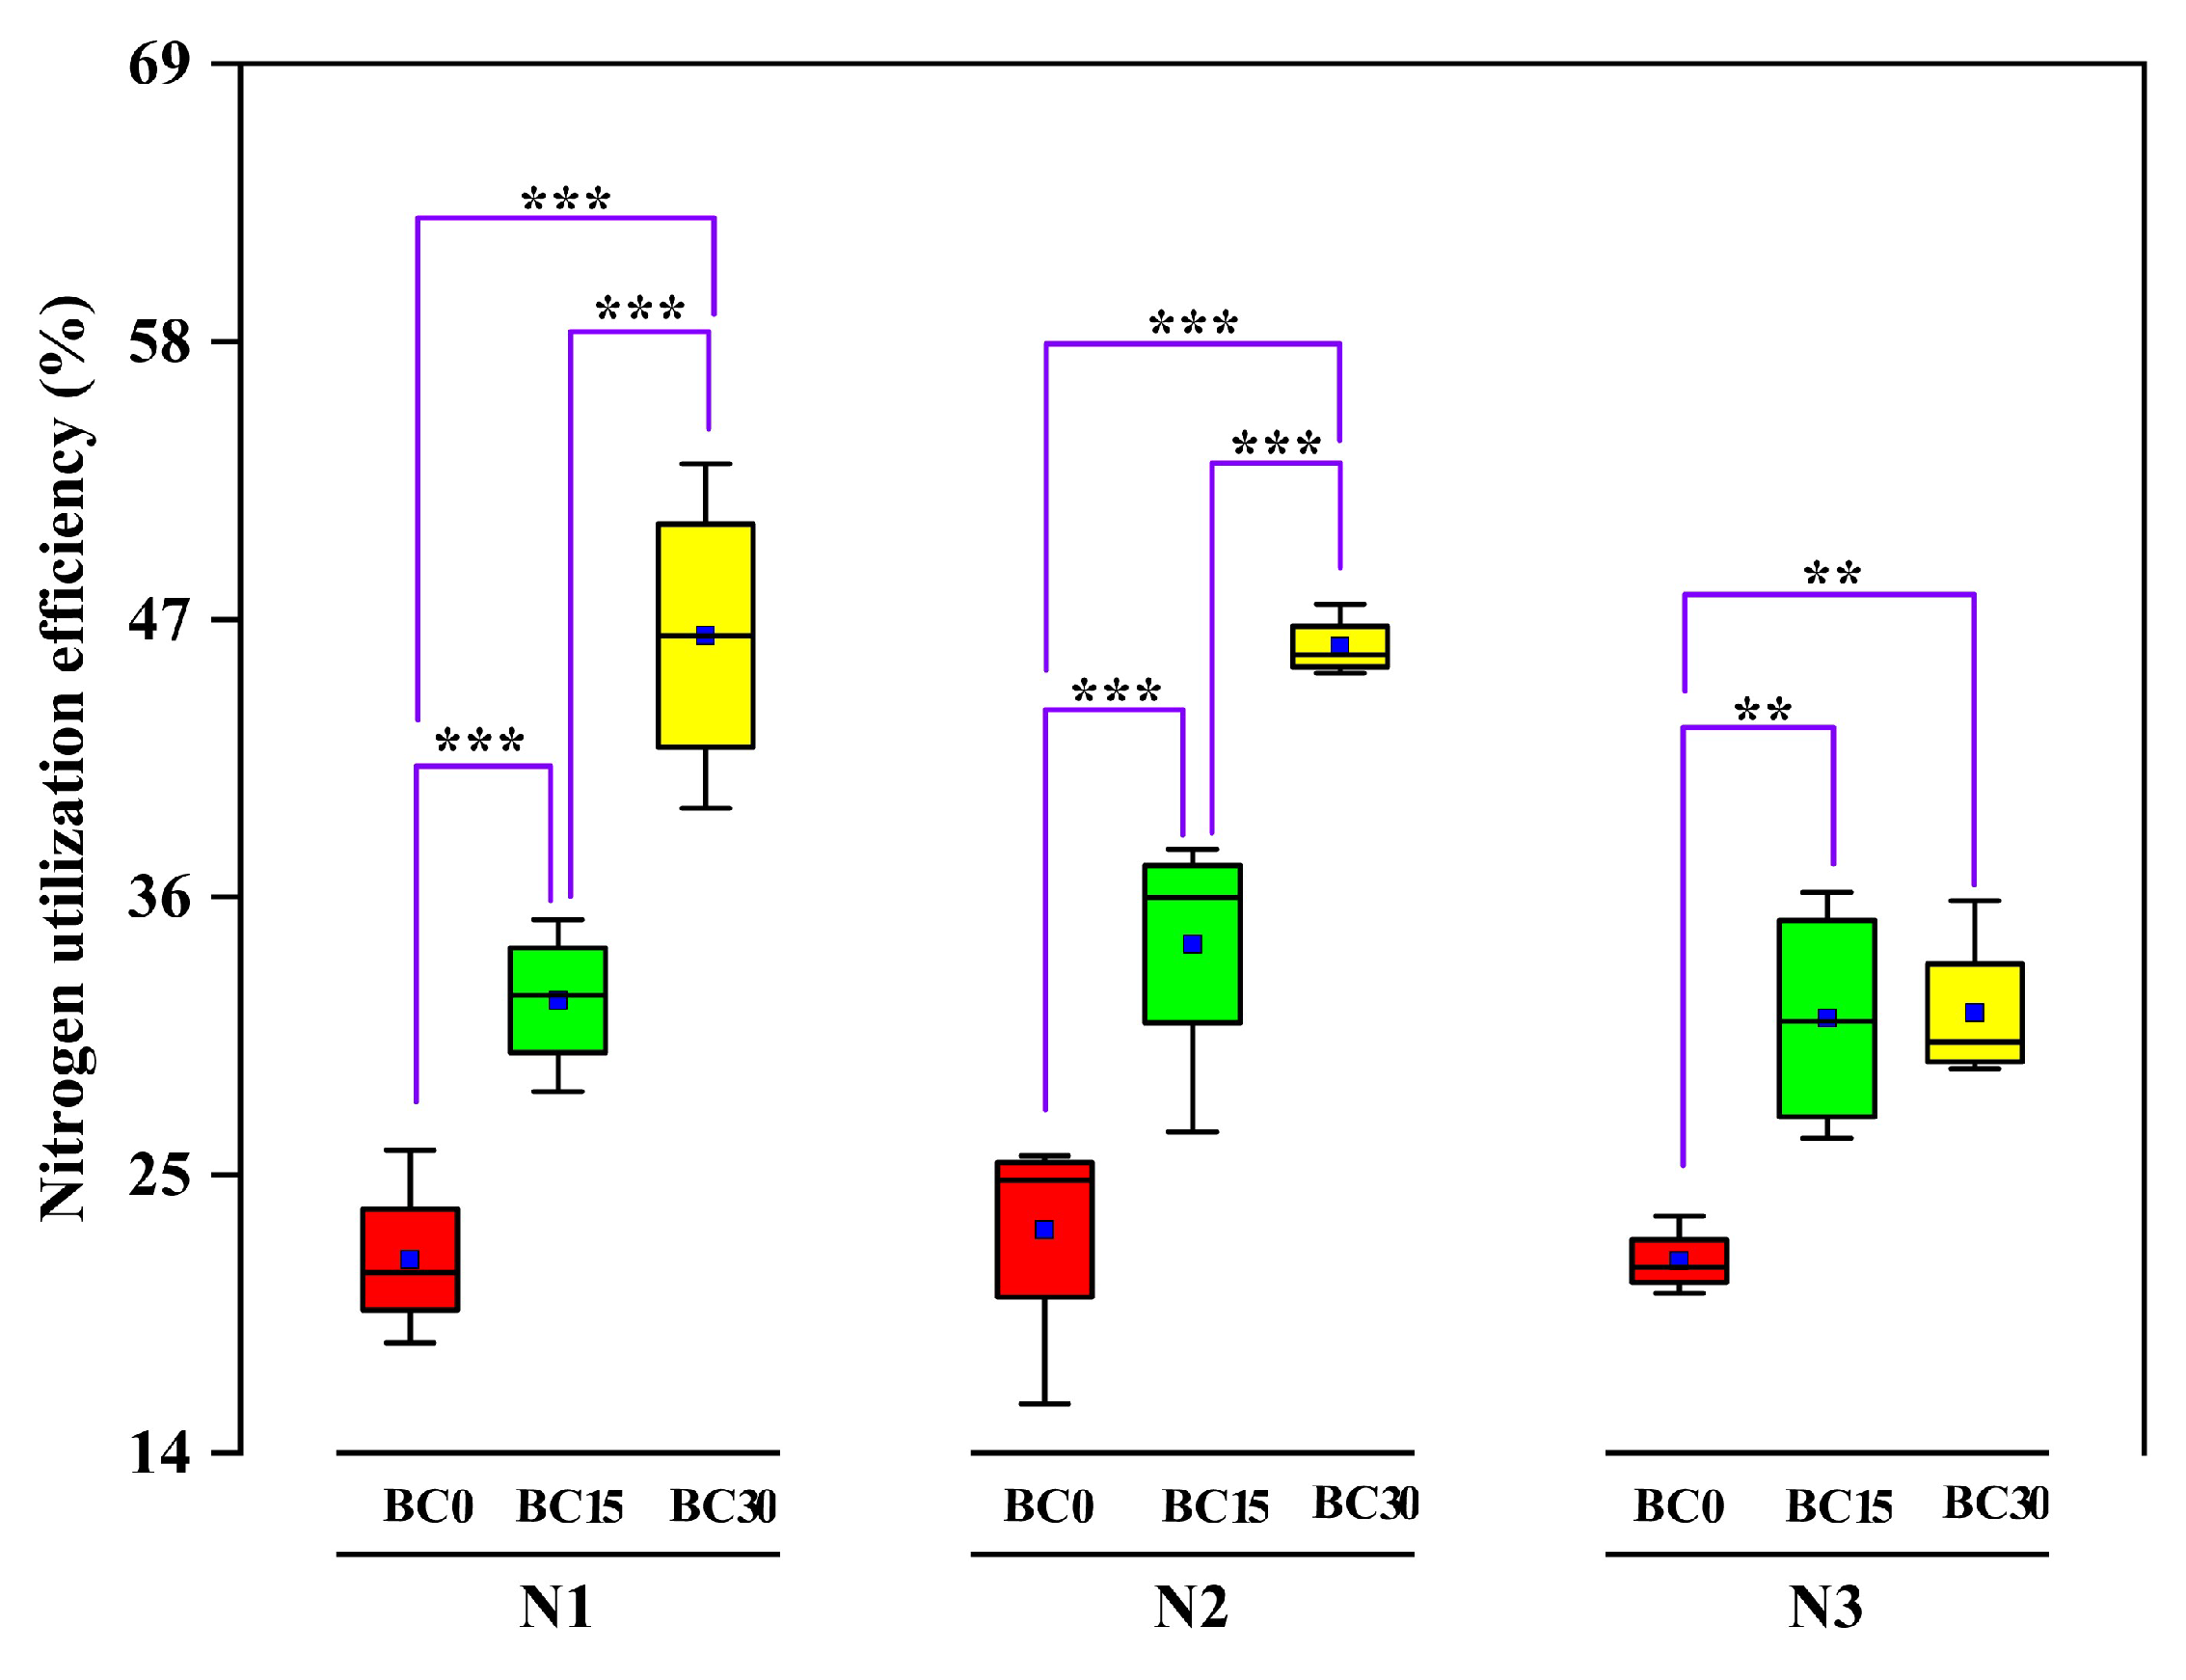
3.6. Nitrogen Utilization Efficiency

The NUE of maize with different treatments was calculated; the results are shown in Figure 4. In soils treated with 0 t ha−1 (BC0) and 15 t ha−1 (BC15) biochar, NUE with different N fertilizer treatments showed no significant differences. When the biochar application rate was 30 t ha−1 (BC30), NUE with the N3 treatment was lower than that in the N1 and N2 treatments. A significant enhancement of NUE was observed after the addition of higher amounts of biochar at the same N fertilizer application level. Under the three N fertilizer conditions, compared to that with B0, NUE increased 9.6–11.3% with BC15 and 9.8–24.7% with BC30.

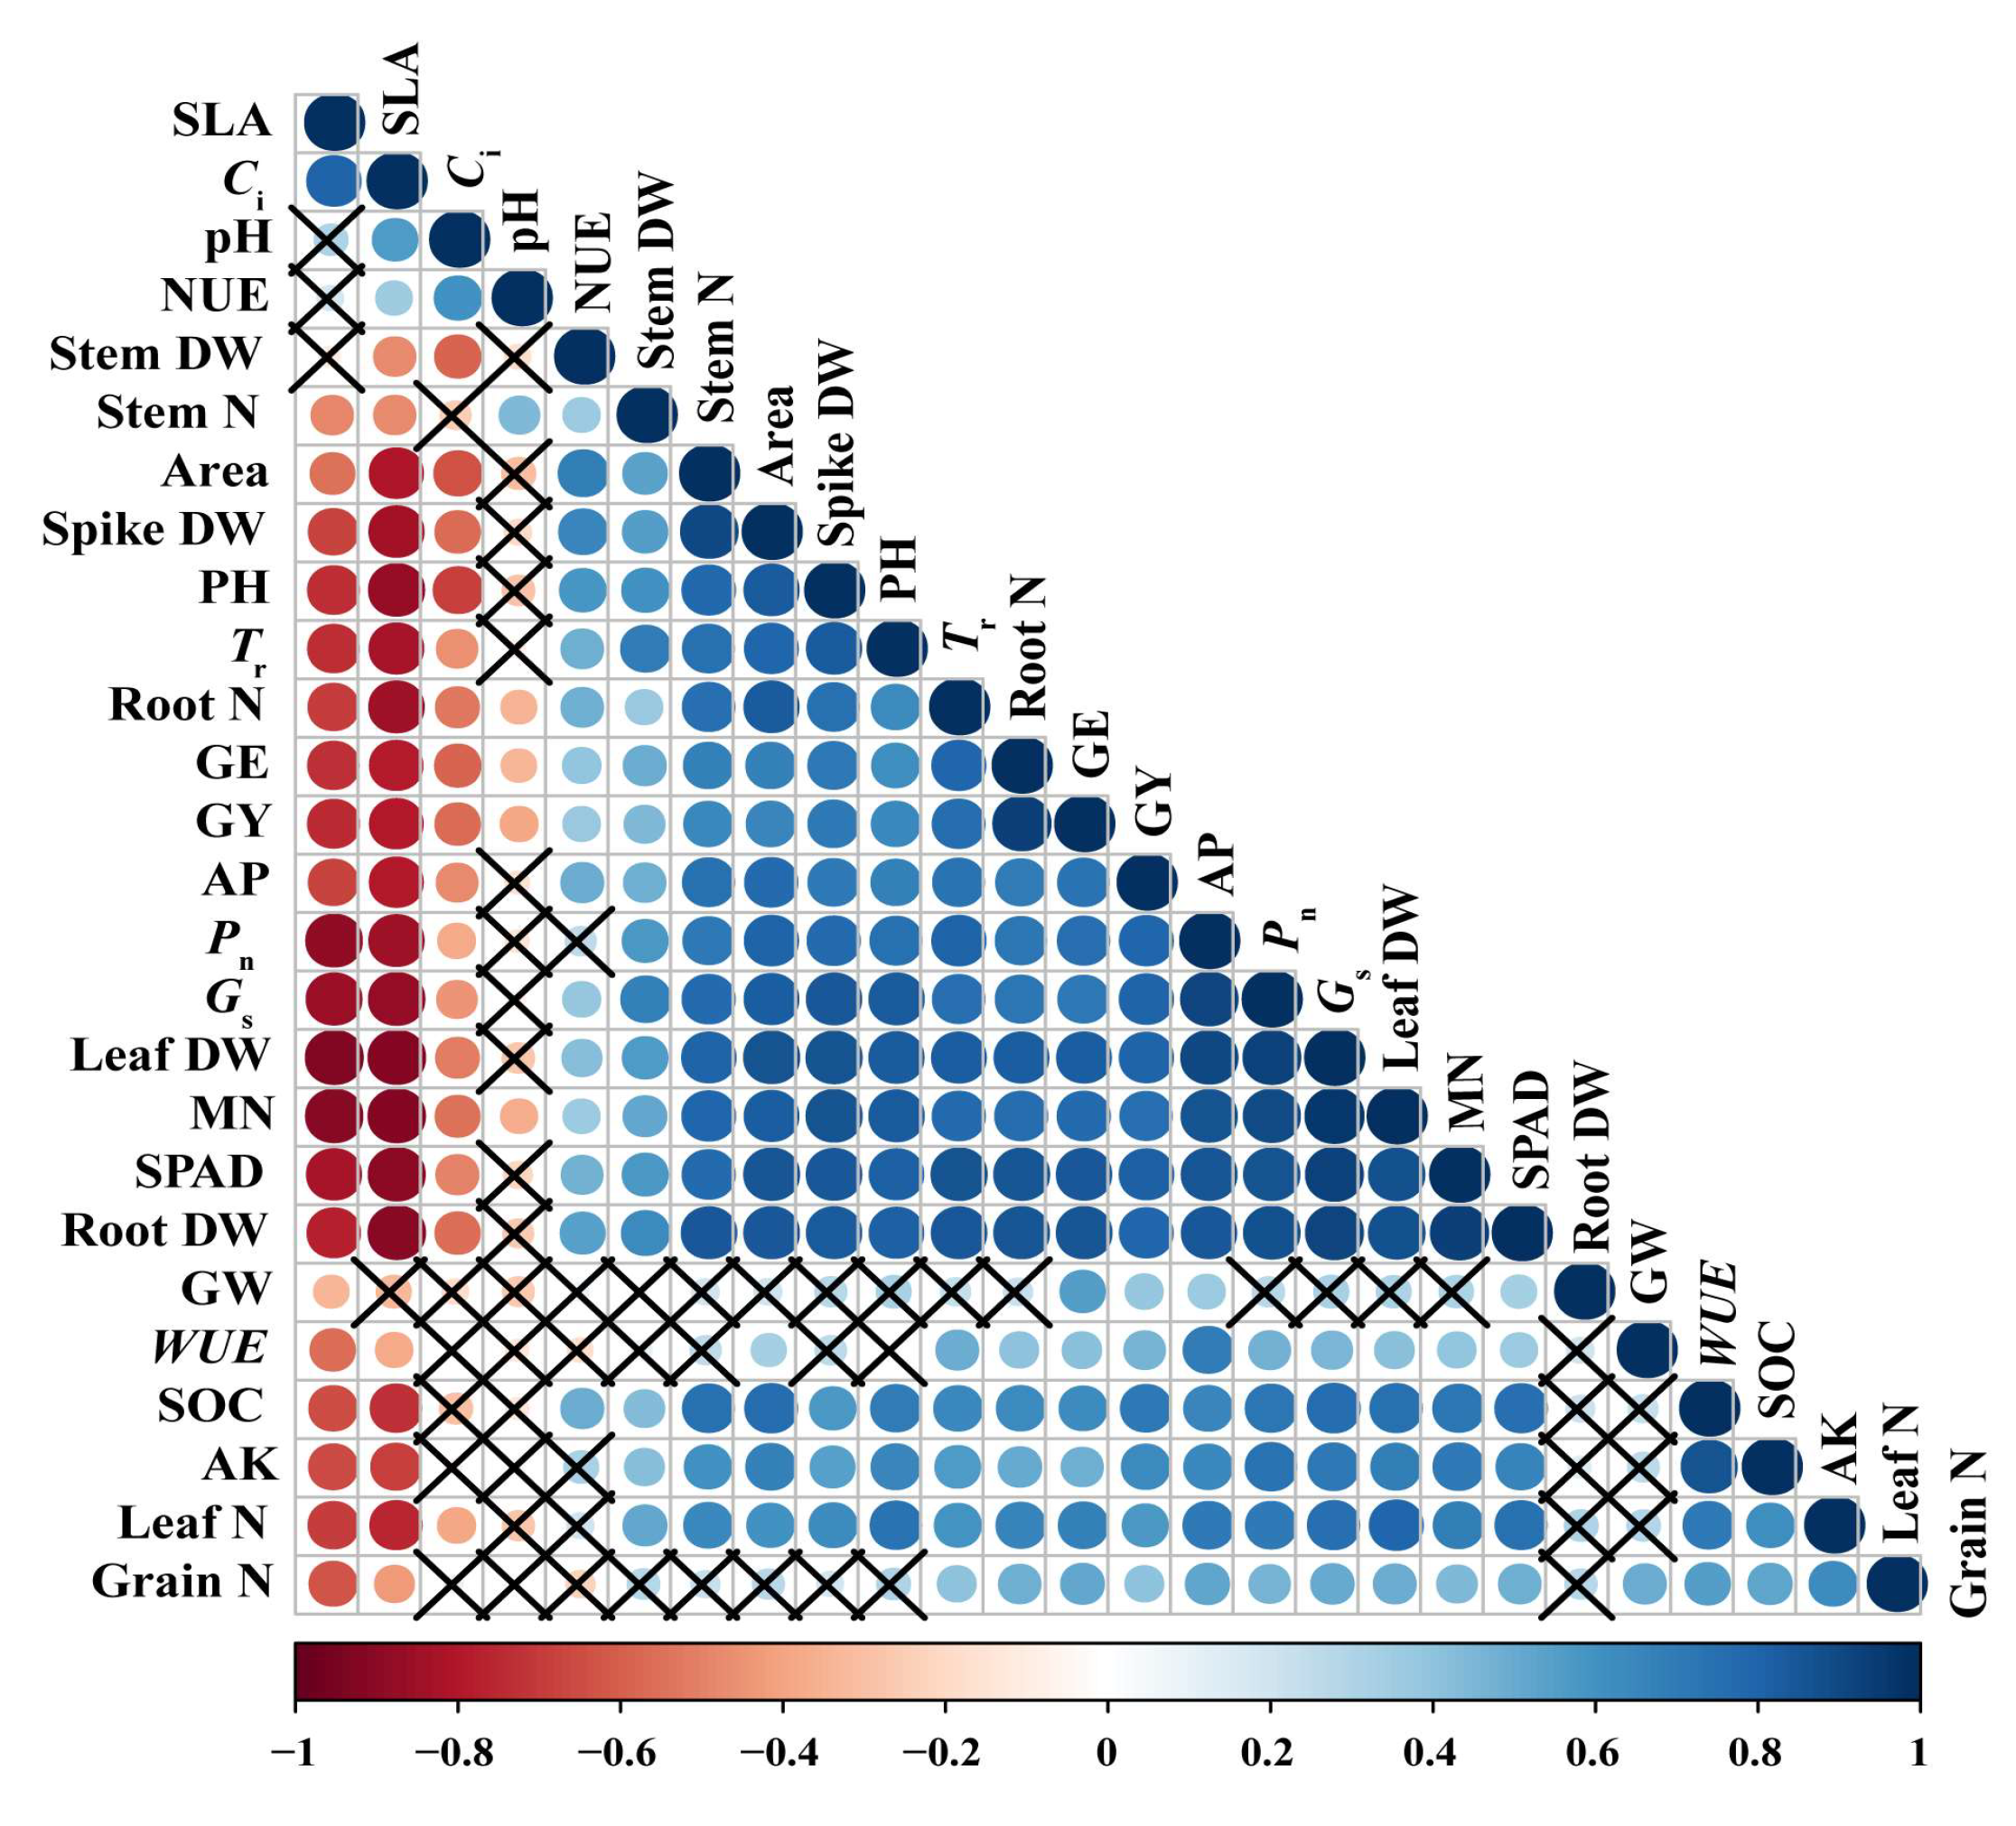
3.7. Correlation between Plant Parameters and Soil Chemical Properties

A heatmap was built to reflect the relationships between plant parameters and soil chemical properties. As illustrated in Figure 5, the soil chemical properties, including pH, SOC, MN, AP and AK, had significant relationships (p < 0.05) with most of the plant parameters. Furthermore, in addition to pH, SLA and Ci, the other parameters showed positive interrelationships. The N contents in the roots, leaves, stems and spikes of maize were found to be highly and positively related to MN. The grain yield was negatively related to SLA and Ci and positively correlated with the grains per ear, Pn, Gs, Tr and leaf N content.

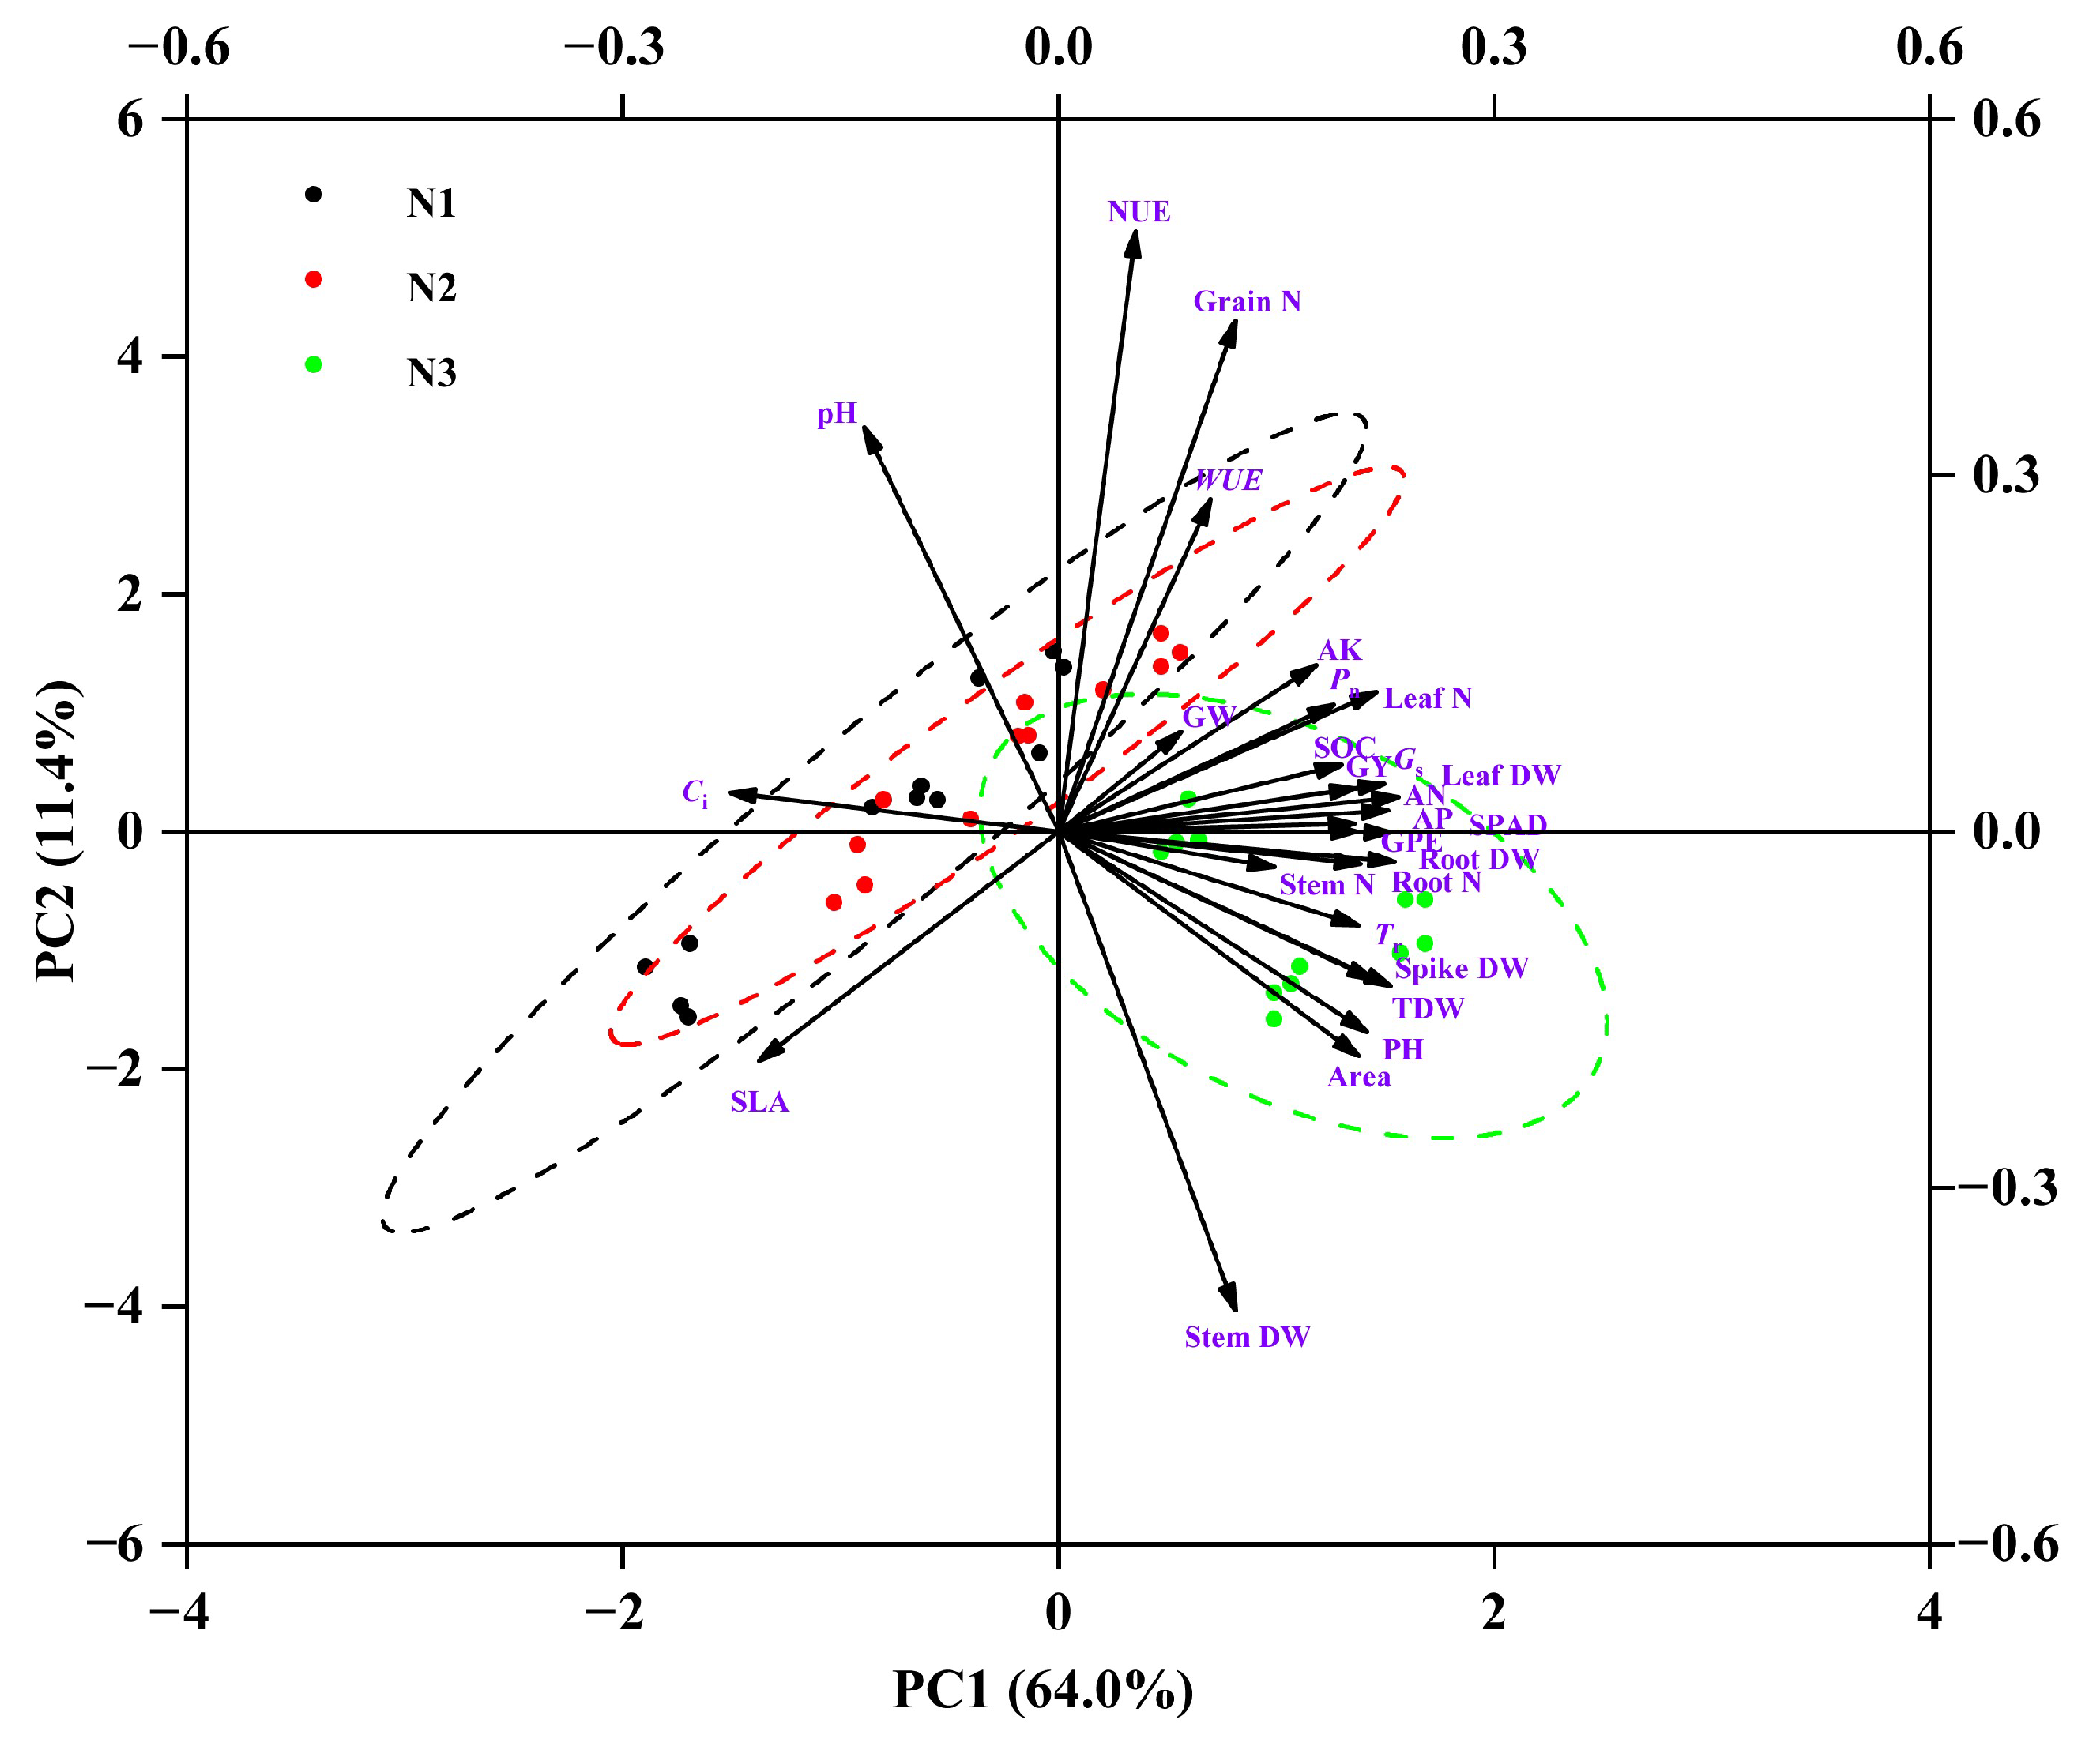
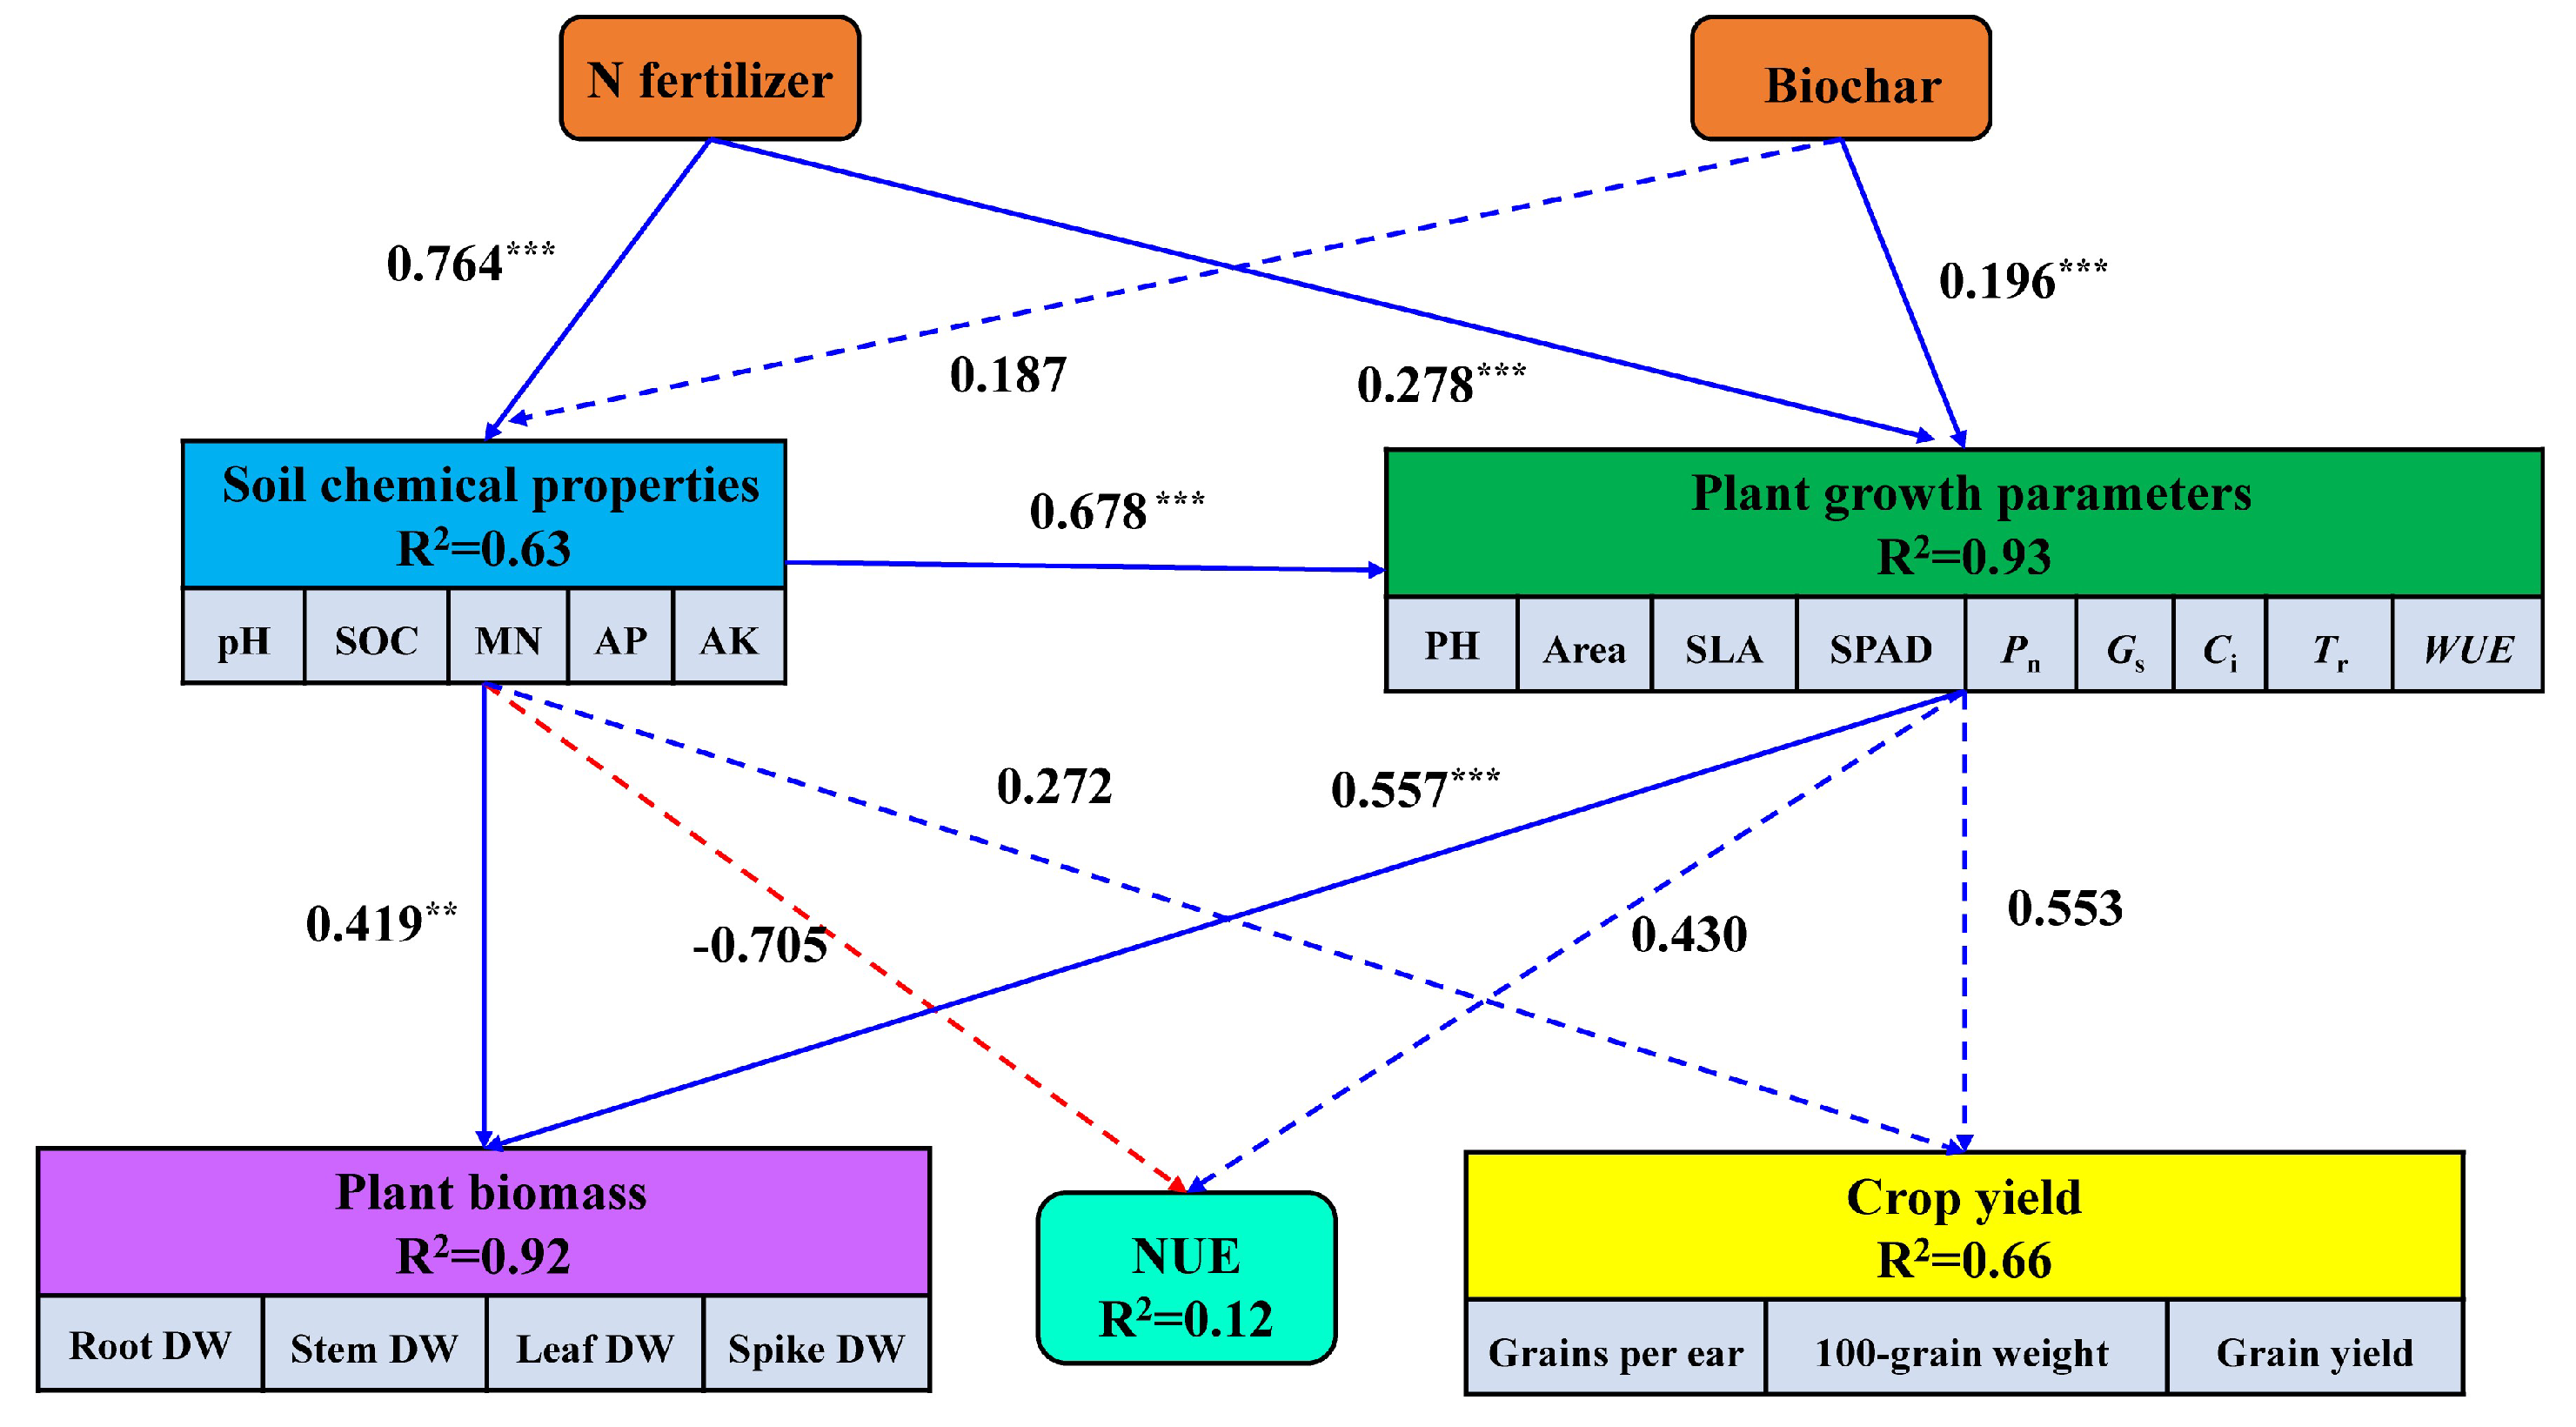
3.8. Principal Component Analysis and Structural Equation Modeling Analysis

A PCA approach was employed to detect the variations in plant parameters and soil chemical properties among different N fertilizer and biochar treatment groups. As shown in Figure 6 and Figure S4, two principal components (PCs) that accounted for 75.4% of the total variance were extracted from the original datasets. Most of the variables were positioned in PC1, suggesting that it contained more useful information than the other PCs. According to the biplot, with the exception of Ci, pH and SLA, which fell along the negative axis of PC1, the other 24 parameters were weighted on the positive axis. Additionally, the clustering of plant and soil samples with different N fertilizer treatments showed no significant differences between the N1 treatment and the N2 treatment groups, while the N3 treatment groups were clearly separated.
SEM is a useful approach to predict the potential effects of soil chemical properties and plant growth parameters on plant biomass, crop yield and N of maize among all treatment groups. The SEM results showed that the plant growth parameters were directly affected by both N fertilizer and biochar application, while the soil chemical properties were directly affected by the addition of N fertilizer but indirectly influenced by biochar (Figure 7). The soil chemical properties and plant growth parameters notably influenced the plant biomass of maize, and the path coefficients were 0.419 and 0.557, respectively. There were no direct effects of soil chemical properties and plant parameters on NUE and crop yields of maize, and only 12% of NUE and 66% of the crop yield were explained. Furthermore, soil chemical properties exhibited a significant and positive effect on plant growth parameters (path coefficient = 0.678), suggesting the promoting effect of soil quality on plant growth.

4. Discussion

4.1. Soil Chemical Properties

The chemical properties of soil, especially nutrient contents, are the basis of soil fertility, which not only reflects soil quality but also has a direct effect on crop growth and production [48]. The results of the present study confirm the effectiveness of combined N fertilizer and biochar in improving soil chemical properties (Table 2), which is consistent with the research of Ullah et al. [49]. In soils without biochar addition, an increased N fertilizer application rate induced a noticeable reduction in soil pH, consistent with the findings of Song et al. [50] and Dong et al. [51]. In the case of N fertilizer application, the soil pH is increased with biochar addition, suggesting that biochar is a liming material in neutralizing the released protons [52] owing to its alkaline nature and high buffering capacity for soil pH. Relative to those with treatment with only N fertilizer or biochar, their combined application improved not only MN but also SOC AP, and AP. Similar results were obtained in studies by Song et al. [53] and Wu et al. [54], who reported that combined N fertilizer and biochar caused higher levels of SOC, total, and AK than N fertilizer or biochar applied alone. The significant enhancement of soil nutrients could be attributed to a soil-conditioning effect on microbe and plant growth [29], the strong adsorption and ion exchange capacity of biochar [37], increased activities of soil enzymes associated with C, N, P and K cycling [55] and abundant nutrients supplied by biochar and N fertilizer [54].

4.2. Nitrogen Absorption

In our study, the total N contents in the roots, leaves, stems and grains of maize were increased due to the combination of N fertilizer and biochar compared to those with either N fertilizer or biochar alone (Table 3), which is in agreement with the studies of Ibrahim et al. [56] and Xia et al. [6]. These results suggested that N fertilizer combined with biochar promotes plant N adsorption and assimilation and could effectively serve as an N-releaser for providing adequate substrates during plant growth [49]. The enhancement of plant N contents was attributed to biochar amendment increasing N availability to plants [35] and providing suitable conditions for root growth by improving soil physicochemical properties, such as water-holding ability and bulk density [57]. Subsequently, more available N from indigenous soil and N fertilizer is assimilated by the well-developed root system and transported to the plant shoot [58]. However, biochar application is not always beneficial for plant N uptake. For example, the urea–N uptake of maize from the silking stage to the physiological maturity stage is seriously inhibited by the application of biochar, resulting in a low plant N content [59]. Similar results were also obtained in the studies of Zhang at al., who reported that wheat straw biochar caused a significant decrease in the N content in the grain, straw and root of rice [15]. The reduction in plant N content may be attributed to the adsorption and immobilization of soil N mediated by biochar, resulting in a reduction in soil available N for plant root uptake [60].

4.3. Plant Growth of Maize

The increased soil nutrients and plant N content promoted maize growth and dry matter accumulation, resulting in a greater amount of biomass in N fertilizer-applied soils amended with biochar than in the corresponding N fertilizer-only treatment groups (Figure 3). Similar results were also reported in several previous studies. For example, 1% biochar application increased the belowground biomass of maize by 7.0–14.6% compared to that with only N fertilizer treatment [59]. Xia et al. also found that peanut shell biochar significantly increased the root biomass and shoot biomass of maize by 44.5% and 89.6%, respectively, under urea–N fertilizer (0.2 g kg−1) application conditions [22]. These results suggested that a more beneficial effect on improving plant biomass was activated with the use of N fertilizer combined with biochar. PH and LA are two of the most widely employed physiological parameters reflecting the status of plant growth. In the present study, increased application rates of N fertilizer and biochar significantly enhanced PH and LA (Figure 1A,B), indicating their beneficial effects on plant growth. SLA is an important leaf morphological and functional trait for estimating the responses of plants to environmental changes [61]. In this study, we discovered that maize SLA was decreased by increasing the application of N fertilizer and biochar (Figure 1C), indicating that large amounts of organic substances accumulated and higher dry mass was acquired in the leaves of maize. The close relationship between PH and stem N content and the high correlation of LA and SLA with leaf N content (Figure 5) may explain the changes in PH, LA and SLA with different N fertilizer and biochar treatments.
Leaf N content, which is highly related to chloroplast activity and chlorophyll production, has vital roles in leaf photosynthesis and grain filling [45]. It has been reported that 57% of leaf N is contained in the chloroplasts and utilized to synthesize photosynthetic components and allied enzymes [36]. Adequate N supply for plant leaves would promote the biosynthesis of leaf pigments, retard leaf senescence and increase plant photosynthetic efficiency, resulting in high biomass production and grain yields [62]. The increased soil N availability and N content in maize leaves caused by N fertilizer and biochar application are expected to result in a higher leaf chlorophyll content and photosynthetic rate [63]. In the current study, the leaf SPAD and Pn were enhanced by the addition of N fertilizer and biochar, which was consistent with studies conducted on rice [49], Brassica juncea L. [64], and wheat [65]. The other gas exchange parameters, such as Gs and Tr, exhibited similar changes with Pn, while Ci showed the opposite result (Figure 2). The increase in Gs and Tr may be attributed to the application of biochar enhancing the soil water-holding capacity to provide more water for the leaves [66]. WUE exhibited no remarkable changes with different N fertilizer and biochar treatments (Figure 2E), as the changes in Pn and Tr followed the same pattern and the ratio of Pn and Tr had a relatively constant value. Furthermore, the positive relationship between Gs and Pn and the negative correlation between Tr and Pn (Figure 2 and Figure 5) indicated that nonstomatal limitations other than stomatal limitations have dominant roles in regulating the photosynthetic metabolism of maize [67]. Similar conclusions have also been reached in studies by Song et al. [62]. Overall, these results suggest that N fertilizer supplied adequate N for maintaining a high photosynthetic efficiency, and the beneficial effects were strengthened with the application of biochar, through activation of the availability of soil nutrients, an increase in leaf N absorption, the promotion of chlorophyll synthesis and enhancing water evaporation in leaves.

4.4. Maize Yield and Nitrogen Utilization Efficiency

Our results showed that the maize grain yield increased with increasing amounts of N fertilizer applied to biochar-amended soils (Table 4), which was in agreement with studies on Chinese cabbage [68], rice [69] and wheat [51]. The grains per ear and 100-grain weight are two basic parameters used to calculate the maize gain yield. In our present study, the grains per ear were significantly affected by the application of N fertilizer and biochar, while the 100-grain weight showed no differences with different treatments. The results suggested that the grain numbers had a dominant role in determining the maize grain yield. Based on the two-way ANOVA, both grains per ear and grain yield were significantly influenced by biochar (p < 0.01), while N fertilizer alone and the interaction between N fertilizer and biochar had no significant effect on them (p > 0.05). The results of variance analysis showed that biochar had a more important role in improving the maize grain yield at different N application levels. The beneficial effects of biochar on enhancing crop production are attributed to (i) improving soil physicochemical properties (e.g., pH, CEC, water hold capacity, bulk density and biological activity) [27]; (ii) providing SOC and mineral elements for plant growth [70]; (iii) enhancing soil nutrient availability, as well as plant nutrient uptake, transformation and utilization efficiency [71]; (iv) offering comfortable environments for soil microbial growth and populations [22]; and (v) increasing the leaf photosynthetic rate [72]. To further explore the effect of N fertilizer combined with biochar on maize grain yields, a 3D color map graph was built. The 3D color map surface in Figure 8 shows that biochar combined with nitrogen fertilizer is beneficial for increasing crop yields. A higher grain yield was observed with 15–30 t ha−1 biochar and 240–276 kg ha−1 N fertilizer. On the other hand, several studies have revealed that excessive biochar application is not helpful for improving crop yields [73,74]. A meta-analysis showed that the yields of cereal and legume crops declined when the biochar application rate exceeded 20 t ha−1 [75]. Gao et al. determined that 10.1–20 t ha−1 biochar was the most suitable application rate [76]. Our results showed similar results in that the increased rate of maize yields tended to be gradual as biochar and nitrogen fertilizer were increased, while excessive applications of biochar and nitrogen fertilizer had no promoting effect on crop yields.
NUE not only reflects the capacity of the plant to utilize N fertilizer but also is an important index for assessing N fertilizer management [77,78]. In the present study, the NUE after treatment with N fertilizer application rates of 204, 240 and 276 kg N ha−1 without biochar (N1BC0) was 21.6%, 22.8% and 21.6%, respectively (Figure 4). The results suggested that the application of N fertilizer is not an efficient strategy for enhancing NUE. Generally, if biochar improves N availability and crop yield, it will also increase NUE. Under N1 and N2 conditions, the NUE of maize increased to 31.9–46.3% with the addition of 15–30 t ha−1 biochar, respectively. Similar results were reported by Xia et al. [22], Taghizadeh-Toosi et al. [79] and Ismaili et al. [80]. The promoting effect of biochar on NUE could be explained by the following mechanisms: (i) biochar can bind N to form an agglomerated particle to prevent N from quick release and N2O emission [12] and (ii) biochar can supply adequate N during plant growth to enhance crop grain yields by increasing CEC [81]. On the other hand, the maize NUE was pronouncedly decreased by biochar when N fertilizer was applied at the level of 276 kg N ha−1. The results reflected the restriction of biochar in N fertilizer utilization when excess N fertilizer was applied to soils.

4.5. Comprehensive Analysis

To better and comprehensively analyze the potential effects of N fertilizer and biochar on the soil chemical properties and the growth of maize plants, principal component analysis (PCA) and structural equation modeling analysis (SEM) were performed. The results of PCA in Figure 6 clearly separated the three levels of N fertilizer into two groups. The N1 and N2 treatment groups located along the negative axis of PC1 were clustered into one group, and the N3 treatment group located along the positive axis of PC1 belonged to the other group. The results suggest that the N3 treatment group was significantly different from the other two N fertilizer treatment groups. Furthermore, most of the parameters, including soil nutrients, leaf photosynthetic efficiency, plant biomass and grain yield, were weighted on the positive axis of PC1. The results indicated that compared to that with the N fertilizer conventionally utilized by local farmers (N2, 240 kg N ha−1), although a 15% reduction in the N fertilizer application rate (N1, 204 kg N ha−1) had no pronounced effect on the normal growth of maize, larger amounts of N fertilizer applied to the soils were still necessary to achieve the goals of higher crop yields. SEM can be applied to evaluate the direct and indirect effects of biochar and N fertilizer on soil quality, NUE, plant growth and crop production of maize. Based on the results of the structural equation model in Figure 7, N fertilizer and biochar directly and positively influenced the plant biomass of maize by enhancing both the soil chemical properties and plant growth parameters. On the other hand, only 12% of the variation in NUE and 66% of the variation in crop yields were explained by soil chemical properties and plant growth parameters, and the direct path relationships among these parameters were not significant. The results suggested that soil chemical properties and plant growth parameters influenced by N fertilizer and biochar may not be the dominant factors in determining the NUE and yield of maize. The potential effects of N fertilizer and biochar on soil physical properties, such as CEC, BD and water holding ability [68,82], the activities of N-cycling enzymes, such as urease, nitrate reductase and protease [49] and microbial functional abundance [56] need more attention in further studies.

5. Conclusions

The results of the present study confirm the effectiveness of N fertilizer and biochar in improving the soil quality, as well as the N uptake, NUE and production of maize. The increased application of N fertilizer enhanced not only the soil N content but also the leaf photosynthesis, plant growth and grain yields of maize. The application of biochar enhanced the benefits of N fertilizer by decreasing soil pH, increasing the availability of soil nutrients and improving plant N uptake and utilization. Furthermore, with a low level of N fertilizer application, biochar was beneficial for the enhancement of NUE, while NUE was significantly decreased by biochar when a high rate of N fertilizer was applied to soils. Based on the SEM results, the application of N fertilizer and biochar had a direct effect on the plant biomass but an indirect influence on the NUE and grain yield of maize. In conclusion, the addition of N fertilizers combined with appropriate biochar is proven to be an efficient nutrient management approach to promote soil retention and N utilization in maize production.

Supplementary Materials

The following supporting information can be downloaded at: https://www.mdpi.com/article/10.3390/agronomy13010113/s1, Figure S1: Scanning electron microscope (SEM) image of maize straw-biochar; Figure S2: Fourier transform infrared (FTIR) spectrum of maize straw-biochar; Figure S3: Daily mean temperature and precipitation during the plant growth period of maize; Figure S4: Biplot of first (PC1) and second (PC2) principal components of 36 evaluated traits in different biochar treatment groups.

Author Contributions

Conceptualization, X.S.; methodology, C.L. and X.S.; software, X.Z. (Xiaomei Zhao); validation, X.Z. (Xiaomei Zhao); formal analysis, C.Z. and X.Z. (Xiaowei Zhao); investigation, C.L.; resources, C.Z.; data curation, X.Z. (Xiaomei Zhao); writing—original draft preparation, C.L. and X.S.; writing—review and editing, X.S.; visualization, Y.W.; supervision, C.Z.; project administration, X.L. and X.Z. (Xiaowei Zhao); funding acquisition, X.S. All authors have read and agreed to the published version of the manuscript.

Funding

This research was funded by the Shandong Provincial Key Research and Development Program, grant number 2021CXGC010704, and Funding of Field Scientific Observation and Research Station for Land Use Safety in the Yellow River Delta, grant number YWZ2020-03.

Data Availability Statement

Not applicable.

Conflicts of Interest

The authors declare no conflict of interest.

References

  1. Reverchon, F.; Flicker, R.C.; Yang, H.; Yan, G.; Xu, Z.; Chen, C.; Hosseini Bai, S.; Zhang, D. Changes in δ15N in a soil-plant system under different biochar feedstocks and application rates. Biol. Fert. Soils 2014, 50, 275–283. [Google Scholar] [CrossRef]
  2. Nishida, H.; Suzaki, T. Nitrate-mediated control of root nodule symbiosis. Curr. Opin. Plant. Biol. 2018, 44, 129–136. [Google Scholar] [CrossRef] [PubMed]
  3. Wang, H.; Zhang, Y.; Chen, A.; Liu, H.; Zhai, L.; Lei, B.; Ren, T. An optimal regional nitrogen application threshold for wheat in the North China Plain considering yield and environmental effects. Field. Crop. Res. 2017, 207, 52–61. [Google Scholar] [CrossRef]
  4. Schroeder, J.I.; Delhaize, E.; Frommer, W.B.; Guerinot, M.L.; Harrison, M.J.; Herrera-Estrella, L.; Horie, T.; Kochian, L.V.; Munns, R.; Nishizawa, N.K.; et al. Using membrane transporters to improve crops for sustainable food production. Nature 2013, 497, 60–66. [Google Scholar] [CrossRef] [Green Version]
  5. Ladha, J.K.; Pathak, H.; J. Krupnik, T.; Six, J.; van Kessel, C. Efficiency of fertilizer nitrogen in cereal production: Retrospects and Prospects. In Advances in Agronomy; Academic Press: Cambridge, MA, USA, 2005; Volume 87, pp. 85–156. [Google Scholar]
  6. Xia, H.; Riaz, M.; Zhang, M.; Liu, B.; Li, Y.; El-Desouki, Z.; Jiang, C. Biochar-N fertilizer interaction increases N utilization efficiency by modifying soil C/N component under N fertilizer deep placement modes. Chemosphere 2022, 286, 131594. [Google Scholar] [CrossRef]
  7. Zhao, H.; Yu, L.; Yu, M.; Afzal, M.; Dai, Z.; Brookes, P.; Xu, J. Nitrogen combined with biochar changed the feedback mechanism between soil nitrification and Cd availability in an acidic soil. J. Hazard. Mater. 2020, 390, 121631. [Google Scholar] [CrossRef]
  8. Tsiafouli, M.A.; Thébault, E.; Sgardelis, S.P.; de Ruiter, P.C.; van der Putten, W.H.; Birkhofer, K.; Hemerik, L.; de Vries, F.T.; Bardgett, R.D.; Brady, M.V.; et al. Intensive agriculture reduces soil biodiversity across Europe. Glob. Chang. Biol. 2015, 21, 973–985. [Google Scholar] [CrossRef] [Green Version]
  9. Lutes, K.; Oelbermann, M.; Thevathasan, N.V.; Gordon, A.M. Effect of nitrogen fertilizer on greenhouse gas emissions in two willow clones (Salix miyabeana and S. dasyclados) in southern Ontario, Canada. Agrofor. Syst. 2016, 90, 785–796. [Google Scholar] [CrossRef]
  10. Ying, H.; Ye, Y.; Cui, Z.; Chen, X. Managing nitrogen for sustainable wheat production. J. Clean. Prod. 2017, 162, 1308–1316. [Google Scholar] [CrossRef]
  11. Wang, H.; Wu, L.; Wang, X.; Zhang, S.; Cheng, M.; Feng, H.; Fan, J.; Zhang, F.; Xiang, Y. Optimization of water and fertilizer management improves yield, water, nitrogen, phosphorus and potassium uptake and use efficiency of cotton under drip fertigation. Agric. Water Manag. 2021, 245, 106662. [Google Scholar] [CrossRef]
  12. Shi, W.; Bian, R.; Li, L.; Lian, W.; Liu, X.; Zheng, J.; Cheng, K.; Zhang, X.; Drosos, M.; Joseph, S.; et al. Assessing the impacts of biochar-blended urea on nitrogen use efficiency and soil retention in wheat production. GCB Bioenegy 2022, 14, 65–83. [Google Scholar] [CrossRef]
  13. Lal, R. Food security impacts of the “4 per Thousand” initiative. Geoderma 2020, 374, 114427. [Google Scholar] [CrossRef]
  14. Jing, F.; Chen, C.; Chen, X.; Liu, W.; Wen, X.; Hu, S.; Yang, Z.; Guo, B.; Xu, Y.; Yu, Q. Effects of wheat straw derived biochar on cadmium availability in a paddy soil and its accumulation in rice. Environ. Pollut. 2020, 257, 113592. [Google Scholar] [CrossRef] [PubMed]
  15. Zhang, Q.; Song, Y.; Wu, Z.; Yan, X.; Gunina, A.; Kuzyakov, Y.; Xiong, Z. Effects of six-year biochar amendment on soil aggregation, crop growth, and nitrogen and phosphorus use efficiencies in a rice-wheat rotation. J. Clean. Prod. 2020, 242, 118435. [Google Scholar] [CrossRef]
  16. Liu, J.; Jiang, B.; Shen, J.; Zhu, X.; Yi, W.; Li, Y.; Wu, J. Contrasting effects of straw and straw-derived biochar applications on soil carbon accumulation and nitrogen use efficiency in double-rice cropping systems. Arg. Ecosyst. Environ. 2021, 311, 107286. [Google Scholar] [CrossRef]
  17. Fedeli, R.; Alexandrov, D.; Celletti, S.; Nafilova, E.; Loppi, S. Biochar improves the performance of Avena sativa L. grown in gasoline-polluted soils. Environ. Sci. Pollut. Res. 2022, 55, 1–12. [Google Scholar] [CrossRef]
  18. Zhang, R.H.; Xie, Y.; Zhou, G.; Li, Z.; Ye, A.; Huang, X.; Xie, Y.; Shi, L.; Cao, X.; Zhang, J.; et al. The effects of short-term, long-term, and reapplication of biochar on the remediation of heavy metal-contaminated soil. Ecotoxicol. Environ. Saf. 2022, 248, 114316. [Google Scholar] [CrossRef]
  19. Akhtar, S.S.; Andersen, M.N.; Liu, F. Residual effects of biochar on improving growth, physiology and yield of wheat under salt stress. Agr. Water Manag. 2015, 158, 61–68. [Google Scholar] [CrossRef]
  20. Ali, S.; Rizwan, M.; Qayyum, M.F.; Ok, Y.S.; Ibrahim, M.; Riaz, M.; Arif, M.S.; Hafeez, F.; Al-Wabel, M.I.; Shahzad, A.N. Biochar soil amendment on alleviation of drought and salt stress in plants: A critical review. Environ. Sci. Pollut. Res. 2017, 24, 12700–12712. [Google Scholar] [CrossRef]
  21. Yin, X.; Peñuelas, J.; Sardans, J.; Xu, X.; Chen, Y.; Fang, Y.; Wu, L.; Singh, B.P.; Tavakkoli, E.; Wang, W. Effects of nitrogen-enriched biochar on rice growth and yield, iron dynamics, and soil carbon storage and emissions: A tool to improve sustainable rice cultivation. Environ. Pollut. 2021, 287, 117565. [Google Scholar] [CrossRef]
  22. Xia, H.; Riaz, M.; Zhang, M.; Liu, B.; El-Desouki, Z.; Jiang, C. Biochar increases nitrogen use efficiency of maize by relieving aluminum toxicity and improving soil quality in acidic soil. Ecotoxicol. Environ. Saf. 2020, 196, 110531. [Google Scholar] [CrossRef] [PubMed]
  23. Jeffery, S.; Abalos, D.; Prodana, M.; Bastos, A.C.; van Groenigen, J.W.; Hungate, B.A.; Verheijen, F. Biochar boosts tropical but not temperate crop yields. Environ. Res. Lett. 2017, 12, 053001. [Google Scholar] [CrossRef]
  24. Mehmood, I.; Qiao, L.; Chen, H.; Tang, Q.; Woolf, D.; Fan, M. Biochar addition leads to more soil organic carbon sequestration under a maize-rice cropping system than continuous flooded rice. Agric. Ecosyst. Environ. 2020, 298, 106965. [Google Scholar] [CrossRef]
  25. Farahani, S.S.; Asoodar, M.A.; Moghadam, B.K. Short-term impacts of biochar, tillage practices, and irrigation systems on nitrate and phosphorus concentrations in subsurface drainage water. Environ. Sci. Pollut. Res. 2020, 27, 761–771. [Google Scholar] [CrossRef] [PubMed]
  26. Borchard, N.; Schirrmann, M.; Cayuela, M.L.; Kammann, C.; Wrage-Mönnig, N.; Estavillo, J.M.; Fuertes-Mendizábal, T.; Sigua, G.; Spokas, K.; Ippolito, J.A.; et al. Biochar, soil and land-use interactions that reduce nitrate leaching and N2O emissions: A meta-analysis. Sci. Total Environ. 2019, 651, 2354–2364. [Google Scholar] [CrossRef] [PubMed]
  27. Phares, C.A.; Amoakwah, E.; Danquah, A.; Akaba, S.; Frimpong, K.A.; Mensah, T.A. Improved soil physicochemical, biological properties and net income following the application of inorganic NPK fertilizer and biochar for maize production. Acta Ecol. Sin. 2022, 42, 289–295. [Google Scholar] [CrossRef]
  28. Liu, B.; Li, H.; Li, H.; Zhang, A.; Rengel, Z. Long-term biochar application promotes rice productivity by regulating root dynamic development and reducing nitrogen leaching. GCB Bioenegy 2021, 13, 257–268. [Google Scholar] [CrossRef]
  29. Phares, C.A.; Atiah, K.; Frimpong, K.A.; Danquah, A.; Asare, A.T.; Aggor-Woananu, S. Application of biochar and inorganic phosphorus fertilizer influenced rhizosphere soil characteristics, nodule formation and phytoconstituents of cowpea grown on tropical soil. Heliyon 2020, 6, e05255. [Google Scholar] [CrossRef]
  30. Liu, Y.; Li, H.; Hu, T.; Mahmoud, A.; Li, J.; Zhu, R.; Jiao, X.; Jing, P. A quantitative review of the effects of biochar application on rice yield and nitrogen use efficiency in paddy fields: A meta-analysis. Sci. Total Environ. 2022, 830, 154792. [Google Scholar] [CrossRef]
  31. Dong, L.; Yang, X.; Shi, L.; Shen, Y.; Wang, L.; Wang, J.; Li, C.; Zhang, H. Biochar and nitrogen fertilizer co-application changed SOC content and fraction composition in Huang-Huai-Hai plain, China. Chemosphere 2022, 291, 132925. [Google Scholar] [CrossRef]
  32. Nagappan, S.; Devendran, S.; Tsai, P.-C.; Jayaraman, H.; Alagarsamy, V.; Pugazhendhi, A.; Ponnusamy, V.K. Metabolomics integrated with transcriptomics and proteomics: Evaluation of systems reaction to nitrogen deficiency stress in microalgae. Process Biochem. 2020, 91, 1–14. [Google Scholar] [CrossRef]
  33. Xiu, L.; Zhang, W.; Wu, D.; Sun, Y.; Zhang, H.; Gu, W.; Wang, Y.; Meng, J.; Chen, W. Biochar can improve biological nitrogen fixation by altering the root growth strategy of soybean in Albic soil. Sci. Total Environ. 2021, 773, 144564. [Google Scholar] [CrossRef] [PubMed]
  34. Agegnehu, G.; Bass, A.M.; Nelson, P.N.; Bird, M.I. Benefits of biochar, compost and biochar-compost for soil quality, maize yield and greenhouse gas emissions in a tropical agricultural soil. Sci. Total Environ. 2016, 543, 295–306. [Google Scholar] [CrossRef] [PubMed]
  35. Case, S.D.C.; McNamara, N.P.; Reay, D.S.; Stott, A.W.; Grant, H.K.; Whitaker, J. Biochar suppresses N2O emissions while maintaining N availability in a sandy loam soil. Soil Biol. Biochem. 2015, 81, 178–185. [Google Scholar] [CrossRef] [Green Version]
  36. Xu, G.; Fan, X.; Miller, A.J. Plant nitrogen assimilation and use efficiency. Annu. Rev. Plant Biol. 2012, 63, 153–182. [Google Scholar] [CrossRef] [Green Version]
  37. Hossain, M.Z.; Bahar, M.M.; Sarkar, B.; Donne, S.W.; Ok, Y.S.; Palansooriya, K.N.; Kirkham, M.B.; Chowdhury, S.; Bolan, N. Biochar and its importance on nutrient dynamics in soil and plant. Biochar 2020, 2, 379–420. [Google Scholar] [CrossRef]
  38. Gao, S.; DeLuca, T.H.; Cleveland, C.C. Biochar additions alter phosphorus and nitrogen availability in agricultural ecosystems: A meta-analysis. Sci. Total Environ. 2019, 654, 463–472. [Google Scholar] [CrossRef]
  39. An, N.; Zhang, L.; Liu, Y.; Shen, S.; Li, N.; Wu, Z.; Yang, J.; Han, W.; Han, X. Biochar application with reduced chemical fertilizers improves soil pore structure and rice productivity. Chemosphere 2022, 298, 134304. [Google Scholar] [CrossRef]
  40. Xie, Y.; Yang, C.; Ma, E.; Tan, H.; Zhu, T.; Müller, C. Biochar stimulates NH4+ turnover while decreasing NO3 production and N2O emissions in soils under long-term vegetable cultivation. Sci. Total Environ. 2020, 737, 140266. [Google Scholar] [CrossRef]
  41. Olmo, M.; Alburquerque, J.A.; Barrón, V.; del Campillo, M.C.; Gallardo, A.; Fuentes, M.; Villar, R. Wheat growth and yield responses to biochar addition under Mediterranean climate conditions. Biol. Fert. Soils 2014, 50, 1177–1187. [Google Scholar] [CrossRef]
  42. Olsen, S.R.; Sommers, L.E. Phosphorus. In Methods of Soil Analysis, Part 2, 2nd ed.; Agronomy Monograph 9, ASA and SSSA; Page, A.L., Miller, R.H., Eds.; American Society of Agronomy: Madison, WI, USA, 1982. [Google Scholar]
  43. Mebius, L.J. A rapid method for the determination of organic carbon in soil. Anal. Chim. Acta 1960, 22, 120–124. [Google Scholar] [CrossRef]
  44. Arnold, P.W. Soil science: Methods and applications: By D.L. Rowell. Longman, Essex, UK, 1994. Paperback. 350 pp. Price u19.99. Geoderma 1995, 66, 160–161. [Google Scholar] [CrossRef]
  45. Poorter, H.; Niinemets, Ü.; Poorter, L.; Wright, I.J.; Villar, R. Causes and consequences of variation in leaf mass per area (LMA): A meta-analysis. New Phytol. 2009, 182, 565–588. [Google Scholar] [CrossRef] [PubMed]
  46. Likhayo, P.; Bruce, A.Y.; Tefera, T.; Mueke, J. Maize grain stored in hermetic bags: Effect of moisture and pest infestation on grain quality. J. Food Qual. 2018, 2018, 2515698. [Google Scholar] [CrossRef]
  47. Arif, M.; Ilyas, M.; Riaz, M.; Ali, K.; Shah, K.; Ul Haq, I.; Fahad, S. Biochar improves phosphorus use efficiency of organic-inorganic fertilizers, maize-wheat productivity and soil quality in a low fertility alkaline soil. Field Crop. Res. 2017, 214, 25–37. [Google Scholar] [CrossRef]
  48. Manirakiza, N.; Şeker, C. Effects of compost and biochar amendments on soil fertility and crop growth in a calcareous soil. J. Plant Nutr. 2020, 43, 3002–3019. [Google Scholar] [CrossRef]
  49. Ullah, S.; Zhao, Q.; Wu, K.; Ali, I.; Liang, H.; Iqbal, A.; Wei, S.; Cheng, F.; Ahmad, S.; Jiang, L.; et al. Biochar application to rice with 15N-labelled fertilizers, enhanced leaf nitrogen concentration and assimilation by improving morpho-physiological traits and soil quality. Saudi J. Biol. Sci. 2021, 28, 3399–3413. [Google Scholar] [CrossRef]
  50. Song, X.; Razavi, B.S.; Ludwig, B.; Zamanian, K.; Zang, H.; Kuzyakov, Y.; Dippold, M.A.; Gunina, A. Combined biochar and nitrogen application stimulates enzyme activity and root plasticity. Sci. Total Environ. 2020, 735, 139393. [Google Scholar] [CrossRef]
  51. Dong, Z.; Li, H.; Xiao, J.; Sun, J.; Liu, R.; Zhang, A. Soil multifunctionality of paddy field is explained by soil pH rather than microbial diversity after 8-years of repeated applications of biochar and nitrogen fertilizer. Sci. Total Environ. 2022, 853, 158620. [Google Scholar] [CrossRef]
  52. Bolan, N.; Sarmah, A.K.; Bordoloi, S.; Bolan, S.; Padhye, L.; Van Zwieten, L.; Sooriyakumar, P.; Khan, B.A.; Ahmad, M.; Solaiman, Z.; et al. Soil acidification and the liming potential of biochar. Environ. Pollut. 2023, 317, 120632. [Google Scholar] [CrossRef]
  53. Song, D.; Chen, L.; Zhang, S.; Zheng, Q.; Ullah, S.; Zhou, W.; Wang, X. Combined biochar and nitrogen fertilizer change soil enzyme and microbial activities in a 2-year field trial. Eur. J. Soil Biol. 2020, 99, 103212. [Google Scholar] [CrossRef]
  54. Wu, Z.; Zhang, X.; Dong, Y.; Li, B.; Xiong, Z. Biochar amendment reduced greenhouse gas intensities in the rice-wheat rotation system: Six-year field observation and meta-analysis. Agric. For. Meteorol. 2019, 278, 107625. [Google Scholar] [CrossRef]
  55. Zhang, L.; Xiang, Y.; Jing, Y.; Zhang, R. Biochar amendment effects on the activities of soil carbon, nitrogen, and phosphorus hydrolytic enzymes: A meta-analysis. Environ. Sci. Pollut. Res. 2019, 26, 22990–23001. [Google Scholar] [CrossRef]
  56. Ibrahim, M.M.; Tong, C.; Hu, K.; Zhou, B.; Xing, S.; Mao, Y. Biochar-fertilizer interaction modifies N-sorption, enzyme activities and microbial functional abundance regulating nitrogen retention in rhizosphere soil. Sci. Total Environ. 2020, 739, 140065. [Google Scholar] [CrossRef]
  57. Reibe, K.; Götz, K.-P.; Döring, T.F.; Roß, C.-L.; Ellmer, F. Impact of hydro-/biochars on root morphology of spring wheat. Arch. Agron. Soil Sci. 2015, 61, 1041–1054. [Google Scholar] [CrossRef]
  58. He, M.; Xiong, X.; Wang, L.; Hou, D.; Bolan, N.S.; Ok, Y.S.; Rinklebe, J.; Tsang, D.C.W. A critical review on performance indicators for evaluating soil biota and soil health of biochar-amended soils. J. Hazard. Mater. 2021, 414, 125378. [Google Scholar] [CrossRef]
  59. Zhang, J.; Zhang, L.; Qiu, S. Biochar amendment benefits 15N fertilizer retention and rhizosphere N enrichment in a maize-soil system. Geoderma 2022, 412, 115713. [Google Scholar] [CrossRef]
  60. Laird, D.; Fleming, P.; Wang, B.; Horton, R.; Karlen, D. Biochar impact on nutrient leaching from a Midwestern agricultural soil. Geoderma 2010, 158, 436–442. [Google Scholar] [CrossRef] [Green Version]
  61. Zhou, H.; Zhou, G.; He, Q.; Zhou, L.; Ji, Y.; Zhou, M. Environmental explanation of maize specific leaf area under varying water stress regimes. Environ. Exp. Bot. 2020, 171, 103932. [Google Scholar] [CrossRef]
  62. Song, X.; Guo, W.; Xu, L.; Shi, L. Beneficial effect of humic acid urea on improving physiological characteristics and yield of maize (Zea mays L.). Acta Physiol. Plant. 2022, 44, 72. [Google Scholar] [CrossRef]
  63. Speratti, A.B.; Romanyà, J.; Garcia-Pausas, J.; Johnson, M.S. Determining the stability of sugarcane filtercake biochar in soils with contrasting levels of organic matter. Agriculture 2018, 8, 71. [Google Scholar] [CrossRef] [Green Version]
  64. Silva Gonzaga, M.I.; Oliveira da Silva, P.S.; Carlos de Jesus Santos, J.; Ganassali de Oliveira Junior, L.F. Biochar increases plant water use efficiency and biomass production while reducing Cu concentration in Brassica juncea L. in a Cu-contaminated soil. Ecotoxicol. Environ. Saf. 2019, 183, 109557. [Google Scholar] [CrossRef] [PubMed]
  65. Zhang, Y.; Wang, J.; Gong, S.; Xu, D.; Sui, J. Nitrogen fertigation effect on photosynthesis, grain yield and water use efficiency of winter wheat. Agric. Water Manag. 2017, 179, 277–287. [Google Scholar] [CrossRef] [Green Version]
  66. Laghari, M.; Mirjat, M.S.; Hu, Z.; Fazal, S.; Xiao, B.; Hu, M.; Chen, Z.; Guo, D. Effects of biochar application rate on sandy desert soil properties and sorghum growth. Catena 2015, 135, 313–320. [Google Scholar] [CrossRef]
  67. Farquhar, G.D.; Von, C.S.; Berry, J.A. A biochemical model of photosynthetic CO2 assimilation in leaves of C3 species. Planta 1980, 149, 78–90. [Google Scholar] [CrossRef] [Green Version]
  68. Chun, J.-H.; Kang, Y.-G.; Lee, J.-H.; Yun, Y.-U.; Oh, T.-K.; Yoon, M.-H. The combined effect of nitrogen and biochar amendments on the yield and glucosinolate contents of the Chinese cabbage. J. King Saud Univ.-Sci. 2022, 34, 101799. [Google Scholar] [CrossRef]
  69. Thomas, S.C.; Gale, N. Biochar and forest restoration: A review and meta-analysis of tree growth responses. New For. 2015, 46, 931–946. [Google Scholar] [CrossRef]
  70. Liu, Y.; Lu, H.; Yang, S.; Wang, Y. Impacts of biochar addition on rice yield and soil properties in a cold waterlogged paddy for two crop seasons. Field Crop. Res. 2016, 191, 161–167. [Google Scholar] [CrossRef]
  71. Uzoma, K.C.; Inoue, M.; Andry, H.; Fujimaki, H.; Zahoor, A.; Nishihara, E. Effect of cow manure biochar on maize productivity under sandy soil condition. Soil Use Manag. 2011, 27, 205–212. [Google Scholar] [CrossRef]
  72. Ouyang, Z.; Tian, J.; Yan, X.; Shen, H. Effects of different concentrations of dissolved oxygen or temperatures on the growth, photosynthesis, yield and quality of lettuce. Agric. Water Manag. 2020, 228, 105896. [Google Scholar] [CrossRef]
  73. Jin, Z.; Chen, C.; Chen, X.; Jiang, F.; Hopkins, I.; Zhang, X.; Han, Z.; Billy, G.; Benavides, J. Soil acidity, available phosphorus content, and optimal biochar and nitrogen fertilizer application rates: A five-year field trial in upland red soil, China. Field Crop. Res. 2019, 232, 77–87. [Google Scholar] [CrossRef]
  74. Sun, Q.; Meng, J.; Lan, Y.; Shi, G.; Yang, X.; Cao, D.; Chen, W.; Han, X. Long-term effects of biochar amendment on soil aggregate stability and biological binding agents in brown earth. Catena 2021, 205, 105460. [Google Scholar] [CrossRef]
  75. Farhangi-Abriz, S.; Torabian, S.; Qin, R.; Noulas, C.; Lu, Y.; Gao, S. Biochar effects on yield of cereal and legume crops using meta-analysis. Sci. Total Environ. 2021, 775, 145869. [Google Scholar] [CrossRef]
  76. Gao, Y.; Shao, G.; Yang, Z.; Zhang, K.; Lu, J.; Wang, Z.; Wu, S.; Xu, D. Influences of soil and biochar properties and amount of biochar and fertilizer on the performance of biochar in improving plant photosynthetic rate: A meta-analysis. Eur. J. Agron. 2021, 130, 126345. [Google Scholar] [CrossRef]
  77. Yang, J.; Zhang, J. Grain-filling problem in ‘super’ rice. J. Exp. Bot. 2010, 61, 1–5. [Google Scholar] [CrossRef] [Green Version]
  78. Qiao, J.; Yang, L.; Yan, T.; Xue, F.; Zhao, D. Nitrogen fertilizer reduction in rice production for two consecutive years in the Taihu Lake area. Agric. Ecosyst. Environ. 2012, 146, 103–112. [Google Scholar] [CrossRef]
  79. Taghizadeh-Toosi, A.; Clough, T.J.; Sherlock, R.R.; Condron, L.M. A wood based low-temperature biochar captures NH3-N generated from ruminant urine-N, retaining its bioavailability. Plant Soil 2012, 353, 73–84. [Google Scholar] [CrossRef]
  80. Ismaili, K.; Ismaili, M.; Ibijbijen, J. The use of 13C and 15N based isotopic techniques for assessing soil C and N changes under conservation agriculture. Eur. J. Agron. 2015, 64, 1–7. [Google Scholar] [CrossRef]
  81. Kumar, A.; Joseph, S.; Tsechansky, L.; Privat, K.; Schreiter, I.J.; Schüth, C.; Graber, E.R. Biochar aging in contaminated soil promotes Zn immobilization due to changes in biochar surface structural and chemical properties. Sci. Total Environ. 2018, 626, 953–961. [Google Scholar] [CrossRef]
  82. Liu, Z.; He, T.; Cao, T.; Yang, T.; Meng, J.; Chen, W.J.J.o.S.S.; Nutrition, P. Effects of biochar application on nitrogen leaching, ammonia volatilization and nitrogen use efficiency in two distinct soils. J. Soil Sci. Plant Nutr. 2017, 17, 515–528. [Google Scholar] [CrossRef]
Figure 1. Effects of biochar on plant height (A), leaf area (B), specific leaf area (C) and SPAD values (D) of maize under different nitrogen fertilizer conditions. Significance levels are indicated: * p < 0.05, ** p < 0.01, *** p < 0.01.
Agronomy 13 00113 g001
Figure 2. Effects of biochar on net the photosynthetic rate (A), stomatal conductance (B), intercellular CO2 concentration (C), transpiration rate (D) and water use efficiency (E) in leaves of maize under different nitrogen fertilizer conditions. Significance levels are indicated: * p < 0.05, ** p < 0.01, *** p < 0.01.
Agronomy 13 00113 g002
Figure 3. Dry weights of maize biomass with combined nitrogen fertilizer and biochar treatments. Vertical bars represent the standard deviation, SD, of the mean (n = 4); different letters on the SD bars indicate significant differences among the nitrogen fertilizer and biochar treatment groups (p < 0.05).
Agronomy 13 00113 g003
Figure 4. Impact of biochar on nitrogen utilization efficiency under different nitrogen fertilizer conditions. Significance levels are indicated: ** p < 0.01, *** p < 0.01.
Agronomy 13 00113 g004
Figure 5. Heatmap based on the Spearman correlation matrix of different plant and soil parameters with different P nitrogen fertilizer and biochar treatments. AK—available potassium content, AP—available phosphorus content, Area—leaf area, Ci—intercellular CO2 concentration, GE—grains per ear, Gs—stomatal conductance, Grain N—nitrogen content in maize grain, GW—100-grain weight, GY—grain yield, Leaf DW—dry weight of maize leaf, Leaf N—nitrogen content in maize leaf, MN—mineral nitrogen content, NUE—nitrogen utilization efficiency, Pn—net photosynthetic rate, pH—soil pH, PH—plant height, Root DW—dry weight of maize root, Root N—nitrogen contents in maize root, SLA—specific leaf area, SOC—soil organic carbon, Spike DW—dry weight of maize spike, SPAD—leaf SPAD values, Stem DW—dry weight of maize stem, Stem N—nitrogen content in maize stem, Tr—transpiration rate, WUE—water use efficiency.
Agronomy 13 00113 g005
Figure 6. Biplot of first (PC1) and second (PC2) principal components of 36 evaluated traits with different nitrogen fertilizer treatments. AK—available potassium content, AP—available phosphorus content, Area—leaf area, Ci—intercellular CO2 concentration, GE—grains per ear, Gs—stomatal conductance, Grain N—nitrogen content in maize grain, GW—100-grain weight, GY—grain yield, Leaf DW—dry weight of maize leaf, Leaf N—nitrogen content in maize leaf, MN—mineral nitrogen content, NUE—nitrogen utilization efficiency, Pn—net photosynthetic rate, pH—soil pH, PH—plant height, Root DW—dry weight of maize root, Root N—nitrogen contents in maize root, SLA—specific leaf area, SOC—soil organic carbon, Spike DW—dry weight of maize spike, SPAD—leaf SPAD values, Stem DW—dry weight of maize stem, Stem N—nitrogen content in maize stem, Tr—transpiration rate, WUE—water use efficiency.
Agronomy 13 00113 g006
Figure 7. Structural equation model explaining the plant biomass, NUE and crop quality of maize (χ2 = 1097.1, NFI = 0.47). Standardized path coefficients are shown next to the arrows. Solid-line arrows indicate significant paths; dotted-line arrows indicate non-significant paths; blue-line arrows indicate positive relationships; red-line arrows indicate negative relationships; values associated with the line represent standardized path coefficients. The R2 numbers within boxes denote the proportion of variance that could be explained by the corresponding variable in the structural equation model. Significance levels are indicated: ** p < 0.01, *** p < 0.001.
Agronomy 13 00113 g007
Figure 8. Relationship between maize yield and biochar-fertilizer N application rates in 3D color map surface image.
Agronomy 13 00113 g008
Table 1. Basic physio-chemical properties of soil and biochar used in the present study.
SoilBiochar
Sand (%)23.6pH8.12 ± 0.24
Silt (%)54.3EC (μs cm−1)187.4 ± 3.6
Clay (%)22.1OM (g kg−1)856.12 ± 5.28
BD (g cm−3)1.29 ± 0.07TN (g kg−1)152.21 ± 4.37
pH7.81 ± 0.04NH4+-N content (g kg−1)45.53 ± 2.56
EC (us cm−1)257.4 ± 1.3NO3-N content (g kg−1)18.87 ± 1.52
SOM (g kg−1)11.2 ± 0.5AP (g kg−1)64.82 ± 1.21
TN (g kg−1)1.74 ± 0.21AK content (g kg−1)20.23 ± 0.35
AP (mg kg−1)78.2 ± 1.5Ash content (%)53.81 ± 0.64
AK (mg kg−1)332.1 ± 2.4Moisture (%)7.80 ± 0.35
Table 2. Effects of nitrogen fertilizer and biochar on soil pH and nutrient contents.
TreatmentspHSOC (g kg−1)MN (g kg−1)AP (mg kg−1)AK (mg kg−1)
N1BC07.83 ± 0.02 b11.35 ± 0.79 c1.23 ± 0.17 b72.7 ± 1.8 b345.2 ± 19.4 b
BC157.89 ± 0.02 a12.43 ± 0.35 b1.84 ± 0.03 a74.7 ± 0.8 ab380.0 ± 8.5 a
BC307.90 ± 0.06 a13.95 ± 0.44 a1.98 ± 0.02 a75.6 ± 1.6 a397.9 ± 10.0 a
N2BC07.78 ± 0.07 a12.00 ± 0.36 c1.92 ± 0.04 c73.7 ± 0.8 b347.3 ± 2.4 c
BC157.82 ± 0.04 a14.50 ± 0.37 b2.03 ± 0.05 b74.4 ± 0.8 b388.9 ± 5.0 b
BC307.85 ± 0.04 a15.95 ± 0.31 a2.30 ± 0.03 a76.8 ± 1.6 a406.9 ± 3.9 a
N3BC07.69 ± 0.03 b15.45 ± 0.87 b2.61 ± 0.05 a77.3 ± 0.9 ab402.3 ± 3.1 b
BC157.70 ± 0.01 ab17.83 ± 0.56 a2.57 ± 0.04 a78.9 ± 1.1 a416.9 ± 3.4 a
BC307.74 ± 0.03 a12.20 ± 0.18 c2.31 ± 0.05 b76.1 ± 1.1 b360.4 ± 6.7 c
N**********
BC**********
N × BCns****ns**
Note: N—nitrogen fertilizer treatment; B—biochar treatment; N × BC—interaction between nitrogen fertilizer and biochar. Different letters in the same column indicate significant differences (p < 0.05) between different treatment groups according Duncan’s test. ** indicates p < 0.01; ns indicates no significant differences.
Table 3. Changes in nitrogen contents of roots, leaves, stems and grains of maize under different nitrogen fertilizer and biochar conditions.
TreatmentsRN (mg g−1)LN Content (mg g−1)SN Content (mg g−1)GN Content (mg g−1)
N1BC03.20 ± 0.09 c10.41 ± 0.45 a8.59 ± 0.72 b10.03 ± 0.38 b
BC153.50 ± 0.16 b11.69 ± 1.38 a9.82 ± 0.68 a10.95 ± 0.22 a
BC303.77 ± 0.11 a12.07 ± 1.00 a10.74 ± 0.05 a11.62 ± 0.69 a
N2BC03.39 ± 0.36 a10.78 ± 1.16 a11.03 ± 0.71 b10.76 ± 0.38 c
BC153.67 ± 0.13 a11.15 ± 0.82 a12.58 ± 0.53 a11.74 ± 0.47 b
BC303.60 ± 0.46 a11.74 ± 0.63 a13.05 ± 1.05 a12.64 ± 0.45 a
N3BC04.10 ± 0.06 b12.63 ± 0.79 a12.64 ± 0.63 a10.86 ± 0.04 b
BC154.52 ± 0.41 a13.10 ± 1.15 a13.38 ± 1.23 a11.56 ± 0.63 a
BC304.15 ± 0.12 ab12.16 ± 0.91 a12.07 ± 1.37 a11.44 ± 0.18 ab
N********
BC**ns****
N × BCnsns**
Note: N—nitrogen fertilizer treatment; B—biochar treatment; N × BC—interaction between nitrogen fertilizer and biochar. RN—root N content; LN—leaf N content; SN—stem N content; GN—grain N content. Different letters in the same column indicate significant differences (p < 0.05) between different treatment groups according to Duncan’s test. ** indicates p < 0.01; * indicates p < 0.05; ns indicates no significant differences.
Table 4. Changes of maize grain yield with different nitrogen fertilizer and biochar treatments.
TreatmentsGrains per Ear100-Grain Weight (g)Grain Yield (kg ha−1)
N1BC0531 ± 5 b38.31 ± 0.56 a12,206 ± 254 a
BC15537 ± 6 ab38.37 ± 2.50 a12,350 ± 690 a
BC30561 ± 28 a38.95 ± 0.49 a13,106 ± 721 a
N2BC0548 ± 13 b38.62 ± 0.0 a12,700 ± 376 a
BC15584 ± 39 ab38.96 ± 1.38 a13,632 ± 535 a
BC30605 ± 17 a39.70 ± 1.12 a14,422 ± 671 a
N3BC0609 ± 9 a38.86 ± 0.66 a14,206 ± 371 a
BC15632 ± 32 a39.43 ± 1.15 a14,928 ± 524 a
BC30620 ± 15 a40.02 ± 0.87 a148,73 ± 443 a
Nnsnsns
BC*****
N × BCnsnsns
Note: N—nitrogen fertilizer treatment; B—biochar treatment; N × BC—interaction of nitrogen fertilizer and biochar. Different letters in the same column indicate significant differences (p < 0.05) between different treatments according Duncan’s test. ** indicates p < 0.01; * indicates p < 0.05; ns indicates no significant differences.
Disclaimer/Publisher’s Note: The statements, opinions and data contained in all publications are solely those of the individual author(s) and contributor(s) and not of MDPI and/or the editor(s). MDPI and/or the editor(s) disclaim responsibility for any injury to people or property resulting from any ideas, methods, instructions or products referred to in the content.

