
Effect of Deep Placement of Large Granular Fertilizer on Ammonia Volatilization, Soil Nitrogen Distribution and Rice Growth
Abstract
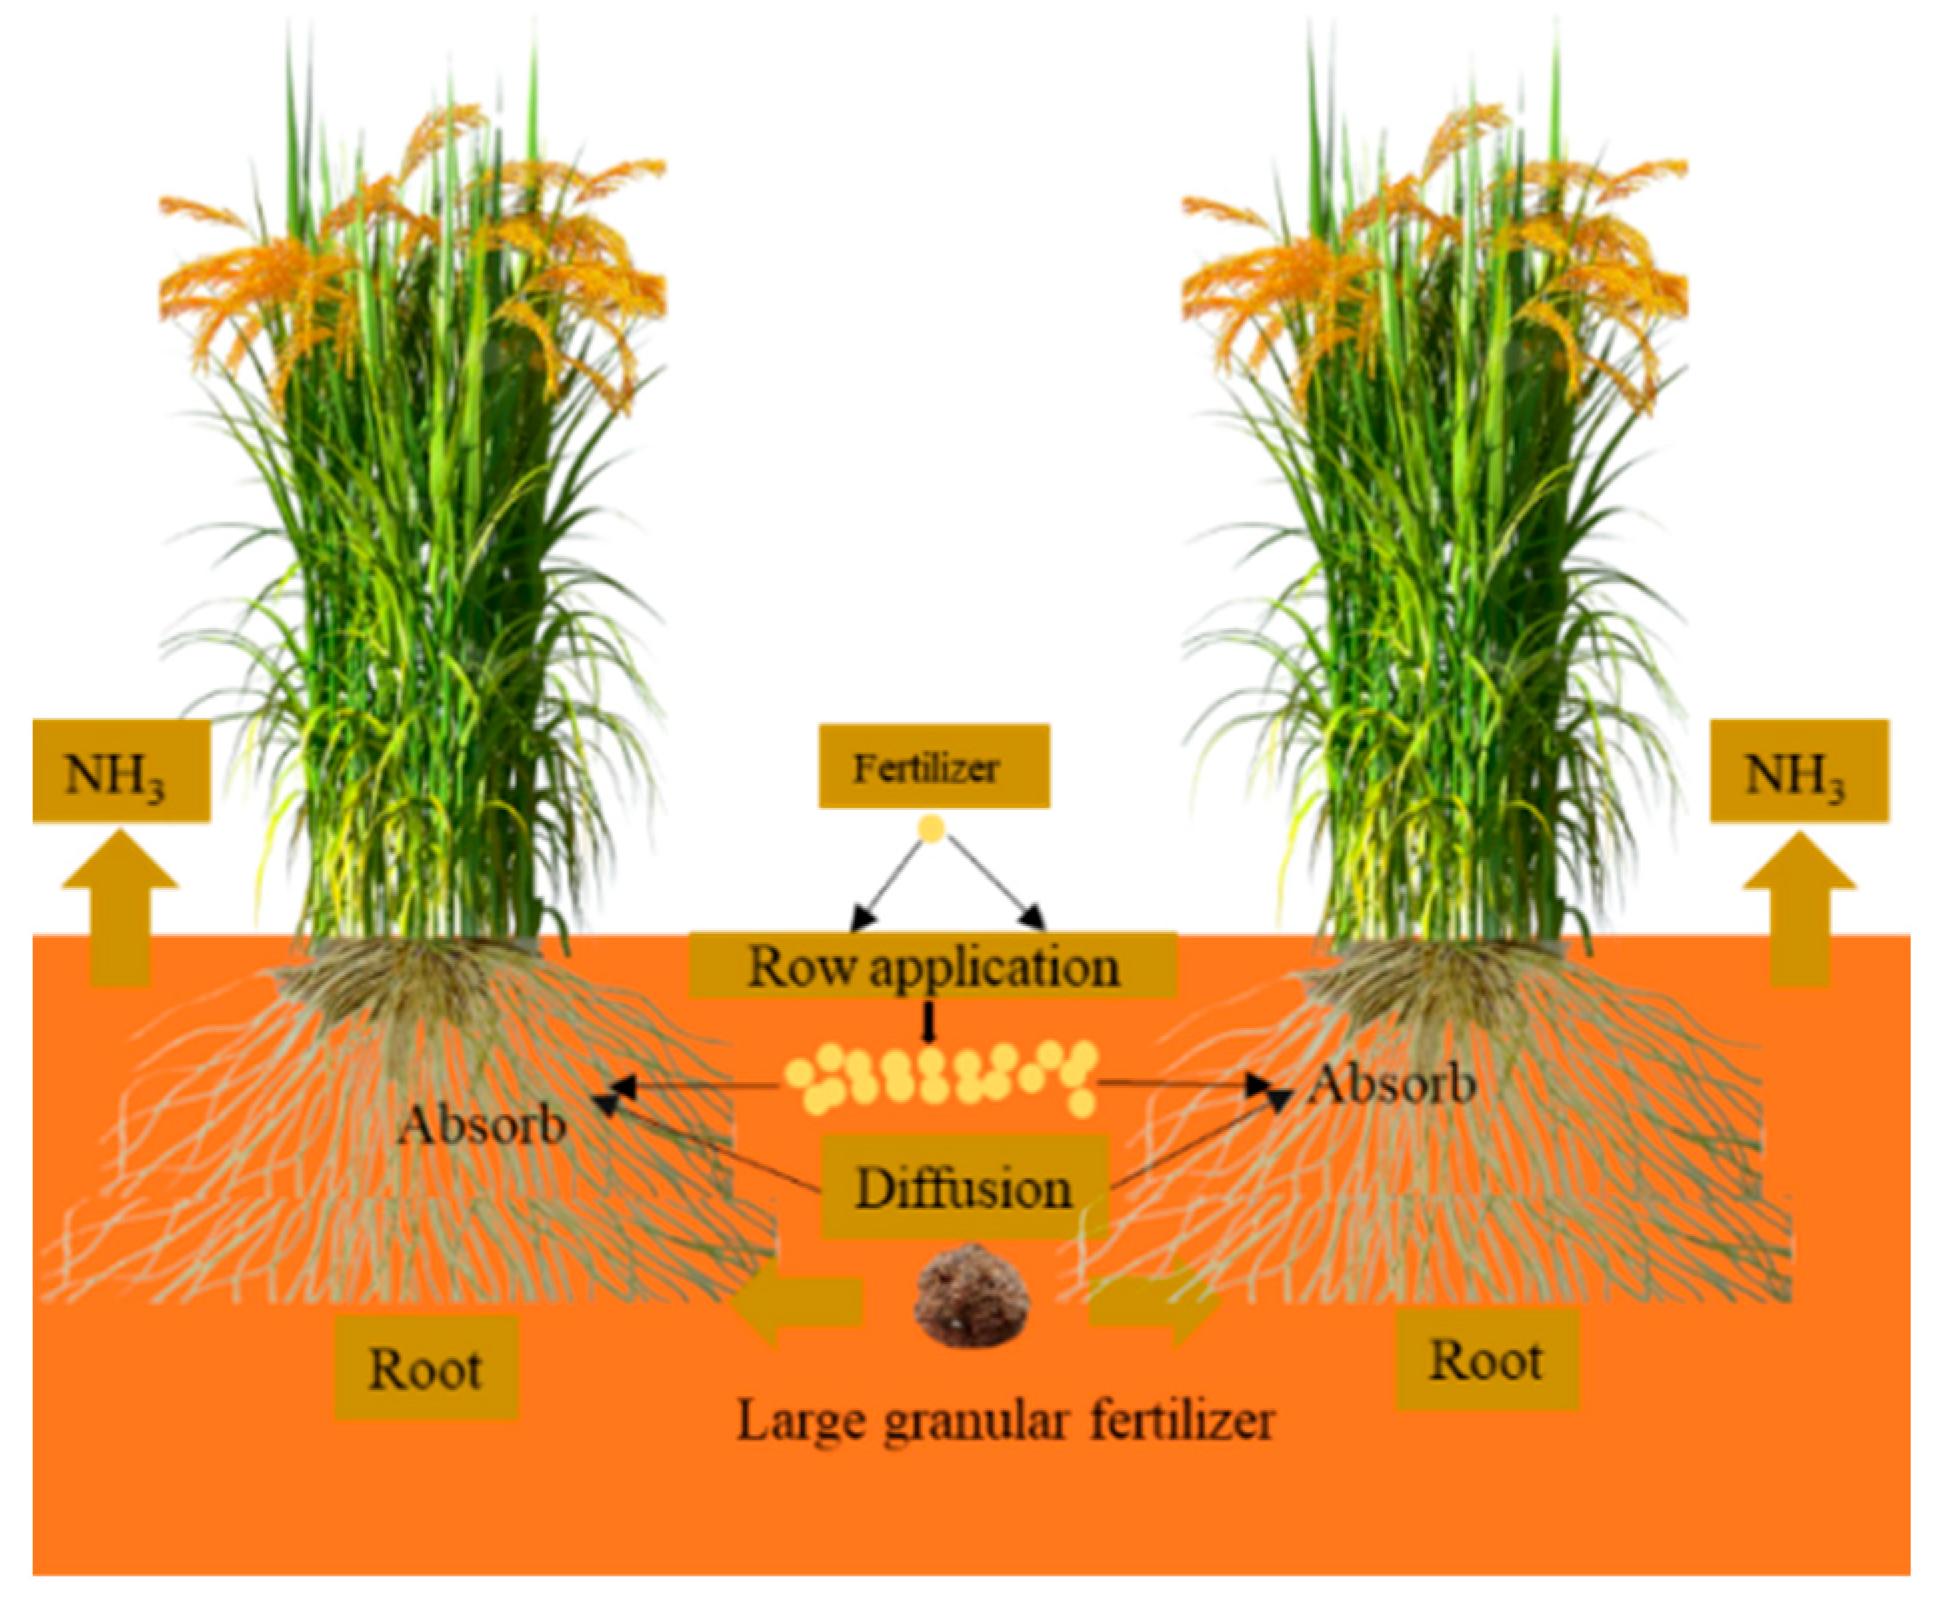
:1. Introduction
2. Materials and Methods
2.1. Experimental Location and Materials
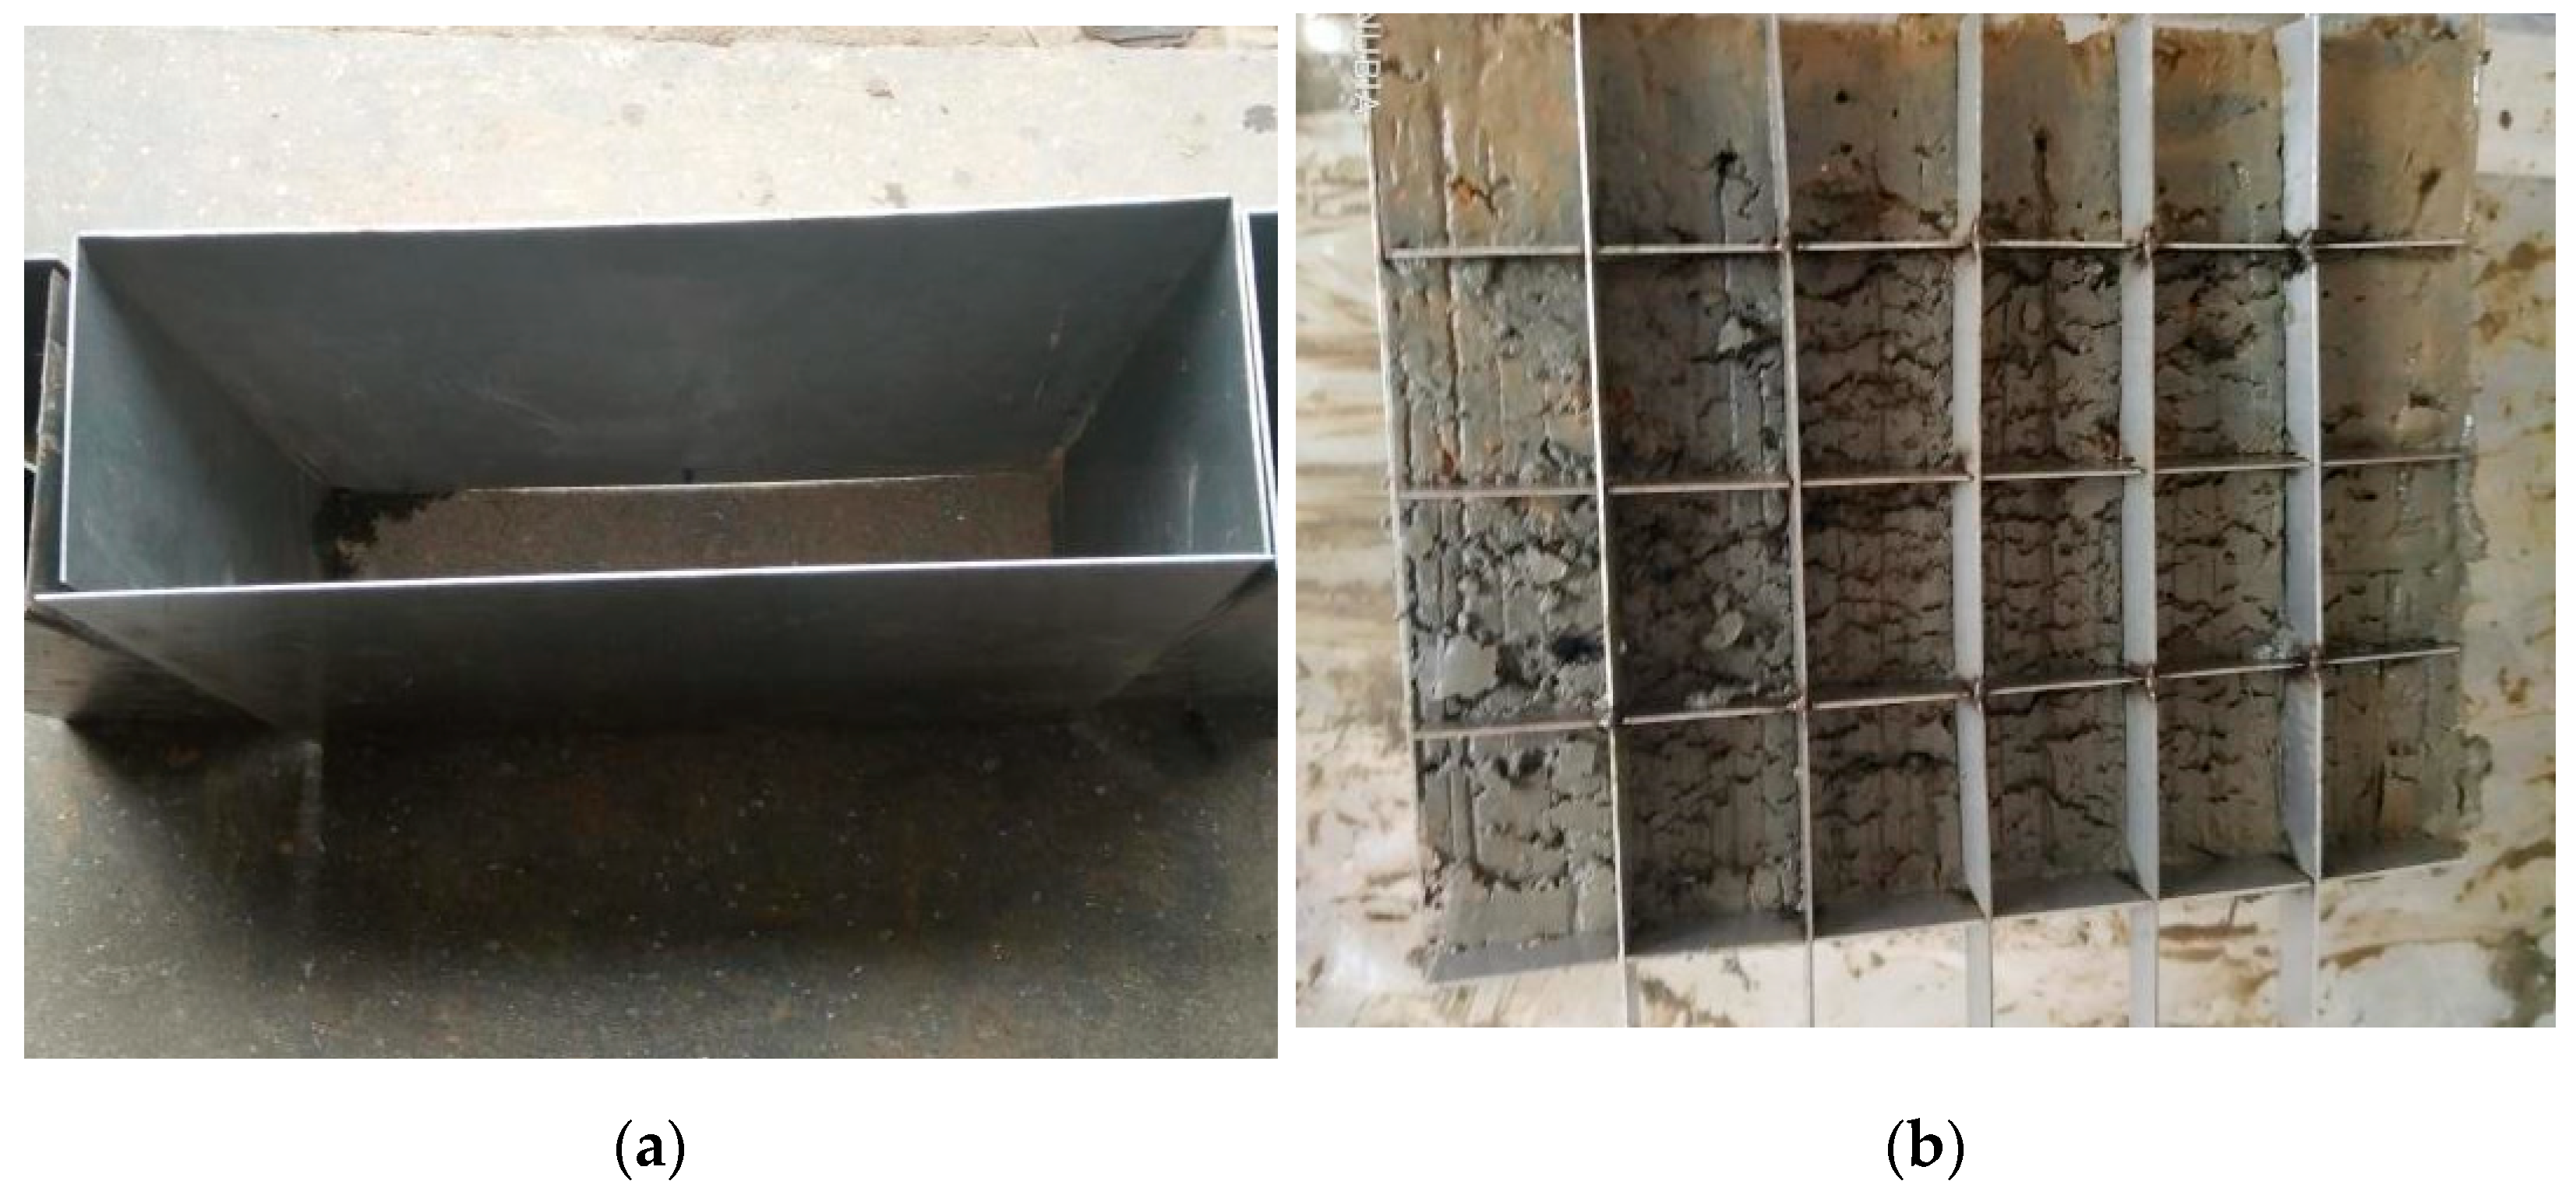
2.2. Experimental Design
2.3. Sample Collection and Analysis
2.3.1. Soil Chemical Properties
2.3.2. Dry Biomass and Grain Yield
2.3.3. Soil Nitrogen Transfer and Transformation
2.3.4. Determination of NH3 Volatilization in Rice Field
2.3.5. Determination of NH4+-N Concentration in Surface Water
2.4. Data Analysis
3. Results
3.1. Effects of Fertilization on Dry Biomass Quality and Yield of Plants
3.1.1. Dynamics of Rice Dry Biomass
3.1.2. Rice Grain Yield, NRE, and NAE
3.2. Diffusion Dynamics of Soil NH4+-N and NO3−-N by Fertilization Method
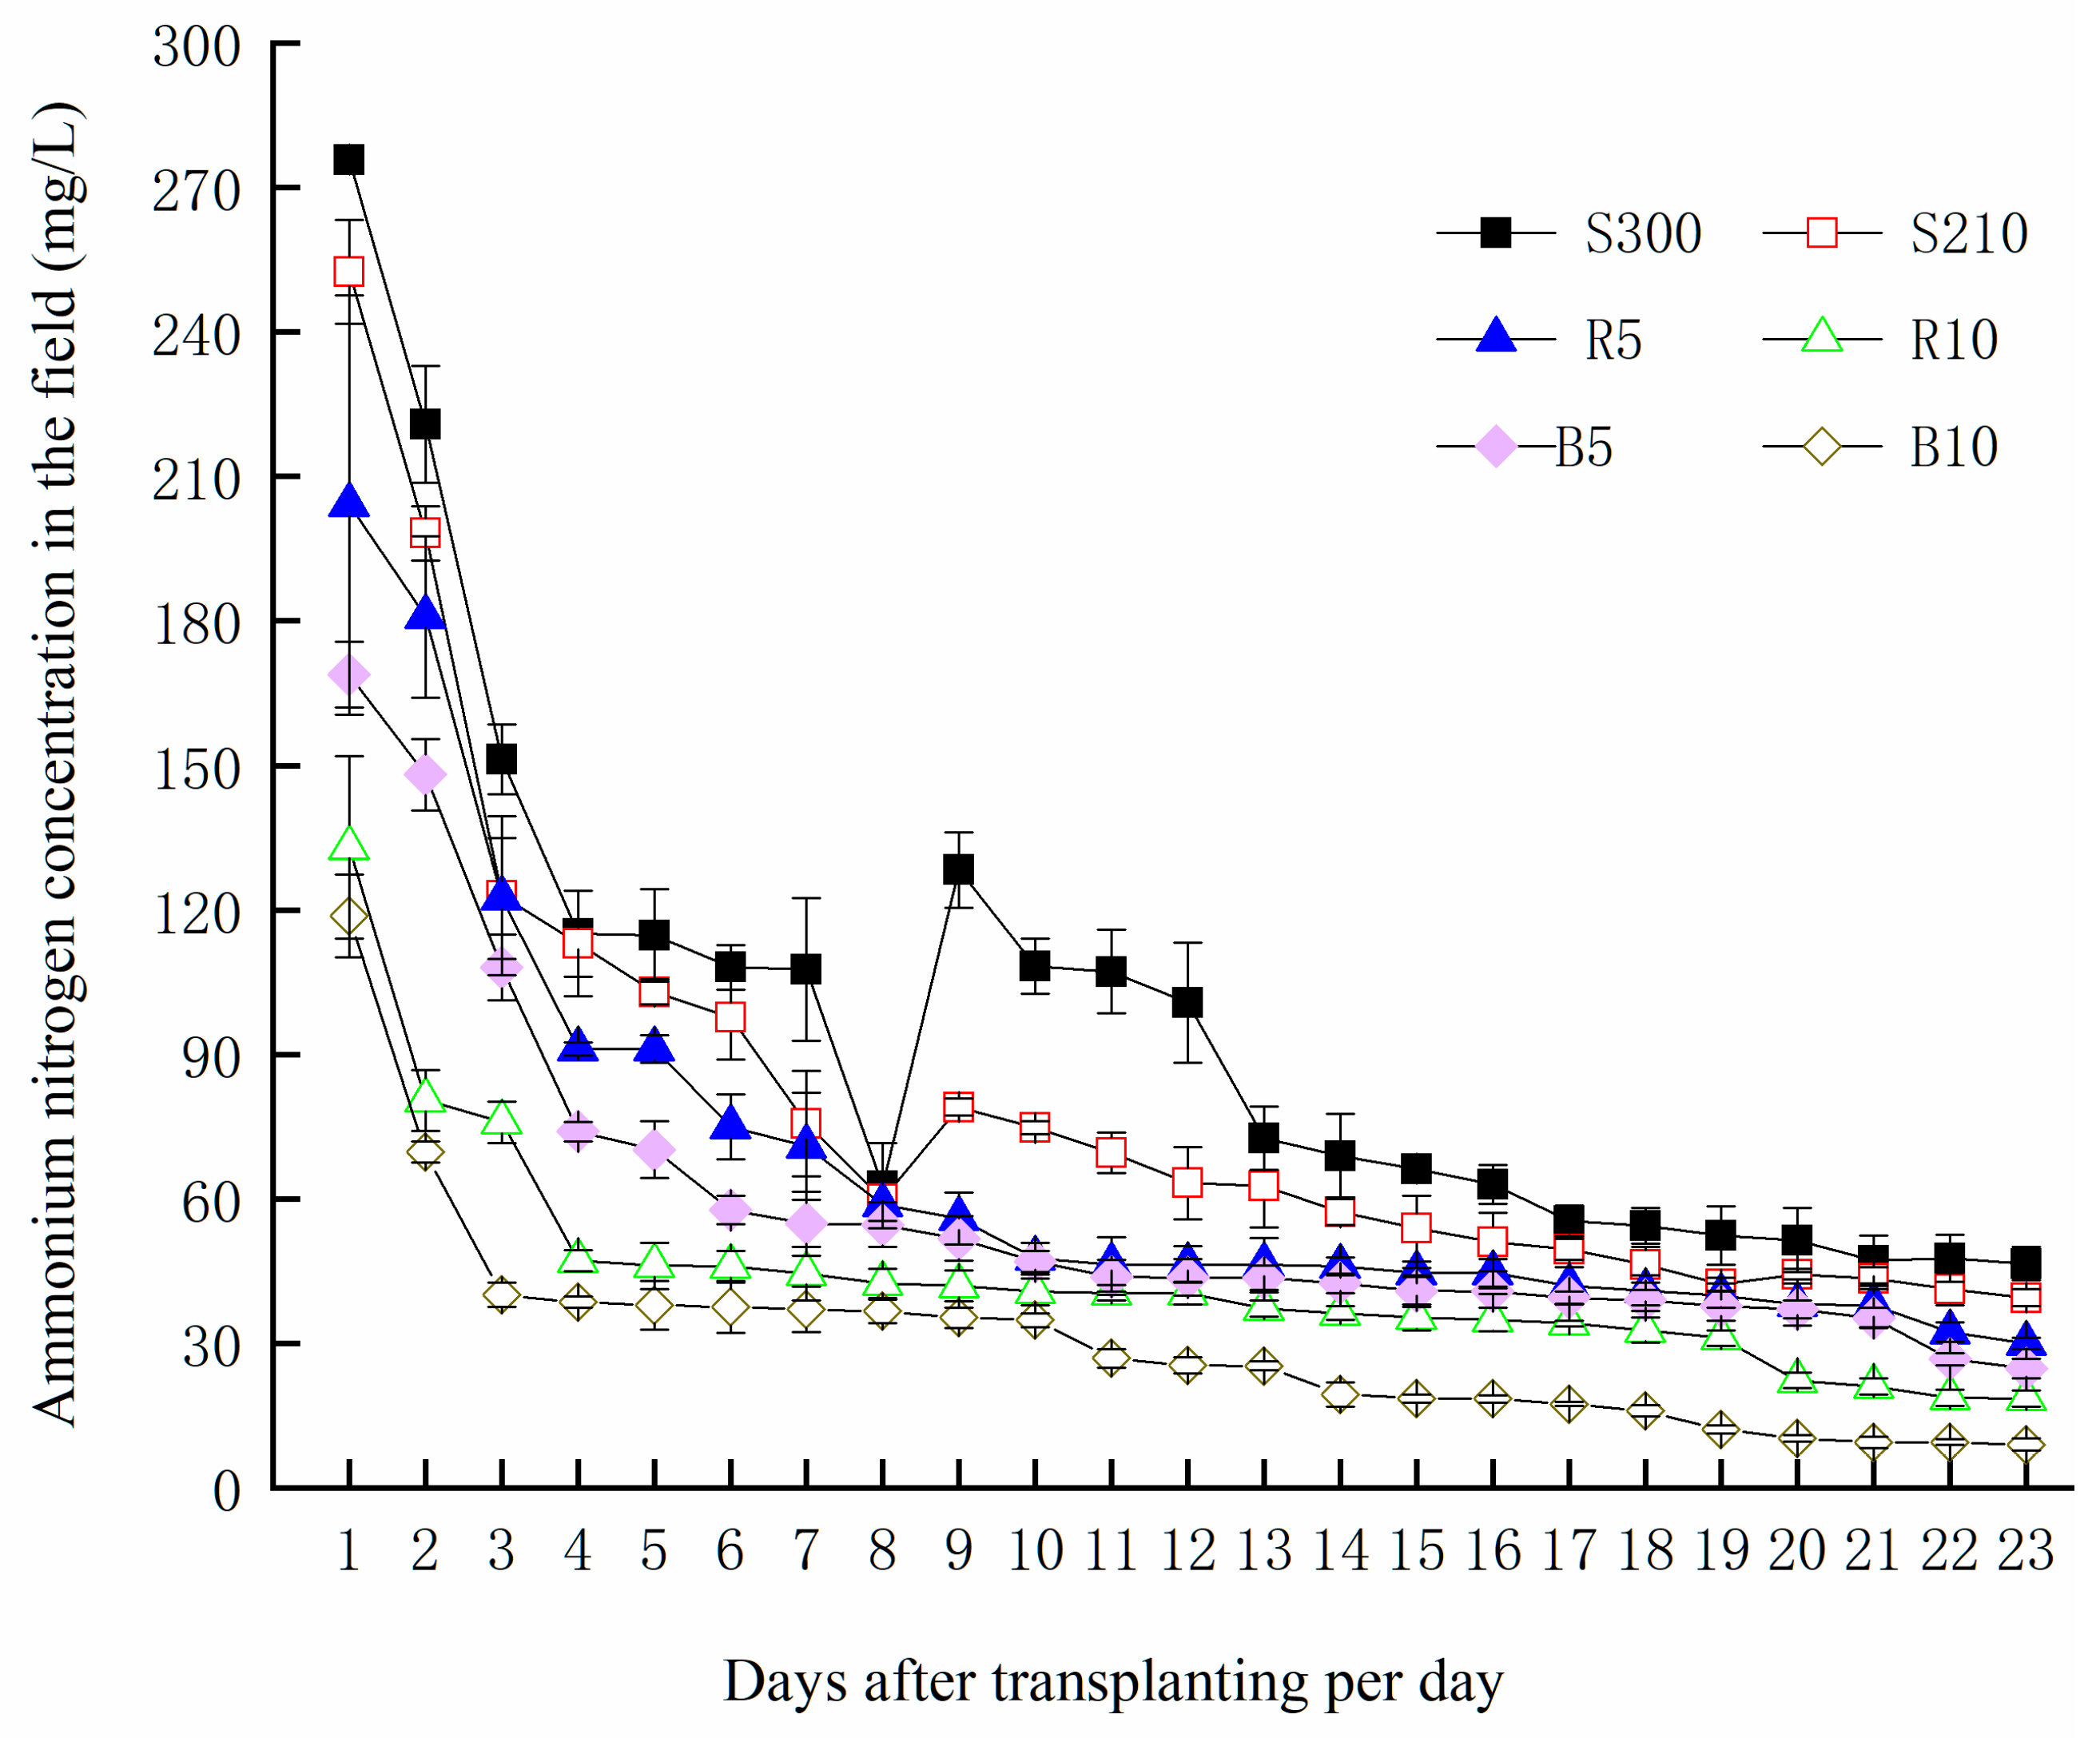
3.2.1. Vertical and Horizontal Distribution of Soil NH4+-N
3.2.2. Vertical and Horizontal Distribution of Soil NO3−-N
3.3. Effects of Fertilization Methods on Ammonia Volatilization in Paddy Field
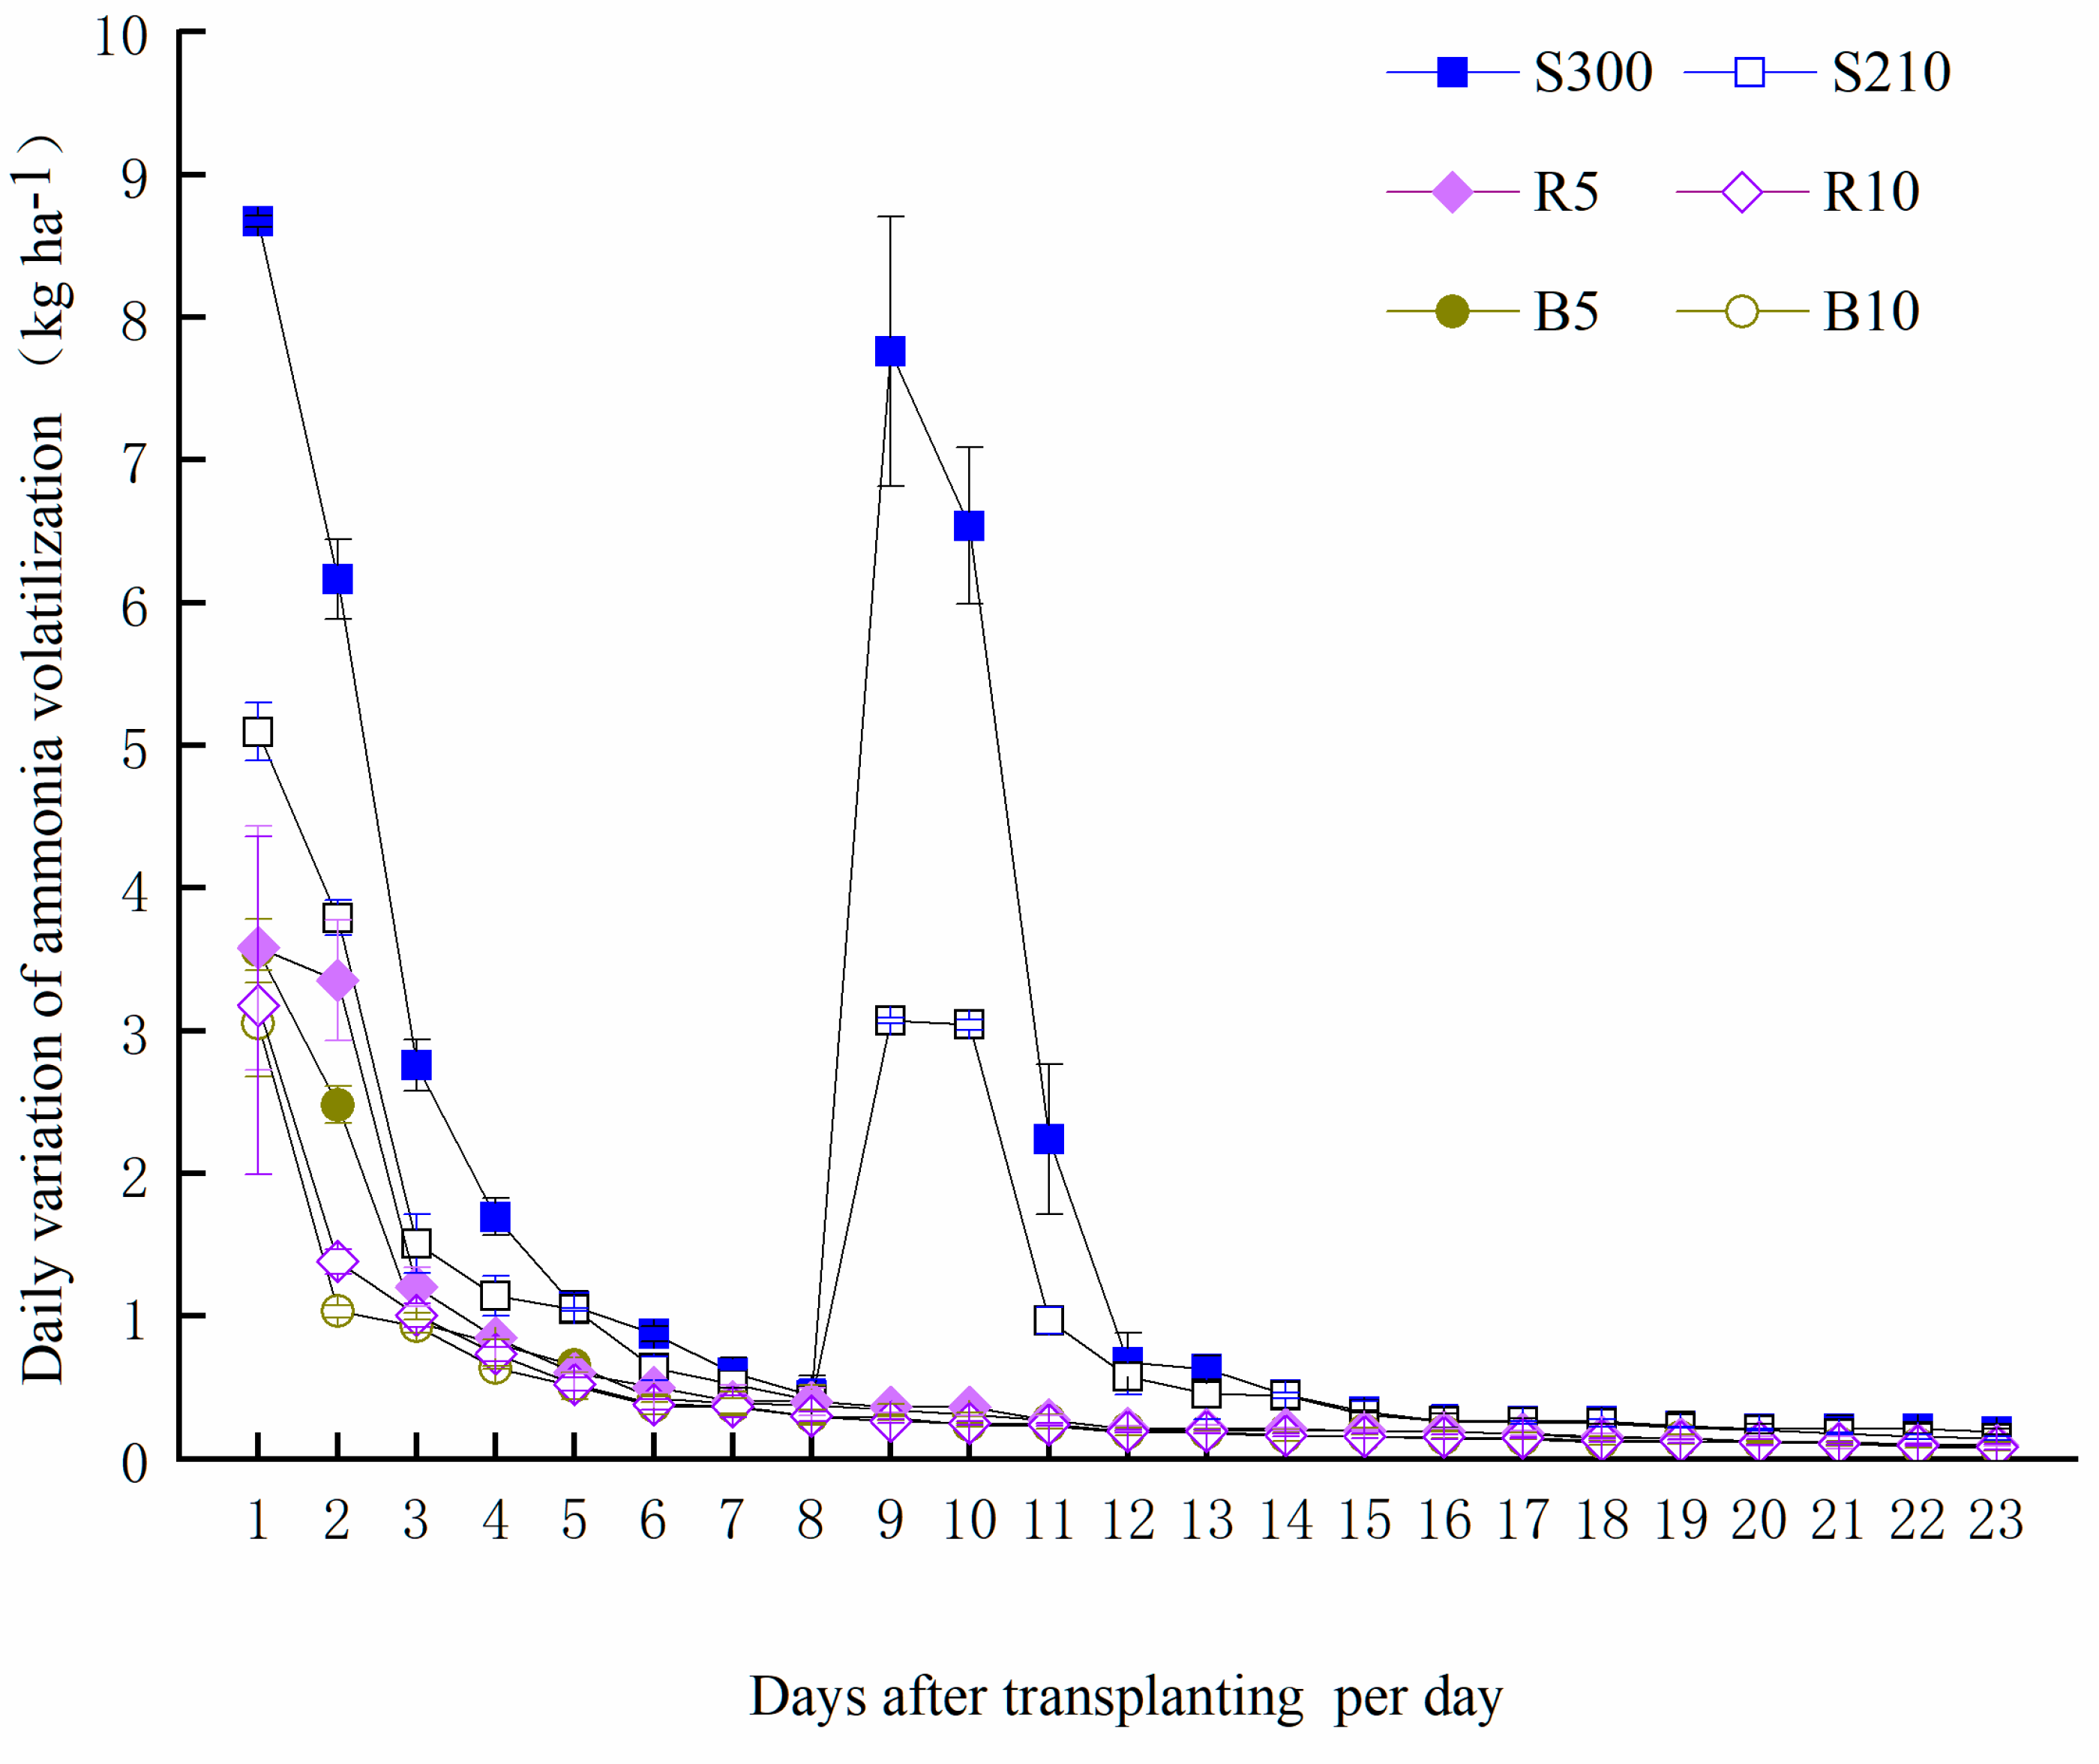
3.3.1. Dynamics of Ammonia Volatilization Flux
3.3.2. Ammonia Volatilization Loss and Loss Rate
3.3.3. NH4+-N Concentration in Surface Water
4. Discussion
4.1. Effects of Fertilization on Soil N Distribution
4.2. Effect of Fertilization on Ammonia Volatility in Paddy Field
4.3. Effects of Fertilization on Rice Growth
5. Conclusions
Author Contributions
Funding
Conflicts of Interest
References
- Deng, N.; Grassini, P.; Yang, H.; Huang, J.; Cassman, K.G.; Peng, S. Closing yield gaps for rice self-sufficiency in China. Nat. Commun. 2019, 10, 1725. [Google Scholar] [CrossRef]
- Li, Z.; Liu, Z.; Anderson, W.; Yang, P.; Wu, W.; Tang, H.; You, L. Chinese Rice Production Area Adaptations to Climate Changes, 1949–2010. Environ. Sci. Technol. 2015, 49, 2032–2037. [Google Scholar] [CrossRef]
- Li, S.; Tian, Y.; Wu, K.; Ye, Y.; Yu, J.; Zhang, J.; Liu, Q.; Hu, M.; Li, H.; Tong, Y.; et al. Modulating plant growth–metabolism coordination for sustainable agriculture. Nature 2018, 560, 595–600. [Google Scholar] [CrossRef] [PubMed]
- Yang, W.; Que, H.; Wang, S.; Zhu, A.; Zhang, Y.; He, Y.; Xin, X.; Zhang, X.; Ding, S. High temporal resolution measurements of ammonia emissions following different nitrogen application rates from a rice field in the Taihu Lake Region of China. Environ. Pollut. 2019, 257, 113489. [Google Scholar] [CrossRef]
- Wang, Y.; Lu, Y. Evaluating the potential health and economic effects of nitrogen fertilizer application in grain production systems of China. J. Clean. Prod. 2020, 264, 121635. [Google Scholar] [CrossRef]
- Yang, Y.; Li, N.; Ni, X.; Yu, L.; Yang, Y.; Wang, Q.; Liu, J.; Ye, Y.; Tao, L.; Liu, B.; et al. Combining deep flooding and slow-release urea to reduce ammonia emission from rice fields. J. Clean. Prod. 2019, 244, 118745. [Google Scholar] [CrossRef]
- Dong, Y.; Yuan, J.; Zhang, G.; Ma, J.; Hilario, P.; Liu, X.; Lu, S. Optimization of nitrogen fertilizer rate under integrated rice management in a hilly area of Southwest China. Pedosphere 2020, 30, 759–768. [Google Scholar] [CrossRef]
- Zhao, M.; Tian, Y.; Ma, Y.; Zhang, M.; Yao, Y.; Xiong, Z.; Yin, B.; Zhu, Z. Mitigating gaseous nitrogen emissions intensity from a Chinese rice cropping system through an improved management practice aimed to close the yield gap. Agric. Ecosyst. Environ. 2015, 203, 36–45. [Google Scholar] [CrossRef]
- Ding, W.; Xu, X.; He, P.; Zhang, J.; Cui, Z.; Zhou, W. Estimating regional N application rates for rice in China based on target yield, indigenous N supply, and N loss. Environ. Pollut. 2020, 263, 114408. [Google Scholar] [CrossRef]
- Liu, S.; Xie, Z.; Zeng, Y.; Liu, B.; Li, R.; Wang, Y.; Wang, L.; Qin, P.; Jia, B.; Xie, J. Effects of anthropogenic nitrogen discharge on dissolved inorganic nitrogen transport in global rivers. Glob. Chang. Biol. 2019, 25, 1493–1513. [Google Scholar] [CrossRef]
- Spiertz, J.H.J. Nitrogen, sustainable agriculture and food security: A review. Agron. Sustain. Dev. 2010, 30, 43–55. [Google Scholar] [CrossRef]
- Zhang, M.; Tian, Y.; Zhao, M.; Yin, B.; Zhu, Z. The assessment of nitrate leaching in a rice–wheat rotation system using an improved agronomic practice aimed to increase rice crop yields. Agric. Ecosyst. Environ. 2017, 241, 100–109. [Google Scholar] [CrossRef]
- Wang, H.Y.; Zhang, D.; Zhang, Y.T.; Zhai, L.M.; Yin, B.; Zhou, F.; Geng, Y.C.; Pan, J.T.; Luo, J.F.; Gu, B.J.; et al. Ammonia emissions from paddy fields are underestimated in China. Environ. Pollut. 2018, 235, 482–488. [Google Scholar] [CrossRef]
- Wang, G.; Zhang, R.; Gomez, M.E.; Yang, L.; Zamora, M.L.; Hu, M.; Lin, Y.; Peng, J.; Guo, S.; Meng, J.; et al. Persistent sulfate formation from London Fog to Chinese haze. Proc. Natl. Acad. Sci. USA 2016, 113, 13630–13635. [Google Scholar] [CrossRef]
- Li, Q.; Zhang, R.; Wang, Y. Interannual variation of the wintertime fog-haze days across central and eastern China and its relation with East Asian winter monsoon. Int. J. Clim. 2015, 36, 346–354. [Google Scholar] [CrossRef]
- Zhang, X.; Xiao, G.; Bol, R.; Wang, L.; Zhuge, Y.; Wu, W.; Li, H.; Meng, F. Influences of irrigation and fertilization on soil N cycle and losses from wheat–maize cropping system in northern China. Environ. Pollut. 2021, 278, 116852. [Google Scholar] [CrossRef]
- Ke, J.; He, R.; Hou, P.; Ding, C.; Ding, Y.; Wang, S.; Liu, Z.; Tang, S.; Ding, C.; Chen, L.; et al. Combined controlled-released nitrogen fertilizers and deep placement effects of N leaching, rice yield and N recovery in machine-transplanted rice. Agric. Ecosyst. Environ. 2018, 265, 402–412. [Google Scholar] [CrossRef]
- Yao, Y.; Zhang, M.; Tian, Y.; Zhao, M.; Zhang, B.; Zhao, M.; Zeng, K.; Yin, B. Urea deep placement for minimizing NH3 loss in an intensive rice cropping system. Field Crop. Res. 2018, 218, 254–266. [Google Scholar] [CrossRef]
- Wu, P.; Liu, F.; Chen, G.; Wang, J.; Huang, F.; Cai, T.; Zhang, P.; Jia, Z. Can deep fertilizer application enhance maize productivity by delaying leaf senescence and decreasing nitrate residue levels? Field Crop. Res. 2021, 277, 108417. [Google Scholar] [CrossRef]
- Hou, P.; Yuan, W.; Li, G.; Petropoulos, E.; Xue, L.; Feng, Y.; Xue, L.; Yang, L.; Ding, Y. Deep fertilization with controlled-release fertilizer for higher cereal yield and N utilization in paddies: The optimal fertilization depth. Agron. J. 2021, 113, 5027–5039. [Google Scholar] [CrossRef]
- Wu, P.; Chen, G.; Liu, F.; Cai, T.; Zhang, P.; Jia, Z. How does deep-band fertilizer placement reduce N2O emissions and increase maize yields? Agric. Ecosyst. Environ. 2021, 322, 107672. [Google Scholar] [CrossRef]
- Miah, A.M.; Gaihre, Y.K.; Hunter, G.; Singh, U.; Hossain, S.A. Fertilizer Deep Placement Increases Rice Production: Evidence from Farmers’ Fields in Southern Bangladesh. Agron. J. 2016, 108, 805–812. [Google Scholar] [CrossRef]
- Zhang, M.; Yao, Y.; Zhao, M.; Zhang, B.; Tian, Y.; Yin, B.; Zhu, Z. Integration of urea deep placement and organic addition for improving yield and soil properties and decreasing N loss in paddy field. Agric. Ecosyst. Environ. 2017, 247, 236–245. [Google Scholar] [CrossRef]
- Wang, D.; Xu, C.; Yan, J.; Zhang, X.; Chen, S.; Chauhan, B.; Wang, L.; Zhang, X. 15 N tracer-based analysis of genotypic differences in the uptake and partitioning of N applied at different growth stages in transplanted rice. Field Crop. Res. 2017, 211, 27–36. [Google Scholar] [CrossRef]
- Zhu, C.; Xiang, J.; Zhang, Y.; Zhang, Y.; Zhu, D.; Chen, H. Mechanized transplanting with side deep fertilization increases yield and nitrogen use efficiency of rice in Eastern China. Sci. Rep. 2019, 9, 5653. [Google Scholar] [CrossRef]
- Nayak, P.; Panda, B.; Lal, B.; Gautam, P.; Poonam, A.; Shahid, M.; Tripathi, R.; Kumar, U.; Mohapatra, S.; Jambhulkar, N. Ecological mechanism and diversity in rice based integrated farming system. Ecol. Indic. 2018, 91, 359–375. [Google Scholar] [CrossRef]
- Chaklader, R.; Fotedar, R.; Howieson, J.; Siddik, M.A.; Foysal, J. The ameliorative effects of various fish protein hydrolysates in poultry by-product meal based diets on muscle quality, serum biochemistry and immunity in juvenile barramundi, Lates calcarifer. Fish Shellfish Immunol. 2020, 104, 567–578. [Google Scholar] [CrossRef]
- Martins, M.R.; Jantalia, C.P.; Polidoro, J.C.; Batista, J.N.; Alves, B.J.; Boddey, R.M.; Urquiaga, S. Nitrous oxide and ammonia emissions from N fertilization of maize crop under no-till in a Cerrado soil. Soil Tillage Res. 2015, 151, 75–81. [Google Scholar] [CrossRef]
- Xia, H.; Song, T.; Wang, L.; Jiang, L.; Zhou, Q.; Wang, W.; Liu, L.; Yang, P.; Zhang, X. Effects of dietary toxic cyanobacteria and ammonia exposure on immune function of blunt snout bream (Megalabrama amblycephala). Fish Shellfish Immunol. 2018, 78, 383–391. [Google Scholar] [CrossRef]
- Van Vo, B.; Siddik, M.A.; Fotedar, R.; Chaklader, R.; Foysal, J.; Pham, H.D. Digestibility and water quality investigations on the processed peanut (Arachis hypogaea) meal fed barramundi (Lates calcarifer) at various inclusion levels. Aquac. Rep. 2020, 18, 100474. [Google Scholar] [CrossRef]
- Guo, L.; Ning, T.; Nie, L.; Li, Z.; Lal, R. Interaction of deep placed controlled-release urea and water retention agent on nitrogen and water use and maize yield. Eur. J. Agron. 2016, 75, 118–129. [Google Scholar] [CrossRef]
- Peng, S.Q.; Zhang, W.; Hou, H.; Wang, H.W.; Chen, A.; Wei, W. Effects of reduction and deep placement of nitrogen fertilizer on rice yield and N2O emissions from double cropping paddy field. Chin. J. Ecol. 2019, 38, 153–160. [Google Scholar] [CrossRef]
- Liu, T.; Fan, D.; Zhang, X.; Chen, J.; Li, C.; Cao, C. Deep placement of nitrogen fertilizers reduces ammonia volatilization and increases nitrogen utilization efficiency in no-tillage paddy fields in central China. Field Crop. Res. 2015, 184, 80–90. [Google Scholar] [CrossRef]
- Freney, J.R.; Leuning, R.; Simpson, J.R.; Denmead, O.T.; Muirhead, W.A. Estimating Ammonia Volatilization from Flooded Rice Fields by Simplified Techniques. Soil Sci. Soc. Am. J. 1985, 49, 1049–1054. [Google Scholar] [CrossRef]
- Zhang, Y.; Liu, H.; Guo, Z.; Zhang, C.; Sheng, J.; Chen, L.; Luo, Y.; Zheng, J. Direct-seeded rice increases nitrogen runoff losses in southeastern China. Agric. Ecosyst. Environ. 2018, 251, 149–157. [Google Scholar] [CrossRef]
- Garnett, T.; Conn, V.; Kaiser, B.N. Root based approaches to improving nitrogen use efficiency in plants. Plant Cell Environ. 2009, 32, 1272–1283. [Google Scholar] [CrossRef]
- Rochette, P.; Angers, D.A.; Chantigny, M.H.; Gasser, M.-O.; Macdonald, J.D.; Pelster, D.; Bertrand, N. Ammonia Volatilization and Nitrogen Retention: How Deep to Incorporate Urea? J. Environ. Qual. 2013, 42, 1635–1642. [Google Scholar] [CrossRef]
- Zhang, C.; Che, Y.-P.; Li, Z.-P. Translocation and transformation characteristics of fertilizer nitrogen in paddy soil: A study with simulated soil column. Chin. J. Appl. Ecol. 2011, 22, 3236–3242. [Google Scholar]
- Wu, M.; Li, G.; Li, W.; Liu, J.; Liu, M.; Jiang, C.; Li, Z. Nitrogen Fertilizer Deep Placement for Increased Grain Yield and Nitrogen Recovery Efficiency in Rice Grown in Subtropical China. Front. Plant Sci. 2017, 8, 1227. [Google Scholar] [CrossRef]
- Wang, D.; Chang, Y.; Xu, C.; Wang, Z.; Chen, S.; Chu, G.; Zhang, X. Soil nitrogen distribution and plant nitrogen utilization in direct-seeded rice in response to deep placement of basal fertilizer-nitrogen. Rice Sci. 2019, 26, 404–415. [Google Scholar] [CrossRef]
- Koudjega, K.; Ablede, K.A.; Lawson, I.Y.D.; Abekoe, M.K.; Owusu-Bennoah, E.; Tsatsu, D.K. Reducing Ammonia Volatilization and Improving Nitrogen use Efficiency of Rice at Different Depths of Urea Supergranule Application. Commun. Soil Sci. Plant Anal. 2019, 50, 974–986. [Google Scholar] [CrossRef]
- Cao, Y.; Yin, B. Effects of integrated high-efficiency practice versus conventional practice on rice yield and N fate. Agric. Ecosyst. Environ. 2015, 202, 1–7. [Google Scholar] [CrossRef]
- Shang, Q.; Gao, C.; Yang, X.; Wu, P.; Ling, N.; Shen, Q.; Guo, S. Ammonia volatilization in Chinese double rice-cropping systems: A 3-year field measurement in long-term fertilizer experiments. Biol. Fertil. Soils 2013, 50, 715–725. [Google Scholar] [CrossRef]
- Colt, J. Water quality requirements for reuse systems. Aquac. Eng. 2006, 34, 143–156. [Google Scholar] [CrossRef]
- Ip, Y.K.; Chew, S.F. Air-breathing and excretory nitrogen metabolism in fishes. Acta Histochem. 2018, 120, 680–690. [Google Scholar] [CrossRef]
- Stormer, J.; Jensen, F.; Rankin, J. Uptake of nitrite, nitrate, and bromide in rainbow trout, (Oncorhynchus mykiss): Effects on ionic balance. Can. J. Fish. Aquat. Sci. 1996, 53, 1943–1950. [Google Scholar] [CrossRef]
- Pinto, W.; Aragão, C.; Soares, F.; Dinis, M.T.; Conceição, L.E.C. Growth, stress response and free amino acid levels in Senegalese sole (Solea senegalensis Kaup 1858) chronically exposed to exogenous ammonia. Aquac. Res. 2007, 38, 1198–1204. [Google Scholar] [CrossRef]
- Ye, Y.; Liang, X.; Chen, Y.; Liu, J.; Gu, J.; Guo, R.; Li, L. Alternate wetting and drying irrigation and controlled-release nitrogen fertilizer in late-season rice. Effects on dry matter accumulation, yield, water and nitrogen use. Field Crop. Res. 2013, 144, 212–224. [Google Scholar] [CrossRef]
- Mei, Y.; Dong, W.; Qiang, W.; Kai, W.; Cui, K.; Huang, J. Dry Matter and Nitrogen Partitioning in Rice Genotypes Varying in Different Nitrogen Harvest Index. Philipp. J. Crop Sci. 2011, 36, 1–9. [Google Scholar]
- Pan, J.; Liu, Y.; Zhong, X.; Lampayan, R.M.; Singleton, G.R.; Huang, N.; Liang, K.; Peng, B.; Tian, K. Grain yield, water productivity and nitrogen use efficiency of rice under different water management and fertilizer-N inputs in South China. Agric. Water Manag. 2017, 184, 191–200. [Google Scholar] [CrossRef]
- Jing, J.; Zhang, F.; Rengel, Z.; Shen, J. Localized fertilization with P plus N elicits an ammonium-dependent enhancement of maize root growth and nutrient uptake. Field Crop. Res. 2012, 133, 176–185. [Google Scholar] [CrossRef]
- Liu, H.; Won, P.L.; Banayo, N.P.; Nie, L.; Peng, S.; Kato, Y. Late-season nitrogen applications improve grain yield and fertilizer-use efficiency of dry direct-seeded rice in the tropics. Field Crop. Res. 2019, 233, 114–120. [Google Scholar] [CrossRef]
- Kapoor, V.; Singh, U.; Patil, S.K.; Magre, H.; Shrivastava, L.K.; Mishra, V.N.; Das, R.O.; Samadhiya, V.K.; Sanabria, J.; Diamond, R. Rice Growth, Grain Yield, and Floodwater Nutrient Dynamics as Affected by Nutrient Placement Method and Rate. Agron. J. 2008, 100, 526–536. [Google Scholar] [CrossRef]
- Xiang, J.; Haden, V.R.; Peng, S.; Bouman, B.A.; Huang, J.; Cui, K.; Visperas, R.M.; Zhu, D.; Zhang, Y.; Chen, H. Effect of deep placement of nitrogen fertilizer on growth, yield, and nitrogen uptake of aerobic rice. Aust. J. Crop Sci. 2013, 7, 870–877. [Google Scholar]
- Huda, A.; Gaihre, Y.K.; Islam, M.R.; Singh, U.; Islam, R.; Sanabria, J.; Satter, M.A.; Afroz, H.; Halder, A.; Jahiruddin, M. Floodwater ammonium, nitrogen use efficiency and rice yields with fertilizer deep placement and alternate wetting and drying under triple rice cropping systems. Nutr. Cycl. Agroecosyst. 2016, 104, 53–66. [Google Scholar] [CrossRef]


| Treatment | Fertilizer Types | Fertilizer Depths | Nitrogen Application Rate |
|---|---|---|---|
| N0 | - | - | - |
| S300 | surface application | 0 cm | 300 kg N ha−1 |
| S210 | surface application | 0 cm | 210 kg N ha−1 |
| R5 | row application | 5 cm | 210 kg N ha−1 |
| R10 | row application | 10 cm | 210 kg N ha−1 |
| B5 | deep application | 5 cm | 210 kg N ha−1 |
| B10 | deep application | 10 cm | 210 kg N ha−1 |
| Growth Period | Treatment | Dry Biomass (g Plot−1) | |||||
|---|---|---|---|---|---|---|---|
| Leaf | Stem and Sheath | Panicle | Root | Shoot | Shoot + Root | ||
| Tillering | S300 | 17.82 ± 0.36 | 22.14 ± 0.40 b | - | 19.74 ± 0.72 a | 39.96 ± 0.75 b | 59.70 ± 1.15 a |
| S210 | 16.98 ± 0.48 | 17.90 ± 0.04 d | - | 14.31 ± 0.09 c | 34.88 ± 0.45 c | 49.20 ± 0.36 c | |
| R5 | 16.33 ± 1.27 | 19.79 ± 0.25 c | - | 15.63 ± 0.50 b | 36.12 ± 1.46 c | 51.75 ± 1.74 c | |
| R10 | 17.47 ± 0.13 | 21.94 ± 0.48 b | - | 17.11 ± 0.41 b | 39.41 ± 0.35 b | 56.52 ± 0.52 b | |
| B5 | 16.69 ± 1.05 | 20.02 ± 0.37 c | - | 18.91 ± 0.39 a | 36.71 ± 0.90 c | 55.62 ± 1.05 b | |
| B10 | 17.62 ± 0.32 | 26.46 ± 0.58 a | - | 16.45 ± 0.69 b | 44.08 ± 0.83 a | 60.53 ± 0.14 a | |
| p = 0.678 | p < 0.05 | p < 0.05 | p < 0.05 | p < 0.05 | |||
| Full heading | S300 | 65.21 ± 2.05 a | 185.70 ± 1.55 a | 39.02 ± 0.52 a | 87.96 ± 0.27 | 288.08 ± 7.36 a | 376.04 ± 7.10 a |
| S210 | 58.19 ± 1.22 b | 166.14 ± 1.49 b | 33.28 ± 0.50 b | 78.94 ± 2.64 | 257.61 ± 0.84 b | 336.55 ± 2.96 b | |
| R5 | 59.27 ± 0.46 ab | 180.07 ± 0.97 a | 35.13 ± 0.35 b | 80.90 ± 6.38 | 274.47 ± 1.04 ab | 355.37 ± 7.42 ab | |
| R10 | 61.67 ± 3.15 a | 183.85 ± 5.76 a | 36.90 ± 1.88 a | 84.91 ± 1.88 | 284.43 ± 6.04 a | 367.34 ± 4.18 a | |
| B5 | 61.14 ± 0.20 a | 180.09 ± 1.83 a | 35.50 ± 0.88 ab | 82.62 ± 3.34 | 276.72 ± 1.71 ab | 359.34 ± 4.86 ab | |
| B10 | 66.27 ± 2.13 a | 186.41 ± 3.24 a | 39.12 ± 0.26 a | 86.86 ± 1.88 | 291.80 ± 4.26 a | 378.66 ± 3.66 a | |
| p = 0.054 | p < 0.05 | p < 0.05 | p = 0.403 | p < 0.05 | p < 0.05 | ||
| Filling | S300 | 61.20 ± 0.26 a | 174.19 ± 2.16 a | 81.40 ± 0.41 a | 152.68 ± 0.38 a | 316.79 ± 2.07 a | 469.47 ± 2.24 a |
| S210 | 44.16 ± 0.49 c | 153.30 ± 0.45 d | 63.94 ± 0.65 c | 135.43 ± 1.03 c | 261.40 ± 0.20 e | 395.83 ± 1.20 e | |
| R5 | 45.59 ± 1.80 c | 164.97 ± 1.56 c | 70.32 ± 0.42 b | 144.48 ± 0.58 b | 273.77 ± 3.19 d | 425.36 ± 1.39 d | |
| R10 | 54.37 ± 0.86 b | 174.80 ± 1.60 a | 70.80 ± 0.23 b | 151.25 ± 0.66 a | 299.97 ± 0.96 b | 451.22 ± 1.45 b | |
| B5 | 52.72 ± 0.47 b | 157.86 ± 1.36 b | 70.63 ± 0.06 b | 145.91 ± 1.96 b | 288.33 ± 1.98 c | 434.23 ± 2.65 c | |
| B10 | 61.49 ± 0.75 a | 175.99 ± 0.40 a | 82.46 ± 1.90 a | 154.56 ± 1.69 a | 319.93 ± 2.07 a | 474.49 ± 3.72 a | |
| p < 0.05 | p < 0.05 | p < 0.05 | p < 0.05 | p < 0.05 | p < 0.05 | ||
| Maturity | S300 | 57.36 ± 0.55 a | 171.23 ± 0.29 a | 101.01 ± 0.75 a | 168.90 ± 1.45 a | 329.60 ± 1.34 a | 498.49 ± 1.60 a |
| S210 | 38.91 ± 1.56 d | 147.79 ± 2.17 cd | 69.73 ± 4.81 d | 157.32 ± 2.73 c | 256.43 ± 5.43 d | 413.75 ± 6.21 d | |
| R5 | 45.54 ± 0.19 c | 152.15 ± 1.54 c | 84.13 ± 2.22 c | 162.87 ± 1.75 b | 281.83 ± 2.45 c | 444.70 ± 4.01 c | |
| R10 | 52.19 ± 0.39 b | 167.49 ± 2.28 b | 96.51 ± 1.80 a | 168.11 ± 1.15 a | 316.19 ± 3.11 b | 484.30 ± 1.97 b | |
| B5 | 49.92 ± 0.59 c | 156.21 ± 2.31 c | 94.53 ± 2.41 ab | 164.87 ± 1.44 ab | 300.37 ± 3.55 c | 465.53 ± 2.95 c | |
| B10 | 57.89 ± 0.64 a | 173.88 ± 0.82 a | 103.07 ± 2.00 a | 170.41 ± 1.13 a | 334.83 ± 2.55 a | 505.25 ± 1.45 a | |
| p < 0.05 | p < 0.05 | p < 0.05 | p < 0.05 | p < 0.05 | p < 0.05 | ||
| Treatment | N Uptake of Aboveground Parts of Plants | NRE | NAE | Grain Yield |
|---|---|---|---|---|
| g Plot−1 | % | kg kg−1 | t ha−1 | |
| S300 | 4.42 ± 0.03 a | 24.66 ± 0.19 d | 4.94 ± 0.53 c | 32.47 ± 2.56 a |
| S210 | 3.22 ± 0.12 d | 23.26 ± 1.14 d | 3.65 ± 0.47 d | 20.93 ± 1.58 b |
| R5 | 3.64 ± 0.01 c | 27.46 ± 0.14 c | 4.95 ± 0.94 c | 25.32 ± 3.19 b |
| R10 | 4.07 ± 0.03 b | 31.77 ± 0.26 b | 6.23 ± 0.17 ab | 29.67 ± 0.56 a |
| B5 | 3.92 ± 0.09 b | 30.22 ± 0.91 b | 6.10 ± 0.62 b | 29.23 ± 2.11 ab |
| B10 | 4.44 ± 0.07 a | 35.42 ± 0.65 a | 7.14 ± 1.09 a | 32.73 ± 3.69 a |
| N0 | 0.87 ± 0.01 e | - | - | 8.56 ± 0.12 c |
| p < 0.05 | p < 0.05 | p < 0.05 | p < 0.05 |
| Treatment | Nitrogen Application | Total Ammonia Volatilization | Ammonia Volatilization Loss Rate |
|---|---|---|---|
| kg ha−1 | kg ha−1 | % | |
| N0 | 0 | 5.85 ± 2.00 g | - |
| S300 | 300 | 42.76 ± 1.20 a | 12.3 |
| S210 | 210 | 24.70 ± 0.15 b | 9.0 |
| R5 | 210 | 13.84 ± 1.27 c | 3.8 |
| R10 | 210 | 10.30 ± 1.16 e | 2.1 |
| B5 | 210 | 12.47 ± 0.30 d | 3.2 |
| B10 | 210 | 9.57 ± 0.55 f | 1.8 |
Publisher’s Note: MDPI stays neutral with regard to jurisdictional claims in published maps and institutional affiliations. |
© 2022 by the authors. Licensee MDPI, Basel, Switzerland. This article is an open access article distributed under the terms and conditions of the Creative Commons Attribution (CC BY) license (https://creativecommons.org/licenses/by/4.0/).
Share and Cite
Zhou, P.; Zhang, Z.; Du, L.; Sun, G.; Su, L.; Xiao, Z.; Li, C.; Wang, Z.; Xiao, Z.; Hu, T.; et al. Effect of Deep Placement of Large Granular Fertilizer on Ammonia Volatilization, Soil Nitrogen Distribution and Rice Growth. Agronomy 2022, 12, 2066. https://doi.org/10.3390/agronomy12092066
Zhou P, Zhang Z, Du L, Sun G, Su L, Xiao Z, Li C, Wang Z, Xiao Z, Hu T, et al. Effect of Deep Placement of Large Granular Fertilizer on Ammonia Volatilization, Soil Nitrogen Distribution and Rice Growth. Agronomy. 2022; 12(9):2066. https://doi.org/10.3390/agronomy12092066
Chicago/Turabian StyleZhou, Pingyao, Zhen Zhang, Linsen Du, Geng Sun, Liang Su, Zhiyu Xiao, Chunwang Li, Zhichang Wang, Zhihua Xiao, Teng Hu, and et al. 2022. "Effect of Deep Placement of Large Granular Fertilizer on Ammonia Volatilization, Soil Nitrogen Distribution and Rice Growth" Agronomy 12, no. 9: 2066. https://doi.org/10.3390/agronomy12092066