Article

Agronomic and Physiological Indices for Reproductive Stage Heat Stress Tolerance in Green Super Rice

1
National Institute for Genomics and Advanced Biotechnology, National Agricultural Research Center (NARC), Park Road, Islamabad 45500, Pakistan
2
Department of Botany and Plant Science, University of California, Riverside, CA 92507, USA
3
Department of Biochemistry and Biotechnology, University of Gujrat, Gujrat 50700, Pakistan
4
Institute of Crop Science, Chinese Academy of Agricultural Sciences, Beijing 100081, China
5
International Rice Research Institute, Los Baños 4031, Laguna, Philippines
6
Department of Biotechnology, Chonnam National University, Yeosu 59626, Korea
*
Authors to whom correspondence should be addressed.
These authors contributed equally to this work.
Agronomy 2022, 12(8), 1907; https://doi.org/10.3390/agronomy12081907
Submission received: 26 May 2022 / Revised: 27 July 2022 / Accepted: 12 August 2022 / Published: 14 August 2022

Abstract

:
Optimum growing temperature is necessary for maximum yield-potential in any crop. The global atmospheric temperature is changing more rapidly and irregularly every year. High temperature at the flowering/reproductive stage in rice causes partial to complete pollen sterility, resulting in significant reduction in grain yield. Green Super Rice (GSR) is an effort to develop an elite rice type that can withstand multiple environmental stresses and maintain yield in different agro-ecological zones. The current study was performed to assess the effect of heat stress on agronomic and physiological attributes of GSR at flowering stage. Twenty-two GSR lines and four local checks were evaluated under normal and heat-stress conditions for different agro-physiological parameters, including plant height (PH), tillers per plant (TPP), grain yield per plant (GY), straw yield per plant (SY), harvest index (HI), 1000-grain weight (GW), grain length (GL), cell membrane stability (CMS), normalized difference vegetative index (NDVI), and pollen fertility percentage (PFP). Genotypes showed high significant variations for all the studied parameters except NDVI. Association and principal component analysis (PCA) explained the genetic diversity of the genotypes, and relationship between the particular parameters and grain yield. We found that GY, along with other agronomic traits, such as TPP, SY, HI, and CMS, were greatly affected by heat stress in most of the genotypes, while PH, GW, GL, PFP, and NDVI were affected only in a few genotypes. Outperforming NGSR-16 and NGSR-18 in heat stress could be utilized as a parent for the development of heat-tolerant rice. Moreover, these findings will be helpful in the prevention and management of heat stress in rice.

1. Introduction

Rice (Oryza sativa L.) is considered as one of the most essential food crops around the world, especially Asia, Latin America, and Africa [1,2]. It constitutes nearly 20% of overall calorie intake worldwide [2], with up to 80% of calorie ingestion in Asia [3]. Global rice production is direly needed to increase at a growth rate of 1.0–1.2% and grain yield must increase by 0.6–0.9% annually to feed the rapidly growing population, comprising a projected increase of nearly 2 billion people up to the 2050s [4,5]. Agricultural crops are more prone to abiotic stresses due to irregular and unsteady climatic changes [6,7,8,9]. Atmospheric temperature is one of the most critical variables determining the seasonal growth and geographic cultivation and distribution of crops [10,11,12]. An increase in the global mean surface temperature of 0.85 °C was observed between 1880 to 2012 and future projections forecast a 3.0–5.0 °C increase by the end of this century [13] and 2.0 to 4.0 °C until 2050 in Southeast Asia, specifically [14]. Relative to the period from 1900 to 2000, the climatic observations through various models have projected a high (more than 90%) probability of temperature-increase during crop growing season in the tropical and subtropical regions of Asia, such as China, by the year 2100 [15,16].
According to projections, it is expected that environmental fluctuations, especially high temperature stress, may cause a 41% yield decline by end of this century [17,18]. High temperature stress destructively impacts the rice metabolism in all growth phases [19,20,21]. Rice seedlings are very sensitive to the critical high temperature of 35 °C [22]. Further elevation beyond the critical high temperature can be destructive and may lead to plant death at respective growth stages [18,23]. The frequent occurrence of extreme climatic events, such as high temperature, leads to adverse impacts on rice growth and development.
Flowering in rice is one of the most critical phases in the context of high temperature stress because it could reduce the grain yield due to pollen sterility, poor grain-filling, low grain weight accumulation, and undermined seed setting [24]. Rice is sensitive to heat stress and the threshold temperature for rice at the anthesis and flowering stages are 33.7 °C and 35 °C, respectively [25,26]. High temperature stress also impacts the physiological processes of rice, such as chlorophyll contents, photosynthesis, respiration, and RuBP carboxylase activities [27]. High temperature stress above 38 °C inhibits the spikelet formation associated with the decomposition and synthesis of cytokines [28], and spikelet differentiation aggravates spikelet degeneration and reduces the overall number of spikelets through peroxide accumulation, which destructs the cell division and construction [29,30,31]. Additionally, the incidence of high temperature stress inhibits the anther filling and panicle initiation phase, which may lead to a decrease in pollen activities inducted by the impeded development of pollen mother cells and abnormalities in the decomposition of the tapetum [32,33]. Recently, studies have shown that high temperature stress could cause spikelet sterility due to a reduction in pollen vitality, vigor, and viability, and also due to the inhibition of anther dehiscence [34,35] and obstruction of pollen tube germination [36,37]. High temperature stress could also cause the insufficient accumulation of nutrients in pollens, which may lead to a reduction in pollen activities, sugar transport, accumulation of peroxides, and carbon metabolism [38,39]. High temperature stress at the flowering stage also effects the stigma vitality and pollen tube elongation [37].
Self-adaptability in the rice plant and responses to high temperature stress greatly depends on several factors, such as the intensity and duration of high temperature stress, growth period, plant size and age, and rice genotypes. To address this challenge, natural variations in rice germplasm under drought stress could be utilized to evaluate the associated traits of stress-tolerant genotypes [40,41]. Target breeding programs could be exploited as an important and essential genetic breeding resource to stimulate the genetic variations through hybridization. Aiming at this, studies have been initiated focusing on green super rice (GSR), an elite and highly water- and nutrient-use efficient rice type [42,43,44]. Based on the information on cloned green genes and loci, large-scale cross- and backcross-breeding was conducted to generate IL populations and lines abundant in green traits with wild rice, core germplasm, and specific local varieties as the donors [45]. The GSR lines were developed by combining genes from different native and non-native sources and required fewer fertilizers, pesticides, and irrigations. These lines also have greater stress tolerance without compromising the high yield and quality [46].
This study was conducted with the aim of investigating and evaluating the mechanisms of high temperature stress-tolerance through the identification of high temperature-responsive morpho-physiological traits of different GSR lines along with local rice cultivars. GSR lines showed several genotypic differences on high temperature stress tolerance; however, the physiological and biochemical heat-tolerance mechanisms are rarely considered. Other major aim of the study was the investigation of mechanisms that how high temperature incidence on flowering impacts the growth, yield, and quality of rice. The acquired research knowledge will be the basis for sustainable GSR production systems and the breeding of novel rice genotypes in order to optimize the net grain yield and nutritional quality, ultimately moving towards human health by decreasing poverty in densely-populated rice regions.

2. Materials and Methods

2.1. Experimental Site and Design

Healthy seeds of 22 green super rice (GSR) varieties and four local controls (IR-6, Kisan Basmati, Kashmir Basmati, and NIAB-B-2016) were obtained from CAAS, China, and NIGAB, Pakistan, respectively. Previously, Kashmir Basmati was reported as a heat-tolerant genotype, while the NIAB-B-2016 as a susceptible variant [23]. All four controls are normally high-yielding rice varieties grown in Pakistan. The seeds were sown at National Institute for Genomics and Advanced Biotechnology (NIGAB), National Agricultural Research Center (33.684° N and 73.048° E), Islamabad, Pakistan. During the rice growing season of 2020, the seeds of selected lines were placed in trays containing 128 wells filled with a mixture of soil, sand, and peat moss, all containing essential nutrients. The transplantation of the 35-days-old seedlings was carried out on 20 July 2020. For this purpose, randomized complete block design (split plot) with three replicates was followed. Two sets of 26 genotypes were transplanted in the field (one for control and one for heat). Each plot consisted of five rows with 10 plants each. Row-to-row and plant-to-plant distance were kept at 30 cm [4]. Recommended agronomic practices were followed.
At the flowering stage (pre-anthesis), a tunnel was prepared to cover the plants with a polythene sheet and high temperature was maintained (40–45 °C) to apply heat stress from 10:00 a.m. to 03:00 p.m. After 03:00 pm, polythene sheets were removed daily to reduce the temperature (25–35 °C). Morpho-physiological parameters were recorded at maturity from the central five randomly-selected plants in order to remove the border effect [47]. After heat exposure, a pollen fertility test was performed for all genotypes to screen out heat-susceptible genotypes. All fresh leaf samples were collected and stored at −80 °C for further analysis.

2.2. Cell Membrane Thermostability

In the last week of the heat stress, the flag leaf samples from control and stressed plants were collected in pre-labeled 20 mL glass tubes. The leaf segments were treated with distilled water used for conductivity measurements. Cell membrane thermostability was measured by following the method of [48] and following formula:
CMS % = 1 ( T 1 T 2 ) 1 ( C 1 C 2 ) × 100
where T and C refer to stressed and control plants, respectively. T1 and T2 are electrode conductance measurements before and after autoclave, while C1 and C2 are electrode conductivity measurements before and after autoclave.

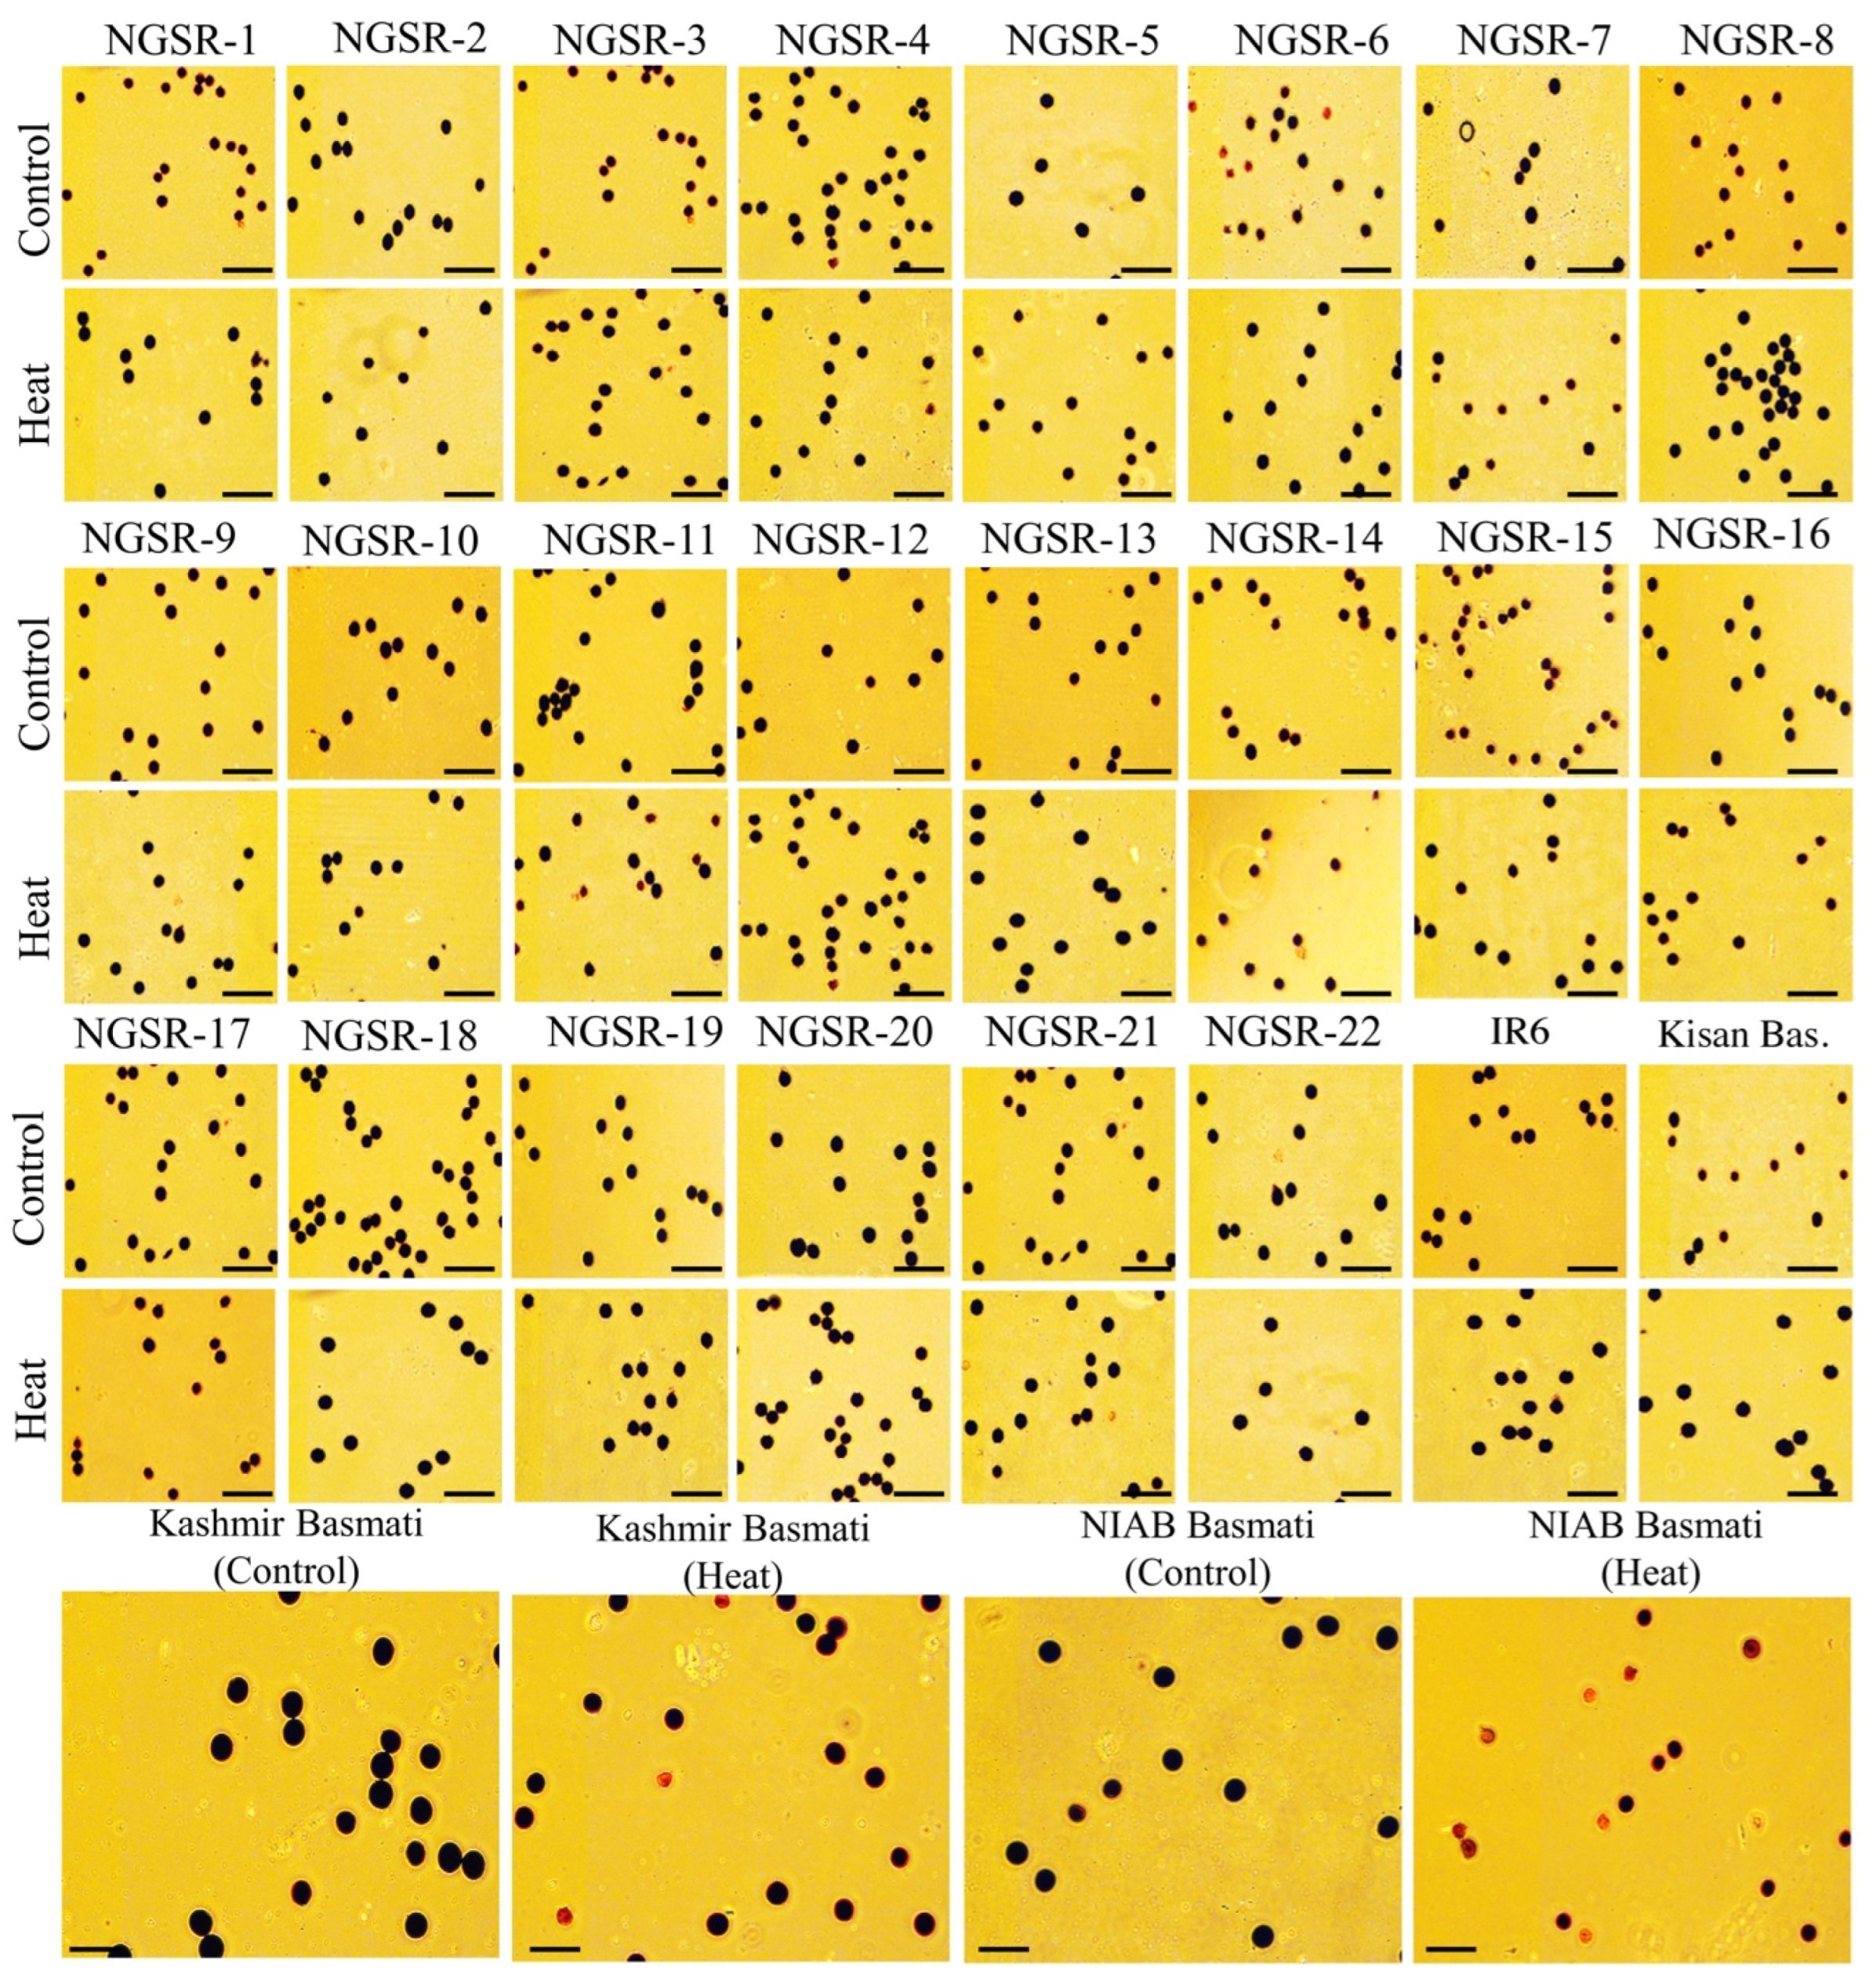
2.3. Pollen Fertility Test

A pollen fertility test was performed for all 26 genotypes following the method of [4] using light microscope (Nikon digital sight DS-Fi2). Spikelets were collected from the heat-treated plants on the following day in the morning before anthesis and preserved in formaldehyde solution (FAA). FAA was prepared with 1:1:18 ratio of formaldehyde, acetic acid, and ethanol, respectively. Anthers were placed on slide and pollens were extracted by crushing the anthers with the help of forceps. Then 50 µL of 1% potassium iodide (I2-KI) solution was added to the slide and covered with cover slip for visualization under compound microscope. Pollens that stained black with a circular shape were counted as fertile, while the irregular red-orange pollens were considered sterile [31]. At the end, pollen fertility percentage (PFP) was calculated as followed:
PFP = No .   of   fertile   pollens Total   No .   of   pollens × 100

2.4. NDVI (Normalized Difference Vegetation Index)

NDVI is a spectral calculation of the density of the green vegetations on a specific area. For NDVI, data was recorded from the three replicates, where a GreenSeekerTM Handheld Optical Sensor Unit (NTech Industries, Inc., Ukiah, CA, USA) was used, kept one meter above the plants during measurement [49].

2.5. Agronomic Parameters and Heat Susceptiblity Index

At the maturity stage, following agronomics parameters; plant height (PH, cm), number of tillers per plant (TPP), grain yield per plant (GY, g), straw yield per plant (SY, g), harvest index (HI) calculated by GY/total biomass, 1000-grain weight (GW, g), grain length (GL, mm), and normalized difference vegetative index (NDVI) were recorded. The heat susceptibility index (HSI) was measured for grain yield by using the formula:
1 ( Y Y p ) / D ,
where Y is the grain yield under heat stress genotypes and Yp is the grain yield of genotypes under normal conditions. D is the stress intensity, which is measured by the formula:
( 1 X X p ) ,
where X is the mean of the grain yield of heat stress genotypes and Xp is the mean of grain yield of genotypes under normal conditions [24].

2.6. Statistical Analysis

Recorded morpho-physiological data were analyzed with the help of Excel 2019. Analysis of variance and heritability were calculated in R. Packages “corrplot”, “Ggally” and “factoextra” were used for correlation and principal component analysis.

3. Results

3.1. Assessment of Genetic Diversity Using Principal Component Analysis

Principal component analysis (PCA) was performed to study the genetic differences among the genotypes, and trait–genotype biplots were constructed from data recorded under control and heat stress (Figure 1). Under control conditions, PC1 and PC2 captured the 31.7% and 26.8% of the total variations (Figure 1A). Our results explained that GY, HI, GW, and NDVI showed opposite response to GL, PH, TPP, and SY. The GSR lines were more conserved because they were clustered near the origin, while the check varieties Kisan Basmati, Kashmir Basmati, NIAB-B-2016, and IR-6 showed more genetic variability because they spread far away from the center of origin (Figure 1A). Similarly, under heat stress, PC1 and PC2 showed 34.8% and 21.7% variations, respectively (Figure 1B). PFP, NDVI, HI, and GY were in opposite direction to the rest of the studied parameters (TPP, PH, SY, GL, GW, and HSI). In contrast to control conditions, both the GSR and check varieties fall away from the origin, which suggests that genotypes were more responsive to heat stress compared to the control (Figure 1B). Importantly, NGSR-3, NGSR-13, Kashmir Basmati and IR-6 were found near the apex of the biplot under heat stress, suggesting that these genotypes have the distinct genetic potential of the best tolerance to heat stress compared to others (Figure 1B).

3.2. Analysis of Variance Showed Significant Variation in Green Super Rice

To study the significant differences between the genotypes and heat treatment, the morpho-physiological data were subjected to analysis of variance (ANOVA). Results showed highly significant variations (p < 0.001) among the genotypes for all the studied parameters except NDVI (Table 1). Heat stress also showed a highly significant effect on the studied parameters except GW and NDVI. The interactions of genotypes × treatment were also highly significant (p < 0.001) for PH, SY, HI, and PFP. GY varied significantly (p < 0.05), while TPP, GW, GL, and NDVI were non-significant (Table 1). It is important to note that ANOVA showed significant effects of heat stress on most traits; however, heat stress affected PH, GW, GL, PFP, and NDVI in only a few genotypes and did not show a considerable effect overall (Figure 2, Figure 3, Figure 4 and Figure 5).

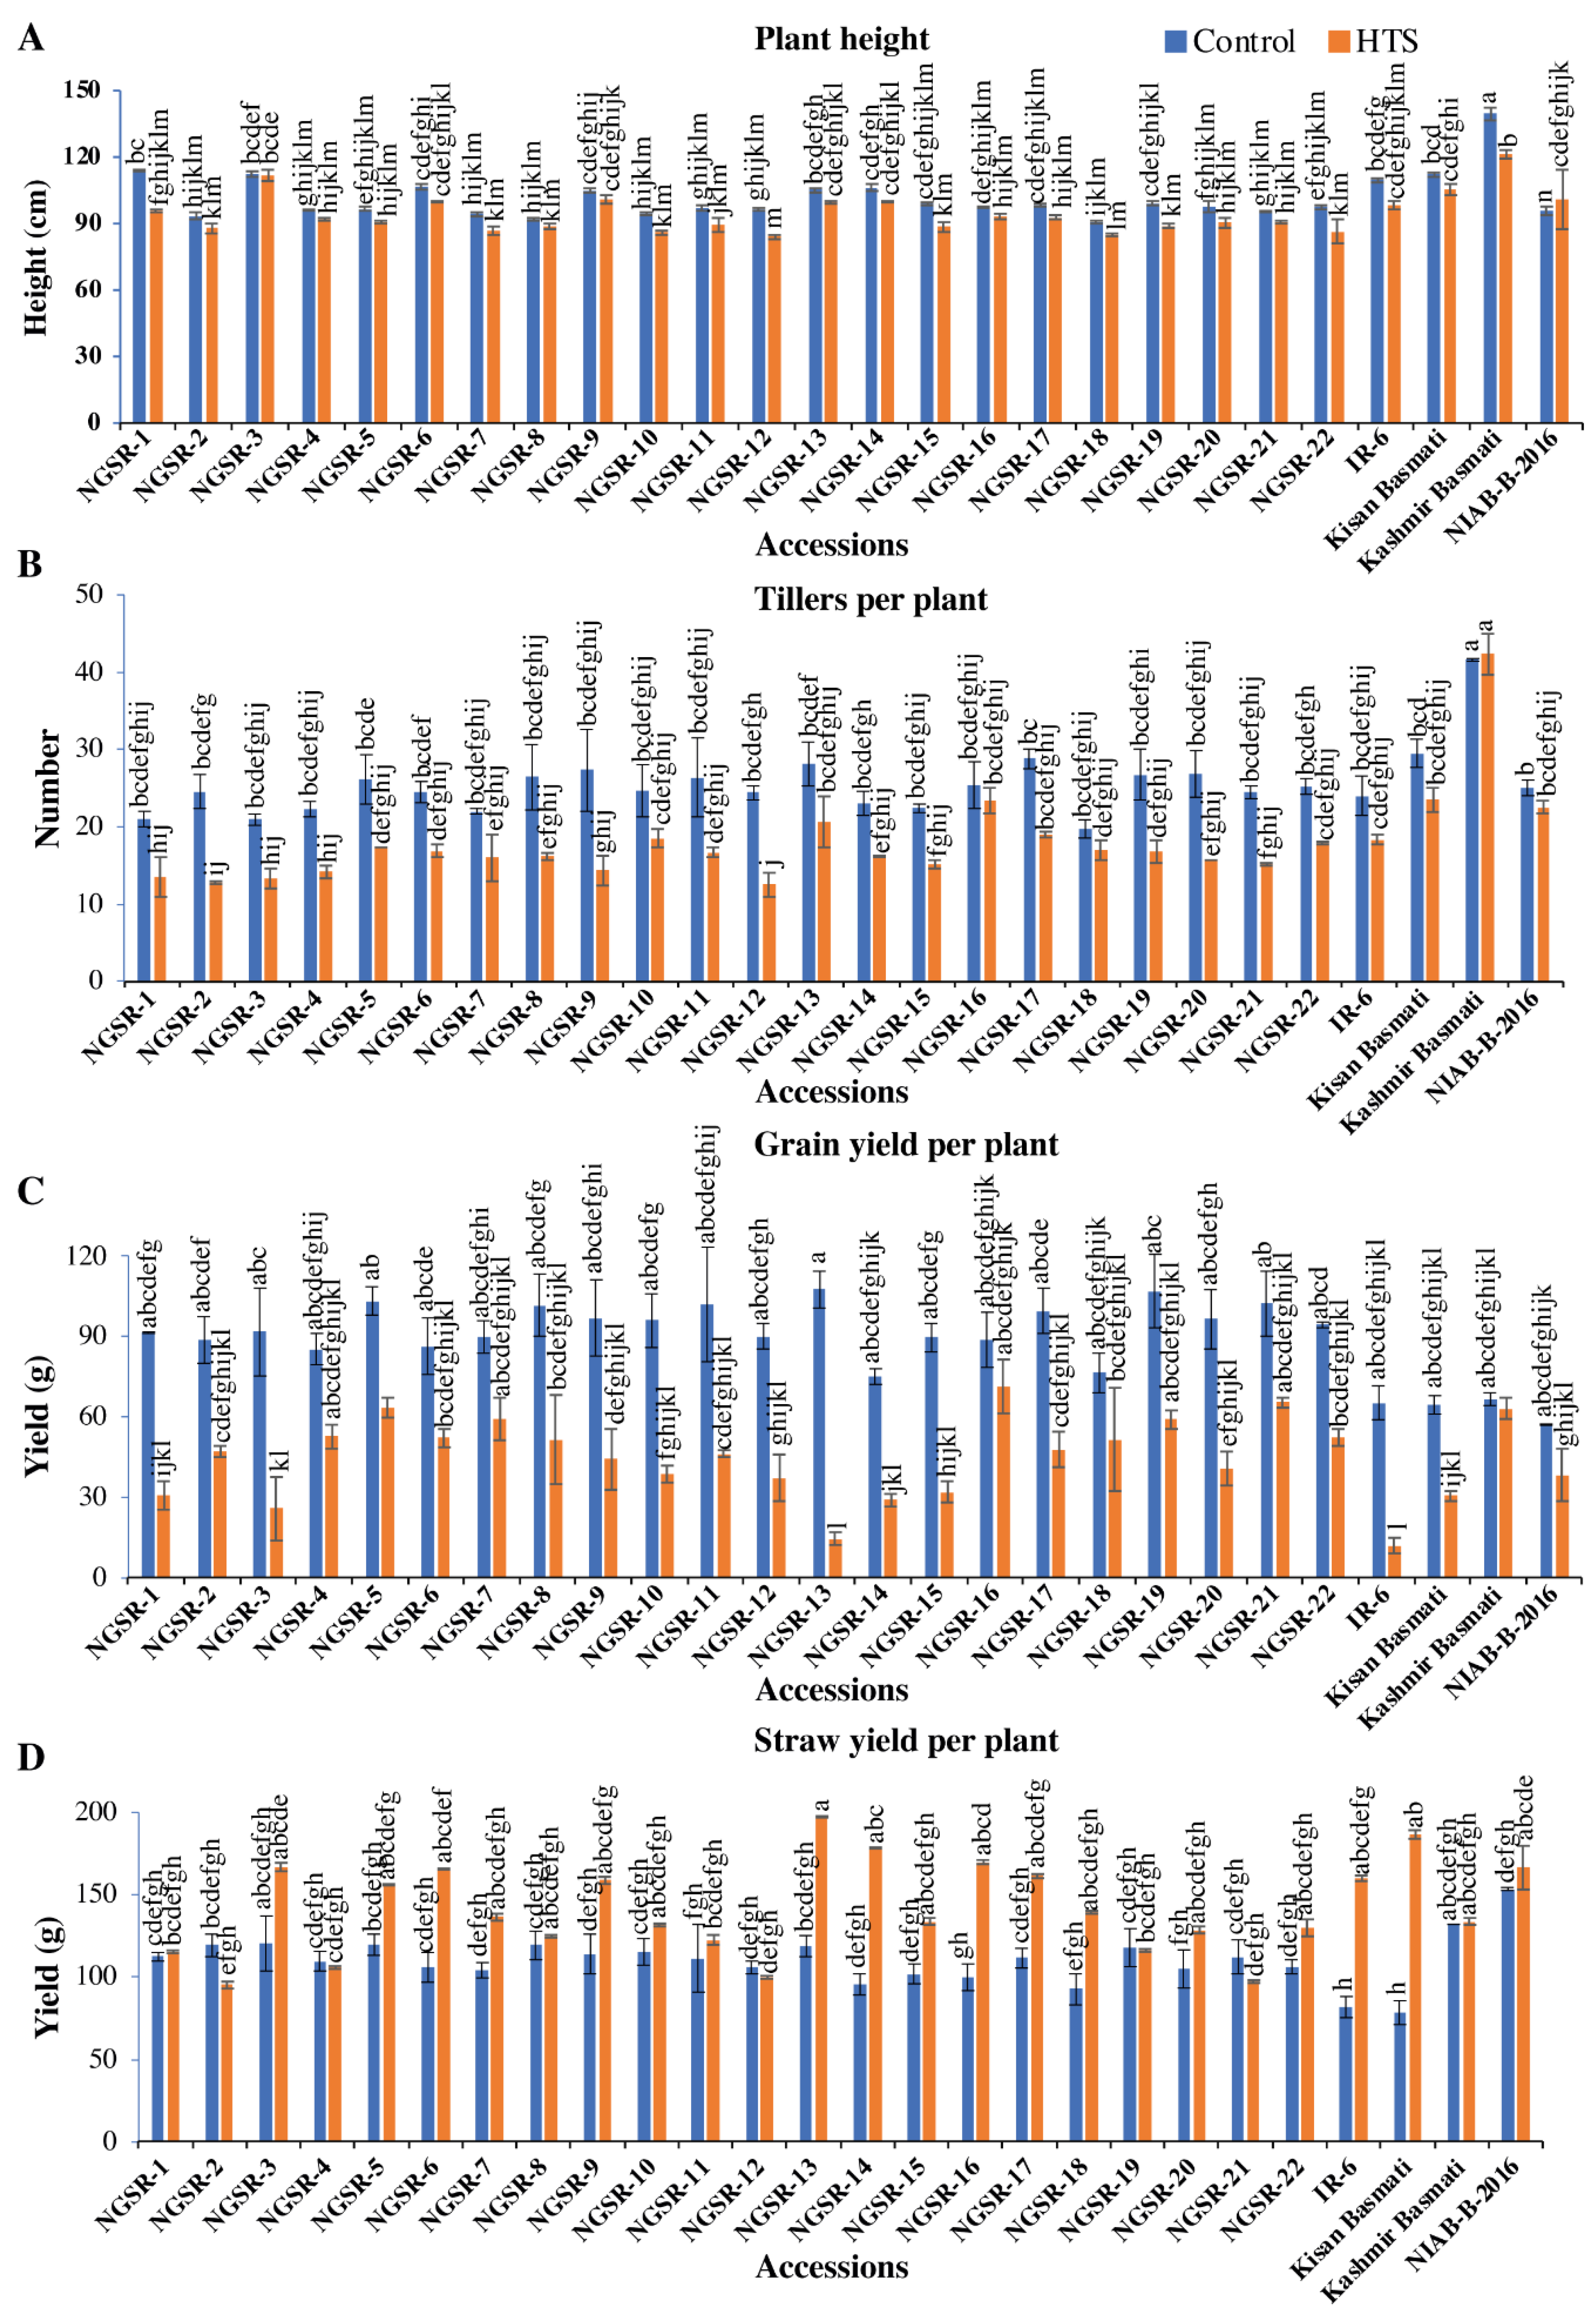
3.3. Mean Performance of Green Super Rice under Heat Stress

Heat stress significantly reduced the GY and affected other yield-contributing agronomic traits, namely TPP, SY, HI, and CMS, in most of the studied GSR and local genotypes (Figure 2, Figure 3, Figure 4 and Figure 5). However, the traits PH, GW, GL, PFP, and NDVI were not affected in most of the studied genotypes and probably do not play a role in grain yield variations (Figure 2, Figure 3, Figure 4 and Figure 5). Regarding the PH, we did not observe a very strong effect of heat stress on the tested genotypes (Figure 2A). Although it decreased overall, PH was considerably decreased in NGSR-1, NGSR-19, IR-6, and Kashmir Basmati under heat stress (Figure 2A). TPP and GY were decreased significantly under heat stress in most of the genotypes, except for Kashmir Basmati (Figure 2B,C). Overall reduction in the TPP was more obvious in GSR lines as compared to controls and Kashmir Basmati was the genotype with maximum (42.33) TPP (Figure 2B). For the GY, we observed a 5.68–86.52% decrease under heat stress. Interestingly, NGSR-16 and Kashmir Basmati showed no or little reduction in GY under heat stress and proved to be relatively heat-tolerant genotypes. Of all the genotypes, type IR-6 (11.83 g) was the worst performer and showed the maximum reduction (81.86%) under heat stress.
SY is another important agronomic trait that determines the overall plant biomass. We observed a sharp increase in SY in most genotypes under heat stress compared to the normal conditions (Figure 2D). The GSR lines NGSR-13 (197.17 g), NGSR-14 (178.5 g), and NGSR-16 (169.67 g) were the highest SY producers and showed a 39.84%, 46.47%, and 41.42% increase in SY, respectively (Figure 2D). The increase in SY suggest that plants have increased their vegetative growth and reduced their reproductive growth, which could be an avoidance mechanism.
HI is an important indicator of genotype performance, and a significant reduction in the HI was observed in all the studied genotypes except Kashmir Basmati (Figure 3A). It reduced from 0.40 to 0.07 but an overall less reduction was observed in GSR lines as compared to non-GSR checks (Figure 3A). The GSR lines NGSR-21 (0.40), NGSR-19 (0.34), NGSR-4 (0.33), and NGSR-2 (0.33) were the best performers. Highest reduction was observed in our high-temperature sensitive checks IR-6 (0.07), followed by Kisan Basmati (0.14) and NIAB-B-2016 (0.18).
Previously, drought- and heat-susceptibility indices have been widely used for the identification of tolerant genotypes, and genotypes with low values are considered tolerant ones [4,24,50]. Based on the heat susceptibility index (HSI), the GSR lines NGSR-16 and NGSR-18 showed the minimum HSI values 0.38 and 0.65, respectively, showing their maximum heat tolerance level. While the control variant Kashmir Basmati showed the minimum (0.11) HSI (Figure 3D). In contrast, the highest HSI was observed for NGSR-13 (1.72) and IR-6 (1.63), indicating the least heat tolerance in these genotypes. Overall, GSR lines performed well as compared to studied controls.
Pollen fertility has been used as an important indicator for the identification of heat-tolerant genotypes because it influences the seed setting and, ultimately, the grain yield. However, we observed the significant effect of heat stress on pollen fertility in only NIAB-B-2016, while all the remaining genotypes showed a higher fertility under heat stress. Most of the GSR genotypes were completely fertile under heat stress, and maximum sterility was observed in NGSR-1 (10.66%) and NGSR-13 (9.07%) (Figure 4 and Figure 5A). These results suggest that these genotypes used some tolerance mechanism to avoid the deleterious effect of heat stress on PFP, and there were some other factors responsible for the reduction in grain yield under heat stress.

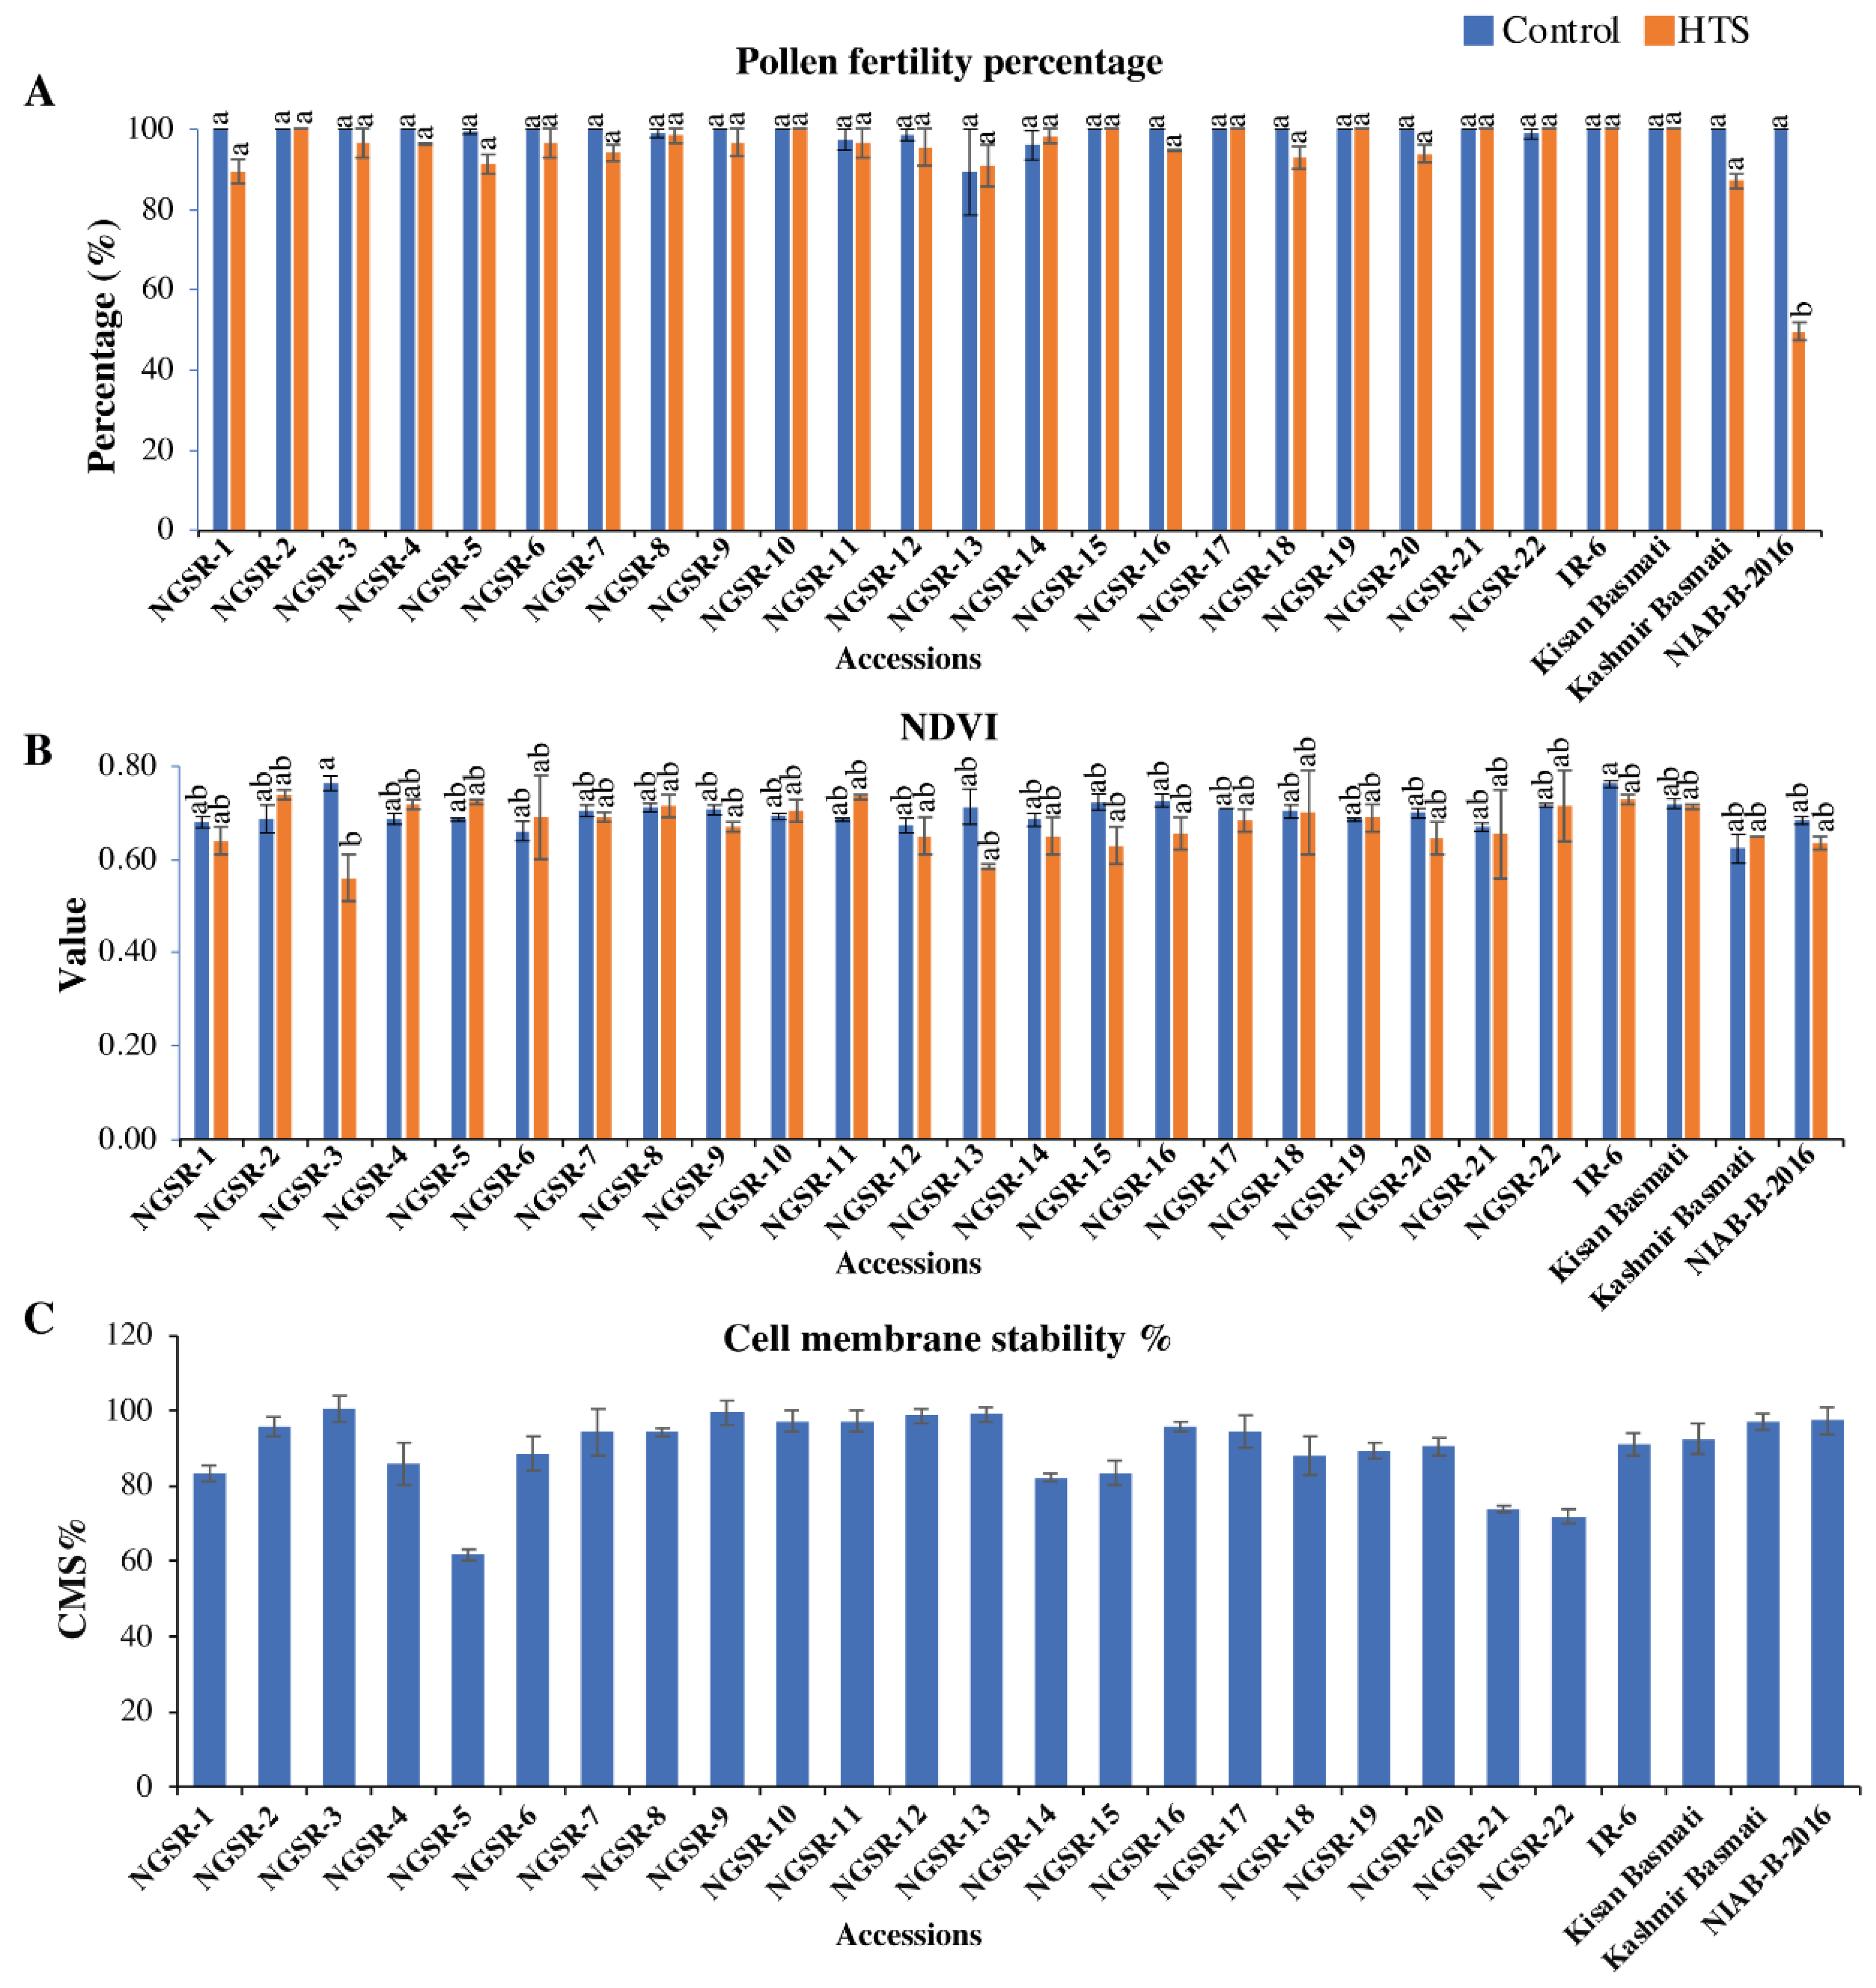
3.4. Normalized Difference Vegetative Index (NDVI)

To monitor the health of a plant, remote sensing is widely used, and data collected from NDVI can be utilized in the identification of tolerance. In this study, we observed that there was no significant reduction in GSR lines as well as controls. The genotypes NGSR-2, NGSR-11, and the control variants IR-6 and Kissan Basmati showed the maximum (>0.7) value of NDVI. Minimum NDVI was observed in NGSR-3 and NGSR-13, while the NIAB-B-2016 showed the minimum NDVI among the control variants (Figure 5B). These results indicate that the GSR lines have the ability to maintain the growth rate under heat stress.

3.5. Effect of Heat Stress on Cell Membrane Stability (CMS%)

CMS is used to assess the stress tolerance ability of plant cells under abiotic stresses. We observed that most of the GSR lines showed higher CMS% than the controls except NGSR-5, NGSR-14, NGSR-15, NGSR-21, and NGSR-22. Highest CMS% was observed in NGSR-3, followed by NGSR-9, NGSR-13, and NGSR-16, while Kashmir Basmati showed the maximum CMS% of the control variants (Figure 5C).

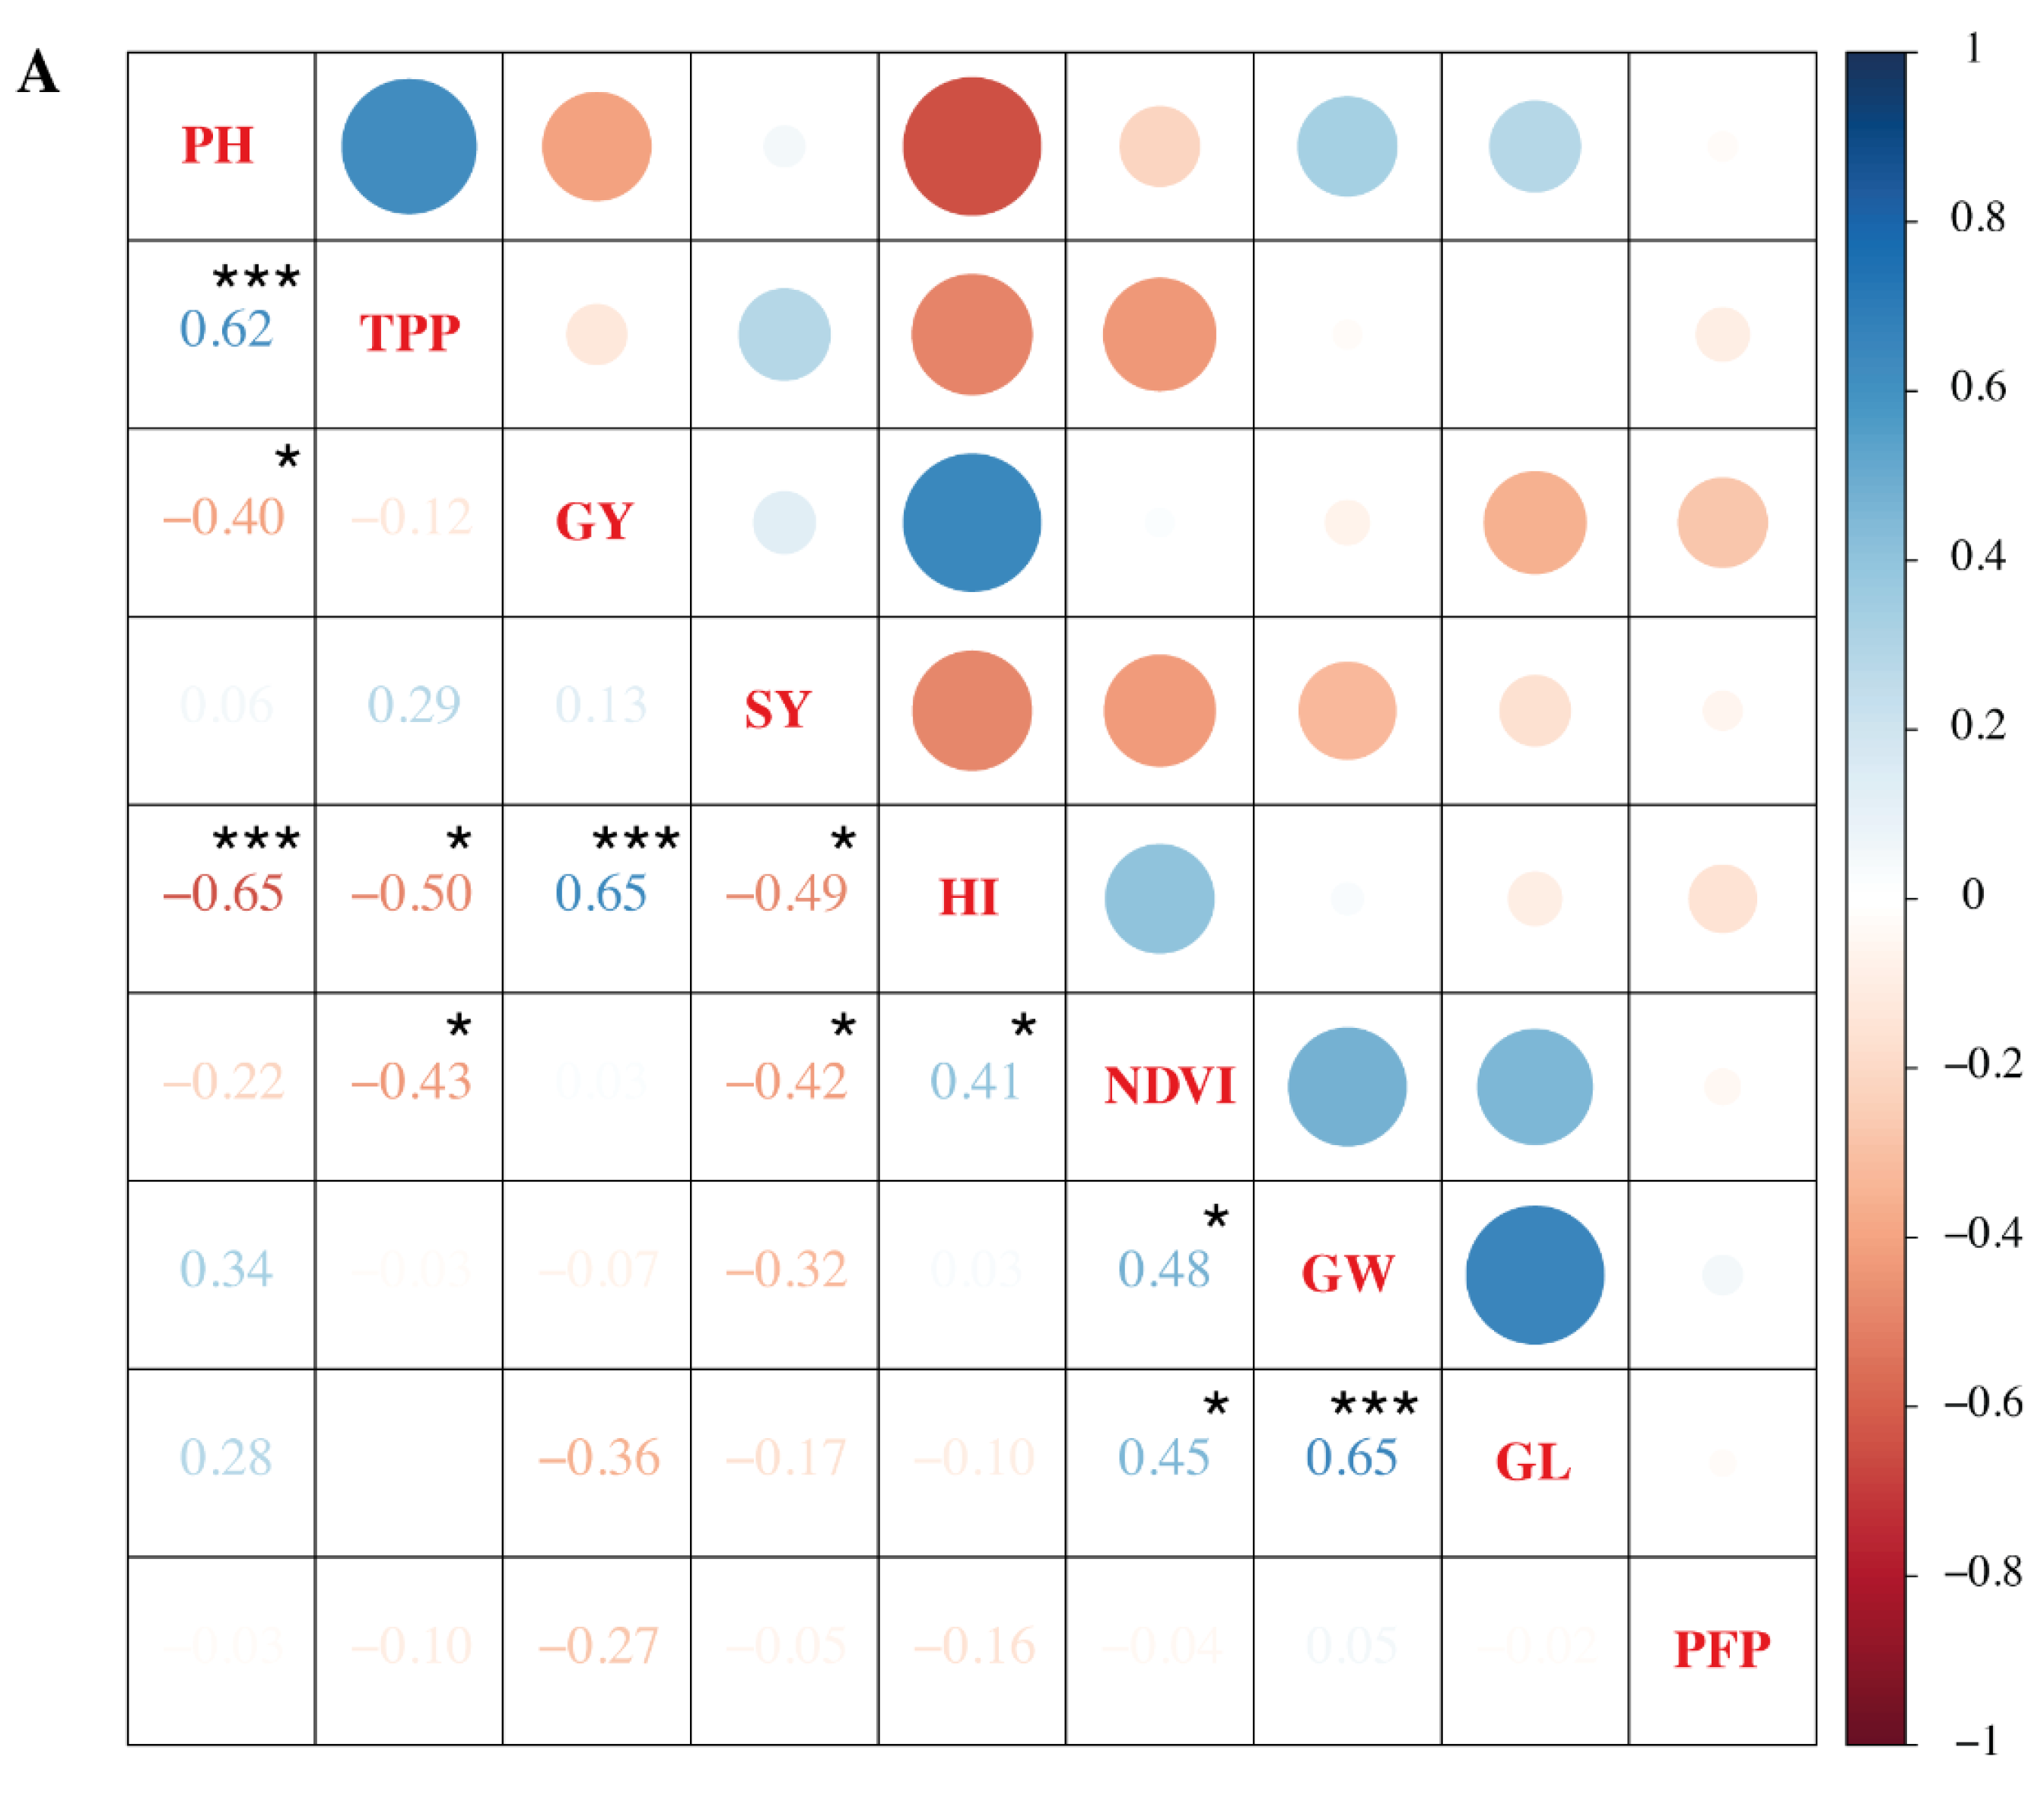
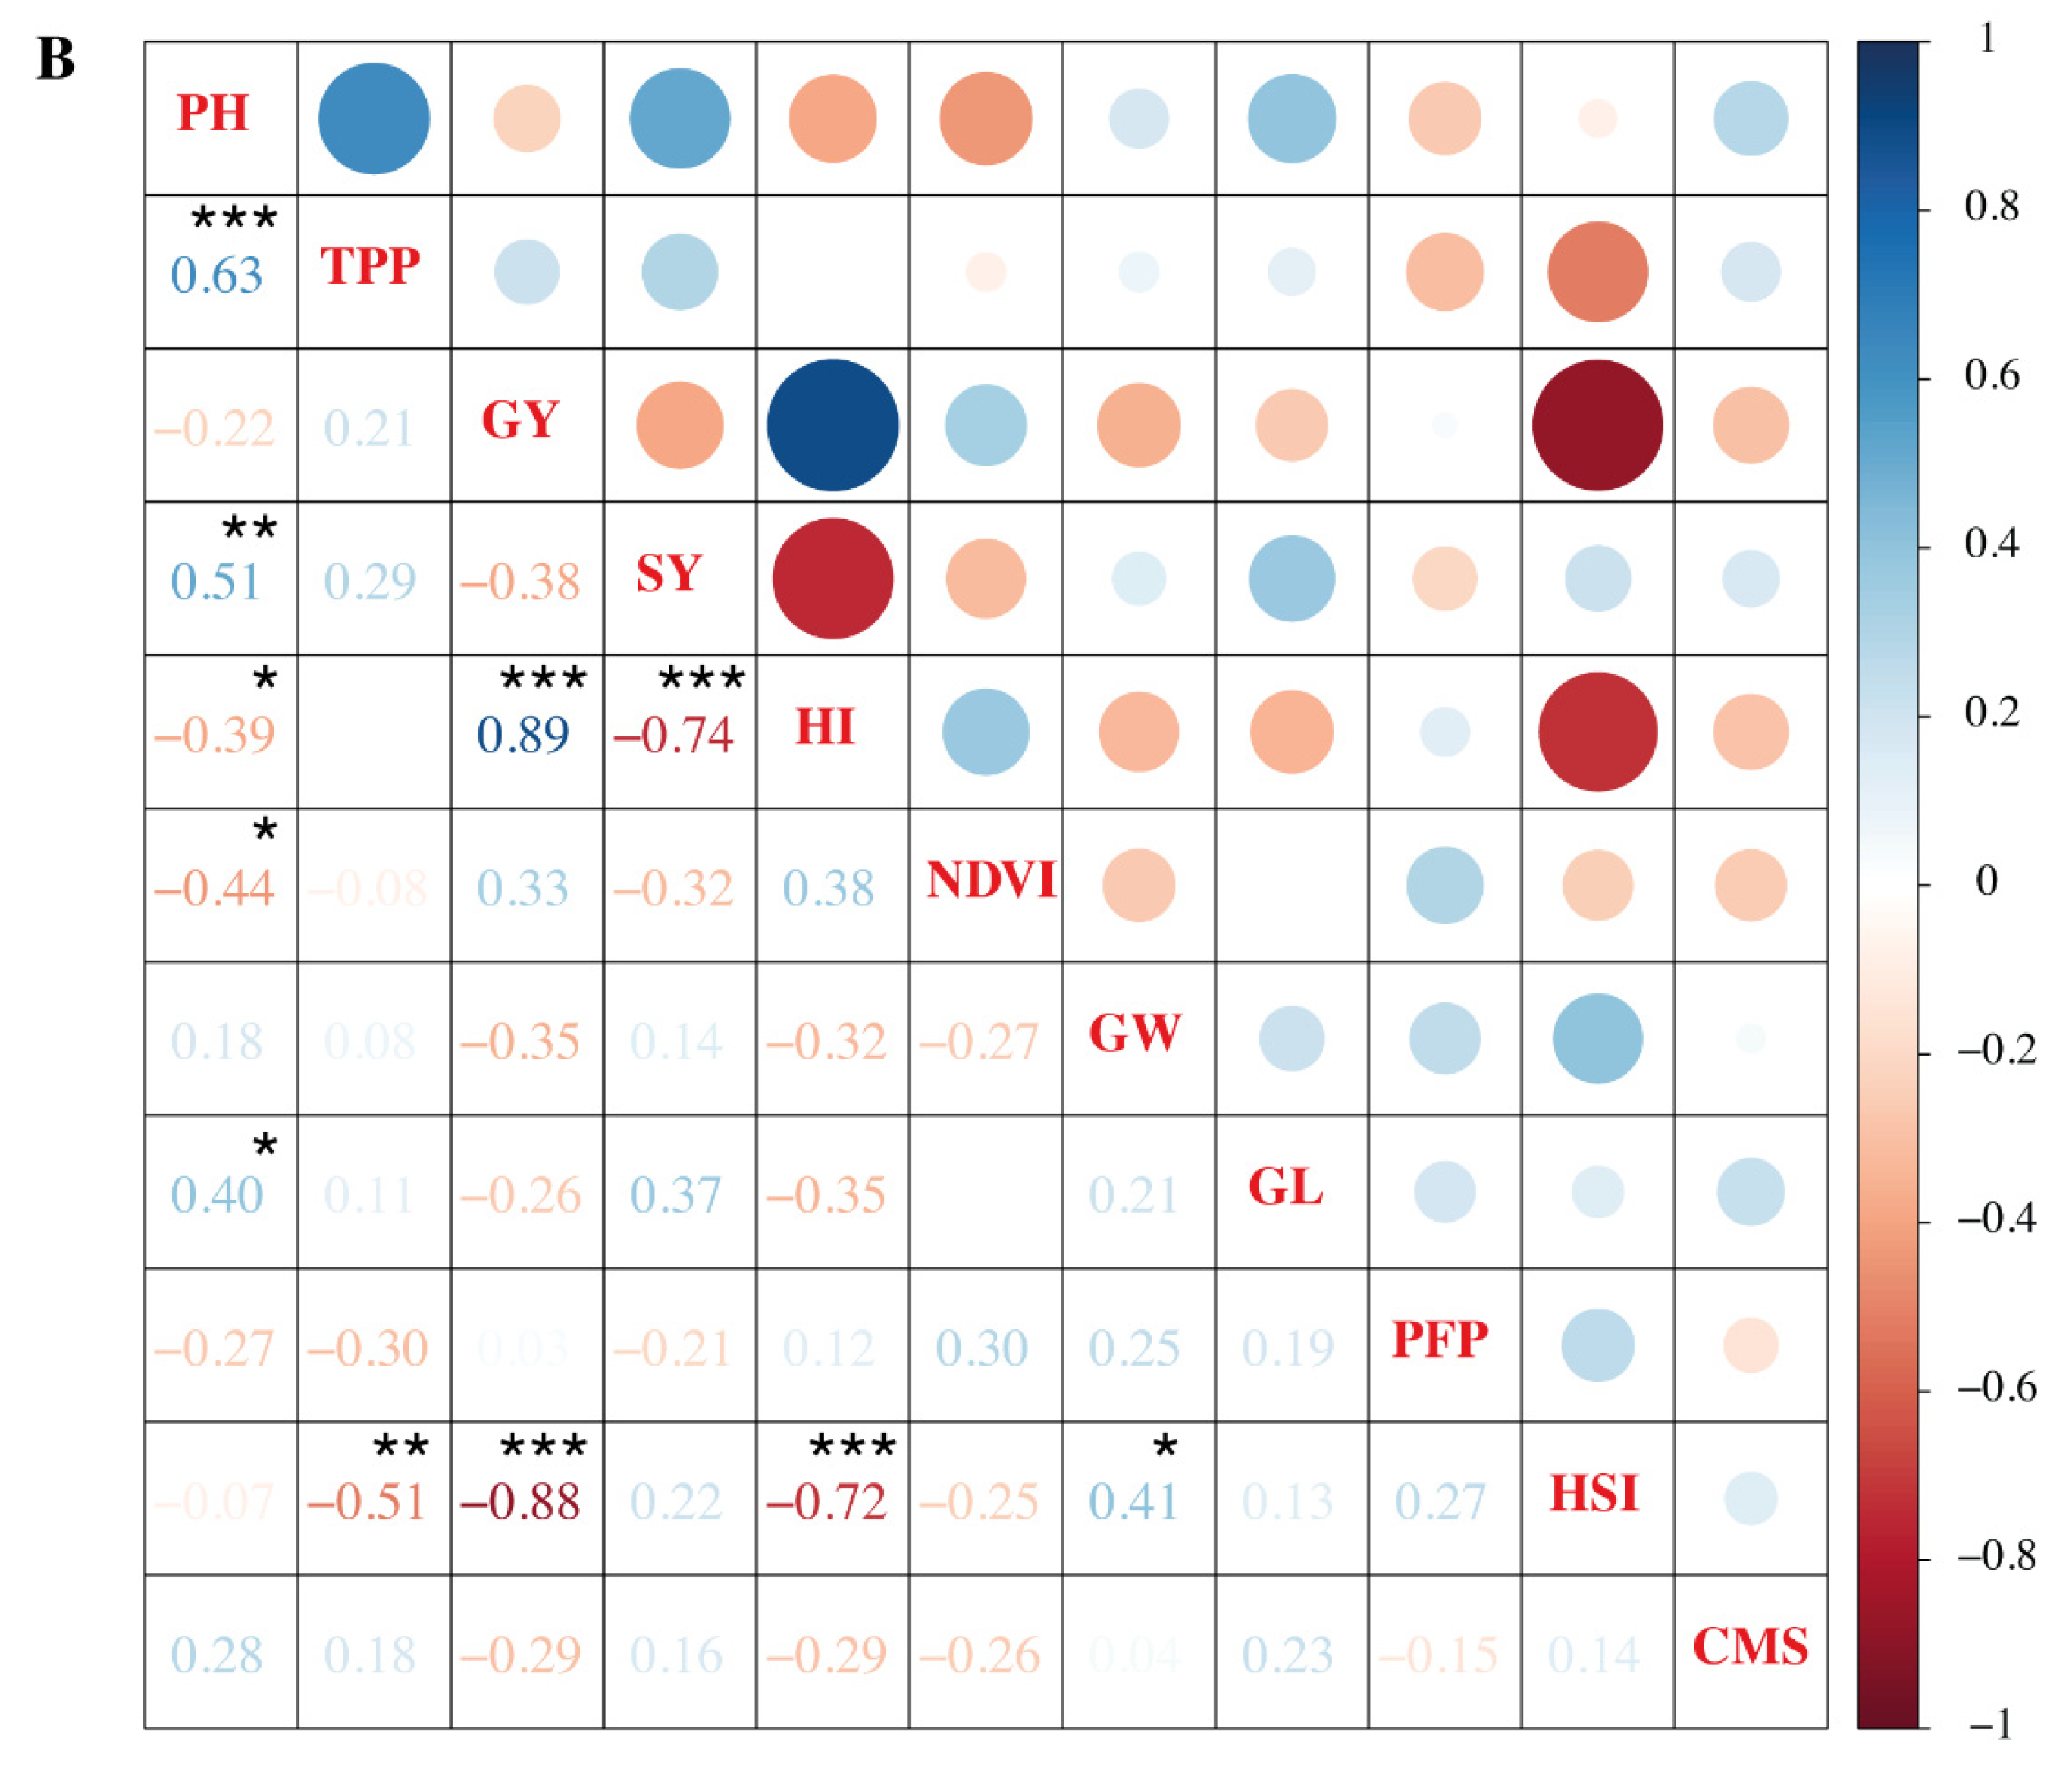
3.6. Association of Grain Yield and Other Parameters under Heat Stress

Knowledge of association among the yield, yield-related, and other agronomic parameters is very important because it provide the basic information regarding the selection of certain parameters, which can be utilized as marker of grain yield improvement. In control conditions (Figure 6A), PH showed positive highly significant association with TPP (r = 0.62 ***) and a negative but significant association with GY (r = −0.40 *) and HI (r = −0.65 ***). TPP negatively associated with HI (r = −0.50 *) and NDVI (r = −0.43 *). GY showed highly positive association (r = 0.65 ***) with HI. SY showed a negative but significant association with NDVI (r = −0.42 *) and HI (r = −0.49 *). There was a highly significant association between GL and GW (r = 0.65 ***).
Similarly, under heat stress, PH showed a positive association with TPP (r = 0.63 ***), SY (r = 0.51 **), and GL (r = 0.40 *). PH also showed a negative but significant association with HI (r = −0.39 *) and NDVI (r = −0.44 *, Figure 6B). GY showed a highly significant association with HI (r = 0.89 ***) and a negative but highly significant association with HSI (r = −0.88 ***). HI and SY also showed a negative but significant association (r = −0.74 ***). Similarly, HI showed a negative association with HSI (r = −0.72 ***).

4. Discussion

Rice is a very important cereal crop for majority of the world’s population [51]. Previously, it had been reported that the origin of rice varieties was not related to the degree of heat tolerance [52]. In general, the different growth stages of rice behave differently towards heat stress, but the flowering stage is a particularly sensitive stage [53]. Previous studies showed that rice production was optimum at 32–36 °C and a reduction in yield was observed at higher temperatures beyond that level [32,53,54]. The global climate is changing rapidly, and during the 21st century the expected increase in the earth’s temperature will be 2 to 4.5 °C [55]. Climate is intrinsically connected with agriculture and an increase in temperature will significantly reduce crop production [11,56]. It is reported that with every 1 °C increase in temperature, rice production will decrease by 2.6% [57]. The population of the world is also increasing day by day and is expected to reach 9 billion by 2050. Keeping in mind the increasing temperature and population and its demand, green super rice (GSR) was developed through the utilization of the world’s best germplasm material (Figure 7). GSR has the potential to cope different environmental stresses and maintain an overall grain yield [44]. Furthermore, to our knowledge, GSR lines have never been evaluated for heat stress.
In this study, twenty-two GSR lines, along with four local Pakistani varieties (controls), were studied under normal and heat stress conditions for grain yield and morpho-physiological parameters. Several morpho-physiological parameters collectively contribute to the grain yield [5,24,58]. In this study, we observed a significant reduction in TPP, SY, HI, CMS, and, ultimately, the GY, for most of the genotypes under heat stress. However, certain traits, including PH, GW, GL, PFP, and NDVI, were less affected under heat stress and probably contributed towards overall heat tolerance. In general, the GSR lines were less affected as compared to local varieties for several traits, showing their potential for breeding heat-tolerant rice cultivars. This was possibly due to GSR having more photosynthates than the control varieties because they might absorb more resources or nutrients in a short period of time [59,60].
Heat stress at the flowering or anthesis stage caused pollen sterility, which may lead to the failure of fertilization and ultimately reduction in yield [11]. Pollen sterility, in most cases, is a major reason for reduced grain production in rice under heat stress [24]. Surprisingly, we did not observe a considerable loss of PFP under heat stress, showing that reduced pollen fertility is not a reason for reduced GY (Figure 4). Compatible with this finding, we observed an increase in SY under heat stress in most of the genotypes, suggesting that plants increased their vegetative growth and slowed down their reproductive growth, which is an important avoidance mechanism for heat tolerance. Heat stress causes cell injury, which leads to the leakage of ions in the susceptible genotypes [61]. The genotypes which show better cell membrane stability under heat stress are generally considered to be heat tolerant [24,62]. However, we did not observe a very straightforward trend of CMS with GY, suggesting that it may not be very reliable to screen tolerant genotypes only based on CMS. In addition, prolonged multi-generational heat stress at the flowering stage may cause the accumulation of mutations that enable the plants to become acclimated under heat stress conditions [63]. In the current study, we found NGSR-16 to be the most heat-tolerant GSR line as it showed a minimum or no reduction in the GY, TPP, HI, TGW, and CMS compared to rest of the GSR lines. Among the local variants and overall, Kashmir Basmati outperformed in all the traits with the least reduction in GY under heat stress compared to the control, suggesting a better source of breeding heat-tolerant cultivars. Kashmir Basmati has previously been identified as a heat-tolerant cultivar in a separate study in Pakistan [23]. It is interesting to note that Kashmir Basmati was originally bred in Pakistan as a cold-tolerant rice cultivar for the Kashmir region, where it tolerates cold stress by producing heat shock proteins [64]. This suggests that there could be a common mechanism for cold- and heat-tolerance, possibly involving heat shock proteins, which needs to be further studied to understand the biochemical mechanism of heat tolerance in GSR.
Stress breeding programs depend on the reliable selection indices to screen good germplasm. Thus, it is important to evaluate the association between the final yield and other agronomic indices. We used correlation and PCA analyses to study the association of GY with other traits. Results showed that the GY had a significant positive association with HI but a negative correlation with GW and GL, suggesting that increasing the GW and GL may decrease the final GY probably via decreasing the total number of grains. Thus, an optimum GW and GL would be required for an optimum GY, which involves a sophisticated balance of source–sink translocation.

5. Conclusions

This study was conducted to evaluate the heat tolerance potential of 22 elite GSR lines in comparison with local varieties as controls in Pakistan. We observed a significant variation among the studied germplasm for heat tolerance and identified several heat-tolerant GSR lines that could be used as a genetic resource for breeding programs. We found that GY, along with other morpho-physiological traits, such as TPP, SY, HI, and CMS, were seriously affected by heat stress in most of the genotypes, while PH, GW, GL, PFP, and NDVI were affected only in a few genotypes. Future studies are required to explore the underlying molecular and physiological mechanisms of heat tolerance in the selected tolerant genotypes.

Author Contributions

Conceptualization, S.A.Z., U.R., M.K.N. and M.R.K.; Data curation, S.A.Z., M.H.A., M.K.N., I.U.Z. and B.S.; Formal analysis, M.U., M.K.N., O.U.R., N.R., M.S.F. and N.Z.; Funding acquisition, G.M.A., S.H.Y. and M.R.K.; Investigation, S.A.Z. and N.Z.; Methodology, I.U.Z.; Resources, N.R., J.X., Z.L., J.A., G.M.A. and S.H.Y.; Software, M.H.A. and N.Z.; Supervision, U.R. and M.R.K.; Visualization, M.U. and B.S.; Writing—original draft, M.U. and O.U.R.; Writing—review and editing, S.A.Z., M.U., M.S.F., J.X., Z.L., J.A., S.H.Y. and M.R.K. All authors have read and agreed to the published version of the manuscript.

Funding

This study was conducted from the funds of Ministry of National Food Security and Research of Pakistan released for the PSDP-project (743) “Green Super Rice in Pakistan”. The publication of the present work is supported by the National Research Foundation of Korea (NRF), grant funded by the Korean government (MSIT) (NRF-2021R1F1A1055482).

Institutional Review Board Statement

Not applicable.

Informed Consent Statement

Not applicable.

Data Availability Statement

All the relevant data are within the paper and its supporting information file.

Acknowledgments

We appreciate the efforts of PSDP and Ministry of National Food Security and Research (MNFS&R) for providing resources for this study. We are also thankful to Institute of Crop Science, Beijing, China, for providing the GSR lines.

Conflicts of Interest

The authors declare no conflict of interest.

Compliance with Ethical Standards

This manuscript does not contain any studies with human/animals performed by any of the authors.

References

  1. Zafar, S.A.; Hameed, A.; Nawaz, M.A.; Ma, W.; Noor, M.A.; Hussain, M.; Mehboobur, R. Mechanisms and molecular approaches for heat tolerance in rice (Oryza sativa L.) under climate change scenario. J. Integr. Agric. 2018, 17, 726–738. [Google Scholar] [CrossRef]
  2. Fukagawa, N.K.; Ziska, L.H. Rice: Importance for global nutrition. J. Nutr. Sci. Vitaminol. 2019, 65, S2–S3. [Google Scholar] [CrossRef] [PubMed]
  3. Mahajan, G.; Sekhon, N.; Singh, N.; Kaur, R.; Sidhu, A. Yield and nitrogen-use efficiency of aromatic rice cultivars in response to nitrogen fertilizer. J. New Seeds 2010, 11, 356–368. [Google Scholar] [CrossRef]
  4. Ahmad, H.; Zafar, S.; Naeem, M.; Shokat, S.; Inam, S.; Rehman, M.A.u.; Naveed, S.A.; Xu, J.; Li, Z.; Ali, G.; et al. Impact of Pre-Anthesis Drought Stress on Physiology, Yield-Related Traits, and Drought-Responsive Genes in Green Super Rice. Front. Genet. 2022, 13, 832542. [Google Scholar] [CrossRef]
  5. Uzair, M.; Patil, S.B.; Zhang, H.; Kumar, A.; Mkumbwa, H.; Zafar, S.A.; Chun, Y.; Fang, J.; Zhao, J.; Khan, M.R. Screening Direct Seeding-Related Traits by Using an Improved Mesocotyl Elongation Assay and Association between Seedling and Maturity Traits in Rice. Agronomy 2022, 12, 975. [Google Scholar] [CrossRef]
  6. Raza, A.; Tabassum, J.; Kudapa, H.; Varshney, R.K. Can omics deliver temperature resilient ready-to-grow crops? Crit. Rev. Biotechnol. 2021, 41, 1209–1232. [Google Scholar] [CrossRef] [PubMed]
  7. Sun, F.; Yu, H.; Qu, J.; Cao, Y.; Ding, L.; Feng, W.; Khalid, M.H.B.; Li, W.; Fu, F. Maize ZmBES1/BZR1-5 Decreases ABA Sensitivity and Confers Tolerance to Osmotic Stress in Transgenic Arabidopsis. Int. J. Mol. Sci. 2020, 21, 996. [Google Scholar] [CrossRef]
  8. Lu, F.; Li, W.; Peng, Y.; Cao, Y.; Qu, J.; Sun, F.; Yang, Q.; Lu, Y.; Zhang, X.; Zheng, L.; et al. ZmPP2C26 Alternative Splicing Variants Negatively Regulate Drought Tolerance in Maize. Front. Plant Sci. 2022, 13, 851531. [Google Scholar] [CrossRef]
  9. Feng, W.; Liu, Y.; Cao, Y.; Zhao, Y.; Zhang, H.; Sun, F.; Yang, Q.; Li, W.; Lu, Y.; Zhang, X.; et al. Maize ZmBES1/BZR1-3 and -9 Transcription Factors Negatively Regulate Drought Tolerance in Transgenic Arabidopsis. Int. J. Mol. Sci. 2022, 23, 6025. [Google Scholar] [CrossRef]
  10. Li, B.; Gao, K.; Ren, H.; Tang, W. Molecular mechanisms governing plant responses to high temperatures. J. Integr. Plant Biol. 2018, 60, 757–779. [Google Scholar] [CrossRef] [PubMed]
  11. Waqas, M.A.; Wang, X.; Zafar, S.A.; Noor, M.A.; Hussain, H.A.; Azher Nawaz, M.; Farooq, M. Thermal Stresses in Maize: Effects and Management Strategies. Plants 2021, 10, 293. [Google Scholar] [CrossRef] [PubMed]
  12. Raza, A. Metabolomics: A systems biology approach for enhancing heat stress tolerance in plants. Plant Cell Rep. 2020, 41, 741–763. [Google Scholar] [CrossRef] [PubMed]
  13. Tollefson, J. How hot will Earth get by 2100? Nature 2020, 580, 443–446. [Google Scholar] [CrossRef] [PubMed]
  14. Stocker, T. Climate Change 2013: The Physical Science Basis: Working Group I Contribution to the Fifth Assessment Report of the Intergovernmental Panel on Climate Change; Cambridge University Press: Cambridge, UK, 2014. [Google Scholar]
  15. Sun, Q.; Miao, C.; Hanel, M.; Borthwick, A.G.; Duan, Q.; Ji, D.; Li, H. Global heat stress on health, wildfires, and agricultural crops under different levels of climate warming. Environ. Int. 2019, 128, 125–136. [Google Scholar] [CrossRef]
  16. Shuangyi, L.; Zhihong, J.; Jieming, C.; Gang, T.; Shuyu, W. Response of temperature-related rice disaster to different warming levels under RCP8. 5 emission scenario in major rice production region of China. Front. Clim. 2022, 3, 736459. [Google Scholar] [CrossRef]
  17. Shah, F.; Huang, J.; Cui, K.; Nie, L.; Shah, T.; Chen, C.; Wang, K. Impact of high-temperature stress on rice plant and its traits related to tolerance. J. Agric. Sci. 2011, 149, 545–556. [Google Scholar] [CrossRef]
  18. Aryan, S.; Gulab, G.; Habibi, N.; Kakar, K.; Sadat, M.I.; Zahid, T.; Rashid, R.A. Phenological and physiological responses of hybrid rice under different high-temperature at seedling stage. Bull. Natl. Res. Cent. 2022, 46, 45. [Google Scholar] [CrossRef]
  19. Chunlin, S.; Zongqiang, L.; Min Jiang, Y.S.; Yingxue, L.; Shouli, X.; Yang, L.; Shenbin, Y.; Gengkang, Y. An quantitative analysis of high temperature effects during meiosis stage on rice grain number per panicle. Chin. J. Rice Sci. 2017, 31, 658. [Google Scholar]
  20. Hasanuzzaman, M.; Nahar, K.; Alam, M.; Roychowdhury, R.; Fujita, M. Physiological, biochemical, and molecular mechanisms of heat stress tolerance in plants. Int. J. Mol. Sci. 2013, 14, 9643–9684. [Google Scholar] [CrossRef]
  21. Liu, W.; Yin, T.; Zhao, Y.; Wang, X.; Wang, K.; Shen, Y.; Ding, Y.; Tang, S. Effects of high temperature on rice grain development and quality formation based on proteomics comparative analysis under field warming. Front. Plant Sci. 2021, 12, 746180. [Google Scholar] [CrossRef]
  22. Nagai, T.; Makino, A. Differences between rice and wheat in temperature responses of photosynthesis and plant growth. Plant Cell Physiol. 2009, 50, 744–755. [Google Scholar] [CrossRef] [PubMed]
  23. Zafar, S.A.; Hameed, A.; Khan, A.S.; Ashraf, M. Heat shock induced morpho-physiological response in indica rice (Oryza sativa L.) at early seedling stage. Pak. J. Bot 2017, 49, 453–463. [Google Scholar]
  24. Zafar, S.A.; Hameed, A.; Ashraf, M.; Khan, A.S.; Li, X.; Siddique, K.H. Agronomic, physiological and molecular characterisation of rice mutants revealed the key role of reactive oxygen species and catalase in high-temperature stress tolerance. Funct. Plant Biol. 2020, 47, 440–453. [Google Scholar] [CrossRef]
  25. Jagadish, S.K.; Craufurd, P.Q.; Wheeler, T. High temperature stress and spikelet fertility in rice (Oryza sativa L.). J. Exp. Bot. 2007, 58, 1627–1635. [Google Scholar] [CrossRef] [PubMed]
  26. Satake, T.; Yoshida, S. High temperature-induced sterility in indica rices at flowering. Jpn. J. Crop Sci. 1978, 47, 6–17. [Google Scholar] [CrossRef]
  27. Mathur, S.; Agrawal, D.; Jajoo, A. Photosynthesis: Response to high temperature stress. J. Photochem. Photobiol. B Biol. 2014, 137, 116–126. [Google Scholar] [CrossRef]
  28. Wu, C.; Cui, K.; Wang, W.; Li, Q.; Fahad, S.; Hu, Q.; Huang, J.; Nie, L.; Mohapatra, P.K.; Peng, S. Heat-induced cytokinin transportation and degradation are associated with reduced panicle cytokinin expression and fewer spikelets per panicle in rice. Front. Plant Sci. 2017, 8, 371. [Google Scholar] [CrossRef]
  29. Ya-liang, W.; Yu-ping, Z.; Yan-hua, Z.; Hui, W.; Jing, X.; Hui-zhe, C.; Yi-kai, Z.; De-feng, Z. Effect of high temperature stress on rice spikelet differentiation and degeneration during panicle initiation stage. Chin. J. Agrometeorol. 2015, 36, 724. [Google Scholar]
  30. Fu, G.; Zhang, C.; Yang, X.; Yang, Y.; Chen, T.; Zhao, X.; Fu, W.; Feng, B.; Zhang, X.; Tao, L. Action mechanism by which SA alleviates high temperature-induced inhibition to spikelet differentiation. Chin. J. Rice Sci. 2015, 29, 637–647. [Google Scholar]
  31. Zafar, S.A.; Patil, S.B.; Uzair, M.; Fang, J.; Zhao, J.; Guo, T.; Yuan, S.; Uzair, M.; Luo, Q.; Shi, J. DEGENERATED PANICLE AND PARTIAL STERILITY 1 (DPS1) encodes a cystathionine β-synthase domain containing protein required for anther cuticle and panicle development in rice. New Phytol. 2020, 225, 356–375. [Google Scholar] [CrossRef]
  32. Xu, Y.; Chu, C.; Yao, S. The impact of high-temperature stress on rice: Challenges and solutions. Crop J. 2021, 9, 963–976. [Google Scholar] [CrossRef]
  33. Deng, Y.; Tian, X.; Wu, C.; Matsui, T.; Xiao, B. Early signs of heat stress-induced abnormal development of anther in rice. Zhongguo Shengtai Nongye Xuebao Chin. J. Eco-Agric. 2010, 18, 377–383. [Google Scholar] [CrossRef]
  34. Zhao, L.; Zhu, Z.; Tian, X.; Kobayasi, K.; Hasegawa, T.; Zhang, Y.; Chen, Z.; Wang, C.; Matsui, T. Inheritance analysis of anther dehiscence as a trait for the heat tolerance at flowering in japonica hybrid rice (Oryza sativa L.). Euphytica 2016, 211, 311–320. [Google Scholar] [CrossRef]
  35. Hu, Q.; Wang, W.; Lu, Q.; Huang, J.; Peng, S.; Cui, K. Abnormal anther development leads to lower spikelet fertility in rice (Oryza sativa L.) under high temperature during the panicle initiation stage. BMC Plant Biol. 2021, 21, 428. [Google Scholar] [CrossRef] [PubMed]
  36. Wang, Y.; Wang, L.; Zhou, J.; Hu, S.; Chen, H.; Xiang, J.; Zhang, Y.; Zeng, Y.; Shi, Q.; Zhu, D. Research progress on heat stress of rice at flowering stage. Rice Sci. 2019, 26, 1–10. [Google Scholar] [CrossRef]
  37. Zhang, C.; Li, G.; Chen, T.; Feng, B.; Fu, W.; Yan, J.; Islam, M.R.; Jin, Q.; Tao, L.; Fu, G. Heat stress induces spikelet sterility in rice at anthesis through inhibition of pollen tube elongation interfering with auxin homeostasis in pollinated pistils. Rice 2018, 11, 14. [Google Scholar] [CrossRef] [PubMed]
  38. Santiago, J.P.; Sharkey, T.D. Pollen development at high temperature and role of carbon and nitrogen metabolites. Plant Cell Environ. 2019, 42, 2759–2775. [Google Scholar] [CrossRef] [PubMed]
  39. Rieu, I.; Twell, D.; Firon, N. Pollen development at high temperature: From acclimation to collapse. Plant Physiol. 2017, 173, 1967–1976. [Google Scholar] [CrossRef] [PubMed]
  40. Panda, D.; Mishra, S.S.; Behera, P.K. Drought tolerance in rice: Focus on recent mechanisms and approaches. Rice Sci. 2021, 28, 119–132. [Google Scholar] [CrossRef]
  41. Xiong, H.; Yu, J.; Miao, J.; Li, J.; Zhang, H.; Wang, X.; Liu, P.; Zhao, Y.; Jiang, C.; Yin, Z. Natural variation in OsLG3 increases drought tolerance in rice by inducing ROS scavenging. Plant Physiol. 2018, 178, 451–467. [Google Scholar] [CrossRef]
  42. Ali, J.; Anumalla, M.; Murugaiyan, V.; Li, Z. Green super rice (GSR) traits: Breeding and genetics for multiple biotic and abiotic stress tolerance in rice. In Rice Improvement; Springer: Berlin/Heidelberg, Germany, 2021; pp. 59–97. [Google Scholar]
  43. Zaid, I.U.; Zahra, N.; Habib, M.; Naeem, M.K.; Asghar, U.; Uzair, M.; Latif, A.; Rehman, A.; Ali, G.M.; Khan, M.R. Estimation of genetic variances and stability components of yield-related traits of Green Super Rice at multi-environmental conditions of Pakistan. Agronomy 2022, 12, 1157. [Google Scholar] [CrossRef]
  44. Jewel, Z.A.; Ali, J.; Pang, Y.; Mahender, A.; Acero, B.; Hernandez, J.; Xu, J.; Li, Z. Developing green super rice varieties with high nutrient use efficiency by phenotypic selection under varied nutrient conditions. Crop J. 2019, 7, 368–377. [Google Scholar] [CrossRef]
  45. Yu, S.; Ali, J.; Zhang, C.; Li, Z.; Zhang, Q. Genomic Breeding of Green Super Rice Varieties and Their Deployment in Asia and Africa. Appl. Genet. 2020, 133, 1427–1442. [Google Scholar] [CrossRef] [PubMed]
  46. Zhang, Q. Strategies for developing green super rice. Proc. Natl. Acad. Sci. USA 2007, 104, 16402–16409. [Google Scholar] [CrossRef]
  47. Chaturvedi, A.K.; Bahuguna, R.N.; Shah, D.; Pal, M.; Jagadish, S. High temperature stress during flowering and grain filling offsets beneficial impact of elevated CO2 on assimilate partitioning and sink-strength in rice. Sci. Rep. 2017, 7, 8227. [Google Scholar] [CrossRef] [PubMed]
  48. Tripathy, J.; Zhang, J.; Robin, S.; Nguyen, T.T.; Nguyen, H. QTLs for cell-membrane stability mapped in rice (Oryza sativa L.) under drought stress. Theor. Appl. Genet. 2000, 100, 1197–1202. [Google Scholar] [CrossRef]
  49. Govaerts, B.; Verhulst, N. The Normalized Difference Vegetation Index (NDVI) Greenseeker (TM) Handheld Sensor: Toward the Integrated Evaluation of Crop Management Part A: Concepts and Case Studies; CIMMYT: Mexico City, Mexico, 2010. [Google Scholar]
  50. Shanmugavadivel, P.; Sv, A.M.; Prakash, C.; Ramkumar, M.; Tiwari, R.; Mohapatra, T.; Singh, N.K. High resolution mapping of QTLs for heat tolerance in rice using a 5K SNP array. Rice 2017, 10, 28. [Google Scholar]
  51. Zafar, S.A.; Uzair, M.; Khan, M.R.; Patil, S.B.; Fang, J.; Zhao, J.; Singla-Pareek, S.L.; Pareek, A.; Li, X. DPS1 regulates cuticle development and leaf senescence in rice. Food Energy Secur. 2021, 10, e273. [Google Scholar] [CrossRef]
  52. Shi, W.; Ishimaru, T.; Gannaban, R.; Oane, W.; Jagadish, S. Popular rice (Oryza sativa L.) cultivars show contrasting responses to heat stress at gametogenesis and anthesis. Crop Sci. 2015, 55, 589–596. [Google Scholar] [CrossRef]
  53. Cheabu, S.; Moung-Ngam, P.; Arikit, S.; Vanavichit, A.; Malumpong, C. Effects of heat stress at vegetative and reproductive stages on spikelet fertility. Rice Sci. 2018, 25, 218–226. [Google Scholar] [CrossRef]
  54. Karwa, S.; Bahuguna, R.N.; Chaturvedi, A.K.; Maurya, S.; Arya, S.S.; Chinnusamy, V.; Pal, M. Phenotyping and characterization of heat stress tolerance at reproductive stage in rice (Oryza sativa L.). Acta Physiol. Plant. 2020, 42, 29. [Google Scholar] [CrossRef]
  55. Haider, S.; Raza, A.; Iqbal, J.; Shaukat, M.; Mahmood, T. Analyzing the regulatory role of heat shock transcription factors in plant heat stress tolerance: A brief appraisal. Mol. Biol. Rep. 2022, 49, 5771–5785. [Google Scholar] [CrossRef] [PubMed]
  56. Farooq, M.S.; Uzair, M.; Raza, A.; Habib, M.; Xu, Y.; Yousuf, M.; Yang, S.H.; Khan, M.R. Uncovering the Research Gaps to Alleviate the Negative Impacts of Climate Change on Food Security: A Review. Front. Plant Sci. 2022, 13, 927535. [Google Scholar] [CrossRef]
  57. Easterling, W.E.; Aggarwal, P.K.; Batima, P.; Brander, K.M.; Erda, L.; Howden, S.M.; Kirilenko, A.; Morton, J.; Soussana, J.-F.; Schmidhuber, J. Food, fibre and forest products. Clim. Chang. 2007, 2007, 273–313. [Google Scholar]
  58. Uzair, M.; Ali, M.; Fiaz, S.; Attia, K.; Khan, N.; Al-Doss, A.A.; Khan, M.R.; Ali, Z. The Characterization of Wheat Genotypes for Salinity Tolerance Using Morpho-Physiological Indices under Hydroponic Conditions. Saudi J. Biol. Sci. 2022, 29, 103299. [Google Scholar] [CrossRef] [PubMed]
  59. Cheng, W.; Sakai, H.; Yagi, K.; Hasegawa, T. Interactions of elevated [CO2] and night temperature on rice growth and yield. Agric. For. Meteorol. 2009, 149, 51–58. [Google Scholar] [CrossRef]
  60. Farooq, J.; Khaliq, I.; Ali, M.A.; Kashif, M.; Rehman, A.U.; Naveed, M.; Ali, Q.; Nazeer, W.; Farooq, A. Inheritance pattern of yield attributes in spring wheat at grain filling stage under different temperature regimes. Aust. J. Crop Sci. 2011, 5, 1745–1753. [Google Scholar]
  61. Ilík, P.; Špundová, M.; Šicner, M.; Melkovičová, H.; Kučerová, Z.; Krchňák, P.; Fürst, T.; Večeřová, K.; Panzarová, K.; Benediktyová, Z. Estimating heat tolerance of plants by ion leakage: A new method based on gradual heating. New Phytol. 2018, 218, 1278–1287. [Google Scholar] [CrossRef] [PubMed]
  62. Rehman, S.U.; Bilal, M.; Rana, R.M.; Tahir, M.N.; Shah, M.K.N.; Ayalew, H.; Yan, G. Cell membrane stability and chlorophyll content variation in wheat (Triticum aestivum) genotypes under conditions of heat and drought. Crop Pasture Sci. 2016, 67, 712–718. [Google Scholar] [CrossRef]
  63. Lu, Z.; Cui, J.; Wang, L.; Teng, N.; Zhang, S.; Lam, H.-M.; Zhu, Y.; Xiao, S.; Ke, W.; Lin, J. Genome-wide DNA mutations in Arabidopsis plants after multigenerational exposure to high temperatures. Genome Biol. 2021, 22, 160. [Google Scholar] [CrossRef]
  64. Iqbal, N.; Farooq, S.; Arshad, R.; Hameed, A. Differential accumulation of high and low molecular weight heat shock proteins in Basmati rice (Oryza sativa L.) cultivars. Genet. Resour. Crop Evol. 2010, 57, 65–70. [Google Scholar] [CrossRef]
Figure 1. PCA under control (A) and heat stress (B) for 22 GSR lines and four controls and studied parameters. PH = Plant height (cm), TPP = Tillers per plant, GY = Grain yield per plant (g), SY = Straw yield per plant (g), HI = Harvest index, GW = 1000-Grain weight (g), GL = Grain length (mm), NDVI = Normalized difference vegetative index, PFP = Pollen fertility percentage, CMS = Cell membrane stability, and HIS = Heat susceptibility index.
Agronomy 12 01907 g001
Figure 2. Evaluation of 22 GSR lines and four control variants under control and heat stress. Data for plant height (A), tillers per plant (B), grain yield per plant (C), and straw yield per plant (D) were recorded under both conditions. Tuckey’s test was used for statistical differences. Different letters above the column varied significantly at p < 0.05.
Agronomy 12 01907 g002
Figure 3. Evaluation of 22 GSR lines and four control types under control and heat stress. Data for harvest index per plant (A), thousand grain weight (B), and grain length (C) were recorded under both conditions. Tuckey’s test was used for statistical differences. Different letters above the column varied significantly at p < 0.05. (D) Distribution of heat susceptibility index for grain yield.
Agronomy 12 01907 g003
Figure 4. Pollen fertility test in 22 GSR lines and four control variants of rice. Viable pollens were stained deep brown color, while the sterile pollens were slightly or not stained (bars = 100 µm).
Agronomy 12 01907 g004
Figure 5. Effect of heat stress on pollen fertility (A), NDVI (normalized difference vegetative index, B), and cell membrane stability (CMS, C). Data was mean ± SE of three replicates. Tuckey’s test was used for statistical differences. Different letters above the column varied significantly at p < 0.05.
Agronomy 12 01907 g005
Figure 6. Association studies between agronomic parameters under control (A) and heat stress (B). PH = Plant height (cm), TPP = Tillers per plant, GY = Grain yield per plant (g), SY = Straw yield per plant (g), HI = Harvest index, GW = 1000-Grain weight (g), GL = Grain length (mm), NDVI = Normalized difference vegetative index, PFP = Pollen fertility percentage, his = Heat susceptibility index, and CMS = Cell membrane stability. * p < 0.05, ** p < 0.01, and *** p < 0.001.
Agronomy 12 01907 g006aAgronomy 12 01907 g006b
Figure 7. Salient features of GSR and basmati lines. (A) Comparison of GSR and basmati lines under control conditions. (B) Panicle comparison of basmati and GSR lines. (C,D) Basmati lines under control and heat stress conditions. (E) Seed comparison and (F) the effect of disease on GSR lines. Bars (A,C,F = 10 cm; B,D = 1 cm; E = 1 mm).
Agronomy 12 01907 g007
Table 1. Mean square values of morpho-physiological parameters.
SOVGRepTG × TH2
DF251125
PH358.2 ***1.4 ns828.9 ***76.7 ***96.43
TPP90.0 ***15.9 ns1155.6 ***10.0 ns92.60
GY458 ***461 ns45,179 ***318 *64.85
SY797 ***920 ns34,194 ***1158 ***63.36
HI0.007 ***0.007 ns1.1028 ***0.0078 ***88.31
GW18.26 ***15.69 *0.122 ns4.122 ns81.80
GL3.09 ***0.08 ns1.1839 **0.223 ns95.71
NDVI0.003 ns0.000047 ns0.006 ns0.003 ns35.83
PFP110.0 ***80.1 *467.0 ***107.4 ***85.18
* p < 0.05, ** p < 0.01, *** p < 0.001, and ns = non-significant. SOV = Source of variation, DF = Degree of freedom, G = Genotype, Rep = Replication, T = Treatment, G × T = Genotype × Treatment interactions, H2 = Heritability, PH = Plant height (cm), TPP = Tillers per plant, GY = Grain yield per plant (g), SY = Straw yield per plant (g), HI = Harvest index, GW = 1000-Grain weight (g), GL = Grain length (mm), NDVI = Normalized difference vegetative index, PFP = Pollen fertility percentage.
Publisher’s Note: MDPI stays neutral with regard to jurisdictional claims in published maps and institutional affiliations.

