Article

Evaluating Plant Disease Detection Mobile Applications: Quality and Limitations

by
Ayesha Siddiqua
1,
Muhammad Ashad Kabir
2,3,*,
Tanzina Ferdous
4,
Israt Bintea Ali
5 and
Leslie A. Weston
3
1
Department of Computer Science and Engineering, Central Women’s University, Dhaka 1203, Bangladesh
2
School of Computing, Mathematics and Engineering, Charles Sturt Univerity, Bathurst, NSW 2795, Australia
3
Gulbali Institute for Agriculture, Water and Environment, Charles Sturt University, Wagga Wagga, NSW 2678, Australia
4
Department of Computer Science and Engineering, City University, Dhaka 1203, Bangladesh
5
Divine IT Limited, Dhaka 1203, Bangladesh
*
Author to whom correspondence should be addressed.
Agronomy 2022, 12(8), 1869; https://doi.org/10.3390/agronomy12081869
Submission received: 18 July 2022 / Revised: 3 August 2022 / Accepted: 5 August 2022 / Published: 8 August 2022

Abstract

:
In this technologically advanced era, with the proliferation of artificial intelligence, many mobile apps are available for plant disease detection, diagnosis, and treatment, each with a variety of features. These apps need to be categorized and reviewed following a proper framework that ensures their quality. This study aims to present an approach to evaluating plant disease detection mobile apps, which includes providing ratings of distinct features of the apps and insights into the exploitation of artificial intelligence used in plant disease detection. The applicability of these apps for pathogen or disease detection, identification, and treatment will be assessed along with significant insights garnered. For this purpose, plant disease detection apps were searched in three prominent app stores (the Google Play store, Apple App store, and Microsoft store) using a set of keywords. A total of 606 apps were found and from them, 17 relevant apps were identified based on inclusion and exclusion criteria. The selected apps were reviewed by three raters using our devised app rating scale. To validate the rater agreements on the ratings, inter-rater reliability is computed alongside their intra-rater reliability, ensuring their rating consistency. Also, the internal consistency of our rating scale was evaluated against all selected apps. User comments from the app stores are collected and analyzed to understand their expectations and views. Following the rating procedure, most apps earned acceptable ratings in software quality characteristics such as aesthetics, usability, and performance but gained poor ratings in AI-based advanced functionality, which is the key aspect of this study. However, most of the apps cannot be used as a complete solution to plant disease detection, diagnosis, and treatment. Only one app, Plantix–your crop doctor, could successfully identify plants from images, detect diseases, maintain a rich plant database, and suggest potential treatments for the disease presented. It also provides a community where plant lovers can communicate with each other to gain additional benefits. In general, all existing apps need to improve functionalities, user experience, and software quality. Therefore, a set of design considerations has been proposed for future app improvements.

1. Introduction

Plant diseases are a naturally occurring phenomenon limiting plant growth, development, and reproduction [1]. Plant diseases and the pathogens causing them are a direct threat to the global economy and food security [2]. Plant diseases are typically caused by pests, including viral, bacterial, and fungal-like organisms that hinder the normal growth of plants and cause variations in their vital functions [3]. For example, Leaf Blast, Brown Spot, Leaf Blight, Sheath Rot, and Stem Rot are common rice diseases that reduce grain quality and destroy the majority of rice seedlings when badly infested [4]. Phytophthora infestans or Late Blight, and Alternaria solani or Early Blight, are two well-characterized diseases that cause significant yield losses in potatoes [5]. Stripe Rust, Powdery Mildew, Leaf Rust, and other diseases harm winter wheat in central Asia, causing significant grain yield losses [6,7].
In contrast, severe grape leaf diseases like Black Rot and Powdery Mildew have a significant impact on grape yield and quality during the growth process, particularly in wet or moist humid conditions [8,9,10,11]. Soybean exhibits numerous leaf diseases such as Anthracnose, Bacterial Blight, Soybean Mosaic Virus, Copper Phytotoxicity, Charcoal Rot, Leaf Cercospora, Rhizoctonia Aerial Blight, and Downy Mildew. Plant pathogens causing disease have become a great menace when it comes to crops or other cultivated plant materials as our livelihood is dependent on them [12]. Therefore, identifying plant diseases is crucial for avoiding long-term or periodic harm to harvested produce and living landscape plants [13]. Early diagnosis of plant diseases allows for the implementation of preventive measures and the reduction of economic and production damage [5]. For sustainable agriculture, plant health observation and predictive maintenance are essential for reducing losses related to agricultural commodity yields and quality [14].
A traditional way of treating plant diseases is through the direct consultation of farmers and horticulturists with plant pathologists or outreach specialists in person. Experts physically examine different parts of the symptomatic plant or test the soil to evaluate soil properties, nutrients, or pH, and treatments are then suggested. However, the traditional method of diagnosing plant diseases can be unreliable and limited by available expertise [15,16]. Continuous plant surveillance by land managers is not always practical or cost-effective [17]. For this reason, mobile and other technologies can provide a low-cost, high-precision alternative [18]. There are various symptoms that can be used to identify plant pathogens and related diseases [19]. Modern technology has been brought into the picture to enhance the diagnostic process. This sector is modernized now with the advent of technology as smartphones have made their way into everyone’s lives, including those of rural farmers. As a result, many applications related to plants and their pathogens/diseases have been built on many platforms in recent years [20,21,22].
Existing plant and plant disease-related apps have a broad range of functionalities, such as identifying plants and diseases, disease severity estimation, biological knowledge, agricultural solutions, marketplace parameters, and more. Plant identification and disease detection are the most critical and beneficial features of the apps, as stakeholders take the required steps based on the result of plant disease detection. To provide these functionalities, image processing techniques, the grading method, artificial intelligence (AI), machine learning (ML), and deep learning (DL) techniques have been applied, supported by a large image data-set of plant varieties and their diseases [23,24,25,26,27,28,29,30,31,32,33].
Several apps claim to recognize and treat plant diseases on various platforms effectively, but unfortunately, there is no accreditation of apps, which is why individuals may face difficulty selecting the best app. Moreover, verification of the functionality does not mean the app is user-friendly and effective, as there are many evaluation metrics, such as user interface, error rates, response time, transparency, etc., other than user ratings. So, plant disease detection apps require a thorough analysis using a proper methodology.
To the best of our knowledge, no such structured study has yet been conducted on plant disease detection, severity estimation, and treatment-related mobile apps. A brief description of agricultural apps and plant disease apps has been provided by researchers [34,35,36,37]; however, they did not focus on plant disease detection, diagnosis, and care-related criteria. In contrast, this study aims to review plant disease detection applications from three different platforms (the Google Play store, Apple App store, and Microsoft store) by giving equal importance to the disease identification specific functionalities and software quality ensuring criteria. In this paper, we have made the following five major contributions:
1.
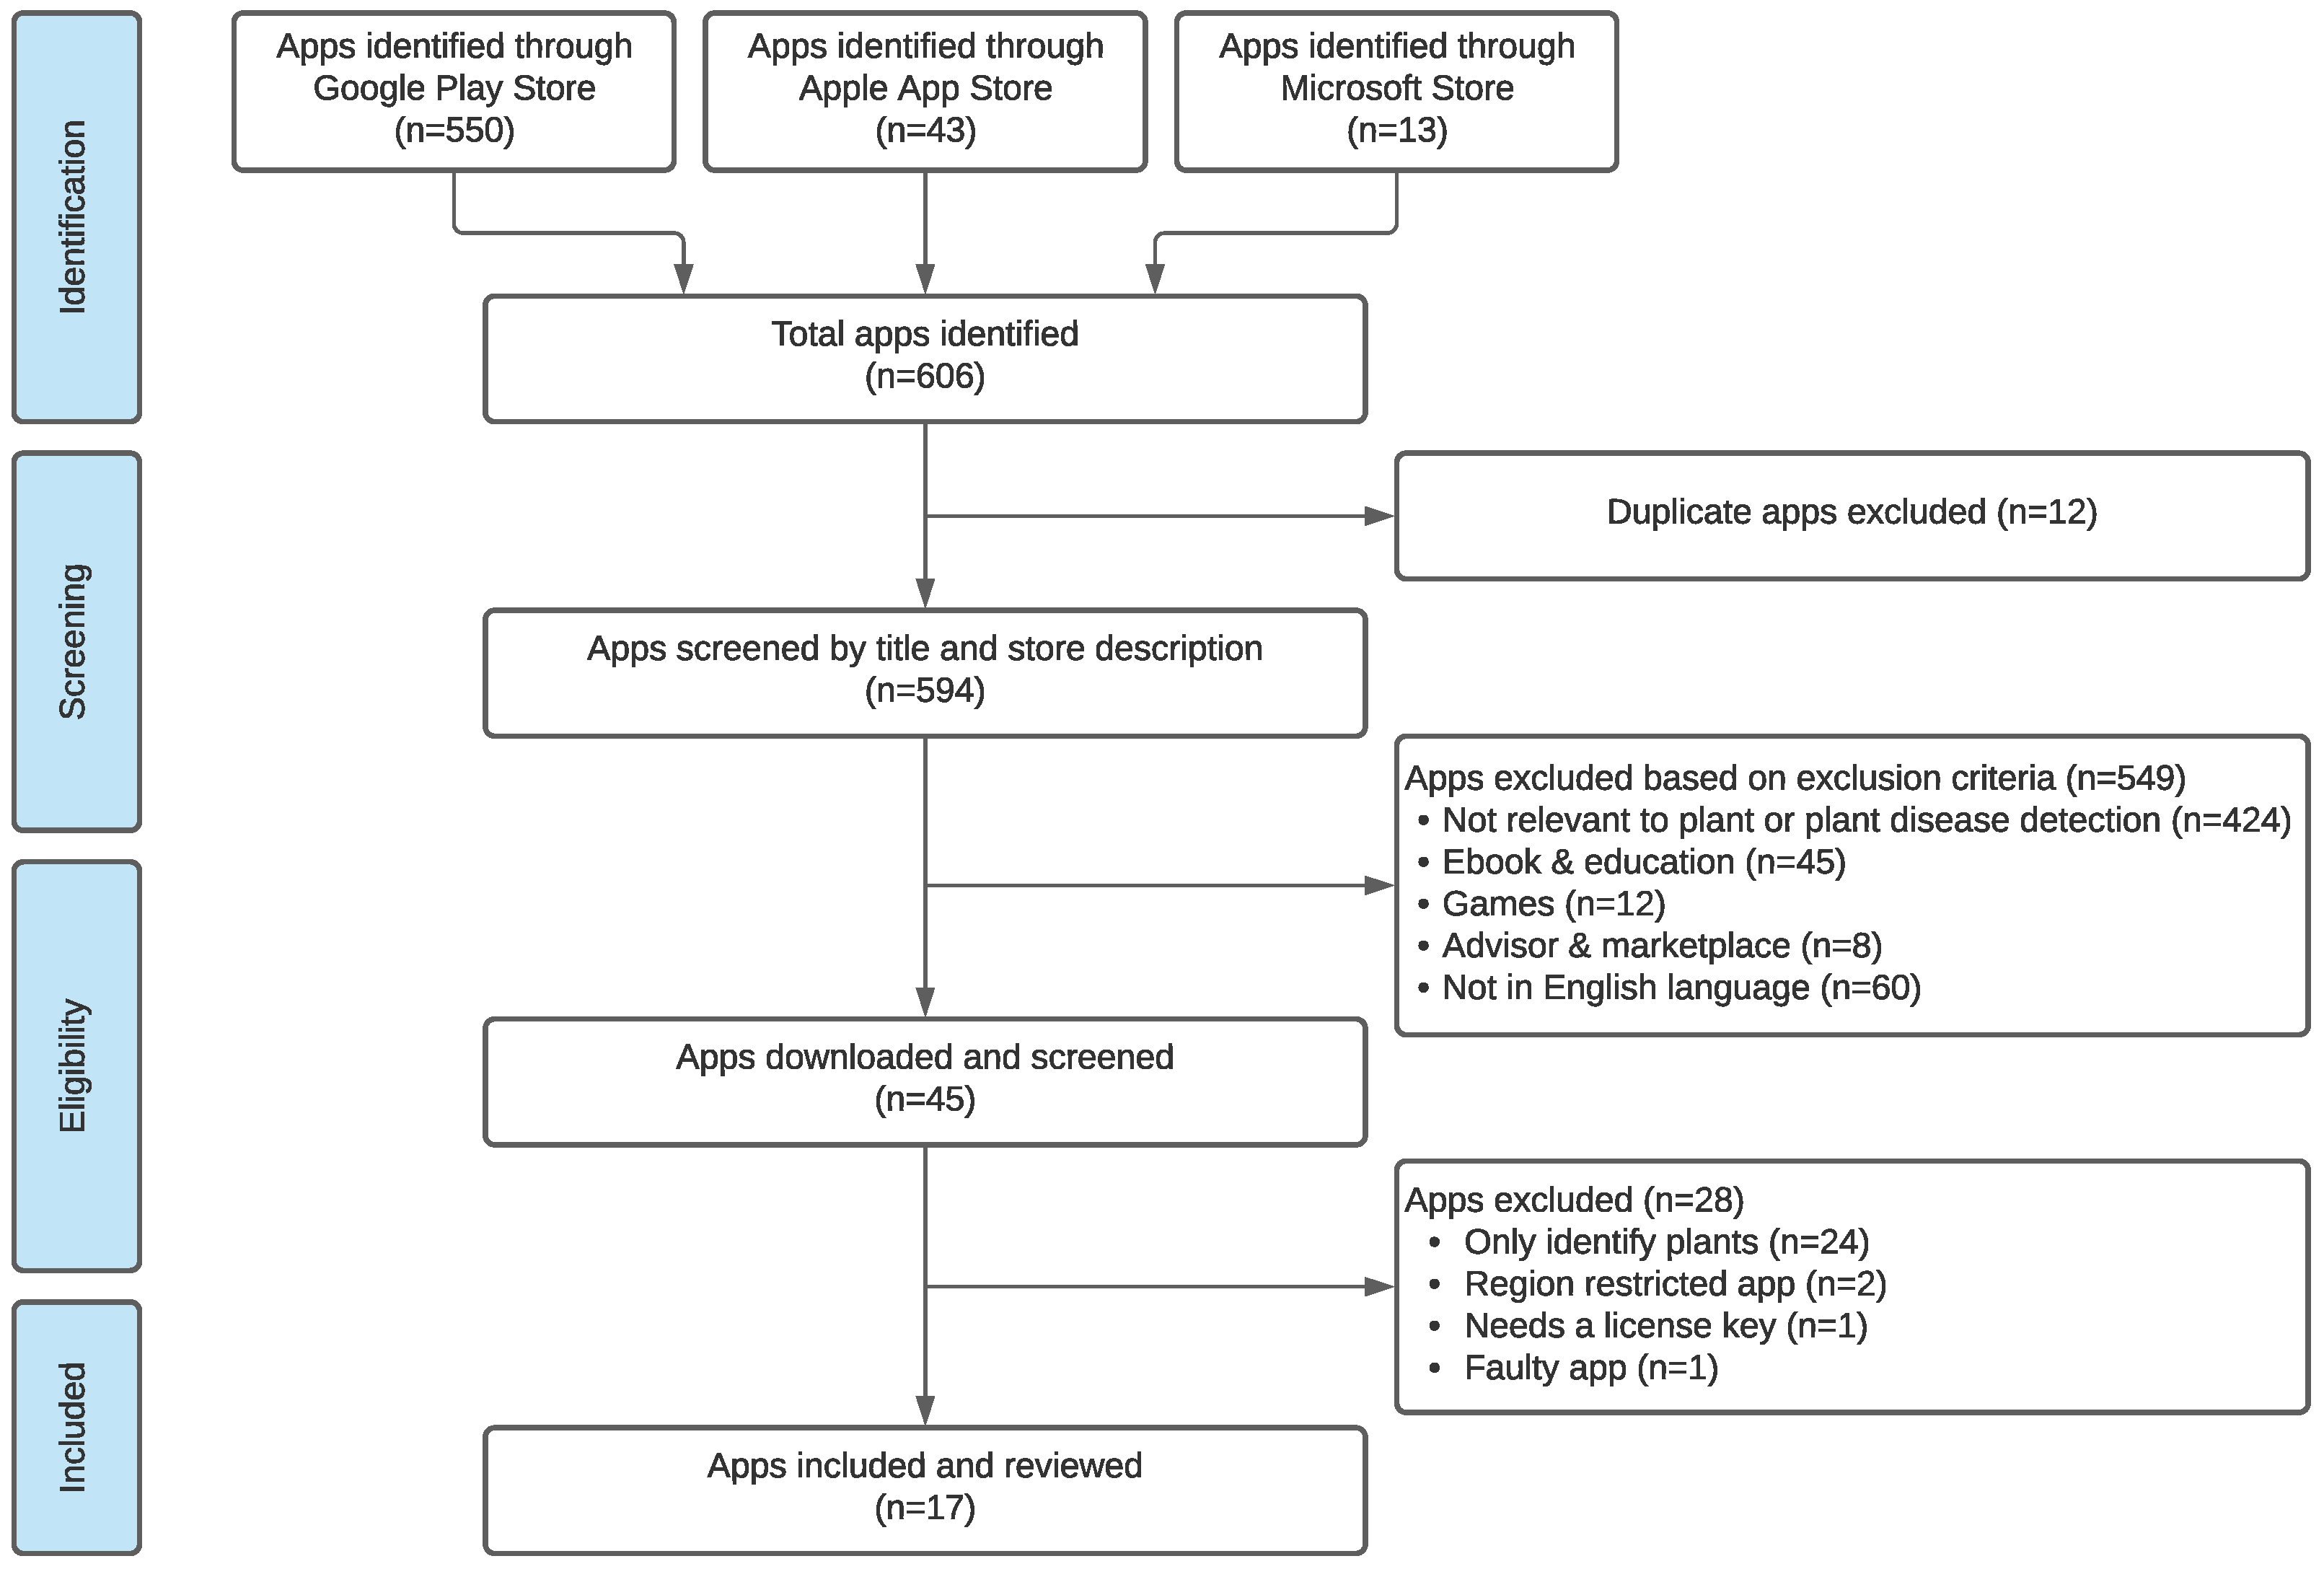
We have examined the existing apps accessible in the three major app stores (i.e., Google Play store, Apple App store, and Microsoft store).
2.
We have devised an app rating scale for analyzing plant disease detection apps by adopting and extending existing rating scales.
3.
We have evaluated the selected apps through our devised app rating scale and identified their design issues.
4.
We have analyzed app store user comments to understand users’ expectations and perspectives better.
5.
We have provided design guidelines that emphasize using artificial intelligence for better plant disease detection app development.
The paper is organized as follows. Section 2 describes the methodology and Section 3 presents our evaluation results. Section 4 discusses the limitations of the reviewed apps and design considerations for better app development. Finally, Section 5 concludes the paper.

2. Methodology

2.1. App Search Strategy

Apps were searched in the three most popular app stores: Google Play, Apple App, and Microsoft. A keyword-based search process has been employed following a similar approach used in previous studies [38,39]. The keywords that were used included: “plant disease“, “leaf disease”, “plant disease detection”, and “leaf disease detection”. To maintain transparency and clarity in reporting, as well as the opportunity for other researchers to recreate the systematic search procedure for apps, a structured strategy PRISMA was followed [40,41]. The complete process of app searching, screening, and selection is presented using the PRISMA diagram in Figure 1. After removing the duplicate apps, multiple screenings were performed to remove the redundancies and irrelevancies by mutual consensus of the researchers of this paper. The selected apps were further assessed quality-wise to avoid any bias. This extensive search procedure was executed twice to ensure no relevant apps were missed in the screening process.
Inclusion and exclusion criteria were defined to select relevant apps. In the screening process, an app was included if it is related to plant disease detection and mentions this feature in the description or about section of the app in the respective app store (inclusion criteria). The exclusion criteria were: (i) apps that are not relevant to plant or plant disease detection; (ii) apps that are only information based or educational about plant diseases; (iii) apps under the category of games since they do not have any relevance with the scope of our review; (iv) apps that provide a marketplace for farming essentials such as fertilizers or pesticides, or provide expert farming consultancy or advice, and (v) apps that are not in English as other languages are not comprehensible to us.
The investigators collaborated on the inquiry, screening, and retrieval phases of the app searching and collection processes. Each kept a separate list of apps they discovered in app stores using the finalized procedure’s inclusion and elimination parameters. The investigators used their personal devices to decide which apps are suitable for selection. Some problems were faced during the accumulation of the individual app lists, for instance, an app was excluded by one investigator but added by another investigator. Disagreements among the investigators were settled by discussion before consensus was achieved. The resulting app lists were combined to create the final list of apps for review (n = 606). Multiple screenings were performed to reach a consensus among researchers to rule out apps that were irrelevant to the review. After removing duplicate apps (n = 12), title and description-based screening was performed, which identified eligible apps (n = 45) for the review, considering the exclusion criteria. Those 45 apps were installed and screened, and in that process, 28 apps were excluded for various reasons. This screening process resulted in selecting 17 apps for our review.

2.2. Raters

The selected apps were evaluated by three raters using our devised mobile app rating scale (see Section 2.3). The raters reviewed all the apps independently in a Google form and then the information was collected in a Google sheet and processed later to assess different parameters. The three expert raters include one software developer with over four years of mobile app development experience in a reputed company and two computer science graduates with two years of mobile app development experience. In addition, the raters were under the guidance of a Ph.D. graduate in software engineering with ten years of mobile app research experience. He also acted as a fourth rater whenever there was any discrepancy among the three raters and was required to resolve the matter.

2.3. App Rating Scale for Plant Disease Detection

A standardized approach was necessary to assess the mobile apps based on various aspects of the mobile application. Moreover, such an approach allowed us to assess and compare apps objectively, considering their functionality and different software quality criteria. The Mobile App Rating Scale (MARS) for mobile health apps [42] is a popular rating scale that provides a multidimensional measure of the app quality assessment. We adopted and extended the existing app rating scales [39,42,43,44] for devising our app rating scale for plant disease detection.
The set of sub-scales that were adopted and extended to our plant disease detection apps’ rating scale from the mentioned tools was as follows: (i) app classification; (ii) aesthetics; (iii) general features; (iv) performance and efficiency; (v) usability; (vi) functionality (plant disease detection related); (vii) transparency; (viii) subjective quality, and (ix) the app’s perceived impacts on users. Some of the sub-scales for rating were adjusted (e.g., app classification) or newly defined (e.g., functionality) as needed to satisfy the objectives of plant disease detection apps. The rating scale was constructed using the app quality standards clustered around the domains, excluding the metadata portion. Each question was scored in a range of 1 to 5 using a Likert scale [45] or binary answer, depending on the type of question presented to determine the criterion.

2.3.1. App Metadata

Metadata provides basic information about the subject of interest. Table 1 lists the metadata such as platform, country of origin, business model (free/paid), and the number of downloads for each of our evaluated apps. However, this information has not been used in the app scoring process. For our selected plant disease detection apps, metadata are extracted from the respective app stores. The iOS app store does not provide download numbers, and thus, five apps’ download numbers are missing in the table. We have found five apps with 10K+ downloads. All the five iOS apps were pay to use and the remaining 12 Android apps were free to download and use.

2.3.2. Aesthetics

The aesthetics of an app plays an important role in a good user experience. The attractiveness or look of an interactive user interface is referred to as visual aesthetics, which is important for the functionality and usability of an app since it affects users’ first impressions. Users’ emotions and emotional reactions can be generated by the visual components of technology products [46]. It is a critical component in the user interface’s effective usability, satisfaction, trust and credibility, and preference [47,48,49,50].
Existing plant disease detection apps have been developed for gardeners, students, and producers. So, the buttons, icons, or menus on the screen must be appropriate and zoomable. The resolution of graphics must also be good. Producers from rural or urban areas use such apps, so the apps’ visual information and design must be appropriate for the target audience. Thus, aesthetics was rated on these criteria for each app—layout, graphics, visual appeal, and appropriateness for the target user group.

2.3.3. General Features

Several general features are expected in a plant disease detection app, including a data export option, log-in or sign-up, notification, multi-language support, and onboard tutorial for a smooth user experience. Some of these features are more objective than subjective. An app must provide basic functionality like social sharing and data exporting. These capabilities allow users to save information for later use and share it with others. Thus, the absence of these characteristics was rated as a low point. A premium subscription option is also an important aspect of an app, as consumer spending on premium apps is expected to reach $270 billion by 2025, over 2.5 times what it was in 2020 [51].
A plant disease detection app must also provide an on-board tutorial so a new gardener/user can clearly understand how to use the app (e.g., taking pictures). If the app provides customization features, it helps users to set their preferred language and use it with more comfort. Notifications are designed to make it easier for users to remember new features or messages and improve the app’s usage frequency. It can also alert users to take routine care of their plants or crops. Thus, all these above-mentioned criteria were included in the general features sub-scale of our rating scale.

2.3.4. Performance and Efficiency

A plant disease detection app requires a compatible device to function properly. For example, the device must have a reasonable camera to take high-quality photos of plants or leaves and roots. The app should also offer a quick cure or suggestions for users facing a problem with their plants. This sub-scale includes CPU performance, memory usage, battery consumption, the extent of heating up of the device, smooth working UI components, whether the app crashes while running, etc. Thus, these criteria were included in our rating scale’s performance and efficiency sub-scale.

2.3.5. Usability

The term “usability” refers to the entire relationship between the user and the product [52]. It directly impacts how users feel about an app and may help them become long-term users. Even if people run into issues, a solution should be simple to discover. The usability attribute analyzes how simple a system interface is to use [53]. Usability testing is critical in determining if an app is of sufficient quality to attract the attention of its desired user groups [54]. We consider ease of use, ease of navigation between components, and whether interactions between components are intuitive in the usability sub-scale of our app rating scale.

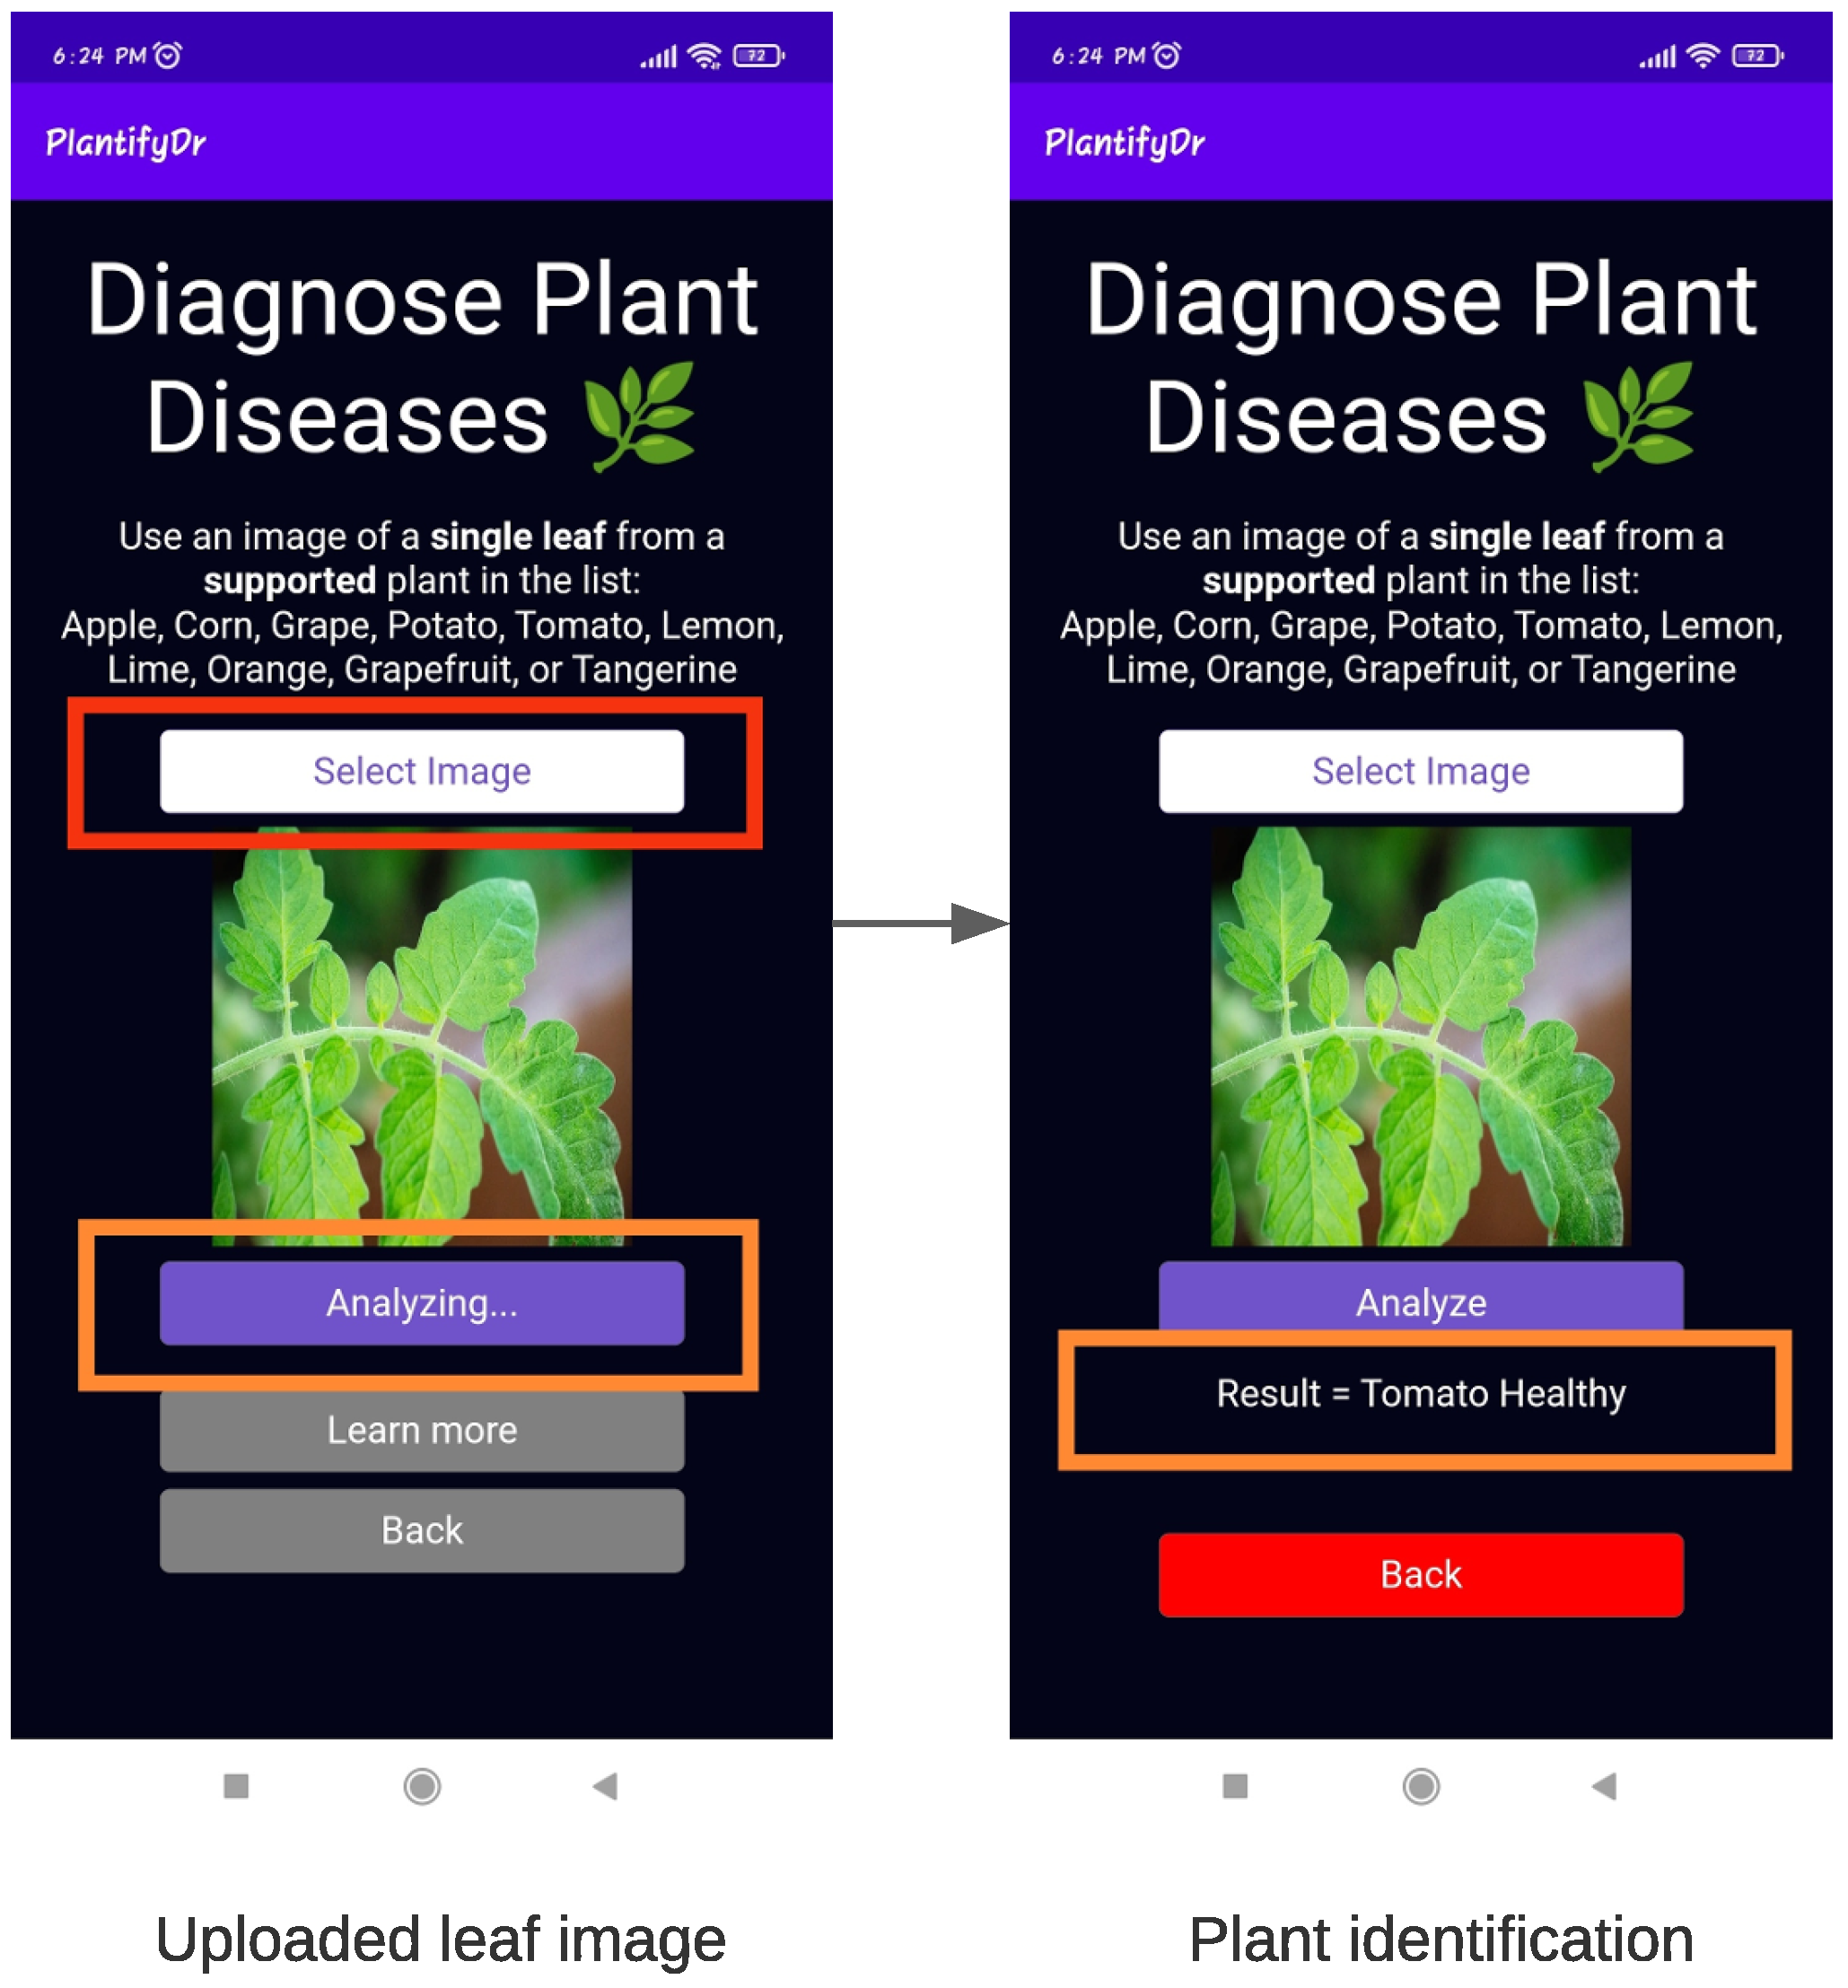
2.3.6. Functionality

Functionality validates the goal of an app and its purpose. People search for apps in app stores using essential functionality as a keyword, demonstrating how significant this criterion is for an app [55]. The functionality assessment criteria for plant disease detection apps included plant identification, plant coverage, disease detection, infected area visualization, disease severity estimation, treatment, and expert/community support.
To define the rating scale of those assessment criteria, we emphasize technological advancement, such as the adoption of artificial intelligence that provides automation. Manual techniques in conventional planting processes cannot cover huge plantations or give critical early instructions in decision-making processes [56]. As a result, it is important to create automated solutions that are practical, reliable, and cost-effective in monitoring plant health and delivering useful information to decision-makers, such as disease detection, estimating its severity, and recommending the correct dose of pesticides in the treatment [57]. The functionality sub-scale criteria and the definitions of the rating scores to evaluate those criteria are presented in Table 2. We discuss each of those assessment criteria below.
There is a strong demand for automated plant identification that aids amateur users who lack specialized knowledge in plant science in identifying plant species [58]. In recent years, we have witnessed ample research on artificial intelligent-based automatic plant identification from plant images [24,59]. The leaf is an appropriate organ for this identification system as it has several distinct features, such as shape, vein, and texture [59,60]. Thus, leaf identification is critical in plant classification [60,61]. Wang et al. [59] provided a thorough overview of image processing techniques for this automatic plant identification from the leaf along with some frequently used machine learning algorithms such as SVM, KNN, RF, K-Means, and Hypersphere classifiers. For large-scale plant classification, the deep learning method that uses a convolutional neural network (CNN) to generate discriminating features for plant classification has become more prominent recently [24,62,63,64]. Hence, a rating of 5 has been given for the automation of plant identification, which means the app will identify the plant from the given picture. A rating of 3 has been assigned for the manual selection of the plant, as plant identification is crucial for disease detection. Here, users will select a plant from the given list of plants in the app, or they will have to mention the name of the plant. The lowest rating of 1 has been given to the lack of plant identification.
The range of different plants for pathogen diagnosis is also a critical aspect, as, with the inclusion of various plants, apps can cover a much broader range of diseases. The range of plants was established by examining the apps and appropriate values were assigned on the rating scale. The larger the plant coverage, the higher its value on the rating scale and the lowest value has been given for zero plant coverage which means the app does not cover any single plant.
Deep learning is a popular machine learning technique for detecting plant disease due to its automatic prediction from large amounts of data with high accuracy. One such commonly used dataset is “PlantVillage” [65], which contains 54K+ healthy and unhealthy leaf photos in 38 groups based on species and disease [66]. Using leaf images of healthy and sick plants, customized deep learning models based on unique convolutional neural network architectures have been constructed to diagnose plant diseases [64]. Many conventional deep learning architectures are paired with optimization and customization approaches to provide considerable accuracy using technology in plant disease detection [64,67,68]. The performance of several deep learning techniques has been studied and compared [69]. Therefore, it is expected that mobile apps should implement them to automate disease detection. Thus, the highest value of 5 has been assigned to the rating scale for automatic disease identification from the plant image. A rating of 3 has been assigned if any app identifies the disease through a questionnaire, and a rating of 1 has been given for the inability to detect the disease.
After recognizing the plant disease, identifying the infected portion and its severity estimation are crucial tasks as they will inform the user about the disease’s threat level. Severity estimation refers to the precise measurement of the leaf area showing disease symptoms [70]. The unhealthy region of the plant leaves can be detected by the color space conversion, then masking the green pixels (as they indicate the healthy areas of leaves) and finally applying a threshold value to remove the green pixels so that the image contains only diseased areas [71]. A novel network, PD2SE-Net [72], has been introduced to diagnose and estimate the severity of plant diseases. A U-Net architecture has also been utilized to segment sick leaf areas [70]. So, if the result can be gained automatically from the image for both the visualization and severity estimation of diseased areas, the highest value of 5 has been assigned on the rating scale. On the other hand, if the user needs to point out the diseased portion of a leaf before the result is obtained, it has been rated with a moderate value of 3. A value of 1 is assigned for the absence of these features.
Recognizing a critical issue is important, but solving the problem is even more important. The same may be said for apps for identifying plant diseases. After the disease has been identified, the user must know what to do for the cure. Apps can recommend a cure from their own solutions or link users to Google’s solutions. As the information provided by Google is recent, the highest rating of 5 has been assigned for it. A rating of 3 has been assigned for the fixed treatment information.
Even after all the solutions, getting aid from professionals or sharing any sort of problem with fellow users feels fantastic. As a result, community support is a valuable resource, and users become more engaged with the app because of their sharing. It also serves as a link between users and specialists. So, the highest rating of 5 has been assigned for any sort of expert and community assistance, and a lower rating of 3 for solely community assistance.

2.3.7. Transparency

In any development, transparency refers to the open and honest sharing of a project’s status in real-time. The transparency of mobile apps has been a significant concern for consumers in recent times [73]. Nowadays, software developers are dedicated to gaining and maintaining user trust, which is critical to the industry’s growth and development. However, users are uninformed of how information is stored and disseminated because data transmission occurs in the background of apps [74]. Moreover, trust is earned by providing explicit descriptions of what each app performs and acting in accordance with those explanations. Consumers’ sharing of data between apps will be available to all users, regardless of the app’s ability to work or not work. Consumers will choose when and how much they can share with other people. The following factors were examined while evaluating the transparency requirements of the selected apps: (1) validity of the information provided in the app store description; (2) authenticity of the publisher or developer and the app source; (3) evidence-based app trial; (4) determining whether the app is feasible to achieve the developer’s stated goals, and (5) a general alert to ask users’ permission before collecting personal or private data and location information [73].

2.3.8. Subjective Quality

An app’s subjective quality is related to the user’s opinion, satisfaction, dissatisfaction, or overall view of the app. To assess the subjective quality, the raters looked at how satisfied they are with an app, how likely they are to pay for it, and how they would rate it overall. This sub-scale considers the user’s willingness to pay for the app, the user’s recommendation for the app, and the user’s rating of the app.

2.3.9. Perceived Impact of Users

The use of an app can influence a person’s attitude toward relevant areas of their life. Considering plant disease detection apps can influence a user’s knowledge of plant diseases, a well-informed app can make a person’s gardening life easier and improve a user’s knowledge about relevant areas. Furthermore, such apps can influence people to garden or gain a better understanding of plant care issues. Therefore, the criteria to evaluate an app’s perceived impact on its users are defined as: (1) improve awareness of the necessity of addressing plant diseases; (2) increase knowledge or understanding of plant diseases; (3) change people’s minds about how to improve plantation and care; (4) improve intentions or motivation to address gardening; (5) stimulate additional plant management help-seeking, and (6) increase plant disease treatment.

3. Results

3.1. Internal Consistency of Our App Rating Scale

Internal consistency describes the extent to which all the items in a test measure the same concept or construct (in our case, the questions/items used in a sub-scale/assessment criteria), such that the items are consistent with one another and measure the same thing [75]. We used Cronbach’s alpha, the most popular means of calculating internal consistency [76]. Cronbach’s alpha ( α ) reliability coefficient indicates internal consistency that ranges between 0 and 1, with α 0.9 excellent, 0.8 α < 0.9 good, 0.7 α < 0.8 acceptable, 0.6 α < 0.7 questionable, 0.5 α < 0.6 poor, and α < 0.5 unacceptable [77]. The closer the value to 1, the higher the internal consistency.
For determining internal consistency, we placed all the apps we rated using our proposed rating scale. Table 3 reports the internal consistency of the sub-scales of our devised rating scale—aesthetics, performance, usability, subjective quality, transparency, and perceived impact. We excluded two sub-scales—general and functionality, as their items are not meant to be collective measures of the construct. The overall internal consistency of our modified scale was high at alpha 0.97, which is excellent [77].

3.2. Inter-Rater and Intra-Rater Reliability

Inter-rater reliability is a way of quantifying the level of agreement between two or more raters who rate an item (in this case, an app) independently based on a set of criteria [78]. We used the intra-class correlation (ICC) method to assess inter-rater reliability. ICC is one of the most widely used statistics for evaluating inter-rater reliability if a study includes two or more raters [79]. In our study, all apps were rated by the same three raters. Thus, we used the ICC two-way mixed model as it is recommended when the raters are fixed and each of the apps is rated by all raters [80]. Depending on the 95% confidence interim of the ICC estimation, values smaller than 0.5, within 0.5 and 0.75, within 0.75 and 0.9, and higher than 0.90 suggest poor, moderate, good, and excellent reliability, respectively [80]. The ICC score of our 17 apps was calculated as 0.869 (95% CI ranging from 0.847 to 0.888), showing a good level of inter-rater reliability.
Intra-rater reliability is estimated to measure how consistent an individual is at measuring a set of criteria. This is a reliability estimation in which the same evaluation is performed by the same rater on more than one occasion. To measure the intra-rater reliability of the three raters, the three raters reviewed all 17 apps twice in a two-months interval. All three raters showed a significantly good level of intra-rater reliability between their two ratings; their two-way mixed ICC values were 0.921 (95% CI 0.851–0.958), 0.985 (95% CI 0.972–0.992), and 0.869 (95% CI 0.847–0.888), respectively.

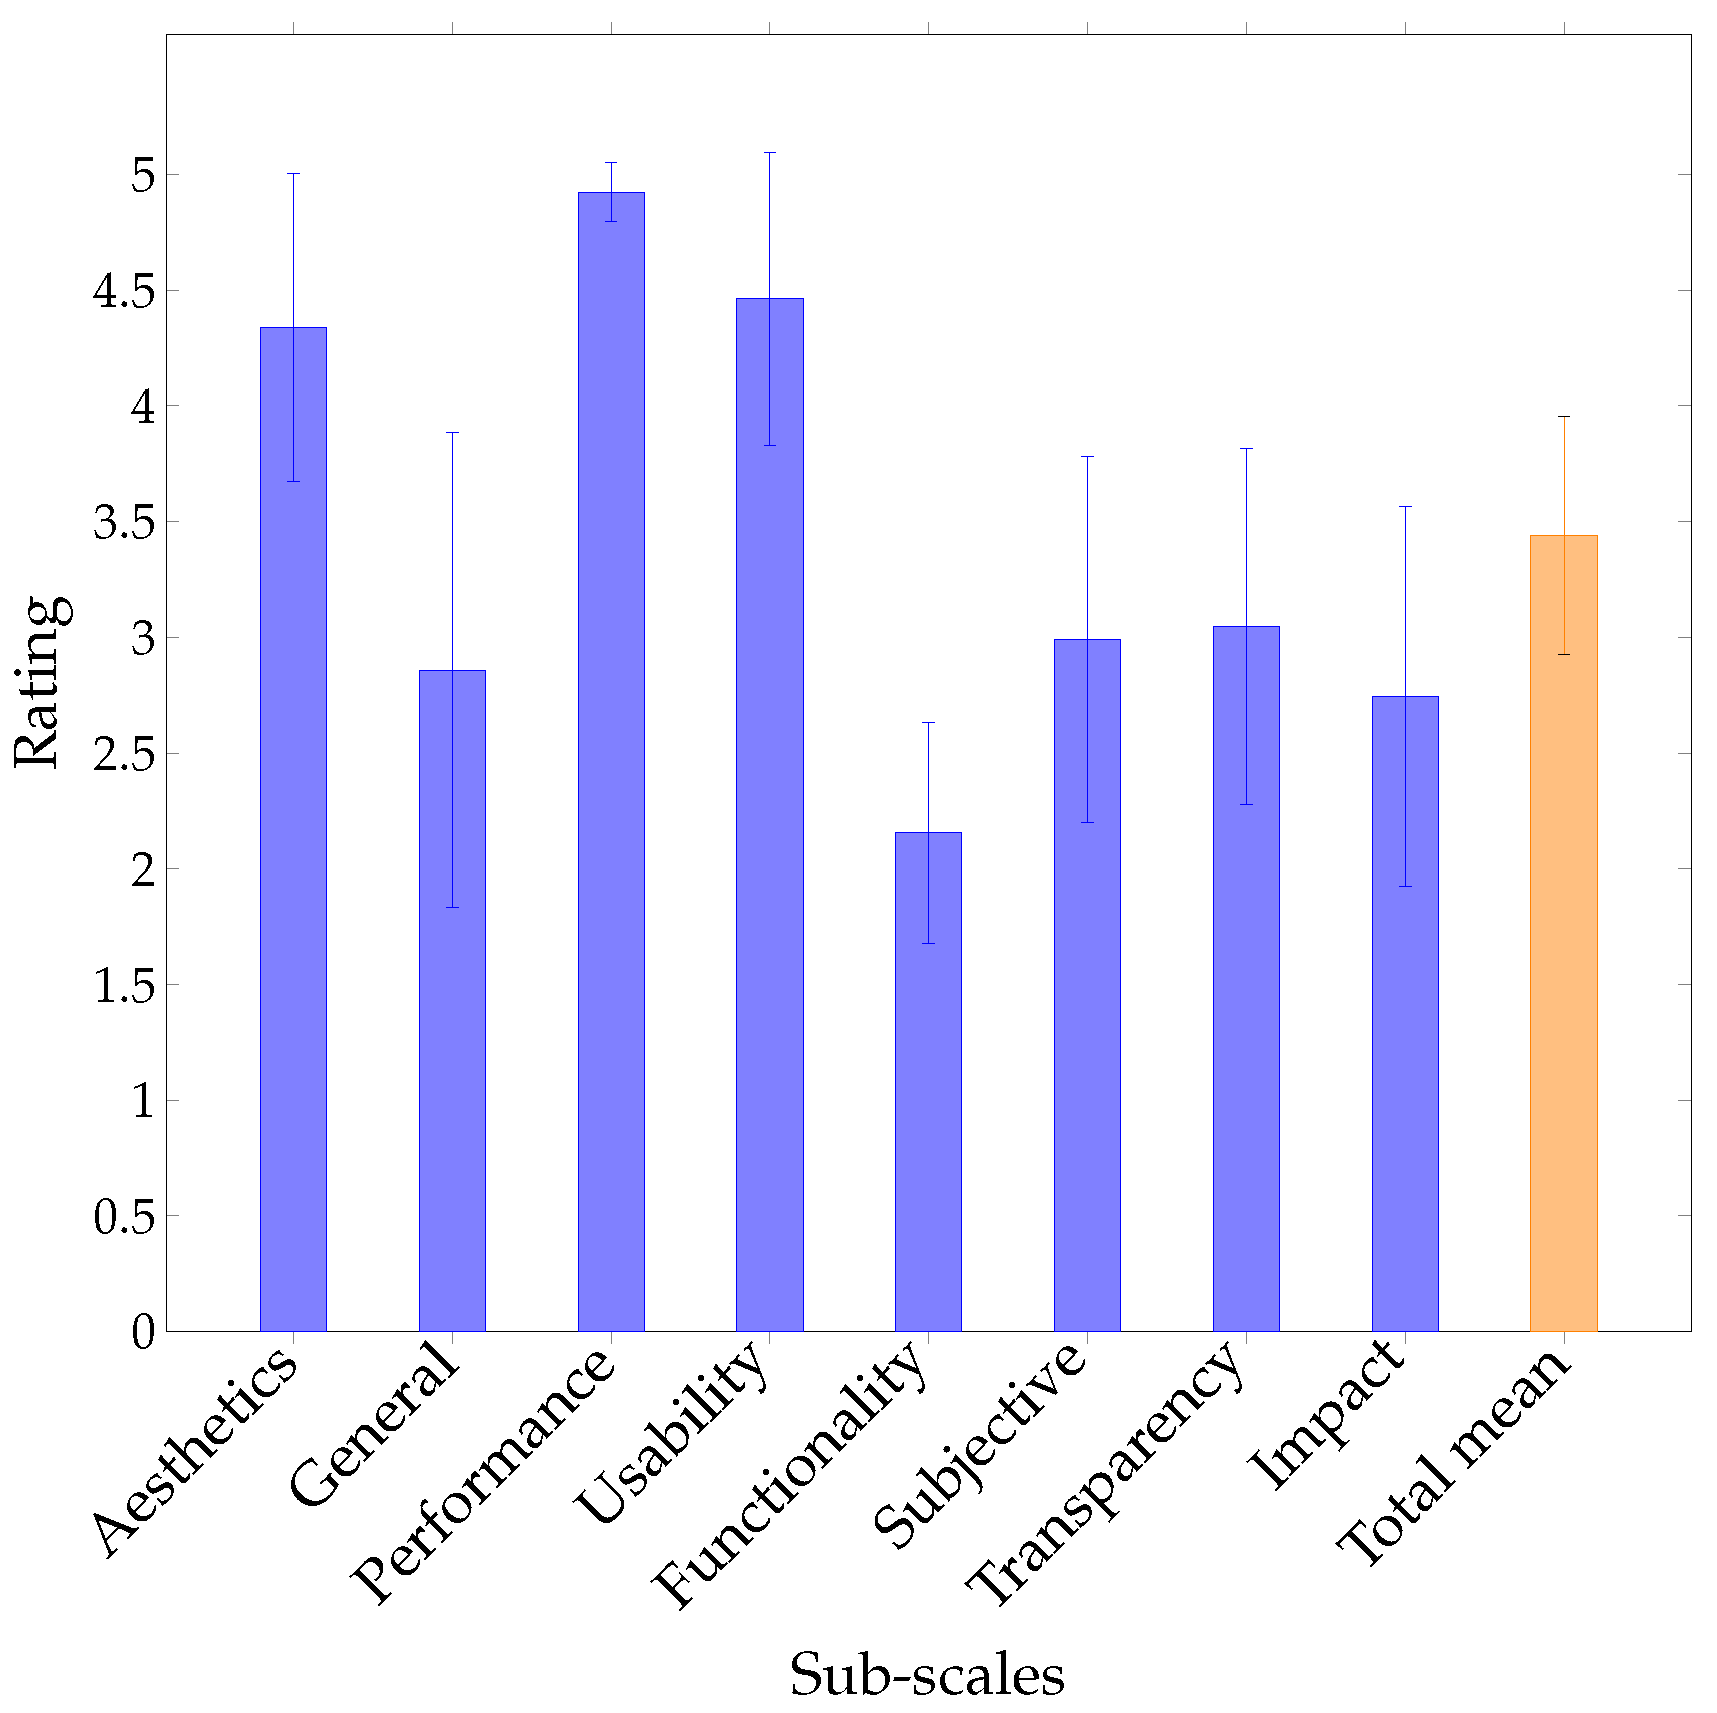
3.3. Overall Assessment of Evaluated Apps

The assessment scores for all 17 selected apps are reported in Table 4, with sub-scale ratings and their mean and standard deviation. The mean of the scores of all criteria in a sub-scale is used to calculate the rating of that sub-scale. The overall mean and standard deviation of an app’s scores in all sub-scales were used to evaluate its overall quality.
In aesthetics, 41.18% (7/17) of the apps are rated above 4 out of 5. Among them, three apps, Cropalyser, Plantix–your crop doctor, and Leaf Doctor, receive the highest score, i.e., 5 out of 5. Only one app, Plant Diseases and Pests, receives the lowest score of 1.
In general characteristics, all the apps except Plantix–your crop doctor received a score below 4. In terms of login or sign-up, 82.36% (14/17) of the apps do not require users to log in or sign-up to use—this allows the rural farmers and gardeners to easily benefit from the app. However, only three apps (17.67%) send users notifications about their regular tasks. Most of the apps, 94.11% (16/17), do not have a premium subscription. The user cannot export their data in 70.59% (12/17) of the apps. 52.94% (9/17) of the apps do not present information visually through charts, graphs, images, or videos and do not have any tutorial or onboarding facilities to help users operate the apps. Moreover, 64.71% (11/80) of the apps do not have customization features. In this sub-scale, the app Plantix–your crop doctor received the highest score of 4.13.
In the performance sub-scale, 14 out of 17 apps (82.36%) received a high score of between 4.33 and 5, which means they are responsive, their components are working well, the apps do not crash, and they consume low battery power and have a reasonable memory. Among those 14 apps, Leafy and Plantix–your crop doctor scored 5 out of 5, which indicates that these apps show excellent performance while being used.
In the usability sub-scale, 82.36% (14/17) of the apps were very easy to use and scored 4 to 5, 70.59% (12/17) had high navigational accuracy, and 58.82% (10/17) depict a high quality of gestural design. Overall, only a few apps, 29.41% (5/17), scored high (between 4 and 5) in this sub-scale. The lowest rated app in this sub-scale is Plant Diseases and Pests, which scored 1.50. Only the app Pestoz–Identify Plant diseases scored 5 out of 5 in usability.
The functionality sub-scale is the most significant sub-scale as it evaluates the features an app provides for disease identification and management. In our review, only 6 out 17 apps (35.29%) scored between 3 and 3.57 and the rest scored below 3. The results indicate that apps with proper automation of identifying plants and diseases along with disease severity estimation are mostly missing in the current apps.
The transparency sub-scale is assessed based on an app’s description in the app store, credibility through a legitimate source, verified by evidence, goals, and policy in accessing and sharing user data. In this sub-scale, only 3 out of 17 apps (17.65%) scored above 4. Among them, Plantix–your crop doctor scored 5 out of 5. Two apps, Cropalyser and Leaf Doctor, each scored 4.40.
The subjective quality sub-scale is measured based on an individual’s willingness to use, recommend people and pay for the apps and the overall star rating given by raters. In this sub-scale, 3 out of 17 apps (17.65%) scored 4 and higher. Among them, Plantix–your crop doctor scored the highest value of 5. PlantDoctor scored the lowest value of 1.
The perceived impact on user sub-scale measures the effectiveness of an app in changing the attitudes of the farmers and plant lovers who use the app. This was evaluated based on whether the app provides a community or forum to share info and seek help. Eight out of 17 apps (47.05%) help enormously to increase awareness of the importance of addressing plant diseases and behavior change toward crop illness treatment, 58.82% (10/17) are likely to increase knowledge or understanding of infected plants; 29.41% (5/17) do not have a concern about these observations. Two out of 17 apps (11.76%) (AgroAI–Plant Diseases Diagnosis and Plantix–your crop doctor) rated 4.15 and 5, respectively. They can change attitudes toward improving plantations and care. The app, Plantix–your crop doctor, provides strong motivation for users in their gardening and farming. On the other hand, 23.53% (4/17) of the apps scored 1 in this sub-scale.
From the overall screening of the mean values of the evaluated apps, Plantix–your crop doctor, scored the highest (4.56), but the functionality score for this app was 3.29. Most of the apps (10/17) got mean values ranging from 3 to 4, indicating that the quality of the apps is not up to the mark and they are specifically lagging in functionality.
Figure 2 shows the average sub-scale specific scores and the total mean score of all 17 apps. The overall performance and usability of the evaluated apps are very good (scored above 4.5), which means they are easy to use and fast to open. However, the overall aesthetic value is average because few apps are outstanding and eye-catchy to look at, and most are not so attractive. Our focus is the functionality sub-scale, which scored below 2.5. This value indicates that we have not found any quality apps that can do all the desired tasks regarding plant disease identification.

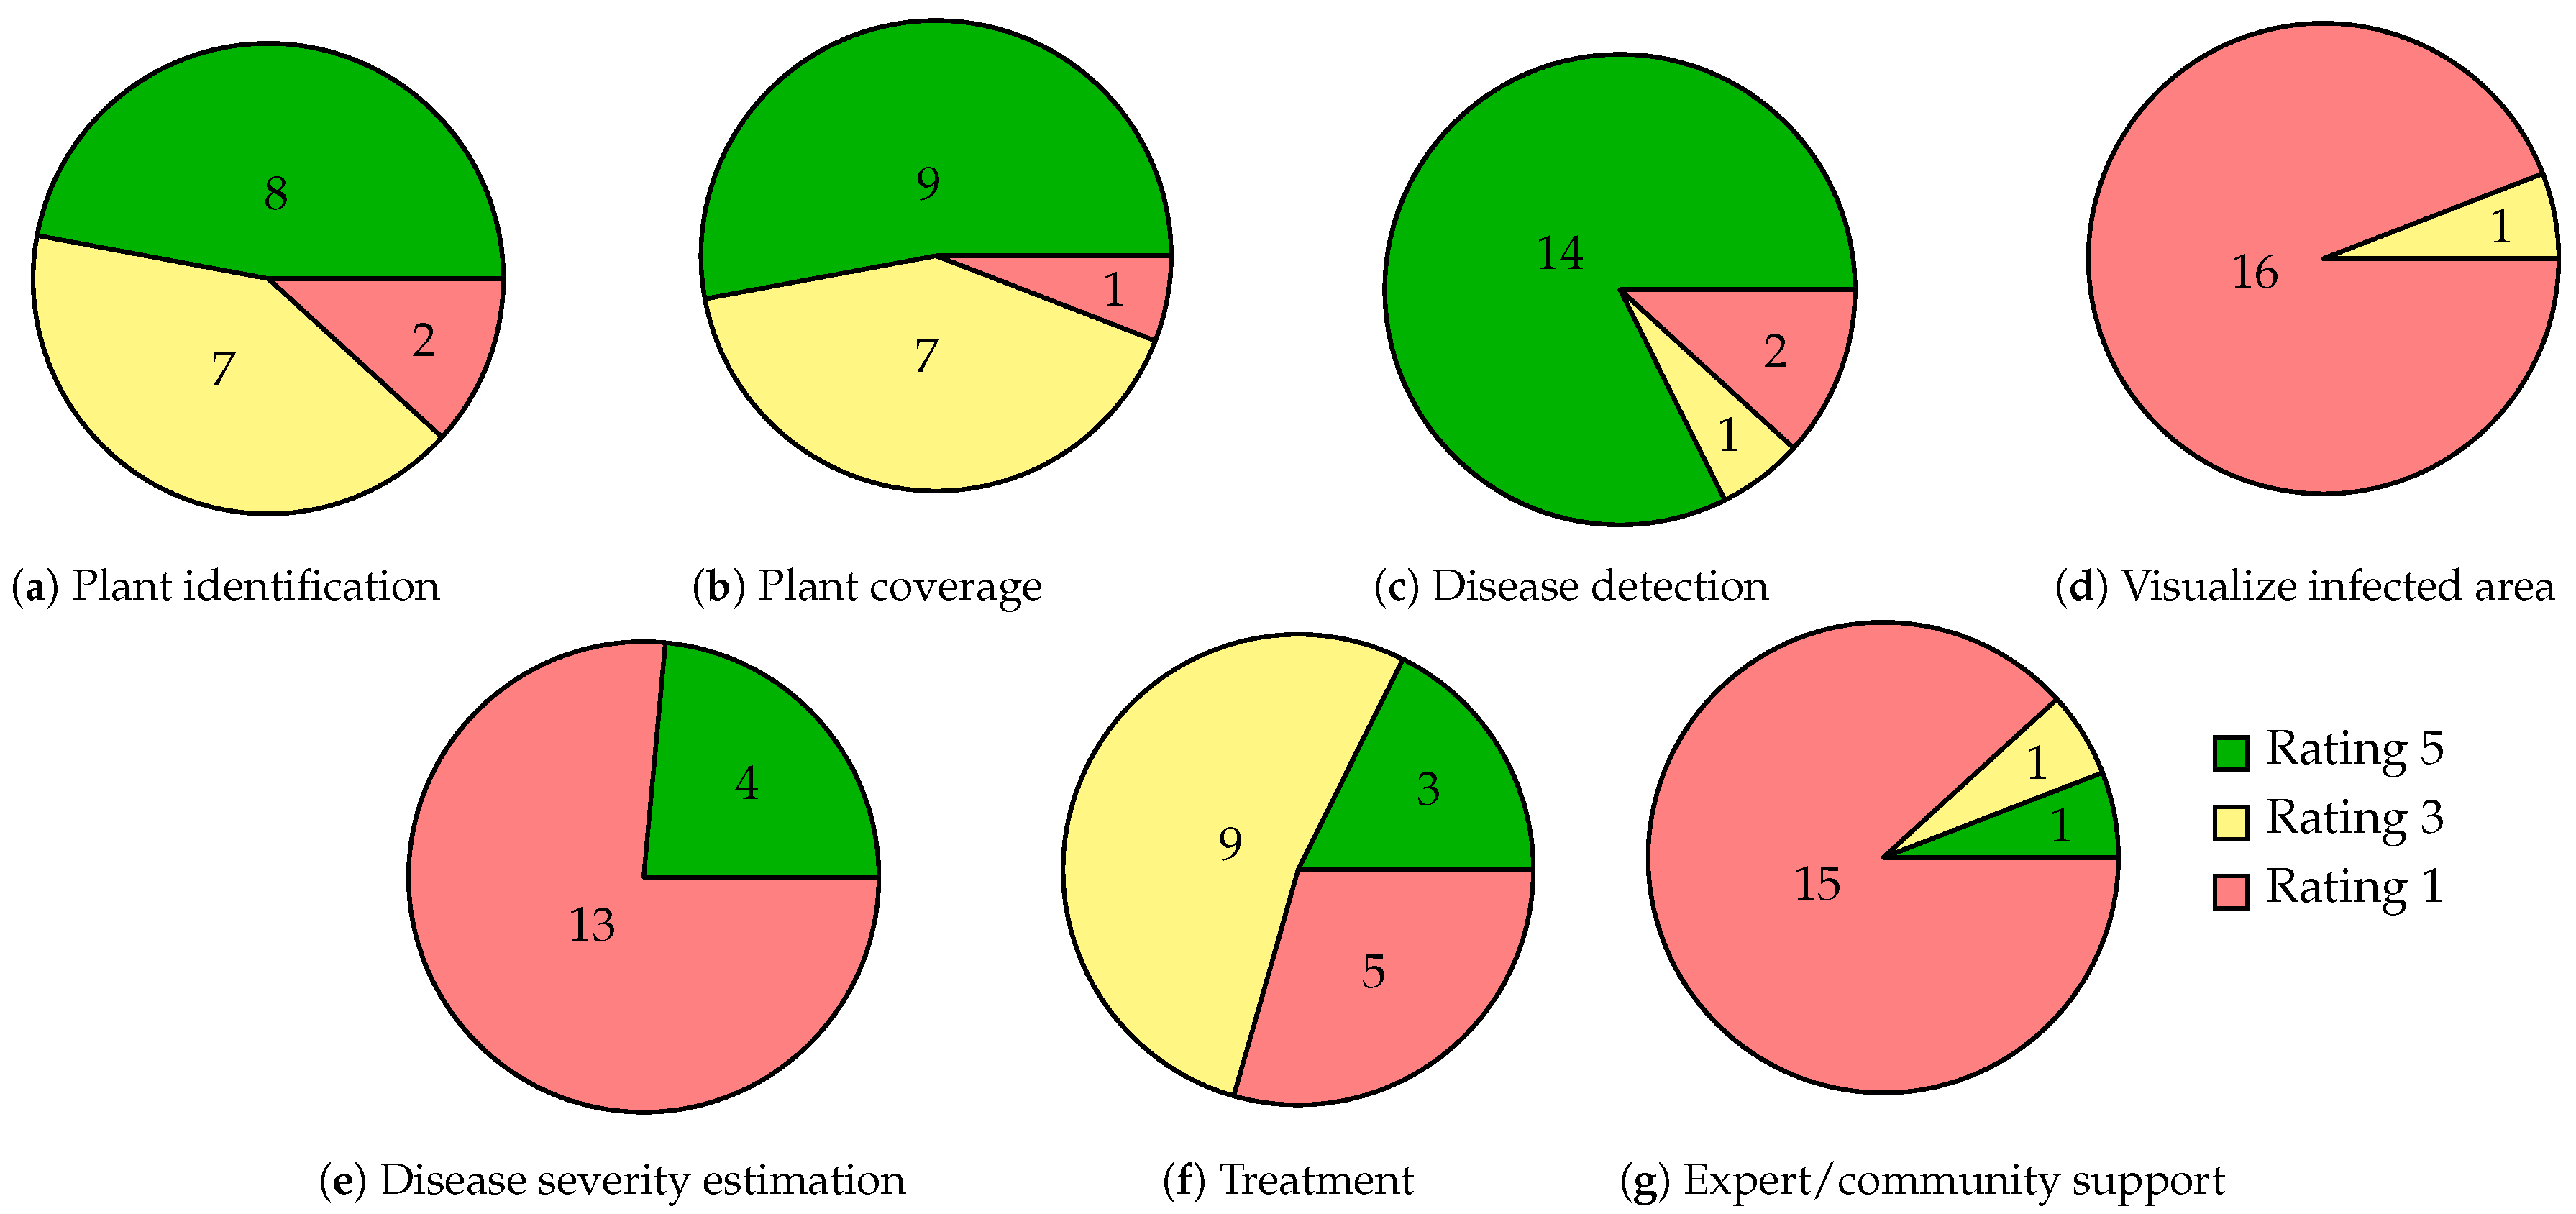
3.4. Assessment of App Functionality

Plant disease identification apps should contain some major criteria for fulfilling their sole intention. These apps are meant to help farmers and gardeners by providing solutions regarding their plants. However, the reality is different because the apps lack the functionalities to provide necessary to help the target users. We have already discussed seven critical characteristics for plant disease detection apps in Section 2.3.6. They are (1) plant identification; (2) plant coverage; (3) disease detection; (4) visualize infected area; (5) disease severity estimation; (6) treatment, and (7) expert/community support. The outcomes of our functionality analysis of 17 evaluated applications based on the seven assessment criteria are shown in Figure 3.
First, identifying the plants is a preliminary criterion for plant disease detection apps. Among the 17 reviewed apps, 47.06% (8/17) can automatically identify plants from the given image and 41.18% (7/17) kept the option of choosing the plants manually before diagnosing any disease. Only two apps, Leaf Doctor and Riceye, do not fulfill this criterion as Leaf Doctor focuses only on disease severity and visualizing the infected area of the leaf, where Riceye is dedicated for rice crops only. Different apps have adopted different technologies to identify plants. For example, the PlantifyDr app uses ML algorithms to identify a plant and detect whether a specific plant has a disease or not. Plant identification by PlantifyDr is shown in Figure 4. Another key criterion in our study was to identify the plant coverage, i.e., the number of plants covered by the disease detection apps. The only app that missed this criterion is Leaf Doctor. Most of the apps, nearly 53% (9/17), can identify diseases of more than 10 plants.
Our most significant functionality is disease detection, where it is expected that an app would automatically recognize the disease from the photos of affected plants or leaves. Fortunately, 82% (14/17) of the apps have fulfilled that expectation. Only one app, Cropalyser, identifies diseases based on answers given by the user from a series of questionnaires. On the other hand, the Leaf Doctor and Plant Doctor apps do not provide this functionality. Our reviewed apps use a variety of techniques to detect diseases. For instance, Plants Disease Identification app uses ML Apple technology to classify the plant diseases productively. The apps Cassava Plant Disease Identify and Garden Plant Diseases Detector use computer vision techniques to classify the disease and monitor severity. To get the maximum accuracy in disease detection, a large image database containing thousands of images has been used for developing a model using artificial neural networks (ANN). The app Cassava Plant Disease Identify allows users to report photos that are not properly captured. As more photographs are uploaded, the accuracy of the database improves. Users can notify the developer of the app by email if a photograph is not recognized. The app is improving its accuracy over time by using ML. The app Pestoz- Identify Plant diseases also applies advanced computer vision techniques to identify the diseases. Figure 5 shows screenshots of the disease detection UI of the Plantix and AgroAI apps.
Another important criterion is disease severity estimation which is provided by only four apps, AgroAI–Plant Diseases Diagnosis (Early Access), Leaf Doctor, Riceye, and Cassava Plant Disease Identify. Visualization is also a useful measure to assess the severity of disease and identify the infected area of a plant leaf.
Only Leaf Doctor provides this functionality. This app helps users differentiate between damaged and healthy leaf tissues and calculates disease severity as a percentage, as shown in Figure 6. However, the app requires user knowledge and input. The user needs to select up to distinct colors that indicate healthy tissues on the app’s touch panel and subsequently move a threshold slider until only symptomatic tissues are changed into a bluish shade. Afterward, the app calculates the diseased percentage using that pixelated photo. The precision, accuracy, and stability of the Leaf Doctor app have been tested using six diseases and typical lesions of increasing severity [81].
Providing treatment and care suggestions for plants is an essential function in motivating farmers and gardeners to use plant disease detection apps. Two apps, Leafy and PlantifyDr, detect the plant disease and subsequently take users directly to Google to get the latest information about the treatment (see Figure 7a for UI screenshots of PlantifyDr). Nine apps provide treatment information from their own database. Only the app Agrio provides treatment through a community (see Figure 7b).
Local farmers can contact field investigators through Agrio app to receive benefits. This app uses drones for remote field investigation. Users of Agrio app can look at remote sensing insights, alerts, and data gathered during the inspection process. They have a community where farmers can share their problems and intelligent sources quickly provide necessary solutions or treatments. Within the groups, discussions about the necessary interventions are becoming simpler. This app also uses AI, which makes precise hyper-local weather forecasts easily available to all growers. Growing degree days (GDD) is a measure used to calculate the amount of heat required for the development of organisms (such as insects) in each stage of their growth. Monitoring GDD helps eliminate the guesswork in determining the time required for control measures. One of the exciting possibilities is the alignment of treatment schedules in different farms and gardens. Area-wide integrated pest management is the paradigm in which pest control decisions and timing are coordinated across many fields.
Agrio’s daily briefing informs growers of the required scouting operations and interventions in their fields and also uses big data to optimize predictions and offer phenology models specific to the different locations. They coordinate area-wide integrated pest management operations and present users with the optimal treatment on time using AI. Growers can use image identification capabilities if help is needed with the trap analysis.
One extraordinary feature to connect the user with fellow gardeners, farmers and experts is the creation of a community. Only two apps provide this feature, Plantix–your crop doctor and Agrio. Figure 8 shows the community support UI screenshots of these two apps.
The Plantix–your crop doctor community is the world’s largest online community of farmers and agricultural specialists where users can take advantage of agricultural professionals’ knowledge and share their crop-related problems to get solutions. The Agrio app provides a community with experts who respond to the users’ problems more individually and provide treatment based on the issue, as discussed above. In conclusion, this expert/community support feature should be included in all the apps for better user connectivity.
Our overall assessment of the functionality criteria for the apps is illustrated in Table 5. Here, we can see that 88.23% of the apps can identify plants and detect diseases. In these sectors, apps from both app stores showed almost equal contributions. The most important criterion for our apps was disease detection, but two of the apps Leaf Doctor and PlantDoctor did not provide this functionality. About 94% of the apps cover more than 10 plants, and, in this case, Android apps have a richer plant disease database than iOS apps. Sixty-four percent of the apps provide treatment after diagnosing plant disease. Most of our reviewed apps lack three functionalities—disease severity estimation, visualizing the infected area, and expert/community support. Of all the apps, 23.52% can estimate the severity of the disease from a leaf, 11.76% have expert/community support, and only one app can visualize the infected area from an infected leaf.
Among the 17 reviewed apps, Agrio, AgroAI–Plant Diseases Diagnosis, Cassava Plant Disease Identify and Plantix–your crop doctor, contain a total of five out of seven functionalities. Seven apps, Pestoz Identify Plant diseases, Cropalyser, PDDApp: plant disease detection, Leafy, Plant Disease Detector, PlantifyDr and Plant Diseases and Pests, contain four functionalities. The remaining six apps contained less than half the functionalities outlined. In our study, no app was found to have all seven functionalities for the best plant disease detection and management.

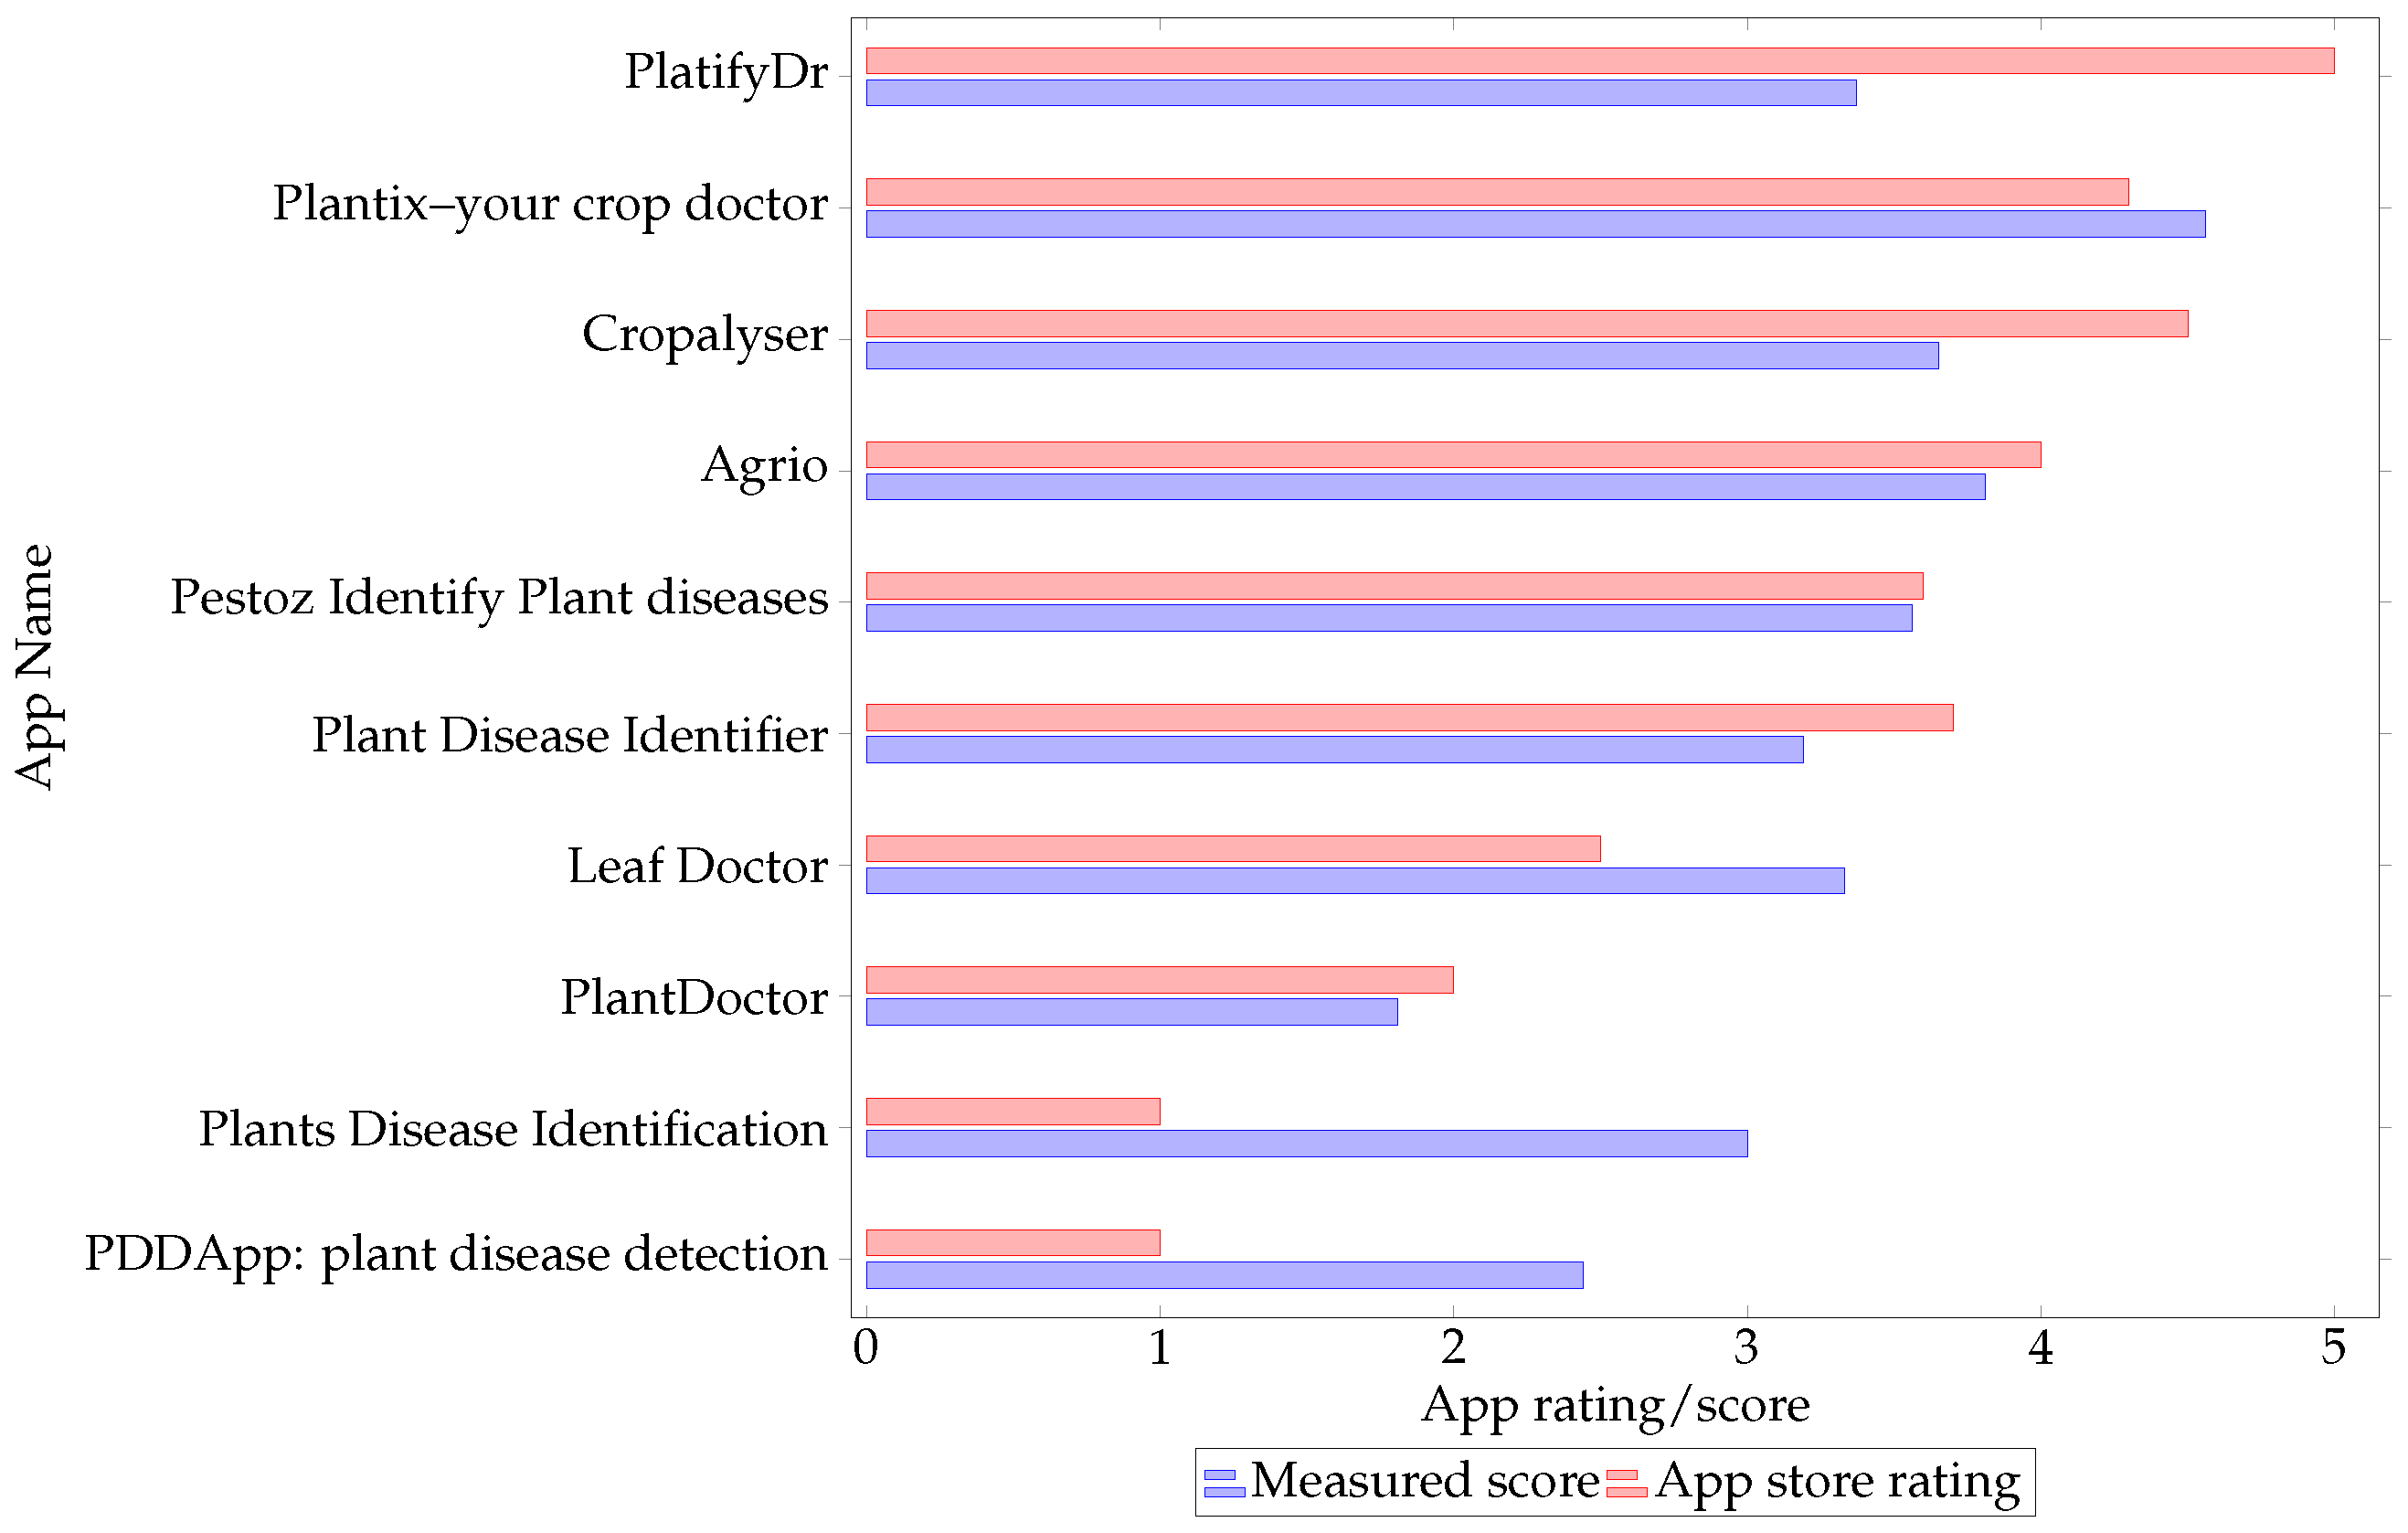
3.5. Analysis of App Ratings from the App Store and the Developed Rating Scale

The app stores’ ratings and our rating scale’s ratings of the evaluated apps were analyzed. Reviews and ratings help users decide whether to download an app. According to a study [82], mobile consumers do not even bother downloading an app with a rating of fewer than three stars. Additionally, 79% of users will check at least one review before downloading the application. Good ratings indicate that the app provides an advantage to its users. Developers can do everything to improve the app’s rating and make it more successful in the future. During this survey period, AgroAI–Plant Diseases Diagnosis (Early Access), Leafy, Plant Disease Detector, Riceye, Cassava Plant Disease Identify, Garden Plants Diseases Detector, Plant Diseases and Pests and Agrio apps did not have any star ratings. Thus, these seven apps were excluded from this analysis. Figure 9 shows the app store rating and our measured app rating of ten apps.
Three apps (PlatifyDr, Cropalyser, and Plant Disease Identifier) got a higher star rating from app store users, but some limitations were found in our analysis; they did not perform well in our devised rating scale. Consequently, these apps achieved a lower rating from our raters. The measured score and app store ratings are almost the same for four apps (Agrio, Pestoz Identify Plant diseases, PlantDoctor, and Plantix–your crop doctor), which shows that our raters agree with the users’ ratings found from the app stores. Finally, three apps (Leaf Doctor, Plants Disease Identification, and PDDApp: plant disease detection) received a slightly higher score compared to the app stores’ ratings.

3.6. Analysis of User Reviews from the App Stores

Text reviews are more reliable than star ratings in describing users’ actual experiences. After using a mobile app, users can add comments in the user reviews about that app. The user review section of an app store represents the experience of using the app. Users’ feedback helps potential new users and developers to understand an app’s quality. The developer benefits from the evaluation because it focuses on the app’s limitations and technical flaws, allowing them to create a better version of the app.
In this research, to understand the overall user experience of those apps, two word clouds have been created, as shown in Figure 10. Word clouds are graphical representations of word frequency. The larger the word in the graphic, the more frequently that word appear in the text [83].
User comments from the app listing from the respective app stores along with the app metadata were collected for this study. Based on the users’ review ratings of the app, the consumer comment sections were split into two kinds—the comment is positive if its rating is four stars or above; otherwise, it is considered negative. The study of user feedback from both app stores on plant disease detection apps reveals that most apps have little or no strong feedback or favorable ratings from smartphone users because the count of apps installed was generally poor for most of the relevant applications. Moreover, the Apple App store does not show the number of downloads of an app.
However, 35.30% (6/17) of the apps contain informative comments and have 10K+ to 10M+ installations. A word cloud is generated in Figure 10a using the positive comments collected from the selected apps. One of the most optimistic collections of user comments has been noticed for Plantix-your crop doctor. This app has already received 60K+ comments, with 65% being 5-star reviews. Among the 35K+ highest star rating comments, people mentioned the good points of this app. Users have used several words to express their satisfaction, such as “helpful,” “wonderful,” “amazing,” “fantastic,” “awesome,” “very good,” “great,” “best,” “excellent,” “useful,” “easy to use,” “accurate,” “nice,” and many more. Many users gave “thanks” and praised the expert team of this app community. According to some users, the finest plant disease diagnosis app is Plantix–your crop doctor. The app has several wonderful features, such as detection ability for crop diseases, a fertilizer calculator, and pest and disease-related information with high-resolution pictures. The app provides community support where plant lovers can share plant-related problems and get suggestions from other users and experts. One user has commented “Hello team plantix You people are doing wonderful job... I personally loved this app this app gives complete guidance for farming a variety of crops. Gives details not only about disease but also about its treatment also provide guidance about fertilization of crop. It would be great if more people installed and gave it a shot you will not regret installing it. Best luck team plantix and thanks a lot.” This comment is supported by many users. Another app, Agrio, has received the second-highest number of positive reviews from users.
A word cloud is generated in Figure 10b using the negative comments collected from the selected apps. Some users provided their damaged or diseased leaves images to the app, but could not detect the disease, or sometimes even the plants, prompting some comments to include the word “unable.” The word “stuck” is used to indicate that an app had been trying to load a certain step or was being so sluggish that it seemed to have halted its task. Some apps have a lengthy lag, most often unable to load an image from their servers, so they can take a considerable time to load affected crop images. People use the words “unfortunately” and “worst” to express their dissatisfaction in these situations. Some apps’ databases are limited and require more data. Sometimes apps show an unexpected error message. Other problems include app “crashes” where the site does not function correctly. That is why users use the word “useless” many times.
Users’ dissatisfaction related to the Plant Disease Detection and PlantifyDr apps was focused on several points, including limited crop and plant availability, an inability to detect plants, failure to log-in, the system displaying unknown errors, incorrect weather reports, and failure to capture any pictures with a high-resolution camera. A user posted a comment that was supported by 1 K+ other users. He wrote: “Useless app for me. The app asks you to pick the top 4 crops you are interested in and it is really frustrating that you are forced to select from a VERY limited collection of crops that don’t include the ones I want, like kale, spinach, garlic, broccoli, beets.
The Leaf Doctor app can not always determine the correct threshold of the given leaf. It indicates inaccurate thresholds in most situations. Riceye provides a garbage threshold every time. When a picture is imported into the PlantDoctor app, it always responds that the image is unclear, despite the fact even if the image is in HD quality. The Pestoz app has poor service and needs major upgrades. It has a limited database of diseased plant images. Sometimes it shows an unexpected error message. It “crashes” and the site does not function correctly. Plantix–your crop doctor covers 45+ crops and 600+ diseases related to them, does not support all ornamental plants and also has a community to share queries with experts. The Agrio app is sometimes stuck on the home interface. Consumers used the “worst” word several times to describe these incidents. Users put their damaged crops to the “Agrio community,” but no help or suggestion was found from the team. The Cropalyser app takes a considerable time to load crop images and is most often unable to load an image from its servers. PDDApp: Plant Disease Detection shows a “Check Connection” message every time through email; even with a strong internet connection, it can not run a single job. Plant Disease Detector is a flawed app that can not detect plants or leaves as it shows two random thresholds of anything.
In summary, most of the currently available apps suffer from serious system design flaws and development issues and need improvement.

4. Discussions

4.1. Principal Findings

We found many apps in the app stores when we searched by the keywords “plant disease”, “leaf disease detection,” etc., but only a few of them were well designed and developed to detect plant diseases successfully. Unfortunately, those few apps of key interest also lacked the seven basic functionalities related to plant disease detection. Both plant identification and disease detection are present in 88.23% (15/17) of the apps. While selecting a plant from a pre-specified category, sometimes apps cannot identify it correctly. Plant disease detection is the central feature of all these apps, yet Leaf Doctor and PlantDoctor do not provide this feature. PlantDoctor gives the option of taking pictures through the device camera and every time it shows the message “The image is not clear to be identified” even for a high-quality image. Another app, Plant Disease Detector, gives a verdict for both diseased and healthy plants by saying only “Diseased.” Severity assessment helps the farmers to decide whether their plant needs treatment and to what extent. This feature is present in only 23.52% (4/17) of the apps, where two of them (Plant Disease Detector and Riceye) display a random threshold value.
We have noticed that some apps’ designs are troublesome. First, 35% (6/17) of the apps need an uninterrupted internet connection to provide complete service, which is difficult to manage for village farmers or users living in remote areas where the internet service is often poor. Second, a handful of apps cannot upload pictures from the phone photo gallery, causing problems for users with low-quality device cameras or who may not have the proper illumination to take clear pictures while using the app. Third, most of the apps we reviewed were not multilingual, and thus, users of these apps must have a basic knowledge of English.
We have found several beneficial features in some of the reviewed apps. Plantix–your crop doctor is the best for plant disease identification. This app detects pests and diseases on crops and recommends the necessary treatment, gives disease alerts, and contains a fertilizer calculator for crops based on the farmer’s plot measurements. It also gives a weather forecast to let gardeners know the best time to weed, spray and harvest, along with cultivation tips. Users can interact with researchers, farmers, and plant professionals in an online forum to share plant health issues. They have more than 30 million images in their data set, which contains more than 400 crop diseases. This app applies ML algorithms and AI to photos to diagnose crops. It also allows for real-time disease and pest monitoring. The user’s images are submitted to the servers and are immediately examined to identify the disorder. The user is given essential information about the symptoms, triggers, agrochemicals, and biological remedies. The app includes a meteorological information system customized to farmers’ locations and a community option that allows them to communicate with other plant protection groups and thus, increase productivity [84].
Another app, Leaf doctor, is slightly advanced in that users can select healthy tissues using up to eight colors in the photograph and then be provided with the disease severity estimation. Also, users can fix the threshold by using a slider provided in the app. A significant flaw is that this app gives the severity estimation for any type of object which is not necessarily related to plants or leaves. A unique feature provided by the app AgroAI–Plant Diseases Diagnosis (Early Access) is the soil fertility test, where landowners can input the pH value of soil and see the proportion of different soil elements such as calcium, potassium, clay, silt, etc. but this feature needs more development. Another app with only the plant disease identification feature is Leafy, which works offline and identifies the correct plant and its disease, though it has a limited diseases list (only 30).
Providing treatment or prevention alongside disease detection is a helpful feature provided by 64.71% (11/17) of the apps. Also, many apps shared disease information with accompanying disease images, which is another useful feature for information gathering related to plant diseases. Community help is provided by two apps Plantix–your crop doctor and Agrio. In the Plantix–your crop doctor community, all gardeners, botanists, and agricultural experts can communicate and exchange suggestions—this is highly beneficial. However, in the Agrio community, plant disease detection is manually handled by their own expert team commenting in posts and suggesting treatments. Moreover, any other people can also comment in the community forum. This is highly beneficial for increasing farmers’ knowledge, improving their attitudes toward plant management, and increasing their help-seeking mentality. However, the number of such apps is minimal. Most of the apps lack basic functionality and do not benefit the users.
Automatic visualization of disease in an infected leaf helps to identify the diseased portion of a plant and this helpful functionality is missing from all the apps. The existing apps need their basic features improved where basic features will be present and so they will work more accurately.

4.2. Design Considerations

There are many aspects of existing plant disease detection apps that require significant technical improvements. A simple yet attractive user interface with high-resolution graphics will attract users and increase their app exploring time. Multilingual apps will encourage users from different countries to use the app and also give a better understanding of the apps’ functionalities. Apps that provide tutorials at the beginning will help users operate the app easily and correctly. Another simple but effective feature of an app that will keep users up to date on the status of their plants is regular notifications. Any efficient app will have low battery power consumption and low memory usage. Many of our reviewed apps frequently crashed while in use. This issue should be considered while developing apps, as it has a large negative impact on users. Moreover, the user interface components should work smoothly and be consistent.
From the functionality perspective, apps should perform all the operations accurately. Apps that cannot identify plants can keep major categories of plants, such as crops, vegetables, ornamental plants, medicinal plants, etc., covering many different plant types so that users can easily find their plants. The most important feature is plant disease detection, which is the focus of the apps. Apps should detect the diseases accurately and in the case of similar diseases, they should be able to give the likelihood of each disease. Disease severity detection is another basic criterion to understand the threat level of the disease that the app should provide. To perform the disease severity estimation properly, visualizing the infected area of the diseased portion is a prerequisite. Therefore, visualization has become a crucial task that should be performed by the apps using existing image processing and ML technologies. Additionally, more information about the disease and its control measures benefits users, which encourages them to take further disease management steps from the apps.

4.3. Limitations of This Study

Several apps were unfortunately discarded due to regional restrictions, specific language restrictions, and the need to have a license key to use the app. Furthermore, as our app search and evaluation, new apps may have been added, and some of the apps might have been updated with enhanced functionality or been removed from the app stores. In this paper, we did not evaluate the accuracy of the disease detection performed by those reviewed apps but rather focused on the software quality aspects, app features, and to what extent artificial intelligence is being adopted to provide advanced disease detection functionality.

5. Conclusions and Future Work

This paper features a survey on plant disease detection apps from three popular app stores. Our search results identified a total of 606 apps, from which we selected 17 based on a defined set of inclusion and exclusion criteria. We further evaluated those 17 apps using our devised app rating scale. Our app rating scale for plant disease detection evaluated the AI-based functionality and software quality of apps. According to our findings, most of the apps fell significantly below standard. They tended to lack many basic and important functionalities to detect plant disease, and many of them give users an inappropriate or incorrect verdict or solution. Although a few apps had some of the expected features, none of those under review met all the required functionalities. We also observed that there were very few evidence-based apps. As there have been numerous studies about plant disease detection and identification, disease severity estimation, localization, and visualization, such technological advancements must be included in modern plant disease detection apps. We hope that the developers mitigate the shortcomings found in existing apps so that the upcoming or updated apps will contain suggested new functionalities and perform those features correctly. Producers and botanists will soon be able to use these improved plant disease identification apps in the field. Users will be inspired to use these apps for the detection of any type of disease or plant pathogen, while others will be motivated to use these apps for further plant management assistance.
In the future, we plan to address the identified limitations and study numerous apps from different app stores. Moreover, our rating scale will be extended by incorporating the accuracy metrics related to plant disease detection. We will conduct a formal sentiment analysis on user reviews in app stores. We will also improve the reviewer panel so that different aspects of the apps, such as software quality and plant-specific functionalities, get appropriate attention and improved evaluation.

Author Contributions

Conceptualization, M.A.K.; methodology, A.S., M.A.K., T.F. and I.B.A.; validation, M.A.K. and L.A.W.; formal analysis, A.S., M.A.K., T.F. and I.B.A.; data curation, A.S., T.F. and I.B.A.; writing—original draft preparation, A.S., M.A.K., T.F. and I.B.A.; writing—review and editing, M.A.K. and L.A.W.; visualization, A.S., M.A.K., T.F. and I.B.A.; supervision, M.A.K.; project administration, M.A.K.; funding acquisition, L.A.W. All authors have read and agreed to the published version of the manuscript.

Funding

This research received no external funding.

Institutional Review Board Statement

Not applicable.

Informed Consent Statement

Not applicable.

Data Availability Statement

Not applicable.

Conflicts of Interest

The authors declare no conflict of interest.

References

  1. Agrios, G.N. Plant Pathology, 5th ed.; Academic Press: Cambridge, MA, USA, 2005. [Google Scholar] [CrossRef]
  2. Sibiya, M.; Sumbwanyambe, M. An algorithm for severity estimation of plant leaf diseases by the use of colour threshold image segmentation and fuzzy logic inference: A proposed algorithm to update a “leaf doctor” application. AgriEngineering 2019, 1, 205–219. [Google Scholar] [CrossRef] [Green Version]
  3. Shurtleff, M.C.; Pelczar, R.M.; Pelczar, M.J.; Kelman, A. Plant Disease; Encyclopædia Britannica, Inc.: Chicago, IL, USA, 2021. [Google Scholar]
  4. Phadikar, S.; Sil, J. Rice disease identification using pattern recognition techniques. In Proceedings of the 2008 11th International Conference on Computer and Information Technology, Khulna, Bangladesh, 10–12 November 2008; pp. 420–423. [Google Scholar]
  5. Islam, M.; Dinh, A.; Wahid, K.; Bhowmik, P. Detection of potato diseases using image segmentation and multiclass support vector machine. In Proceedings of the IEEE 30th Canadian Conference on Electrical and Computer Engineering (CCECE), Windsor, ON, Canada, 30 April–3 May 2017; pp. 1–4. [Google Scholar]
  6. Huang, W.; Guan, Q.; Luo, J.; Zhang, J.; Zhao, J.; Liang, D.; Huang, L.; Zhang, D. New optimized spectral indices for identifying and monitoring winter wheat diseases. IEEE J. Sel. Top. Appl. Earth Obs. Remote Sens. 2014, 7, 2516–2524. [Google Scholar] [CrossRef]
  7. Ram, S.; Nazari, K.; Amanov, A.; Ziyaev, Z.; Jalilov, A. Reduction of Winter Wheat Yield Losses Caused by Stripe Rust through Fungicide Management. J. Phytopathol. 2016, 164, 671–677. [Google Scholar] [CrossRef] [Green Version]
  8. Meunkaewjinda, A.; Kumsawat, P.; Attakitmongcol, K.; Srikaew, A. Grape leaf disease detection from color imagery using hybrid intelligent system. In Proceedings of the 5th IEEE International Conference on Electrical Engineering/Electronics, Computer, Telecommunications and Information Technology, Krabi, Thailand, 14–17 May 2008; Volume 1, pp. 513–516. [Google Scholar]
  9. Sannakki, S.S.; Rajpurohit, V.S.; Nargund, V.; Kulkarni, P. Diagnosis and classification of grape leaf diseases using neural networks. In Proceedings of the 4th IEEE International Conference on Computing, Communications and Networking Technologies (ICCCNT), Tiruchengode, India, 4–6 July 2013; pp. 1–5. [Google Scholar]
  10. Jhuria, M.; Kumar, A.; Borse, R. Image processing for smart farming: Detection of disease and fruit grading. In Proceedings of the 2nd IEEE International Conference on Image Information Processing (ICIIP-2013), Shimla, India, 9–11 December 2013; pp. 521–526. [Google Scholar] [CrossRef]
  11. Xie, X.; Ma, Y.; Bin, L.; He, J.; Li, S.; Wang, H. A Deep-Learning-Based Real-Time Detector for Grape Leaf Diseases Using Improved Convolutional Neural Networks. Front. Plant Sci. 2020, 11, 751. [Google Scholar] [CrossRef]
  12. Karlekar, A.; Seal, A. SoyNet: Soybean leaf diseases classification. Comput. Electron. Agric. 2020, 172, 105342. [Google Scholar] [CrossRef]
  13. Al-Hiary, H.; Bani-Ahmad, S.; Reyalat, M.; Braik, M.; Alrahamneh, Z. Fast and accurate detection and classification of plant diseases. Int. J. Comput. Appl. 2011, 17, 31–38. [Google Scholar] [CrossRef]
  14. Khirade, S.D.; Patil, A. Plant disease detection using image processing. In Proceedings of the 2015 IEEE International Conference on Computing Communication Control and Automation, Pune, India, 26–27 February 2015; pp. 768–771. [Google Scholar]
  15. Ramcharan, A.; McCloskey, P.; Baranowski, K.; Mbilinyi, N.; Mrisho, L.; Ndalahwa, M.; Legg, J.; Hughes, D.P. A mobile-based deep learning model for cassava disease diagnosis. Front. Plant Sci. 2019, 10, 272. [Google Scholar] [CrossRef] [Green Version]
  16. Dutot, M.; Nelson, L.; Tyson, R. Predicting the spread of postharvest disease in stored fruit, with application to apples. Postharvest Biol. Technol. 2013, 85, 45–56. [Google Scholar] [CrossRef]
  17. Francis, J.; Anto Sahaya Dhas, D.; Anoop, B.K. Identification of leaf diseases in pepper plants using soft computing techniques. In Proceedings of the 2016 IEEE Conference on Emerging Devices and Smart Systems (ICEDSS), Namakkal, India, 4–5 March 2016; pp. 168–173. [Google Scholar]
  18. Petrellis, N. Mobile application for plant disease classification based on symptom signatures. In Proceedings of the 21st Pan-Hellenic Conference on Informatics, Larissa, Greece, 28–30 September 2017; pp. 1–6. [Google Scholar]
  19. Riley, M.; Williamson, M.; Maloy, O. Plant disease diagnosis. Plant Health Instr. 2002, 1021. [Google Scholar] [CrossRef]
  20. Bedi, P.; Gole, P. Plant disease detection using hybrid model based on convolutional autoencoder and convolutional neural network. Artif. Intell. Agric. 2021, 5, 90–101. [Google Scholar] [CrossRef]
  21. Ahmed, A.A.; Reddy, G.H. A Mobile-Based System for Detecting Plant Leaf Diseases Using Deep Learning. AgriEngineering 2021, 3, 478–493. [Google Scholar] [CrossRef]
  22. Prasad, S.; Peddoju, S.K.; Ghosh, D. AgroMobile: A cloud-based framework for agriculturists on mobile platform. Int. J. Adv. Sci. Technol. 2013, 59, 41–52. [Google Scholar] [CrossRef]
  23. Singh, A.K.; Ganapathysubramanian, B.; Sarkar, S.; Singh, A. Deep learning for plant stress phenotyping: Trends and future perspectives. Trends Plant Sci. 2018, 23, 883–898. [Google Scholar] [CrossRef] [PubMed] [Green Version]
  24. Li, L.; Zhang, S.; Wang, B. Plant Disease Detection and Classification by Deep Learning—A Review. IEEE Access 2021, 9, 56683–56698. [Google Scholar] [CrossRef]
  25. Cotton Farming. Plant Disease Detection Using Smartphone Goes High Tech. 2019. Available online: https://www.cottonfarming.com/production-2/plant-disease-detection-using-smartphone-goes-high-tech/ (accessed on 30 June 2021).
  26. Petrellis, N. Plant disease diagnosis for smart phone applications with extensible set of diseases. Appl. Sci. 2019, 9, 1952. [Google Scholar] [CrossRef] [Green Version]
  27. Ashok, S.; Kishore, G.; Rajesh, V.; Suchitra, S.; Sophia, S.G.; Pavithra, B. Tomato Leaf Disease Detection Using Deep Learning Techniques. In Proceedings of the 5th IEEE International Conference on Communication and Electronics Systems (ICCES), Coimbatore, India, 10–12 June 2020; pp. 979–983. [Google Scholar]
  28. Weizheng, S.; Yachun, W.; Zhanliang, C.; Hongda, W. Grading method of leaf spot disease based on image processing. In Proceedings of the 2008 IEEE International Conference on Computer Science and Software Engineering, Wuhan, China, 12–14 December 2008; Volume 6, pp. 491–494. [Google Scholar]
  29. Al Bashish, D.; Braik, M.; Bani-Ahmad, S. A framework for detection and classification of plant leaf and stem diseases. In Proceedings of the International Conference on Signal and Image Processing, Chennai, India, 15–17 December 2010; pp. 113–118. [Google Scholar] [CrossRef]
  30. Arsenovic, M.; Karanovic, M.; Sladojevic, S.; Anderla, A.; Stefanovic, D. Solving current limitations of deep learning based approaches for plant disease detection. Symmetry 2019, 11, 939. [Google Scholar] [CrossRef] [Green Version]
  31. Orchi, H.; Sadik, M.; Khaldoun, M. On Using Artificial Intelligence and the Internet of Things for Crop Disease Detection: A Contemporary Survey. Agriculture 2022, 12, 9. [Google Scholar] [CrossRef]
  32. Picon, A.; Alvarez-Gila, A.; Seitz, M.; Ortiz-Barredo, A.; Echazarra, J.; Johannes, A. Deep convolutional neural networks for mobile capture device-based crop disease classification in the wild. Comput. Electron. Agric. 2019, 161, 280–290. [Google Scholar] [CrossRef]
  33. Yuan, Y.; Chen, L.; Wu, H.; Li, L. Advanced agricultural disease image recognition technologies: A review. Inf. Process. Agric. 2022, 9, 48–59. [Google Scholar] [CrossRef]
  34. Che’Ya, N.N.; Mohidem, N.A.; Roslin, N.A.; Saberioon, M.; Tarmidi, M.Z.; Arif Shah, J.; Fazlil Ilahi, W.F.; Man, N. Mobile Computing for Pest and Disease Management Using Spectral Signature Analysis: A Review. Agronomy 2022, 12, 967. [Google Scholar] [CrossRef]
  35. Sibanda, B.K.; Iyawa, G.E.; Gamundani, A.M. Systematic Review of Plant Pest and Disease Identification Strategies and Techniques in Mobile Apps. In Proceedings of the World Conference on Information Systems and Technologies; Springer: Berlin/Heidelberg, Germany, 2021; pp. 491–502. [Google Scholar]
  36. Patel, H.; Patel, D. Survey of android apps for agriculture sector. Int. J. Inf. Sci. Tech. 2016, 6, 61–67. [Google Scholar] [CrossRef]
  37. Bhavsar Shreyaben, B. Multilingual Multimedia Based Crop Disease Management System Using Mobile Technology. Ph.D. Thesis, Sardar Patel University, Gujarat, India, 2019. [Google Scholar]
  38. Rivera, J.; McPherson, A.; Hamilton, J.; Birken, C.; Coons, M.; Iyer, S.; Agarwal, A.; Lalloo, C.; Stinson, J. Mobile apps for weight management: A scoping review. JMIR mHealth uHealth 2016, 4, e5115. [Google Scholar] [CrossRef] [PubMed]
  39. Kabir, M.A.; Rahman, S.S.; Islam, M.M.; Ahmed, S.; Laird, C. Mobile Apps for Foot Measurement in Pedorthic Practice: Scoping Review. JMIR mHealth uHealth 2021, 9, e24202. [Google Scholar] [CrossRef] [PubMed]
  40. Tricco, A.C.; Lillie, E.; Zarin, W.; O’Brien, K.K.; Colquhoun, H.; Levac, D.; Moher, D.; Peters, M.D.; Horsley, T.; Weeks, L.; et al. PRISMA extension for scoping reviews (PRISMA-ScR): Checklist and explanation. Ann. Intern. Med. 2018, 169, 467–473. [Google Scholar] [CrossRef] [Green Version]
  41. Liberati, A.; Altman, D.G.; Tetzlaff, J.; Mulrow, C.; Gøtzsche, P.C.; Ioannidis, J.P.; Clarke, M.; Devereaux, P.J.; Kleijnen, J.; Moher, D. The PRISMA statement for reporting systematic reviews and meta-analyses of studies that evaluate health care interventions: Explanation and elaboration. J. Clin. Epidemiol. 2009, 62, e1–e34. [Google Scholar] [CrossRef] [Green Version]
  42. Stoyanov, S.R.; Hides, L.; Kavanagh, D.J.; Zelenko, O.; Tjondronegoro, D.; Mani, M. Mobile app rating scale: A new tool for assessing the quality of health mobile apps. JMIR mHealth uHealth 2015, 3, e27. [Google Scholar] [CrossRef] [Green Version]
  43. Stoyanov, S.R.; Hides, L.; Kavanagh, D.J.; Wilson, H. Development and validation of the user version of the Mobile Application Rating Scale (uMARS). JMIR mHealth uHealth 2016, 4, e72. [Google Scholar] [CrossRef] [Green Version]
  44. Huebner, J.; Schmid, C.; Bouguerra, M.; Ilic, A. FinMARS: A Mobile App Rating Scale for Finance Apps. In Proceedings of the 9th International Conference on Information Communication and Management, Prague, Czech Republic, 23–26 August 2019; pp. 6–11. [Google Scholar]
  45. Wu, C.H. An empirical study on the transformation of Likert-scale data to numerical scores. Appl. Math. Sci. 2007, 1, 2851–2862. [Google Scholar]
  46. Silvennoinen, J.; Vogel, M.; Kujala, S. Experiencing visual usability and aesthetics in two mobile application contexts. J. Usability Stud. 2014, 10, 46–62. [Google Scholar]
  47. von Wangenheim, C.G.; Porto, J.V.A.; Hauck, J.C.; Borgatto, A.F. Do we agree on user interface aesthetics of Android apps? arXiv 2018, arXiv:1812.09049. [Google Scholar]
  48. ISO/IEC 25010:2011; Systems and Software Engineering—Systems and Software Quality Requirements and Evaluation (SQuaRE)—System and Software Quality Models. ISO: London, UK, 2011. Available online: https://www.iso.org/standard/35733.html (accessed on 30 June 2021).
  49. Zen, M.; Vanderdonckt, J. Assessing user interface aesthetics based on the inter-subjectivity of judgment. In Proceedings of the 30th International BCS Human Computer Interaction Conference 30, Poole, UK, 11–15 July 2016; pp. 1–12. [Google Scholar]
  50. Tractinsky, N.; Katz, A.S.; Ikar, D. What is beautiful is usable. Interact. Comput. 2000, 13, 127–145. [Google Scholar] [CrossRef] [Green Version]
  51. Chan, S. 5-Year Market Forecast: App Spending Will Climb to $270 Billion by 2025. 2021. Available online: https://sensortower.com/blog/sensor-tower-app-market-forecast-2025 (accessed on 15 July 2021).
  52. Wei, Q.; Chang, Z.; Cheng, Q. Usability study of the mobile library App: An example from Chongqing University. Libr. Hi Tech 2015, 33, 340–355. [Google Scholar] [CrossRef]
  53. Payne, H.E.; Lister, C.; West, J.H.; Bernhardt, J.M. Behavioral functionality of mobile apps in health interventions: A systematic review of the literature. JMIR mHealth uHealth 2015, 3, e3335. [Google Scholar] [CrossRef] [PubMed]
  54. Kaikkonen, A.; Kekäläinen, A.; Cankar, M.; Kallio, T.; Kankainen, A. Usability testing of mobile applications: A comparison between laboratory and field testing. J. Usability Stud. 2005, 1, 4–16. [Google Scholar]
  55. Nayebi, M.; Marbouti, M.; Quapp, R.; Maurer, F.; Ruhe, G. Crowdsourced Exploration of Mobile App Features: A Case Study of the Fort McMurray Wildfire. In Proceedings of the IEEE/ACM 39th International Conference on Software Engineering: Software Engineering in Society Track (ICSE-SEIS), Buenos Aires, Argentina, 20–28 May 2017; pp. 57–66. [Google Scholar] [CrossRef]
  56. Miller, S.A.; Beed, F.D.; Harmon, C.L. Plant disease diagnostic capabilities and networks. Annu. Rev. Phytopathol. 2009, 47, 15–38. [Google Scholar] [CrossRef] [PubMed] [Green Version]
  57. Mahlein, A.K. Plant disease detection by imaging sensors–parallels and specific demands for precision agriculture and plant phenotyping. Plant Dis. 2016, 100, 241–251. [Google Scholar] [CrossRef] [Green Version]
  58. Wäldchen, J.; Rzanny, M.; Seeland, M.; Mäder, P. Automated plant species identification—Trends and future directions. PLoS Comput. Biol. 2018, 14, e1005993. [Google Scholar] [CrossRef] [Green Version]
  59. Wang, Z.; Li, H.; Zhu, Y.; Xu, T. Review of plant identification based on image processing. Arch. Comput. Methods Eng. 2017, 24, 637–654. [Google Scholar] [CrossRef]
  60. Nijalingappa, P.; Madhumathi, V. Plant identification system using its leaf features. In Proceedings of the 2015 IEEE International Conference on Applied and Theoretical Computing and Communication Technology (iCATccT), Davangere, India, 29–31 October 2015; pp. 338–343. [Google Scholar] [CrossRef]
  61. Agarwal, S.; Jalal, A.S.; Khan, M. Plant Identification using Leaf Image Analysis. In Proceedings of the 3rd International Conference on Internet of Things and Connected Technologies (ICIoTCT), Jaipur, India, 26–27 March 2018; pp. 26–27. [Google Scholar] [CrossRef]
  62. Le Huy Hien, N.; Van Hieu, N. Recognition of Plant Species using Deep Convolutional Feature Extraction. Int. J. Emerg. Technol. 2020, 11, 904–910. [Google Scholar]
  63. Bodhwani, V.; Acharjya, D.; Bodhwani, U. Deep residual networks for plant identification. Procedia Comput. Sci. 2019, 152, 186–194. [Google Scholar] [CrossRef]
  64. Ferentinos, K.P. Deep learning models for plant disease detection and diagnosis. Comput. Electron. Agric. 2018, 145, 311–318. [Google Scholar] [CrossRef]
  65. Hughes, D.; Salathé, M. An open access repository of images on plant health to enable the development of mobile disease diagnostics. arXiv 2015, arXiv:1511.08060. [Google Scholar]
  66. Geetharamani, G.; Pandian, A. Identification of plant leaf diseases using a nine-layer deep convolutional neural network. Comput. Electr. Eng. 2019, 76, 323–338. [Google Scholar]
  67. Abade, A.; Ferreira, P.A.; de Barros Vidal, F. Plant diseases recognition on images using convolutional neural networks: A systematic review. Comput. Electron. Agric. 2021, 185, 106125. [Google Scholar] [CrossRef]
  68. Bischoff, V.; Farias, K.; Menzen, J.P.; Pessin, G. Technological support for detection and prediction of plant diseases: A systematic mapping study. Comput. Electron. Agric. 2021, 181, 105922. [Google Scholar] [CrossRef]
  69. Lee, S.H.; Goëau, H.; Bonnet, P.; Joly, A. New perspectives on plant disease characterization based on deep learning. Comput. Electron. Agric. 2020, 170, 105220. [Google Scholar] [CrossRef]
  70. Wspanialy, P.; Moussa, M. A detection and severity estimation system for generic diseases of tomato greenhouse plants. Comput. Electron. Agric. 2020, 178, 105701. [Google Scholar] [CrossRef]
  71. Arivazhagan, S.; Shebiah, R.N.; Ananthi, S.; Varthini, S.V. Detection of unhealthy region of plant leaves and classification of plant leaf diseases using texture features. Agric. Eng. Int. CIGR J. 2013, 15, 211–217. [Google Scholar]
  72. Liang, Q.; Xiang, S.; Hu, Y.; Coppola, G.; Zhang, D.; Sun, W. PD2SE-Net: Computer-assisted plant disease diagnosis and severity estimation network. Comput. Electron. Agric. 2019, 157, 518–529. [Google Scholar] [CrossRef]
  73. Betzing, J.H.; Tietz, M.; vom Brocke, J.; Becker, J. The impact of transparency on mobile privacy decision making. Electron. Mark. 2020, 30, 607–625. [Google Scholar] [CrossRef] [Green Version]
  74. Beresford, A.; Rice, A.; Skehin, N.; Sohan, R. MockDroid: Trading privacy for application functionality on smartphones. In Proceedings of the HotMobile 2011: The 12th Workshop on Mobile Computing Systems and Applications, Phoenix, AZ, USA, 1–3 March 2011. [Google Scholar] [CrossRef]
  75. Christmann, A.; Van Aelst, S. Robust estimation of Cronbach’s alpha. J. Multivar. Anal. 2006, 97, 1660–1674. [Google Scholar] [CrossRef] [Green Version]
  76. Cronbach, L.J. Coefficient alpha and the internal structure of tests. Psychometrika 1951, 16, 297–334. [Google Scholar] [CrossRef] [Green Version]
  77. Gliem, J.; Gliem, R. Calculating, Interpreting, And Reporting Cronbach’s Alpha Reliability Coefficient For Likert-Type Scales. In Proceedings of the 2003 Midwest Research to Practice Conference in Adult, Continuing, and Community Education, Columbus, OH, USA, 8–10 October 2003. [Google Scholar]
  78. Lange, R. Inter-rater reliability. In Encyclopedia of Clinical Neuropsychology; Springer: New York, NY, USA, 2011; p. 1348. [Google Scholar]
  79. Sawa, J.; Morikawa, T. Interrater reliability for multiple raters in clinical trials of ordinal scale. Drug Inf. J. DIJ/Drug Inf. Assoc. 2007, 41, 595–605. [Google Scholar] [CrossRef]
  80. Koo, T.K.; Li, M.Y. A guideline of selecting and reporting intraclass correlation coefficients for reliability research. J. Chiropr. Med. 2016, 15, 155–163. [Google Scholar] [CrossRef] [Green Version]
  81. Pethybridge, S.J.; Nelson, S.C. Leaf Doctor: A new portable application for quantifying plant disease severity. Plant Dis. 2015, 99, 1310–1316. [Google Scholar] [CrossRef] [Green Version]
  82. Pagano, D.; Maalej, W. User feedback in the appstore: An empirical study. In Proceedings of the 21st IEEE International Requirements Engineering Conference (RE), Rio de Janeiro, Brasil, 15–19 July 2013; pp. 125–134. [Google Scholar] [CrossRef]
  83. Lepki, L. How to Use Word Clouds for Business, Fiction and Copywriting. 2020. Available online: https://prowritingaid.com/art/425/What-the-Heck-is-a-Word-Cloud-and-Why-Would-I-Use-One.aspx (accessed on 5 July 2021).
  84. CGIAR. Plant Disease Diagnosis Using Artificial Intelligence: A Case Study on Plantix. 2021. Available online: https://bigdata.cgiar.org/digital-intervention/plant-disease-diagnosis-using-artificial-intelligence-a-case-study-on-plantix/ (accessed on 22 October 2021).
Figure 1. PRISMA diagram of study.
Agronomy 12 01869 g001
Figure 2. Sub-scale specific ratings and overall rating.
Agronomy 12 01869 g002
Figure 3. Representation of specific functionality rating ratio.
Agronomy 12 01869 g003
Figure 4. Plant identification by PlantifyDr.
Agronomy 12 01869 g004
Figure 5. Disease detection.
Agronomy 12 01869 g005
Figure 6. Severity detection and visualizing the infected area of the diseased leaf by Leaf Doctor.
Agronomy 12 01869 g006
Figure 7. Apps screenshots of treatment functionality.
Agronomy 12 01869 g007
Figure 8. Expert/community support.
Agronomy 12 01869 g008
Figure 9. App store ratings (omitted apps those ratings were not available) and measured ratings of the apps.
Agronomy 12 01869 g009
Figure 10. Word cloud of positive and negative comments.
Agronomy 12 01869 g010
Table 1. Apps metadata.
App NameCountry of OriginFree/PaidDownloadsPlatform
Pestoz Idenify Plant DiseasesIndiaFree10K+Android
AgroAI—Plant Diseases Diagnosis (Early Access)AfricaFree10+Android
CropalyserNetherlandsFree10K+Android
PDDApp: Plant Disease DetectionRussiaFree1K+Android
LeafyIndiaFree100+Android
PlantDoctorIndiaFree1K+Android
Plantix–your crop doctorGermanyFree100K+Android
Plant Disease DetectorUnknownFree10+Android
RiceyeUnknownFree5+Android
Cassava Plant Disease IdentifyUnknownPaidiOS
Plants Disease IdentificationUnknownPaidiOS
Garden Plants Diseases DetectorUnknownPaidiOS
Plant Disease IdentifierUnknownPaidiOS
Plant Diseases and PestsUnknownPaidiOS
PlantifyDrUnited StatesFree10+Android and iOS
Leaf DoctorUnited StatesFree10K+Android and iOS
AgrioUnited StatesFree100K+Android and iOS
– Apple app store does not provide download information.
Table 2. Functionality assessment criteria definition.
Functionality Assessment CriteriaRating 5Rating 3Rating 1
Plant identificationAutomatically from imageManuallyNot at all
Plant coverage10+1 to 100
Disease detectionAutomatically from imageFrom questionnaireNot at all
Visualize infected areaAutomaticallyRequired user inputNot at all
Disease severity estimationAutomaticallyRequired user inputNot at all
TreatmentUp to date suggestionsFixed suggestionsNot at all
Expert/community supportExpert and communityExpert or communityNot at all
Table 3. Internal consistency of the devised app rating scale.
App Rating Sub-ScaleCronbach’s Alpha ( α )Internal Consistency
Aesthetics0.93Excellent ( 0.9 α )
Usability0.92Excellent ( 0.9 α )
Performance0.85Good ( 0.8 α < 0.9 )
Subjective0.94Excellent ( 0.9 α )
Transparency0.85Good ( 0.8 α < 0.9 )
Perceived impact0.95Excellent ( 0.9 α )
Overall0.97Excellent ( 0.9 α )
Table 4. Assessment scores for plant disease detection apps.
App NameAestheticsGeneralPerformanceUsabilityFunctionalitySubjectiveTransparencyImpactMean
(Std. Dev.)
Agrio4.752.254.674.003.572.832.803.833.53 (1.56)
AgroAI—Plant Diseases Diagnosis (Early Access)4.752.134.833.673.004.833.804.153.81 (1.50)
Cassava Plant Disease Identify2.253.254.331.831.671.332.203.002.48 (0.99)
Cropalyser5.003.134.833.172.143.334.403.833.65 (1.41)
Garden Plants Diseases Detector3.003.254.332.832.712.503.403.173.19 (1.47)
Leaf Doctor5.003.504.833.001.863.004.401.173.33 (1.77)
Leafy3.752.385.004.003.293.002.802.333.26 (1.69)
PDDApp: plant disease detection3.002.383.502.832.432.172.801.002.44 (1.55)
Pestoz Identify Plant diseases4.752.384.675.002.714.003.403.333.56 (1.48)
Plant Diseases and Pests1.002.754.501.503.001.832.601.672.42 (1.69)
Plant Disease Detector4.752.503.333.002.711.671.801.002.63 (1.75)
Plant Disease Identifier3.003.254.332.672.712.673.403.173.19 (1.47)
PlantDoctor2.502.003.001.831.571.001.001.001.81 (1.35)
PlantifyDr3.502.004.834.173.003.672.803.673.37 (1.65)
Plantix—your crop doctor5.004.135.004.333.295.005.005.004.56 (1.16)
Plants Disease Identification2.002.504.503.502.711.832.803.003.00 (1.53)
Riceye3.002.254.832.502.431.832.201.002.53 (1.65)
Table 5. Assessment criteria for the functionality of apps.
Functionality Assessment CriteriaGoogle Play (n = 9)
n (%)
Apple App (n = 8)
n (%)
Total (N = 17)
N (%)
Plant identification8 (88.89)7 (87.50)15 (88.23)
Plant coverage9 (100)7 (87.50)16 (94.12)
Disease detection8 (88.89)7 (87.50)15 (88.23)
Disease severity estimation2 (22.22)2 (25)4 (23.52)
Visualize infected area0 (0)1 (12.50)1 (5.88)
Treatment7 (77.78)4 (50)11 (64.71)
Expert/Community support1 (11.11)1 (12.50)2 (11.76)
Publisher’s Note: MDPI stays neutral with regard to jurisdictional claims in published maps and institutional affiliations.

