Article

Emissions of Greenhouse Gases and NO from Rice Fields and a Peach Orchard as Affected by N Input and Land-Use Conversion

1
Key Laboratory of Low-Carbon and Green Agriculture in Southeastern China, Ministry of Agriculture and Rural Affairs, College of Resources and Environmental Sciences, Nanjing Agricultural University, Nanjing 210095, China
2
Jiangsu Key Laboratory of Low Carbon Agriculture and GHGs Mitigation, Jiangsu Collaborative Innovation Center for Solid Organic Waste Resource Utilization, Nanjing 210095, China
*
Author to whom correspondence should be addressed.
Agronomy 2022, 12(8), 1850; https://doi.org/10.3390/agronomy12081850
Submission received: 12 July 2022 / Revised: 27 July 2022 / Accepted: 2 August 2022 / Published: 4 August 2022

Abstract

:
Nitrogen (N) inputs and land-use conversion are management practices that affect soil greenhouse gas (GHG) and nitric oxide (NO) emissions. Here, we measured soil methane (CH4), nitrous oxide (N2O), and NO fluxes from rice fields and a peach orchard that converted from paddies to assess the impacts of nitrogen (N) inputs and land-use conversion on their emissions. Treatments included four paddy field treatments (PN0, PN160, PN220, and PN280) and one peach orchard treatment (ON280) with number indicating the N-input rate of kg N ha−1. The results showed that cumulative emissions of CH4, N2O and NO ranged from 28.6 to 85.3 kg C ha−1, 0.5 to 4.0 kg N ha−1 and 0.2 to 0.3 kg N ha−1 during the rice-growing season, respectively. In terms of greenhouse gas intensity, the PN280 treatment is the recommended N application rate. Land-use conversion significantly reduced the global warming potential from croplands. The conversion shifted soils from an essential source of CH4 to a small net sink. In addition, N2O emissions from the rice–wheat rotation system were 1.8 times higher than from the orchard, mainly due to the difference in the N application rate. In summary, to reduce agriculture-induced GHG emissions, future research needs to focus on the effects of N inputs on rice-upland crop rotation systems.

1. Introduction

Anthropogenic emissions of greenhouse gases (GHGs) are significant drivers of global climate change. Methane (CH4) and nitrous oxide (N2O) are two of the essential greenhouse gases; in a 100-year time horizon, their sustained global warming potential (GWP) is 34 and 298 times higher than carbon dioxide (CO2), respectively [1]. Moreover, anthropogenic nitric oxide (NO) is considered the primary precursor of tropospheric ozone (O3) and the key factor that leads to the formation of acid rain [2]. It is reported that fertilized agricultural soil is the primary source of these emissions [3,4]. Agricultural activities generate 50% and 92% of the total GHG fluxes of CH4 and N2O in China, respectively [5].
Rice fields are a significant source of global CH4 emissions [6,7]. China is the second-largest rice producer, accounting for about 35% of global rice production [8]. Annual CH4 emissions from rice fields in China are about 7.4 Tg yr−1, accounting for 10% of anthropogenic CH4 emissions [9]. Rice has relied on excessive nitrogen (N) fertilizer application to enhance crop yields in China [10]. Excessive N fertilizer input would decrease N use efficiency and increase denitrification from rice soils [11]. In addition, alternating wet and dry water-saving irrigation practices in rice fields further exacerbate the sources of N2O and NO [12,13].
Subtropical orchards are potential hotspots for nitrous oxide emissions [14]. Increasing the market demand and the high economic value of fruits, higher returns have become the crucial drive for farmers to convert traditional rice fields to orchards [15,16]. Currently, the orchard has become the third-largest agricultural cultivation in China, and its area has ranked first in the world for many years [17]. The area of orchards increased from 0.17 to 10.7 Mha from 1980 to 2010, while the area under rice decreased from 33.3 to 26.5 Mha during the same period [18]. According to a survey, the annual mean N fertilizer input of 550 kg N ha−1 in orchards was much higher than that of rice, wheat, maize, and other food crops (<250 kg N ha−1) [19,20]. In these drained upland systems, high N fertilizer inputs lead to significant emissions of N2O and NO [21]. Field measurements have shown that N2O emissions from orchards in the same area are much greater than those from farmland [22,23].
Land-use conversion is considered the second largest anthropogenic source of GHG emissions [1]. This land-use conversion process includes changes in crop types, management, soil aeration, and physicochemical and microbial properties, which would change the CH4 and N2O emissions [24]. For example, tillage management can increase soil N2O emission and CH4 absorption compared with no-tillage [25,26]. GHG emissions may differ between the two cropping systems due to different growing conditions (anaerobic submerged conditions in rice versus aerobic conditions in orchards), and studies have reported that land use type switching from rice to upland crops increases cumulative N2O emissions by a factor of 4.0 to 5.3 [27,28,29].
In this study, we conducted in situ field measurements on rice fields and peach orchards throughout the rice-growing season. Specifically, the objectives of our study were to (1) measure the effect of N fertilizer application gradient on rice field production and GHG and NO emissions; (2) determine the response of soil GHG and NO emissions and GWP balance to changes in land-use. We hypothesized that (i) N fertilizer level management of rice fields has a significant impact on CH4 and N2O emissions and crop production, and (ii) conversion of rice fields to peach orchards would result in a significant shift from a CH4-dominated GHG balance to an N2O- and NO-dominated balance but would have little effect on the total GWP. The results of this study are intended to support the national GHG inventory change scenario in China due to land-use conversion.

2. Materials and Methods

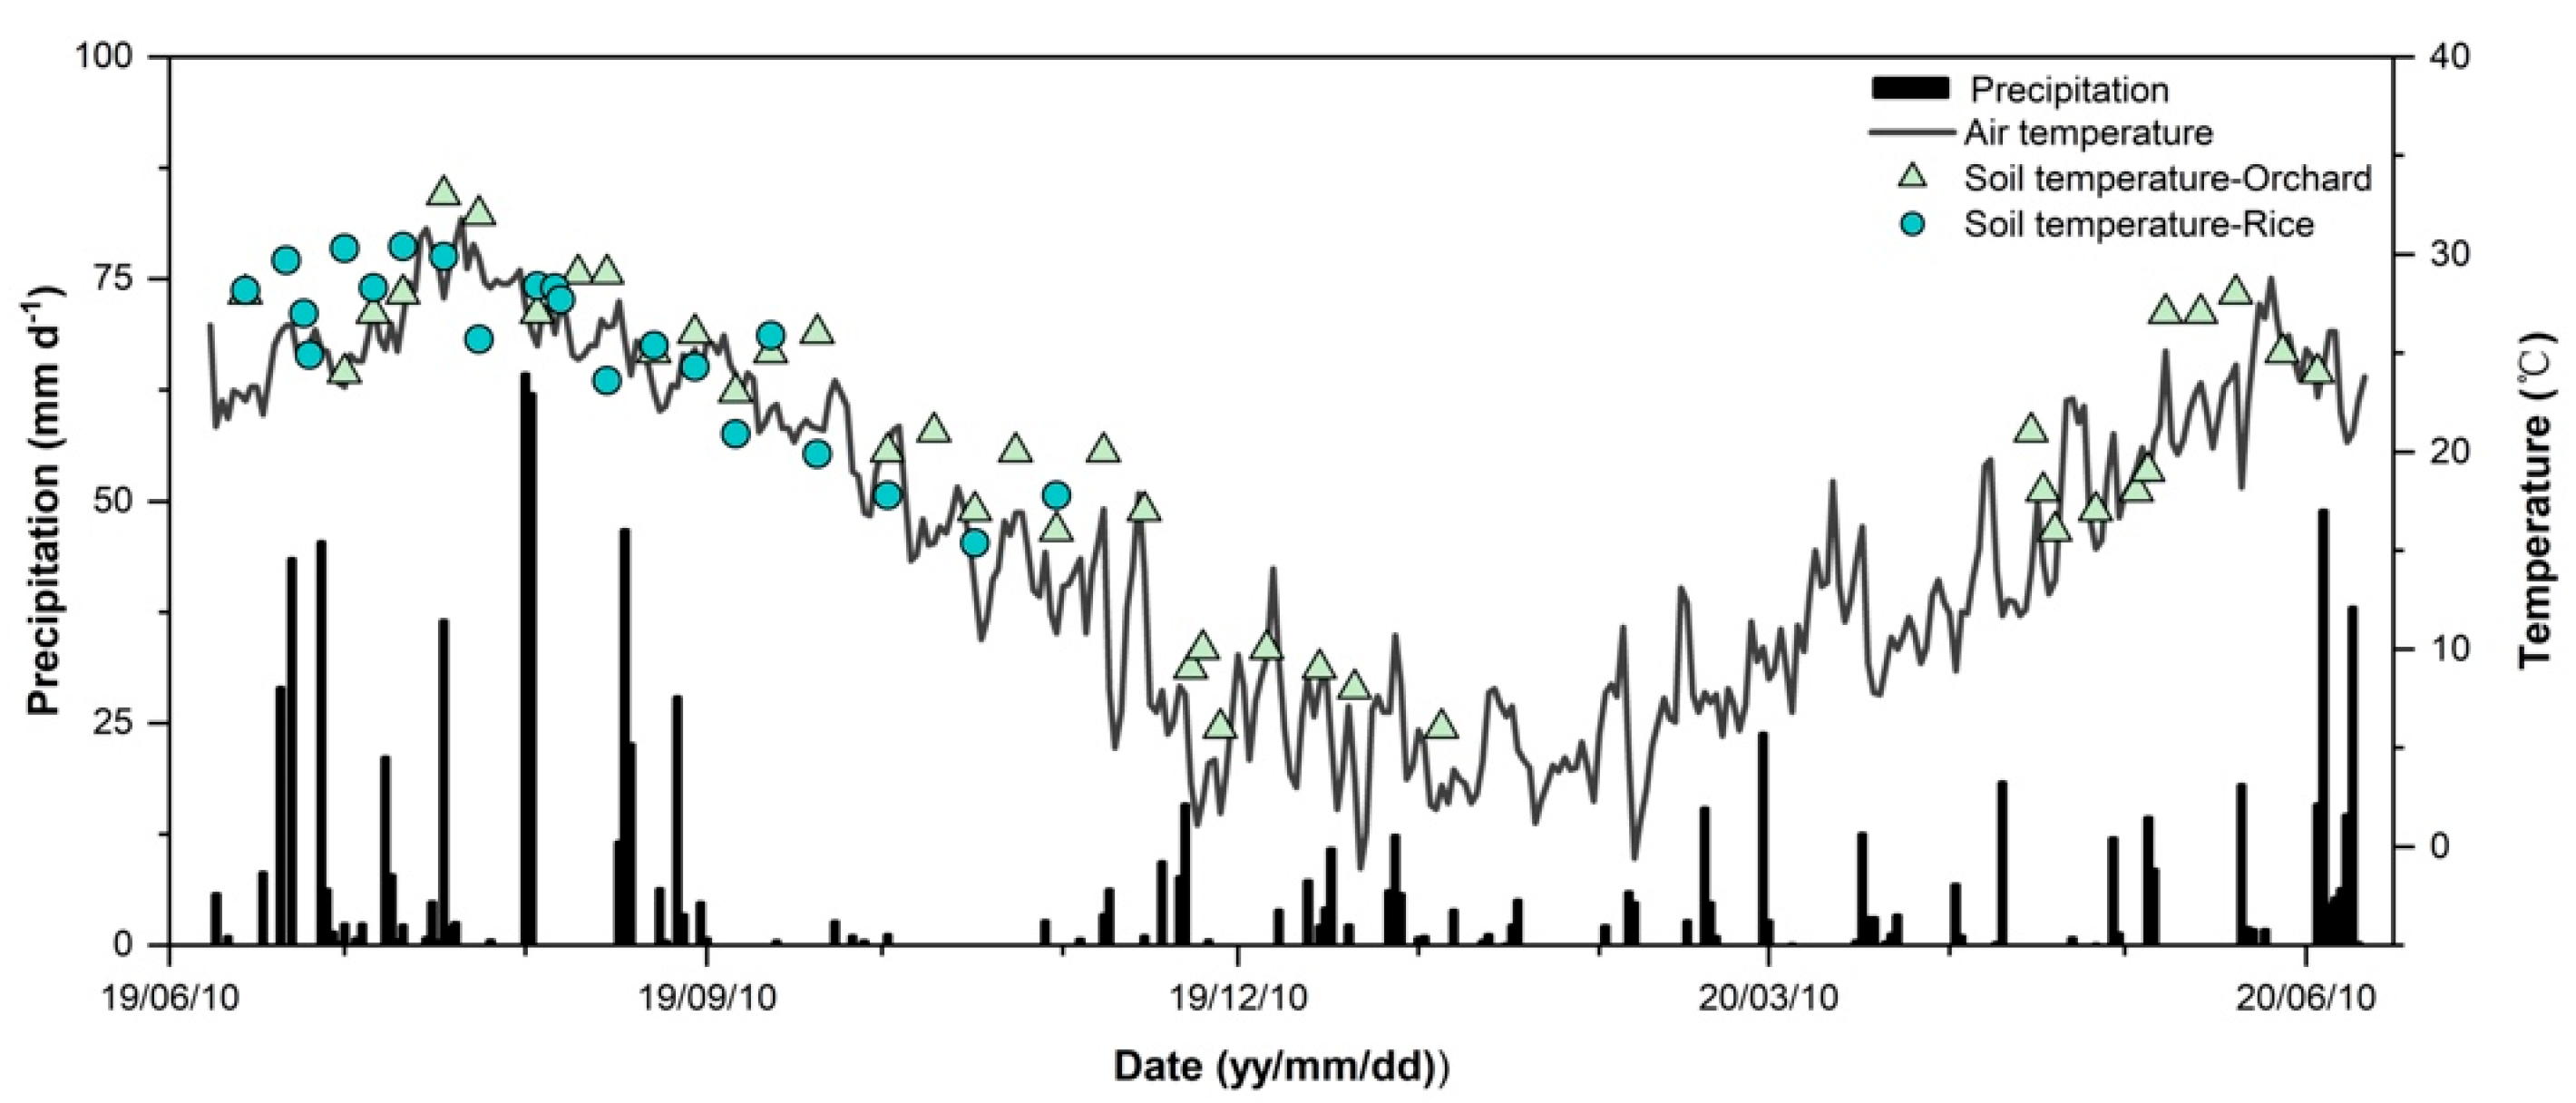
2.1. Site Description and Experimental Design

Field experiments were conducted from June 2019 to June 2020 in Jiangsu Province, China (31°57′ E, 120°00′ N). The two most common land-use types in the plain of the middle and lower reaches of the Yangtze River soil regions were selected for the present study, namely, a rice field and peach orchard (“Yingchun”). According to the local field management system, conventional rice fields have been planted continuously for about 20 years, and part of the farmland was converted to peach orchards in 2014, with a tree age of 5 years. The density of this peach orchard was around 495 plants ha−1, and the distance between two rows or trees was approximately 4 or 5 m. Soil properties at the initiation of the experiment are shown in Table 1. The region is characterized by a subtropical monsoon climate with an average annual temperature of 15.3 °C, and annual rainfall of 1055 mm (Figure 1). The clay soil at the study site is classified as Fluvisols, with 32.7% sand, 35.6% silt, and 31.7% clay [30].
The rice field experiments consisted of four plots with four N application levels, four different levels were non-fertilized (PN0), 160 kg N ha1 (PN160), 220 kg N ha1 (PN220), and 280 kg N ha1 treatments (PN280). The N input for the ON280 treatment in the orchard was the same as that for the PN280 treatment. Four rice treatments and a peach orchard were arranged in a completely randomized block design with three replicates (10 × 12 m). The rice was planted by sowing on 25 June and harvested on 22 October. Compound fertilizers were applied on 3 July and 15 August, respectively, with a split of 50% as the basal dose and another split of 50% at the tillering stage as the topdressing dose. The fertilizer dosage for the PN280 treatment was the local conventional management, and 160 and 220 kg N ha1 were mainly referred to as the N fertilizer application rates in the N reduction experiment. The phosphorus and potassium fertilizers in the other treatments of the rice field were made up of P2O5 and K2O. The flooding period of the rice field was from 20 July to 15 August and 25 August to 21 September, and the other times were intermittent irrigation. The three fertilization dates for the peach orchard are 2 December 2019, 24 April 2020, and 12 May 2020. In addition to the amount of N applied in the rice field, all field managements (e.g., weed and pest control) were consistent with the local conventional production. Peach orchards were fertilized and managed according to local practices, all plots were free of pests and weeds (including foliar insecticides and local herbicides), and there was no artificial irrigation. Local farmers converted their rice fields to crab pond culture after the rice-growing season. Therefore, the average CH4 and nitrogen oxide emissions of conventional fertilizer treatments from previous rice–wheat rotation studies in the same region were used to replace the missing wheat season data (Table S1). The impact of land use conversion was scientifically assessed by supplementing missing data from the wheat growing season in the rice–wheat rotation with an average wheat season N application of approximately 260 kg N ha1.

2.2. Gas Sampling and Flux Measurements

In situ CH4, N2O, and NO fluxes were collected once a week throughout the experiment. When N fertilizer was applied, gas samples were taken three times a week to capture GHGs emissions peaks. The fluxes were collected using a static chamber-based method [31,32]. A permanent PVC chamber base (area 0.25 m2, height 0.20 m) was installed into the soil at a depth of 10 cm on each plot. The 0.50 m-long square sampling chamber was placed onto the base by inserting the flange of the chamber into a water trough at the upper end of the chamber base. It covers a layer of insulation to minimize changes in air temperature. We used a 50 cm high extension chamber to follow the growth of the plant. Four gas samples (1.5 L) were collected from each plot at an interval of 5 min and then taken to the laboratory for determination concentration within 24 h. The concentrations of CH4 and N2O in the samples were analyzed by a modified gas chromatograph (Agilent 7890A, Santa Clara, CA, USA) as described previously [31,32]. NO concentrations were analyzed with a model 42i chemiluminescence NO-NO2-NOx analyzer (Thermo Environmental Instruments, Inc., Franklin, MA, USA) [33]. The details of the gas chromatography configuration information have been documented in previous reports [32]. The fluxes of CH4, N2O, and NO were calculated by a linear approach based on the slope of the mixing ratio change in four samples. The average fluxes and standard errors of N2O were calculated from triplicate plots. Seasonal cumulative emissions of CH4, N2O, and NO were sequentially accumulated from the fluxes between every two adjacent intervals of measurements [32].

2.3. Determination of GWP, GHGI, NAE, and Emission Factor

To further reveal the relationship between emissions of CH4 and N2O and climate change, we estimated the combined GWP of CH4 and N2O emissions from rice fields and the peach orchard. According to the improved weight index [34], the combined GWP of CH4 and N2O was calculated using the following equation:
GWP   ( t   CO 2 eq   ha 1 ) = 34 × CH 4 + 298 × N 2 O ,
The greenhouse gas intensity (GHGI) associated with ecosystem production was further calculated by dividing the net GWP by rice yields. Rice yields were calculated by the weight of all aboveground rice grains collected on each plot.
GHGI   ( t   CO 2 eq   t 1 yield ) = GWP   /   grain   yield ,
The N agronomic efficiency (NAE) is a basic indicator used by researchers, policymakers, and international organizations to assess the relative transformation of N inputs into agricultural products. Several metrics have been used to define N use efficiency (NUE) in agriculture, including recovery efficiency, agronomical efficiency, partial productivity, and physiological efficiency [35,36]. Here, N agronomic efficiency (NAE) is used to determine the NUE input of fertilizer N. The calculation equation for NAE is as follows:
  NAE   ( kg   kg 1 ) = ( Y N   Y c )   /   N fer ,
where YN and YC indicate the yield with and without N applied, N-fer represents the N input of fertilization (kg N ha−1).
The N fertilizer-induced direct emission factor (EF) of N2O and NO was calculated as the difference between the total emissions of the fertilized and unfertilized treatments divided by the amount of N applied [1]. The equation is as follows:
EF   = ( E N E 0 )   /   N fer ,
where EN and E0 are the cumulative N2O or NO emissions (kg N ha−1) of the fertilized treatment and the non-fertilized treatment, respectively; N-fer is the total N amount of fertilization (kg N ha−1).

2.4. Soil Physicochemical Properties

Parallel to gas sampling, soil temperature and volumetric water content were recorded to a 5 cm depth with a probe meter MPM 160 (ICT International Pty Ltd, Armidale, Australia) installed near the chamber. Temperature and precipitation data were collected from on-site automatic weather stations near the experiment field. Assuming a soil particle density of 2.65 (g cm3), the soil water-filled pore space (WFPS) is represented as the measured ratio of soil volume moisture content to total porosity. Fresh soil samples (0–20 cm) were collected every two weeks during the entire experiment, sieved with 2 mm, and stored for analysis of soil parameters. Soil pH and EC were analyzed in a soil-to-water ratio of 1:2.5 (w/v) using a pH electrode (PHS-3C mv/pH detector, Shanghai, China) and an EC meter (FE-30, Shanghai, China), respectively. The NH4+-N and NO3-N concentrations in 2 M KCl extractions were determined using a flow analyzer system (AutoAnalyzer 3, Bran+Luebbe GmbH, Hamburg, Germany). Soil dissolved organic carbon (DOC) was analyzed in a soil-to-water ratio of 1:5 (w/v) using a UV-Persulfate TOC analyzer (Teledyne-Tekmar Phoenix8000, Mason, OH, USA).

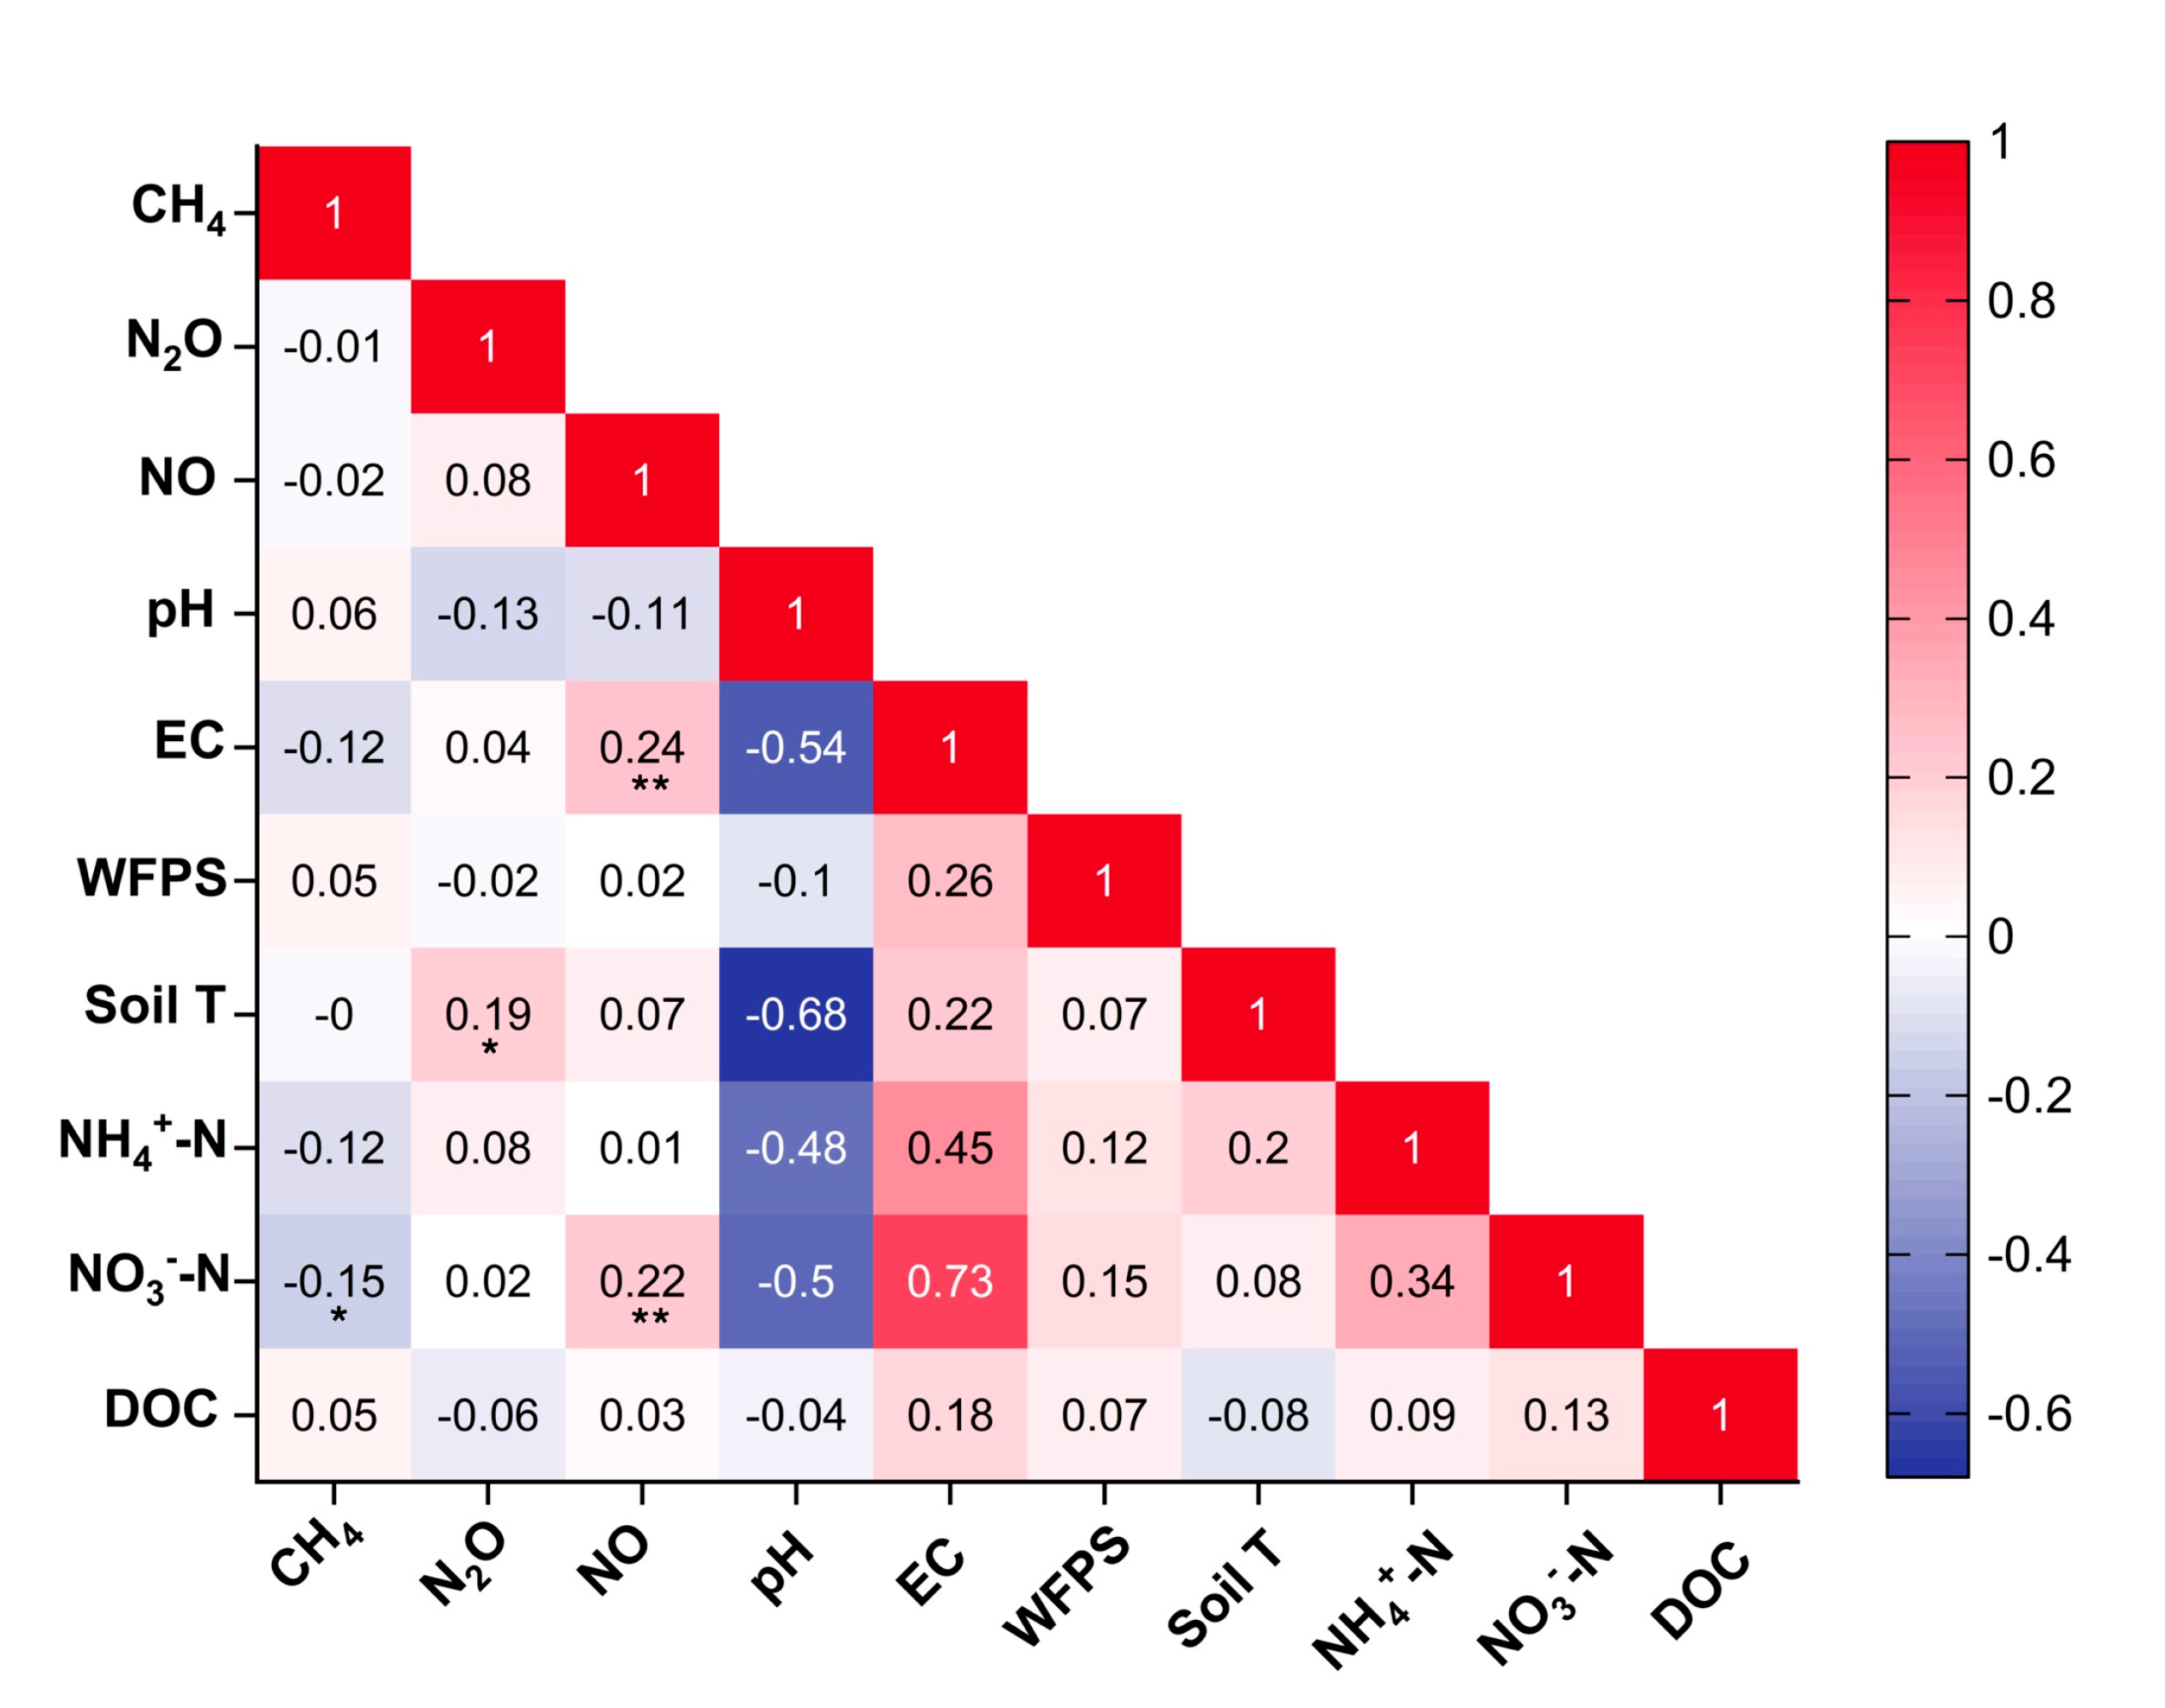
2.5. Statistical Analyses

The experimental results are given as the mean with the standard error (mean ± SE, n = 3). Differences in the rice growing season or annual total of CH4, N2O, NO, and N2O plus NO emissions as affected by N input levels and land-use conversion were examined by a two-way analysis of variance (ANOVA). The cumulative seasonal and annual emissions of CH4, N2O, and NO were approximated by applying the trapezoidal rule to the time interval between the measured flux rates. The effects of soil physicochemical properties on CH4, N2O, and NO emissions were investigated by Pearson correlation coefficients. All data were analyzed using SPSS v. 21 (SPSS Inc., Chicago, IL, USA).

3. Results

3.1. CH4 Fluxes

There was a positive correlation between the N application rate and the cumulative seasonal flux of CH4. According to the measurement results of the current season, the CH4 emissions in the rice-growing season ranged from 28.55 kg ha1 in PN0 treatment to 85.28 kg ha1 in PN280 (Table 2). Overall, compared with the PN0 treatment, the seasonal CH4 emissions of the PN160, PN220, and PN280 treatments increased by 21–34% and 42–60%, respectively, although there was no significant difference between treatments. The seasonal patterns of CH4 emissions from rice fields did not differ between treatments. After early sowing, CH4 emissions were low in the absence of standing water in the field until peak fluxes were reached in September when the rice fields were waterlogged.
Land-use patterns, temporal and spatial changes, and interactions significantly affected CH4 fluxes. Due to the land-use conversion, there were significant differences in CH4 flux patterns between orchards and rice fields. The rice-growing season and the annual results indicated the CH4 emission of the peach orchard was lower than the rice field, and the peach orchard was a sink of atmospheric methane. The CH4 flux had always been kept at a low level in the orchard, ranging from −1.74 to 1.18 mg C m2 h1 (Figure 2).

3.2. N2O and NO Fluxes

The cumulative N2O emissions during the rice-growing season were significantly affected by N fertilizer additions (Table 2). Seasonal N2O fluxes showed significant positive correlations with WFPS, EC, and NO3-N (Figure 3). In the rice-growing season, the N2O emissions ranged from 0.49 to 4.0 kg N ha1 for PN0, PN160, PN220, and PN280 treatment. Compared with the PN0 treatment, the emission from fertilization treatments was approximately 4–8 times. Although the PN220 treatment with higher N application rates generated more N2O emissions than the PN160 treatment, there was no significant difference between the two treatments. As the N input rate increased, EFN2O showed a decreasing and then increasing trend, and on average, EFN2O was 1.18% for N fertilizer application in rice fields (Table 2).
There was a significant difference between the N2O emission after land-use conversion. In the rice-growing season and the annual estimation scale, the N2O emission of rice fields was significantly higher than the peach orchard under the same nitrogen application rate (Table 2). Seasonal variation of the rice field N2O flux was characterized by pulsed emission events, which depend on the static water level and fertilization events. An imperceptible N2O flux was observed during the flooding period of the rice field. After fertilization and drainage, N2O pulsed emission occurs when the soil dries out/is re-wetted by rainfall. The orchard N2O emission pulse usually occurred after N application, and the favorable climatic conditions in summer and the legacy effects of fertilization also contributed to the N2O pulse emission (Figure 2).
In the rice-growing season, the seasonal pattern of soil NO flux was the same in the rice and orchard fields, with no significant differences between the different N input plots. The NO flux in the rice fields ranged from 11.7 to 216.0 μg N m−2 h−1 (Figure 2), and a significant pulse emission was captured after the fertilization event. There were no significant differences in seasonal NO cumulative fluxes for all treatments in the rice field, ranging from 0.15 to 0.27 kg N ha−1 (Table 2). In contrast, the cumulative seasonal emission of NO in the orchard was 0.25 kg N ha−1, which was below the PN280 treatment.

3.3. Grain Yield, GWP, and GHGI of the Rice

Rice grain yield varied from 5.64 to 10.73 t ha1 in all treatments (Table 2). The average yield of PN160, PN220, and PN280 were 7.90 ± 1.13, 8.14 ± 0.72, and 10.73 ± 0.50 t ha1, respectively. Compared to PN280, the grain yield of PN160 and PN220 treatments was significantly reduced by 24–26% (p < 0.05).
Radiative forcing effects of N2O and CH4 emissions from rice fields were assessed on a 100-year time scale using GWP. In addition, GHGI calculated by dividing GWP by rice yield shows a positive combined effect of warming on mitigating N2O and CH4 emissions and yield. Generally, in the rice-growing season, all treatments showed positive total GWP, and the GWP of fertilization treatment was higher than that of blank treatment. However, there was no significant difference between N reduction fertilization treatment and blank treatment, and the GWP of conventional fertilization (280 kg N ha1) was significantly higher than that of the blank treatment. Relative to the N2O emission, CH4 emission is the main contribution of GWP in the rice field. The results showed that the PN280 treatment significantly increased GWP (N2O) in the rice field. When the GWP was linked to rice production, the GHGI of two N reduction treatments (PN160 and PN220) was reduced (Table 2), 35.9% and 15.4% lower on average than that of the conventional treatment, respectively. Combining the results of GHGI and the yield, the PN280 treatment could significantly increase the rice yield without considerably increasing the intensity of GHG emissions. In addition, the results of the rice-growing season and annual estimates indicated that land-use conversion significantly reduced GWP under the same N application rate (Table 2).

3.4. Soil Physicochemical Parameters

During the entire experiment period, the changes in soil inorganic N content under different treatments were regulated by the height of the static water layer during fertilization (Figure 3). High NH4+-N and NO3-N contents were mainly observed within 15 days of seedling emergence after basal fertilizer application. The dynamic change of DOC concentration in rice soil was mainly influenced by irrigation and fertilization activities. The results showed that seasonal CH4 fluxes were significantly and positively correlated with soil temperature in the rice field (Figure 4). Seasonal N2O fluxes were significantly related to WFPS, EC, and NO3-N. Seasonal NO fluxes were significantly correlated with DOC, WFPS, and NH4+-N. Notably, soil WFPS had a significant effect on both NO fluxes and N2O fluxes.
Land-use conversion and field management have altered soil properties (Table 1 and Figure 3). Compared with rice fields, the contents of NH4+-N and DOC, soil bulk density, and pH value increased in the orchard after transformation, while the contents of NO3-N and TN decreased in the soil. Land-use conversion from rice fields to orchards also increased the soil temperature (Figure 1).

4. Discussion

4.1. Rice Crop Productivity and NAE Affected by N Input

Nitrogen inputs have long been considered key to ensuring crop productivity [37]. The grain yield of the PN280 treatment was significantly higher than the PN160 and PN220 treatments (Table 2). The positive effects on crop productivity were amplified with high N input. It was consistent with the previous results, within the range of reasonable N input, the increase in grain yield can be accompanied by acceptable N use efficiency [38]. The yield of PN280 was close to that of slow and controlled release fertilizer and partial replacement of organic fertilizer, but the N input was much higher than theirs [39]. Similar to the results, rice biomass and yield were positively correlated with N use efficiency in rice fields [40]. In the results, the high biomass and low yield of PN220 treatment may be due to the shortage of N supply at the filling stage, and the size or weight of rice spikelet was determined at the filling growth stage [41]. To improve rice yield and NAE, the dynamics of tillering and panicle rate under different N levels will be the focus of future research [42].
Nitrogen use efficiency (NUE) is an essential index to evaluate agricultural N management. As shown in the results of this study, increased crop productivity was associated with increased NAE at different N levels, and the PN280 plots were above the average value of 12.6 kg kg1 in the Chinese rice field [38]. However, the NAE in all treatment plots was well below the 25–30 kg kg1 recommended for good field management [43]. Previous studies have revealed that the key to improving NUE in crop production systems is to coordinate the synchronization between crop N requirements and N supplies from all sources throughout the growing season [44]. For this purpose, specific field management (micronutrients, water management) and precise fertilization are usually used. It would also reduce the environmental risk of gaseous N loss or runoff and leaching caused by N inputs [45].

4.2. CH4 and N2O Emissions Affected by N Input and Land-Use Conversion

The seasonal patterns and intensities of CH4 and N2O emissions from rice fields differed significantly from earlier measurements in the region. It was found that CH4 cumulative emissions were lower than in previous studies, while N2O cumulative emissions were much higher than other observations [46,47,48]. There are two explanations for the low CH4 emissions. First, it was mainly affected by the planting method of broadcast seeding. Compared with the transplanted rice field, the sown rice field was drained in the early stage, and the methane was mainly produced in the flooded and anaerobic state. Second, irrigation management alternates short-term flooding and drainage, significantly reducing the possibility of CH4 pulse discharge [41]. Previous results showed that the average CH4 emission fluxes of single and multiple drainage fields were 71% and 55% of continuous drainage fields, respectively [49]. The results showed that the PN280 treatment significantly increased CH4 emission compared with the non-fertilization treatment. Previous studies have reported that CH4 emissions from rice fields are primarily determined by the balance between CH4 production and oxidation [50]. Compared with the PN0 treatment, the PN280 increased rice biomass by 83.6% (Table 3). Better plant growth, such as greater biomass, may provide methanogens with more organic substrates through root exudates [51], leading to greater CH4 yields [52,53].
Nitrogen application rate and irrigation management would affect N2O emission [10,54]. Contrary to previous studies, multiple N2O pulse emissions occurred in the rice-growing season (Figure 2). It was noted that a large amount of N2O emissions occurred during the whole growth period after the basal fertilizer application and during mid-season drainage, which may be due to a variety of reasons. First of all, compared with conventional transplanting, the plots in this study were drained after fertilization in the early stage, which provided sufficient substrate and oxygen conditions for N2O generation and was conducive to N2O emission in the soil, which led to the peak of N2O emission after rice sowing [55]. Second, the alternating wet and dry conditions due to irrigation and drainage during the rice growing season facilitated the production of N2O [47,56]. At the same time, irrigation decreased soil organic N mineralization, but more mineral N in the soil could be used for N2O production in the following drainage period [57]. This comparison strongly indicates that N2O emission is significantly affected by fertilizer application rate.
In our study, CH4 and N2O fluxes were significantly affected by land-use patterns, which is consistent with our hypothesis. The transition from paddy fields to peach orchards transformed soils from an essential source of CH4 to a small net sink (Table 2). The decrease in CH4 emissions as the rice field changed to an upland system is consistent with previous studies [58,59]. First, changes in CH4 fluxes after land-use conversion are due to highly variable soil moisture conditions (Figure 3a). Second, methanogenic archaea are suppressed due to improved soil aeration in upland systems, which drives increased availability of oxidants in the soil [60,61]. The N2O emission was significantly higher in the PN280 than in the ON280 treatment (Table 2). This was determined by the N application rates for the rice–wheat rotation and the peach orchard, which were 540 and 280 kg N ha1 yr1, respectively. The largest source of N2O emissions from the soil is the application of synthetic N fertilizers and manure to croplands [62]. On average, the N2O emissions from the rice–wheat rotation system were 1.8 times that of the peach orchard, close to the ratio of the nitrogen application rate. The irrigation management, which is different from conventional rice fields, leads to excellent nitrous oxide emissions, an essential factor for the high nitrous oxide emissions from rice–wheat crop rotation systems [54]. In addition, the unique hole application method of the peach orchard results in high N2O emissions only at the point of application, which accounted for only 1/40 of the whole tree.

4.3. Soil GWP and GHGI Affected by N Input and Land-Use Conversion

The GWP and GHGI of CH4 and N2O were calculated to assess the climate impact of rice cropping systems affected by N levels and land-use conversion. The result showed that the GWP values of all treatments were positive, indicating that both rice fields and converted orchards were net sources of atmospheric GHGs. Consistent with previous studies, N inputs affect CH4 emissions in wetland ecosystems by adjusting CH4 production, oxidation, and transport [63]. Similarly, N2O emissions from farmland are usually determined by field management, such as N application and water conditions [10,21]. The GWP is roughly comparable to earlier measurements in the region. Mid-season drainage reduces CH4 emissions but increases N2O emissions [48]. Land-use conversion significantly reduces CH4 and N2O emissions, and thus, GWP is significantly reduced by 77.2% (Table 2). First, the EFN2O of this study is much higher than 0.42–0.79% in previous rice fields quantization results because the special water regime of the rice field led to the sensitive change of direct N2O emissions [47]. Compared with previous results, the increased GWP of N2O emissions caused by mid-season drainage exceeded the reduced GWP of the CH4 emissions [64]. Secondly, the observation period was limited to the rice-growing season. Fertilization in orchards occurred in December, March, and May of the following year, resulting in sizeable N2O emissions. Therefore, no primary pulse emission of N2O was observed in orchards during the rice-growing season [14].
Focusing only on GWP reduction is often a mistake, while GHGI also is evaluated to achieve high yield and low GHGs emissions [51]. Although the results showed a high yield and high emissions, the yield of the PN280 treatment increased by 31.81%, while GHGI only increased by 14.63% compared to the PN220 treatment (Table 2). The GHGIs of this study were within the range of the estimated value of rice fields with mid-season drainage (0.24–0.74 t CO2-eq t−1 yield) [52]. The application of organic N fertilizer resulted in a small increase in CH4 emissions and a large decrease in N2O emissions, reducing the climatic impact of a double-cropping rice system [65]. To reduce GHGI and achieve higher NAE, it is better management practice to partially replace chemical N fertilizer inputs with organic fertilizers [66].

5. Conclusions

In summary, our results revealed the impact of land-use change on agricultural non-CO2 GHG emissions and NO by comparing it with an adjacent orchard converted from a rice paddy. We found that N2O and CH4 emissions from paddy soils increased with increasing N inputs. During the rice-growing season, the CH4 emission was 28.6–85.3 kg C ha1, and the N2O emission was 0.5–4.0 kg N ha1. Chemical N fertilizer application and water status changes were the main factors affecting N2O emissions from rice fields. Moreover, there was a strong positive correlation between the amount of N input and rice yield. The 280 kg N ha1 is the recommended N application rate, which can significantly increase rice yield without greatly increasing GHGI. Both rice and transformed orchards are net sources of atmospheric GHGs. The rice-growing season and the annual data showed that land-use conversion significantly reduced soil CH4 and N2O emissions during the corresponding period, thus significantly reducing the soil GWP.

Supplementary Materials

The following are available online at https://www.mdpi.com/article/10.3390/agronomy12081850/s1, Table S1: CH4 and NOx emissions from other rice-wheat rotation studies in the middle and lower reaches of the Yangtze River used in this study [67,68,69,70,71,72].

Author Contributions

Investigation, methodology, formal analysis, P.X., Z.H., J.W. (Jie Wu) and Z.L.; writing—original draft preparation, P.X.; conceptualization, methodology, supervision, funding acquisition, and writing—review and editing, J.W. (Jinyang Wang) and J.Z. All authors have read and agreed to the published version of the manuscript.

Funding

This research was supported by the Jiangsu Provincial Special Project for Carbon Peak Carbon Neutrality Science and Technology Innovation (BE2022308), the National Natural Science Foundation of China (42007072, 42177285), and the Fundamental Research Funds for the Central Universities (KJQN202119). The corresponding author acknowledges the funding support from the Startup Foundation for Introducing Talent of Nanjing Agricultural University (030/804028).

Institutional Review Board Statement

Not applicable.

Informed Consent Statement

Not applicable.

Data Availability Statement

Data used in this paper are present in the figures/tables.

Conflicts of Interest

The authors declare no conflict of interest.

References

  1. IPCC. Summary for Policymakers. In Climate Change 2013: The Physical Science Basis; Stocker, T.F., Qin, D., Plattner, G.-K., Tignor, M., Allen, S.K., Boschung, J., Nauels, A., Xia, Y., Bex, V., Midgley, P.M., Eds.; Contribution of Working Group I to the Fifth Assessment Report of the Intergovernmental Panel on Climate Change; Cambridge University Press: Cambridge, UK; New York, NY, USA, 2013; 1535p. [Google Scholar]
  2. Pilegaard, K. Processes Regulating Nitric Oxide Emissions from Soils. Philos. Trans. R. Soc. B Biol. Sci. 2013, 368, 20130126. [Google Scholar] [CrossRef] [PubMed]
  3. Davidson, E.A. The Contribution of Manure and Fertilizer Nitrogen to Atmospheric Nitrous Oxide since 1860. Nat. Geosci. 2009, 2, 659–662. [Google Scholar] [CrossRef]
  4. United Nations Environment Programme. Frontiers 2018/19: Emerging Issues of Environmental Concern; United Nations Environment Programme: Nairobi, Kenya, 2019; ISBN 9789280737370. [Google Scholar]
  5. Zhang, F.; Chen, X.; Vitousek, P. An experiment for the world. Nature 2013, 497, 33–35. [Google Scholar] [CrossRef] [PubMed]
  6. Carlson, K.M.; Gerber, J.S.; Mueller, N.D.; Herrero, M.; MacDonald, G.K.; Brauman, K.A.; Havlik, P.; O’Connell, C.S.; Johnson, J.A.; Saatchi, S.; et al. Greenhouse Gas Emissions Intensity of Global Croplands. Nat. Clim. Chang. 2017, 7, 63–68. [Google Scholar] [CrossRef]
  7. Tian, H.; Xu, R.; Canadell, J.G.; Thompson, R.L.; Winiwarter, W.; Suntharalingam, P.; Davidson, E.A.; Ciais, P.; Jackson, R.B.; Janssens-Maenhout, G.; et al. A Comprehensive Quantification of Global Nitrous Oxide Sources and Sinks. Nature 2020, 586, 248–256. [Google Scholar] [CrossRef] [PubMed]
  8. Zhang, W.; Yu, Y.; Huang, Y.; Li, T.; Wang, P. Modeling Methane Emissions from Irrigated Rice Cultivation in China from 1960 to 2050. Glob. Chang. Biol. 2011, 17, 3511–3523. [Google Scholar] [CrossRef]
  9. Yan, X.; Akiyama, H.; Yagi, K.; Akimoto, H. Global Estimations of the Inventory and Mitigation Potential of Methane Emissions from Rice Cultivation Conducted Using the 2006 Intergovernmental Panel on Climate Change Guidelines. Glob. Biogeochem. Cycles 2009, 23, 1–15. [Google Scholar] [CrossRef]
  10. Zou, J.; Huang, Y.; Qin, Y.; Liu, S.; Shen, Q.; Pan, G.; Lu, Y.; Liu, Q. Changes in Fertilizer-Induced Direct N2O Emissions from Paddy Fields during Rice-Growing Season in China between 1950s and 1990s. Glob. Chang. Biol. 2009, 15, 229–242. [Google Scholar] [CrossRef]
  11. Smith, K.A.; Ball, T.; Conen, F.; Dobbie, K.E.; Massheder, J.; Rey, A. Exchange of Greenhouse Gases between Soil and Atmosphere: Interactions of Soil Physical Factors and Biological Processes. Eur. J. Soil Sci. 2018, 69, 10–20. [Google Scholar] [CrossRef]
  12. Shang, Q.; Yang, X.; Gao, C.; Wu, P.; Liu, J.; Xu, Y.; Shen, Q.; Zou, J.; Guo, S. Net Annual Global Warming Potential and Greenhouse Gas Intensity in Chinese Double Rice-Cropping Systems: A 3-Year Field Measurement in Long-Term Fertilizer Experiments. Glob. Chang. Biol. 2011, 17, 2196–2210. [Google Scholar] [CrossRef]
  13. Zhang, Y.S.; Chai, R.S.; Fu, L.L.; Liu, L.J.; Dong, H.F. Greenhouse Gas Emissions from Major Agricultural Activities in China and Corresponding Mitigation Strategies. J. Zhejiang Univ. (Agric. Life Sci.) 2012, 38, 97–107. [Google Scholar]
  14. Xu, P.; Li, Z.; Wang, J.; Zou, J. Fertilizer-Induced Nitrous Oxide Emissions from Global Orchards and Its Estimate of China. Agric. Ecosyst. Environ. 2022, 328, 107854. [Google Scholar] [CrossRef]
  15. Cheng, Y.; Jia, Y.S.; Wang, Y.; Zhao, X.; Yang, L.Z.; Wang, S.Q. Nutrient Inputs and Soil Fertility Status in Orchards of Zhushan Bay in Taihu Lake Watershed. J. Agro-Environ. Sci. 2014, 33, 1940–1947. [Google Scholar] [CrossRef]
  16. Ju, X.; Liu, X.; Zhang, F.; Roelcke, M. Nitrogen Fertilization, Soil Nitrate Accumulation, and Policy Recommendations in Several Agricultural Regions of China. Ambio 2004, 33, 300–305. [Google Scholar] [CrossRef]
  17. FAO. World Food and Agriculture—Statistical Yearbook 2020; Food and Agriculture Organization of the United Nations: Rome, Italy, 2021; ISBN 9789251333945. [Google Scholar] [CrossRef]
  18. National Bureau of Statistics of China. China Statistical Yearbook 2018; China Statistics Press: Beijing, China, 2018.
  19. Zhang, W.F.; Dou, Z.X.; He, P.; Ju, X.T.; Powlson, D.; Chadwick, D.; Norse, D.; Lu, Y.L.; Zhang, Y.; Wu, L.; et al. New Technologies Reduce Greenhouse Gas Emissions from Nitrogenous Fertilizer in China. Proc. Natl. Acad. Sci. USA 2013, 110, 8375–8380. [Google Scholar] [CrossRef]
  20. Chadwick, D.; Wei, J.; Yan’an, T.; Guanghui, Y.; Qirong, S.; Qing, C. Improving Manure Nutrient Management towards Sustainable Agricultural Intensification in China. Agric. Ecosyst. Environ. 2015, 209, 34–46. [Google Scholar] [CrossRef]
  21. Liu, S.; Lin, F.; Wu, S.; Ji, C.; Sun, Y.; Jin, Y.; Li, S.; Li, Z.; Zou, J. A meta-analysis of fertilizer-induced soil NO and combined NO+N2O emissions. Glob. Chang. Biol. 2017, 23, 2520–2532. [Google Scholar] [CrossRef]
  22. Wu, X.; Liu, H.; Fu, B.; Wang, Q.; Xu, M.; Wang, H.; Yang, F.; Liu, G. Effects of Land-Use Change and Fertilization on N2O and NO Fluxes, the Abundance of Nitrifying and Denitrifying Microbial Communities in a Hilly Red Soil Region of Southern China. Appl. Soil Ecol. 2017, 120, 111–120. [Google Scholar] [CrossRef]
  23. Cheng, Y.; Xie, W.; Huang, R.; Yan, X.Y.; Wang, S.Q. Extremely High N2O but Unexpectedly Low NO Emissions from a Highly Organic and Chemical Fertilized Peach Orchard System in China. Agric. Ecosyst. Environ. 2017, 246, 202–209. [Google Scholar] [CrossRef]
  24. Hou, A.X.; Chen, G.X.; Wang, Z.P.; Van Cleemput, O.; Patrick, W.H. Methane and Nitrous Oxide Emissions from a Rice Field in Relation to Soil Redox and Microbiological Processes. Soil Sci. Soc. Am. J. 2000, 64, 2180–2186. [Google Scholar] [CrossRef]
  25. Wang, J.; Zou, J. No-till Increases Soil Denitrification via Its Positive Effects on the Activity and Abundance of the Denitrifying Community. Soil Biol. Biochem. 2020, 142, 107706. [Google Scholar] [CrossRef]
  26. Maucieri, C.; Tolomio, M.; McDaniel, M.D.; Zhang, Y.; Robatjazi, J.; Borin, M. No-Tillage Effects on Soil CH4 Fluxes: A Meta-Analysis. Soil Tillage Res. 2021, 212, 105042. [Google Scholar] [CrossRef]
  27. Yuan, Y.; Dai, X.; Wang, H.; Xu, M.; Fu, X.; Yang, F. Effects of Land-Use Conversion from Double Rice Cropping to Vegetables on Methane and Nitrous Oxide Fluxes in Southern China. PLoS ONE 2016, 11, e0155926. [Google Scholar] [CrossRef]
  28. Nishimura, S.; Yonemura, S.; Sawamoto, T.; Shirato, Y.; Akiyama, H.; Sudo, S.; Yagi, K. Effect of Land Use Change from Paddy Rice Cultivation to Upland Crop Cultivation on Soil Carbon Budget of a Cropland in Japan. Agric. Ecosyst. Environ. 2008, 125, 9–20. [Google Scholar] [CrossRef]
  29. Nishimura, S.; Sawamoto, T.; Akiyama, H.; Sudo, S.; Cheng, W.; Yagi, K. Continuous, Automated Nitrous Oxide Measurements from Paddy Soils Converted to Upland Crops. Soil Sci. Soc. Am. J. 2005, 69, 1977–1986. [Google Scholar] [CrossRef]
  30. Food and Agriculture Organization of the United Nations. World Reference Base for Soil Resources 2006: A Framework for International Classification, Correlation and Communication (World Soil Resources Reports); Food and Agriculture Organization of the United Nations: Rome, Italy, 2006; ISBN 9251055114. [Google Scholar]
  31. Hutchinson, G.L.; Mosier, A.R. Improved Soil Cover Method for Field Measurement of Nitrous Oxide Fluxes. Soil Sci. Soc. Am. J. 1981, 45, 311–316. [Google Scholar] [CrossRef]
  32. Zou, J.; Huang, Y.; Jiang, J.; Zheng, X.; Sass, R.L. A 3-Year Field Measurement of Methane and Nitrous Oxide Emissions from Rice Paddies in China: Effects of Water Regime, Crop Residue, and Fertilizer Application. Glob. Biogeochem. Cycles 2005, 19, 1–9. [Google Scholar] [CrossRef]
  33. Yao, Z.; Wei, Y.; Liu, C.; Zheng, X.; Xie, B. Organically Fertilized Tea Plantation Stimulates N2O Emissions and Lowers NO Fluxes in Subtropical China. Biogeosciences 2015, 12, 5915–5928. [Google Scholar] [CrossRef]
  34. Myhre, G.; Shindell, D.; Bréon, F.-M.; Collins, W.; Fuglestvedt, J.; Huang, J.; Koch, D.; Lamarque, J.-F.; Lee, D.; Mendoza, B.; et al. Chapter 8—Anthropogenic and Natural Radiative Forcing. In Climate Change 2013: The Physical Science Basis; Working Group I Contribution to the Fifth Assessment Report of the Intergovernmental Panel on Climate Change; Cambridge University Press: Cambridge, UK; New York, NY, USA, 2014; pp. 659–740. [Google Scholar] [CrossRef]
  35. Lv, F.; Yang, X.; Xu, H.; Khan, A.; Zhang, S.; Sun, B.; Gu, J. Effect of Organic Amendments on Yield-Scaled N2O Emissions from Winter Wheat-Summer Maize Cropping Systems in Northwest China. Environ. Sci. Pollut. Res. 2020, 27, 31933–31945. [Google Scholar] [CrossRef]
  36. Peng, S.; Buresh, R.J.; Huang, J.; Yang, J.; Zou, Y.; Zhong, X.; Wang, G.; Zhang, F. Strategies for Overcoming Low Agronomic Nitrogen Use Efficiency in Irrigated Rice Systems in China. Field Crop. Res. 2006, 96, 37–47. [Google Scholar] [CrossRef]
  37. Fageria, N.K.; Baligar, V.C. Enhancing Nitrogen Use Efficiency in Crop Plants. Adv. Agron. 2005, 88, 97–185. [Google Scholar] [CrossRef]
  38. Che, S.G.; Zhao, B.Q.; Li, Y.T.; Yuan, L.; Li, W.; Lin, Z.A.; Hu, S.W.; Shen, B. Review Grain Yield and Nitrogen Use Efficiency in Rice Production Regions in China. J. Integr. Agric. 2015, 14, 2456–2466. [Google Scholar] [CrossRef]
  39. Chen, Z.; Wang, Q.; Ma, J.; Zou, P.; Jiang, L. Impact of Controlled-Release Urea on Rice Yield, Nitrogen Use Efficiency and Soil Fertility in a Single Rice Cropping System. Sci. Rep. 2020, 10, 10432. [Google Scholar] [CrossRef]
  40. Abbasi, M.K.; Tahir, M.M.; Rahim, N. Effect of N Fertilizer Source and Timing on Yield and N Use Efficiency of Rainfed Maize (Zea mays L.) in Kashmir-Pakistan. Geoderma 2013, 195–196, 87–93. [Google Scholar] [CrossRef]
  41. Fageria, N.K. Yield Physiology of Rice. J. Plant Nutr. 2007, 30, 843–879. [Google Scholar] [CrossRef]
  42. Zeng, X.; Han, B.; Xu, F.; Huang, J.; Cai, H.; Shi, L. Effects of Modified Fertilization Technology on the Grain Yield and Nitrogen Use Efficiency of Midseason Rice. Field Crop. Res. 2012, 137, 203–212. [Google Scholar] [CrossRef]
  43. Dobermann, A. Nutrient Use Efficiency–Measurement and Management. In Fertilizer Best Management Practices: General Principles, Strategy for Their Adoption and Voluntary Initiatives Versus Regulations; Krauss, A., Isherwood, K., Heffer, P., Eds.; International Fertilizer Industry Association: Paris, France, 2007; pp. 1–28. ISBN 295231392X. [Google Scholar]
  44. Appel, T. Relevance of Soil N Mineralization, Total N Demand of Crops and Efficiency of Applied N for Fertilizer Recommendations for Cereals—Theory and Application. Z. Für Pflanz. Und Bodenkd. 1994, 157, 407–414. [Google Scholar] [CrossRef]
  45. Cassman, K.G.; Dobermann, A.; Walters, D.T. Agroecosystems, Nitrogen-Use Efficiency, and Nitrogen Management. AMBIO A J. Hum. Environ. 2002, 31, 132. [Google Scholar] [CrossRef]
  46. Zheng, X.; Wang, M.; Wang, Y.; Shen, R.; Gou, J.; Li, J.; Jin, J.; Li, L. Impacts of Soil Moisture on Nitrous Oxide Emission from Croplands: A Case Study on the Rice-Based Agro-Ecosystem in Southeast China. Chemosph. Glob. Chang. Sci. 2000, 2, 207–224. [Google Scholar] [CrossRef]
  47. Zou, J.; Huang, Y.; Zheng, X.; Wang, Y. Quantifying Direct N2O Emissions in Paddy Fields during Rice Growing Season in Mainland China: Dependence on Water Regime. Atmos. Environ. 2007, 41, 8030–8042. [Google Scholar] [CrossRef]
  48. Qin, Y.; Liu, S.; Guo, Y.; Liu, Q.; Zou, J. Methane and Nitrous Oxide Emissions from Organic and Conventional Rice Cropping Systems in Southeast China. Biol. Fertil. Soils 2010, 46, 825–834. [Google Scholar] [CrossRef]
  49. Barker-Reid, F.; Gates, W.P.; Wilson, K.; Baigent, R.; Galbally, I.E.; Meyer, C.P.; Weeks, I.A.; Eckard, R.J. Soil Nitrous Oxide Emissions from Rainfed Wheat in SE Australia. In Proceedings of the 4th International Symposium on non-CO2 greenhouse gases (NCGG-4), Science, Control, Policy and Implementation, Utrecht, The Netherlands, 4–6 July 2005; Millpress Science Publishers: Rotterdam, The Netherlands, 2005; pp. 25–32. [Google Scholar]
  50. Bodelier, P.L.E.; Laanbroek, H.J. Nitrogen as a Regulatory Factor of Methane Oxidation in Soils and Sediments. FEMS Microbiol. Ecol. 2004, 47, 265–277. [Google Scholar] [CrossRef]
  51. Jia, Z.; Cai, Z.; Xu, H.; Li, X. Effect of Rice Plants on CH4 Production, Transport, Oxidation and Emission in Rice Paddy Soil. Plant Soil 2001, 230, 211–221. [Google Scholar] [CrossRef]
  52. Watanabe, A.; Takeda, T.; Kimura, M. Evaluation of Origins of CH4 Carbon Emitted from Rice Paddies. J. Geophys. Res. Atmos. 1999, 104, 23623–23629. [Google Scholar] [CrossRef]
  53. Aulakh, M.S.; Wassmann, R.; Bueno, C.; Rennenberg, H. Impact of Root Exudates of Different Cultivars and Plant Development Stages of Rice (Oryza sativa L.) on Methane Production in a Paddy Soil. Plant Soil 2001, 230, 77–86. [Google Scholar] [CrossRef]
  54. Kritee, K.; Nair, D.; Zavala-Araiza, D.; Proville, J.; Rudek, J.; Adhya, T.K.; Loecke, T.; Esteves, T.; Balireddygari, S.; Dava, O.; et al. High Nitrous Oxide Fluxes from Rice Indicate the Need to Manage Water for Both Long- and Short-Term Climate Impacts. Proc. Natl. Acad. Sci. USA 2018, 115, 9720–9725. [Google Scholar] [CrossRef]
  55. Nishimura, S.; Sawamoto, T.; Akiyama, H.; Sudo, S.; Yagi, K. Methane and Nitrous Oxide Emissions from a Paddy Field with Japanese Conventional Water Management and Fertilizer Application. Glob. Biogeochem. Cycles 2004, 18, 1–10. [Google Scholar] [CrossRef]
  56. Xiong, Z.Q.; Xing, G.X.; Tsuruta, H.; Shen, G.Y.; Shi, S.L.; Du, L.J. Measurement of Nitrous Oxide Emissions from Two Rice-Based Cropping Systems in China. Nutr. Cycl. Agroecosyst. 2002, 64, 125–133. [Google Scholar] [CrossRef]
  57. Lebender, U.; Senbayram, M.; Lammel, J.; Kuhlmann, H. Impact of Mineral N Fertilizer Application Rates on N2O Emissions from Arable Soils under Winter Wheat. Nutr. Cycl. Agroecosyst. 2014, 100, 111–120. [Google Scholar] [CrossRef]
  58. Yao, Z.; Zheng, X.; Liu, C.; Wang, R.; Xie, B.; Butterbach-Bahl, K. Stand Age Amplifies Greenhouse Gas and NO Releases Following Conversion of Rice Paddy to Tea Plantations in Subtropical China. Agric. For. Meteorol. 2018, 248, 386–396. [Google Scholar] [CrossRef]
  59. Knox, S.H.; Sturtevant, C.; Matthes, J.H.; Koteen, L.; Verfaillie, J.; Baldocchi, D. Agricultural Peatland Restoration: Effects of Land-Use Change on Greenhouse Gas (CO2 and CH4) Fluxes in the Sacramento-San Joaquin Delta. Glob. Chang. Biol. 2015, 21, 750–765. [Google Scholar] [CrossRef] [PubMed]
  60. Breidenbach, B.; Blaser, M.B.; Klose, M.; Conrad, R. Crop Rotation of Flooded Rice with Upland Maize Impacts the Resident and Active Methanogenic Microbial Community. Environ. Microbiol. 2016, 18, 2868–2885. [Google Scholar] [CrossRef] [PubMed]
  61. Liu, D.; Ishikawa, H.; Nishida, M.; Tsuchiya, K.; Takahashi, T.; Kimura, M.; Asakawa, S. Effect of Paddy-Upland Rotation on Methanogenic Archaeal Community Structure in Paddy Field Soil. Microb. Ecol. 2015, 69, 160–168. [Google Scholar] [CrossRef] [PubMed]
  62. Syakila, A.; Kroeze, C. The Global Nitrous Oxide Budget Revisited. Greenh. Gas Meas. Manag. 2011, 1, 17–26. [Google Scholar] [CrossRef]
  63. Flury, S.; McGinnis, D.F.; Gessner, M.O. Methane Emissions from a Freshwater Marsh in Response to Experimentally Simulated Global Warming and Nitrogen Enrichment. J. Geophys. Res. Biogeosci. 2010, 115, 1–9. [Google Scholar] [CrossRef]
  64. Wang, H.; Zhang, Y.; Zhang, Y.; McDaniel, M.D.; Sun, L.; Su, W.; Fan, X.; Liu, S.; Xiao, X. Water-Saving Irrigation Is a ‘Win-Win’ Management Strategy in Rice Paddies—With Both Reduced Greenhouse Gas Emissions and Enhanced Water Use Efficiency. Agric. Water Manag. 2020, 228, 105889. [Google Scholar] [CrossRef]
  65. Gurram, S.R. The BES Publications Short Guide to Scientific Writing Written by Emma Sayer—Functional Ecology Reviews Editor. J. Exp. Psychol. Gen. 2007, 136, 23–42. [Google Scholar]
  66. Yang, B.; Xiong, Z.; Wang, J.; Xu, X.; Huang, Q.; Shen, Q. Mitigating Net Global Warming Potential and Greenhouse Gas Intensities by Substituting Chemical Nitrogen Fertilizers with Organic Fertilization Strategies in Rice-Wheat Annual Rotation Systems in China: A 3-Year Field Experiment. Ecol. Eng. 2015, 81, 289–297. [Google Scholar] [CrossRef]
  67. Zou, J.; Huang, Y.; Lu, Y.; Zheng, X.; Wang, Y. Direct emission factor for N2O from rice–winter wheat rotation systems in southeast China. Atmos. Environ. 2005, 39, 4755–4765. [Google Scholar] [CrossRef]
  68. Deng, J.; Zhou, Z.; Zheng, X.; Liu, C.; Yao, Z.; Xie, B.; Cui, F.; Han, S.; Zhu, J. Annual emissions of nitrous oxide and nitric oxide from rice-wheat rotation and vegetable fields: A case study in the Tai-Lake region, China. Plant Soil 2012, 360, 37–53. [Google Scholar] [CrossRef]
  69. Lan, T.; Zhang, H.; Han, Y.; Deng, O.; Tang, X.; Luo, L.; Zeng, J.; Chen, G.; Wang, C.; Gao, X. Regulating CH4, N2O, and NO emissions from an alkaline paddy field under rice–wheat rotation with controlled release N fertilizer. Environ. Sci. Pollut. Res. 2021, 28, 18246–18259. [Google Scholar] [CrossRef]
  70. Gao, X.; Deng, O.; Ling, J.; Zeng, M.; Lan, T. Effects of controlled-release fertilizer on nitrous oxide and nitric oxide emissions during wheat-growing season: Field and pot experiments. Paddy Water Environ. 2018, 16, 99–108. [Google Scholar] [CrossRef]
  71. Ma, Y.C.; Kong, X.W.; Yang, B.; Zhang, X.L.; Yan, X.Y.; Yang, J.C.; Xiong, Z.Q. Net global warming potential and greenhouse gas intensity of annual rice–wheat rotations with integrated soil–crop system management. Agric. Ecosyst. Environ. 2013, 164, 209–219. [Google Scholar] [CrossRef]
  72. Yao, Z.; Zheng, X.; Wang, R.; Dong, H.; Xie, B.; Mei, B.; Zhou, Z.; Zhu, J. Greenhouse gas fluxes and NO release from a Chinese subtropical rice-winter wheat rotation system under nitrogen fertilizer management. J. Geophys.Res. Biogeosci. 2013, 118, 623–638. [Google Scholar] [CrossRef]
Figure 1. Mean daily air temperature, cumulative precipitation, and soil temperature (for the rice field and peach orchard) during the experimental period of June 2019–June 2020. The soil temperature break of the orchard (15 January to 23 April 2020) in the figure indicates no sampling due to the COVID-19 pandemic.
Agronomy 12 01850 g001
Figure 2. The seasonal fluxes of soil CH4 (a), N2O (b), and NO (c) in the rice and peach orchard fields under different fertilization treatments. The solid black line and gray shading indicate the fertilization time and irrigation period of the rice field, respectively. Values are mean ± SE (n = 3). The orchard break (15 January to 23 April 2020) in the figure indicates no sampling due to the COVID-19 pandemic. The left y-axis is for the rice field, and the right y-axis is for the peach orchard.
Agronomy 12 01850 g002
Figure 3. Seasonal dynamics of (a) water-filled pore space (WFPS), (b) pH, (c) electrical conductivity (EC), (d) ammonium (NH4+), (e) nitrate (NO3), and (f) dissolved organic carbon (DOC) concentrations. Values are means ± SE (n = 3). The left y-axis is for the rice field, and the right y-axis is for the peach orchard.
Agronomy 12 01850 g003
Figure 4. Dependency of CH4, N2O, and NO fluxes on soil physicochemical parameters in the rice field over a growing season; * and ** indicate statistical significance at p < 0.05 and 0.01.
Agronomy 12 01850 g004
Table 1. The main soil properties in the rice field and transformed peach orchard at a depth of 0–15 cm. Data are means ± standard error (n = 3).
CroplandpH (H2O)Bulk Density (g cm−3)Total C (g C kg−1)Total N (g N kg−1)NH4+ (mg N kg−1)NO3−1 (mg N kg−1)DOC (mg C kg−1)
Rice field6.9 ± 0.131.10 ± 0.0210.85 ± 0.422.14 ± 0.180.86 ± 0.08181.21 ± 84.2625.73 ± 1.23
Peach orchard7.2 ± 0.041.37 ± 0.0112.71 ± 0.292.01 ± 0.04 2.92 ± 0.2810.31 ± 0.2758.68 ± 2.03
Table 2. Cumulative fluxes of CH4, N2O, NO, CH4 plus N2O, and N2O plus NO for the rice-growing season and annual rice field and peach orchard, as well as direct emission factors (EF) of N2O, NO, and N2O plus NO for rice cropping systems. Data for the wheat growing season were obtained from the average emissions from conventional fertilizer treatments in previous rice–wheat rotation studies in the same region. Values are means ± SE (n = 3). Means that do not share a letter are statistically significantly different from each other (p < 0.05).
CroplandTreatmentCH4 N2O NOGWPN2O + NODirect Emission Factor (%)
(kg C ha−1)(kg N ha−1)(kg N ha−1)(t CO2-eq ha−1) (kg N ha−1)EFN2OEFNOEFN2O+NO
Rice-growing seasonRice fieldPN028.55 ± 7.34 ab0.49 ± 0.41 c0.15 ± 0.03 a1.12 ± 0.18 bc0.64 ± 0.44 c
PN16036.53 ± 12.53 ab2.44 ± 0.93 bc0.19 ± 0.10 a1.88 ± 0.70 abc2.63 ± 1.03 bc1.220.031.25
PN22061.00 ± 18.35 a2.82 ± 0.08 ab0.23 ± 0.05 a2.77 ± 0.64 ab3.05 ± 0.13 ab1.060.041.1
PN28085.28 ± 31.43 a4.00 ± 0.68 a0.27 ± 0.02 a4.09 ± 1.27 a4.27 ± 0.70 a1.250.041.29
Peach orchardON280−4.90 ± 2.01 b1.57 ± 0.06 bc0.25 ± 0.04 a0.30 ± 0.06 c1.82 ± 0.07 bc
AnnualRice-wheat estimationPN028.61 ± 7.34 bc2.12 ± 0.41 c2.05 ± 0.03 b1.61 ± 0.18 b4.18 ± 0.39 d
PN16040.72 ± 12.53 abc8.07 ± 0.93 a3.07 ± 0.10 a3.79 ± 0.70 ab11.15 ± 0.90 b1.420.241.66
PN22065.19 ± 18.35 ab8.28 ± 0.08 a3.11 ± 0.05 a4.68 ± 0.64 a11.39 ± 0.11 ab1.280.221.5
PN28089.47 ± 31.43 a9.93 ± 0.68 a3.15 ± 0.02 a6.00 ± 1.27 a13.08 ± 0.69 a1.440.20 1.64
Peach orchardON280−0.65 ± 5.38 c5.59 ± 0.47 b1.16 ± 0.10 c1.75 ± 0.32 b7.11 ± 0.38 c
Table 3. Yield, biomass, N agronomic efficiency (NAE), and greenhouse gas intensity (GHGI) for the rice-growing season. Values are means ± SE (n = 3). Different letters in a single column indicate a significant difference between treatments at the 0.05 probability level. NA, not available. Means that do not share a letter are statistically significantly different from each other (p < 0.05).
CroplandTreatmentAnnual N Rate
(kg N ha−1)
Yield
(t ha−1)
Biomass
(t ha−1)
NAE
(kg kg−1)
GHGI
(t CO2-eq t−1 Yield)
Rice fieldPN005.64 ± 0.54 c11.78 ± 3.81 b 0.20 ± 0.02 a
PN1601607.90 ± 0.65 b20.95 ± 1.11 a14.14 ± 4.09 a0.25 ± 0.10 a
PN2202208.14 ± 0.42 b24.60 ± 0.40 a11.39 ± 1.88 a0.33 ± 0.06 a
PN28028010.73 ± 0.29 a21.64 ± 2.37 a18.18 ± 1.02 a0.39 ± 0.13 a
Publisher’s Note: MDPI stays neutral with regard to jurisdictional claims in published maps and institutional affiliations.

