
Evaluation of a Tomato Waste Biofilter for the Retention of Gaseous Losses from Pig Slurry Hygienization by pH Modification


1
Agrarian School of Viseu, Polytechnic Institute of Viseu, Quinta da Alagoa, 3500606 Viseu, Portugal
2
Centre for the Research and Technology of Agro-Environmental and Biological Sciences (CITAB), Inov4Agro, University of Trás-os-Montes and Alto Douro, Quinta de Prados, 5000801 Vila Real, Portugal
3
CERNAS-IPV Research Centre, Polytechnic Institute of Viseu, Campus Politécnico, Repeses, 3504510 Viseu, Portugal
4
LEAF, Instituto Superior de Agronomia, Universidade de Lisboa, Tapada da Ajuda, 1349017 Lisboa, Portugal
*
Author to whom correspondence should be addressed.
Agronomy 2022, 12(8), 1838; https://doi.org/10.3390/agronomy12081838
Submission received: 12 July 2022
/
Revised: 27 July 2022
/
Accepted: 1 August 2022
/
Published: 3 August 2022
(This article belongs to the Special Issue Mitigation of Ammonia and Greenhouse Gas Emissions from Livestock Systems)
Abstract
:The use of pig slurry as organic fertilizer in intensive horticulture could be possible after hygienization to avoid contamination of products. This research aimed to evaluate a mixture of a tomato waste and rice husk as biofilter media to reduce NH3, N2O, CO2, and CH4 losses from a simple and low-cost solution for slurry hygienization by pH modification. The experiment was made in a system of laboratory scale biofilters connected to jars filled with raw slurry as control and three treatment methods: acidified slurry, alkalinized slurry, and neutralized slurry. The gas concentrations were measured for 35 days, and the composition of slurries and biofilters were determined. The results of this study showed that the mixture of biofiltering media, composed of tomato waste and rice husk, has the potential to retain NH3 and greenhouse gases (GHG) from a simple and low-cost solution for slurry hygienization by pH modification. Compared to the treatment raw slurry biofilter, the treatment neutralized slurry biofilter, subjected to a combined treatment by alkalinization/neutralization, retained 19% NH3, 4% CO2, and 83% CH4 losses and had no impact on N2O and global warming potential. Thus, the use of tomato waste biofilter during alkalinization did not increase the loss of NH3 and reduced GHG compared to raw slurry, avoiding the subsequent neutralization of slurry for environmental reasons, and could be used as an organic fertilizer in horticulture. However, using the combined alkalinization/neutralization treatment will improve the fertilizer value of the slurry by adjusting the pH from 9.5 to 7.5.
1. Introduction
The industrialization of livestock production over Europe led to specialized farms with a slurry (liquid manure) based system, that are generally dissociated from crop production [1,2]. In the EU-28, close to 1.2 billion tons of manure are produced annually, mainly from 89.5 million bovine animals, 147.8 million pigs, and 1.7 billion poultry animals [3]. Consequently, while livestock production continues to increase (duplication in 2050 [4]), the surface of agricultural soil available to receive the derived animal slurry tends to diminish. The dissociation of the two systems strengths the problem related to slurry management [1], and the efficiency of integrated productive systems were outlined in several studies [5,6]. A frequent consequence of this dissociation is the over-application of slurry in some fields and consequent environmental problems, such as nitrate leaching and greenhouse gases (GHG) and ammonia (NH3) emissions.
Slurry treatment has been pointed out as a solution to improve slurry management. Namely, solid–liquid separation leads to a solid fraction rich in organic matter and phosphorus (P) that can easily be transported to other farms [7]. Such techniques are now widely used at farm scale, but interest in the resulting liquid fraction is still scarce and many farmers mix it back in the slurry store. Anaerobic digestion is another solution to improve slurry management, but it requires strong investment and, consequently, is marginally used in Portugal. The challenge is therefore to find some new soil areas to apply raw slurry or the derived liquid fraction. In Europe, slurry is mostly applied on grasslands and cereals [8,9,10,11]. The use of slurry for soil fertilization in industrial horticulture has been considered but remained marginal [12,13,14]. Minimizing the use of chemical fertilizers is essential for integrated horticultural production [15], but also for environmentally friendly development. Furthermore, some alternatives to mineral P fertilizer are needed since current global reserves of P rocks may be depleted in 50–100 years [16]. Fertilization using slurry has the advantage of providing nitrogen (N) and P, but also a significant part of organic matter that contributes to soil productivity. Mineral fertilizers replacement by slurry in industrial horticulture should therefore be a successful solution.
The main limitation is the fact that land application of untreated livestock manures increases the health risk for the animals and people, because of the diffusion of pathogens into the soil and the air, and because it creates unpleasant odors [17]. A wide range of pathogenic microorganisms exists in slurry [18], and slurry treatment is recommended before soil application to minimize the risk of human or animal contamination since some microorganisms and bacterial zoonosis survive for long periods after soil application [19,20]. Pathogen survival relies on several factors such as initial level of contamination, time, pH, salinity, dry matter content, competing microbiota, and temperature [17]. The only sanitation process used at farm scale before application to cereals or grass is slurry storage during a specific period (almost 60 days in summer and 90 days in winter), before application to grazing land [21]. However, even if storage for 90 days might be enough to solve the pathogens issues [22], the bacteria survival is more complex, and some studies have reported survival well more than 90 days [23].
When considering slurry application to horticulture products, a deeper slurry sanitation must be guaranteed to avoid human health problems, but also for marketing reasons. Chemical treatment of slurry by pH modification has proved to be efficient at eliminating most pathogens and bacteria present in slurry. Disinfection of slurry by addition of ash, lime, urea, and NH3 has been tested [24,25,26], but the selection of the chemical agent must consider the time necessary for adequate treatment, the anti-microbial effectiveness, and the agronomic value of the product [26]. Indeed, a quick rise of pH and consequent die-off of pathogens can be achieved by lime addition, but the effect is temporary due to pH decreasing over time and potential regrowth of some pathogens [27]. However, very limited data are available relative to the effect of slurry acidification on pathogenic microorganisms. Furthermore, slurry acidification has proved to be efficient at delaying the nitrification process after soil application [28,29]. Slurry treatment by urea or NH3 addition showed to be the most suitable animal waste disinfectants, despite concerns about NH3 emissions and the environmental impact [20,24].
An advantage is the fact that it is possible to recycle the N as fertilizer after the treatment. However, the increased NH3 content in the treated material leads to a risk for NH3 gas emissions during treatment and storage. A solution to minimize such impact might be the use of NH3 scrubbers or biofilters, which have been shown to be efficient at avoiding NH3 emissions and minimizing odors [28]. The use of raw materials generally used for growing media as packing material in the biofilter could allow its subsequent soil application. Similarly, the acid solution used in the scrubber could be used to acidify the treated slurry immediately before soil application to minimize NH3 emissions [29]. However, the impact of such treatment on the slurry characteristics, namely its fertilizer value and nutrients availability, on GHG emissions during storage or after field application, have not been considered and need to be studied to avoid the so-called pollution swapping. Similarly, the impact of treated slurry application on the soil quality must be monitored to avoid any negative effect.
This research aimed to evaluate a mixture of a tomato waste and rice husk as biofilter media to reduce NH3, nitrous oxide (N2O), carbon dioxide (CO2) and methane (CH4) losses from a simple and low-cost solution for slurry hygienization by pH modification.
2. Materials and Methods
2.1. Slurry Treatments
The untreated (raw) pig slurry used in this study (Table 1) was collected from the outdoor pipe of a fattening pig building located in Viseu, Portugal. We considered four treatments, namely untreated slurry as control (raw slurry) and the following three treated methods: acidified slurry, alkalinized slurry, and neutralized slurry. The three treatment slurries were obtained by the methodology described in Rodrigues et al. [30]. For raw slurry, a sample of 4000 g of untreated raw slurry without any additive was retained in closed plastic containers at 20 °C for 24 h. For alkalinized slurry, another sample of 4000 g of raw slurry was subjected to alkalinization with pH 9.5 that was achieved by adding 28 g of concentrated KOH, 85% (w/w) and d = 2.04 g cm−3 (Macron Fine Chemicals, Radnor, PA, USA), with continuous mixing. For neutralized slurry, a sample of 4000 g of raw slurry was alkalinized to pH 9.5 (as previously described), and after 24 h, the slurry sample was neutralized to pH 7.5 by adding 16 mL of concentrated H2SO4, 95% (w/w) and d = 1.84 kg L−1 (AppliChem GmbH, Darmstadt, Germany), under continuous mixing. For acidified slurry, another sample of 4000 g of raw slurry was acidified by adding 32 mL of concentrated H2SO4, 95% (w/w) and d = 1.84 kg L−1 (Chem-Lab, Zedelgem, Belgium) to the target pH of 5.0, with continuous mixing.
Slurry samples of the four treatments (three replications per treatment), were subdivided into doses of 1000 g and used in the laboratory experiment. Other subsamples of each treatment (three replications per treatment) were retained and analyzed by standard laboratory methods to the parameters shown in Table 2. Summarizing, pH (H2O) was determinate by potentiometry (EN 13037, Brussels, Belgium), dry matter content by the gravimetric method (24 h at 105 °C) (EN 13040, Brussels, Belgium), total C by the Dumas method, total N by the Kjeldahl method (EN 13654-1, Brussels, Belgium), NH4+ and NO3− by absorption spectrophotometry (EN 13652, Brussels, Belgium), bulk density by the volumetric method, and biochemical oxygen demand by incubation over 5 days at 20 °C (ISO 5815-1, Geneva, Switzerland).
2.2. Biofiltration
The tomato waste was collected from an agricultural greenhouse located in Viseu, Portugal and the rice husk was supplied from a rice industry located in Aveiro, Portugal. The tomato waste was naturally dehydrated, cut by hand in small pieces (<5 mm), and mixed with rice husk at a ratio 3:1 (tomato waste:rice husk) for the biofilter packing material. The composition of these two packing materials are given in Table 1, being analyzed by standard laboratory methods [31]: pH (H2O) was determined by potentiometry (EN 13037, Brussels, Belgium), dry matter content by the gravimetric method (EN 13040, Brussels, Belgium), total carbon by the Dumas method, total nitrogen by the Kjeldahl method (EN 13654-1, Brussels, Belgium), NH4+ and NO3− by absorption spectrophotometry, and bulk density and porosity by the volumetric method.
2.3. Experimental Design
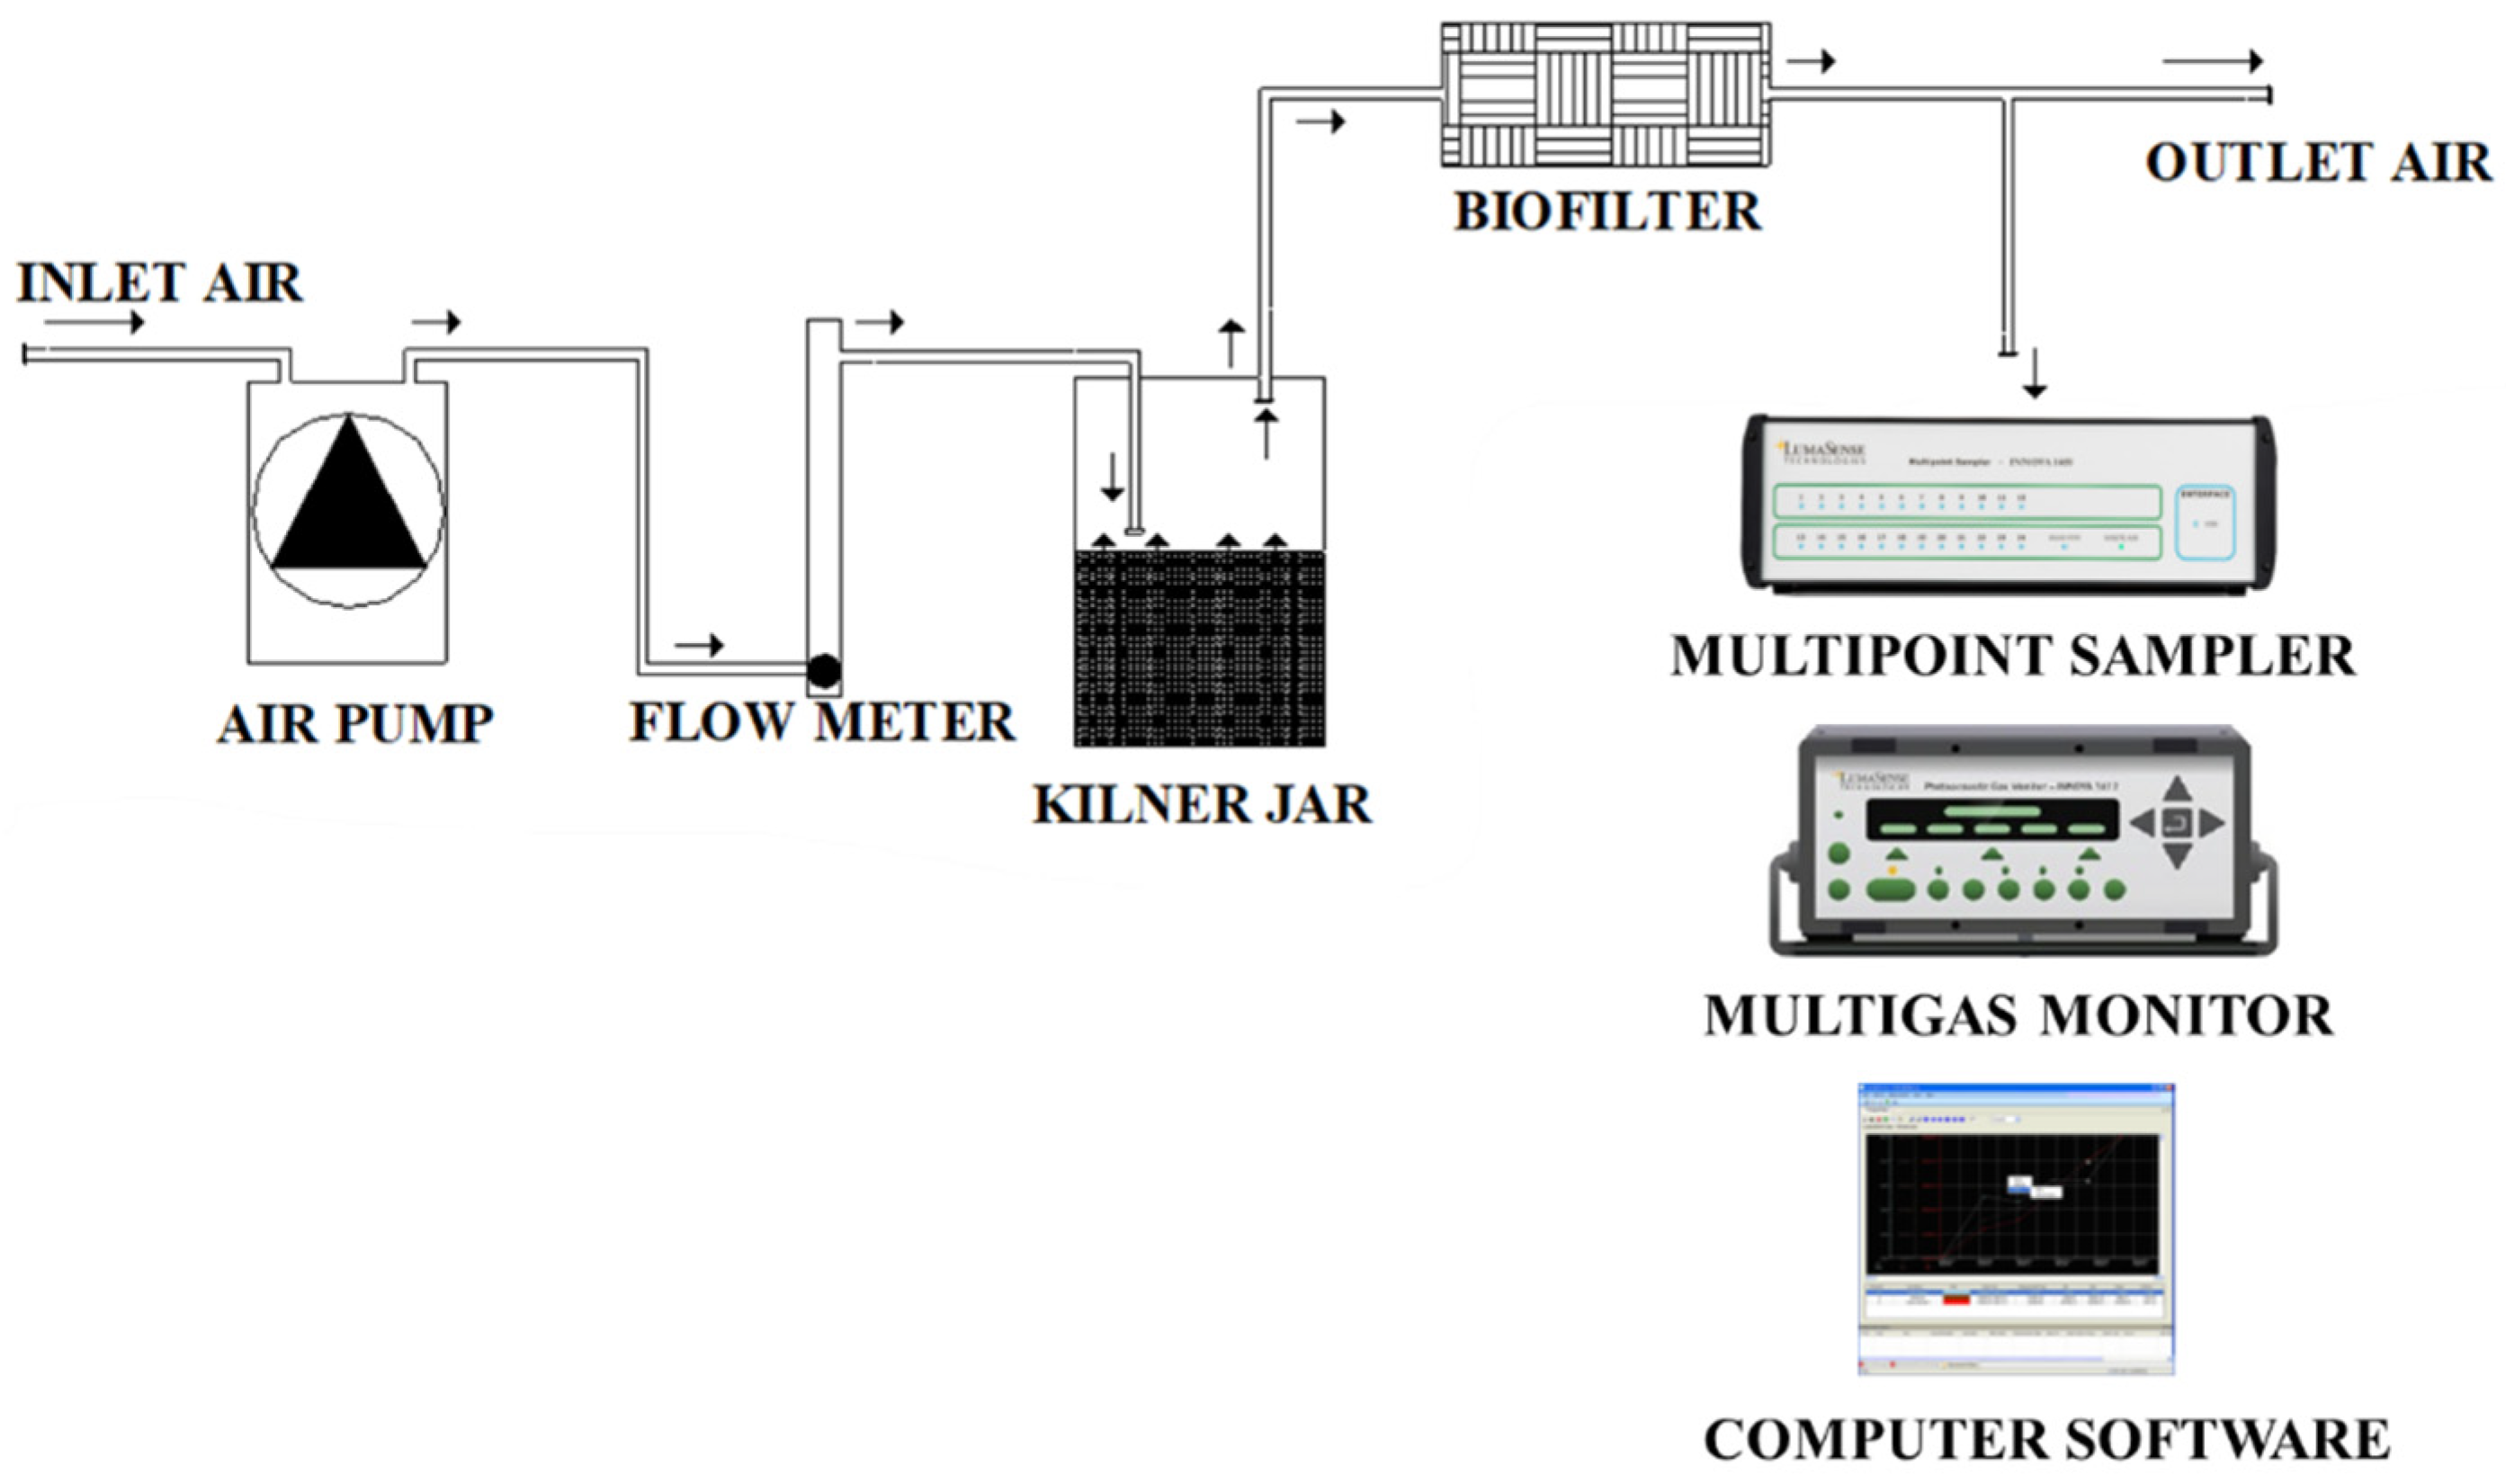
The experiment was made in a climatic room using a laboratory system developed by Pereira et al. [31] to mimic scale biofilters (Figure 1). Briefly, a system of twelve laboratory scale biofilters (H = 13.5 cm, Ø = 9.5 cm) was connected to Kilner glass jars (H = 23.0 cm, Ø = 10.5 cm, volume = 2000 mL) filled with 1000 mL (H = 11.5 cm) of pig slurry each and under a constant airflow rate (2500 mL min−1). A flow meter (AalborgTM FT10201SAVN, Aalborg, Denmark) connected to a small pump (KNF, model N010.KN.18, Neuberger GmbH, Freiburg, Germany) assured the constant airflow rate of each jar. The NH3, N2O, CO2, and CH4 concentrations from the outlet air were monitored under constant temperature (20 °C), and in the next 35 days to the application of 100 g of the biofilter mixture, being composed by 75% tomato waste and 25% rice husk. Each one of the four treatments with three replications were added to each Kilner jar (1000 mL of slurry), leaving an equal volume of empty headspace between the slurry surface and the lid. A first Teflon tube (Ø = 3000 µm) was inserted into a septum for air inlet (20 mm of paste surface) and a second Teflon tube was symmetrically positioned in another septum for air outlet. The inlet air came from inside the climate room and passed through NH3 retention filters coated with oxalic acid, while the exhaust air from the biofilters was expelled out of the climate room through a hood.
Air samples from each biofilter were collected sequentially (every 2 min with a Teflon tube) by a multipoint sampler (INNOVA 1409-12, Lumasense Technologies, Ballerup, Denmark), followed by analysis to the gas concentrations using a photoacoustic multigas monitor (INNOVA 1412i-5, Lumasense Technologies, Ballerup, Denmark) and controlled by a LumaSoft Gas Multipoint 7870 Software (Lumasense Technologies, Ballerup, Denmark). The monitor was previously calibrated by the manufacturer and operated in a mode that compensates water interference and cross interference, being equipped with an optical filter for water vapor (filter type SB0527, Lumasense Technologies, Ballerup, Denmark) and with the following detection limits: 152.1 µg m−3 for NH3 (filter type UA0973, Lumasense Technologies, Ballerup, Denmark), 58.9 µg m−3 for N2O (filter type UA0985, Lumasense Technologies, Ballerup, Denmark), 2947.1 µg m−3 for CO2 (filter type UA0982, Lumasense Technologies, Ballerup, Denmark), and 286.4 µg m−3 for CH4 (filter type UA0969, Lumasense Technologies, Ballerup, Denmark).
The NH3, N2O, CO2, and CH4 concentrations from the outlet air of each biofilter were expressed per hour and day. The NH3, N2O, CO2, and CH4 elimination efficiency (EE, %) and pollutant elimination capacity (EC, mg m−3 s−1) of each biofilter used in treated slurries (acidified slurry, alkalinized slurry, and neutralized slurry) were determined by comparing the daily gas concentrations of the biofilter used in raw slurry and each biofilter of treated slurries. A detailed description of the procedure to calculate EE and EC could be found in Pereira et al. [31].
2.4. Statistical Analysis
The data were analyzed by the statistical software package STATISTIX 10 (Analytical Software, Tallahassee, FL, USA). The one-way analysis of variance (ANOVA) was used to test the effects of each treatment on the composition of slurries and biofilters and gaseous losses, and the statistical significance (p < 0.05) of the means difference between treatments was determined by the Tukey’s Honest Significant Difference test.
3. Results
3.1. Composition of the Tretated Slurries and Biofilters
The initial (0 day) composition of the untreated (raw) and treated (acidified, alkalinized, and neutralized) slurries are shown in Table 2. The initial values of pH decreased significantly (p < 0.05), from 5.0 to 9.5, by the following order of treatments: acidified slurry < neutralized slurry < raw slurry < alkalinized slurry (Table 2). The initial content of dry matter (DM), total C, total N, NH4+, NO3−, and C/N ratio did not differ significantly (p > 0.05) among untreated and treated slurries considering the observed values, which varied from 22 to 24 g kg−1 of DM, 440 to 494 g kg−1 of total C, 46 to 60 g kg−1 of total N, 21 to 25 g kg−1 of NH4+, 4 to 6 mg kg−1 of NO3−, and 8 to 10 of C/N ratio (Table 2). The initial values of biological oxygen demand (BOD) decreased significantly (p < 0.05) in the following order: raw slurry < neutralized slurry < alkalinized slurry < acidified slurry (Table 2).
The final (35 days) composition of the biofilter media mixtures are shown in Table 3. The final values of pH, DM, total C, total N, NH4+, NO3−, and C/N ratio were not significantly different (p > 0.05) among untreated and treated slurries, but with a numerical decrease of pH and total N and a numerical increase of DM, total C, and C/N ratio in the three treated slurries when compared with raw slurry (Table 3).
3.2. Ammonia and Nitrous Oxide Losses
The daily concentrations of NH3 from treatments are shown in Table 4 and varied significantly (p < 0.05) among untreated (raw) and treated (acidified, alkalinized, and neutralized) slurries. Comparatively to all other treatments, the daily NH3 concentrations were significantly higher (p < 0.05) in the first 5 days for the treatment alkalinized slurry (46 to 21 mg NH3 m−3), followed by a progressive decrease between days 6 and 30 and with significantly higher (p < 0.05) values (6 to 12 mg NH3 m−3) for treatment raw slurry (Table 4). From day 26 until the end of the experiment, the daily NH3 concentrations did not differ significantly (p > 0.05) among all treatments and varied from 2 to 7 mg NH3 m−3 (Table 4). Comparatively to treatments raw slurry and neutralized slurry, the daily NH3 concentrations of treatment alkalinized slurry increased about four times in the first 5 days of experiment, while these same concentrations were reduced to about half in treatment acidified slurry and during the same period (Table 4). The mean NH3 concentrations (0–35 days) did not vary significantly (p > 0.05) among treatments raw slurry and neutralized slurry, being significantly reduced (p < 0.05) by 48% in treatment acidified slurry and significantly increased (p < 0.05) by 46% in treatment alkalinized slurry (Table 4).
As can be observed in Table 5, the NH3 elimination efficiency was not significantly different (p > 0.05) among treatments raw slurry and alkalinized slurry, although being observed a numerically increase of 5% in treatment alkalinized slurry. Comparatively to treatment raw slurry, the NH3 elimination efficiency was significantly reduced (p < 0.05) by 43% in treatment acidified slurry and by 19% neutralized slurry (Table 5). The NH3 elimination capacity of biofilter follow the same trend than NH3 elimination efficiency, being significantly reduced (p < 0.05) in the three treated slurries relative to untreated (raw) slurry and with higher reductions in treatments acidified slurry and neutralized slurry (reduction of 169 µg NH3 m−3 s−1 for acidified against reduction of 82 µg NH3 m−3 s−1 for neutralized) (Table 5). In addition, no significant differences (p > 0.05) were found among treatments raw slurry and alkalinized slurry on the NH3 elimination capacity (Table 5).
The daily concentrations of N2O from all treatments did not vary during the 35 days of experiment (Table 4). The daily N2O concentrations, including the average values (0–35 days), from untreated (raw) and treated (acidified, alkalinized, and neutralized) slurries did not differ significantly (p > 0.05) (430 to 460 µg N2O m−3), although numerically higher values in treated slurries were observed at most measurement days (Table 4). Comparatively to treatment raw slurry, the mean N2O concentrations (0–35 days) of treated (acidified, alkalinized, and neutralized) slurries did not differ significantly (p > 0.05) but were numerically higher in treatment alkalinized slurry (517 µg N2O m−3 for alkalinized against 506 µg N2O m−3 for all other treatments) (Table 4).
The N2O elimination efficiency did not reduce significantly (p > 0.05) in treated (acidified, alkalinized, and neutralized) slurries relative to untreated (raw) slurry, with a numerical increase observed in the following order: acidified slurry > neutralized slurry > alkalinized slurry (Table 5). Comparatively to the untreated (raw) slurry, the N2O elimination capacity was not significantly reduced (p > 0.05) in treated (acidified, alkalinized, and neutralized) slurries, with an increase observed in the elimination capacity that ranged from 0.1 to 0.5 µg N2O m−3 s−1 of increase) (Table 5).
3.3. Carbon Dioxide and Methane Losses
As can be observed in Table 4, during the 35 days of experiment, the daily concentrations of CO2 are very close between untreated (raw) and treated (acidified, alkalinized, and neutralized) slurries. Comparatively to all other treatments, the daily CO2 concentrations were significantly higher (p < 0.05) in the first 2 days for the treatments acidified slurry and alkalinized slurry (1140 to 1150 mg CO2 m3), followed by significantly higher (p < 0.05) values (907 mg CO2 m3) from day 3 to 10 for treatment raw slurry (Table 4). From day 11 until the end of the experiment, the daily CO2 concentrations did not differ significantly (p > 0.05) among all treatments, although numerically higher (970 to 1290 mg CO2 m3) in treatment raw slurry (Table 4). The mean CO2 concentrations (0–35 days) were reduced, but not significantly (p > 0.05) in treated (acidified, alkalinized, and neutralized) slurries relative to untreated (raw) slurry (985 mg CO2 m3 for treated slurries against 1019 mg CO2 m3 for untreated slurry) (Table 4).
The CO2 elimination efficiency and capacity were significantly reduced (p < 0.05) in the three treated slurries relative to untreated (raw) slurry, and numerically higher reductions in treatments acidified slurry and neutralized slurry were observed (reductions of 3.6–4.2% for elimination efficiency and 1362–2397 µg CO2 m3 s−1 for elimination capacity) (Table 5).
The daily concentrations of CH4 peaked twice in all treatments and during the 35 days of experiment, with a first peak (45 to 192 µg CH4 m−3) in the first 5 days followed by a second peak (72 to 159 µg CH4 m−3) between days 26 and 30 (Table 4). The daily concentrations of CH4 were not significantly reduced (p > 0.05) in treated (acidified, alkalinized, and neutralized) slurries when compared to untreated (raw) slurry, despite being numerically higher in treatment raw slurry during the 35 days of experiment (Table 4). The mean CH4 concentrations (0–35 days) were significantly higher (p < 0.05) in treatment untreated (raw) slurry (69 µg CH4 m−3) when compared with treated (acidified, alkalinized, and neutralized) slurries (24 to 38 µg CH4 m−3) (Table 4).
The CH4 elimination efficiency and capacity decreased significantly (p < 0.05) in the three treated slurries comparatively to the untreated (raw) slurry, with average reductions of 78.9% for elimination efficiency and 1.1 µg CH4 m−3 s−1 for elimination capacity (Table 5) observed. In addition, the global warming potential elimination efficiency decreased significantly (p < 0.05) in the three treated slurries relative to untreated (raw) slurry, with a numerically higher reduction observed in treatments acidified slurry and neutralized slurry (reduction of 2216 µg CH4 m−3 s−1 for elimination capacity) (Table 5).
4. Discussion
4.1. Gaseous Losses from Tretated Slurries
The acidification of pig slurry to decrease the slurry pH to an acidic range (3.5–5.5) leads to a modification of the ratio NH4+:NH3, with about 98.00–99.98% of NH4+, and therefore reduces NH3 volatilization and preserves NH4+ in slurries [32,33], being in line with this study, where NH3 losses were reduced in treatment acidified slurry (Table 4). Regueiro et al. [33] reported higher concentrations of total solids in acidified pig slurry relative to non-acidified slurry, and in this study higher concentrations of DM and TC were observed in raw slurry (Table 1). However, an increase in the population of E. Coli is expected after acidification to pH = 5.5 of pig slurry and therefore an increased risk of its leaching after application to soil [34,35]. Also, to comply with Regulation (EU) 2019/1009, the European microbiological rule for fertilizers requires the absence of Salmonella spp. in 25 g of material and less than 1000 colony-forming units of E. Coli per g of fresh material. Alkalinization of pig slurry to raise the manure pH to a basic range (9.0–11.0) has been shown to be effective in reducing the number of pathogens at pH 9.0–13.0; particularly, the level of E. Coli was below the sanitization threshold for all samples [30]. However, as observed in this study (Table 4), such treatment increases the volatilization of NH3 in the treatment alkalinized slurry (pH = 9.5) in relation to the treatment raw slurry, which decreases the NH4+ in the pulps and increases the environmental impact. In addition, successive applications of alkalinized slurry in non-acidic soils can pose an additional problem for agricultural production. The neutralization of pig slurry to decrease the pH from 9.5 to 7.5 reduced the risks described above, particularly the reduction of NH3 losses to values below those of the treatment raw slurry (Table 4).
4.2. Gaseous Losses from Biofiltration
Previous studies [31,36] have reported great potential for NH3 retention using a wide range of packing materials as biofilters, with reductions ranging from 64 to 78% for woodchips and 51 to 77% for tomato-based biofilters. This retention of NH3 by the biofilter packing material can be explained by the removal of NH3 dissolved in the aqueous phase by nitrifying bacteria and by the accumulation in the organic packing material itself [37]. Pereira et al. [31] developed tomato based biofilters and obtained 77% and 908 µg m−3 s−1 of NH3 elimination efficiency and capacity, respectively, in packing material with 75% tomato waste and 25% rice husk. It is noteworthy that the composition of this biofilter packaging material was like that used in the present study, with the same efficiency in NH3 retention being observed for the alkalinized slurry as for the raw slurry (Table 5). However, this same biofilter was more effective on NH3 retention from neutralized slurry (19% of reduction) relative to alkalinized slurry (82 µg m−3 s−1 elimination capacity for neutralized against 10 µg m−3 s−1 elimination capacity) (Table 5). Overall, the use of this biofilter packing material in the treatment neutralized slurry retained about 96% of NH3 losses when compared to whole slurry without a biofilter.
In recent studies [31,38], an increase in N2O emissions from biofilters has been reported regardless of packaging material, with increases from 0 to 400% for woodchips and 10 to 61% for tomato-based biofilters. The N2O emissions were produced in the biofilter from both nitrification and denitrification processes [37]. In the present study, the biofilter (packing material with 75% tomato waste and 25% rice husk) did not increase the N2O emissions from the three treated slurries in relation to the untreated (raw) slurry (Table 5), being related to the release of compounds from acidified/alkalinized slurries that can inhibit nitrifiers/denitrifiers from packing materials.
Published studies [31,39] have reported equal efficiency and CO2 scavenging capacity between different biofilter packaging materials (e.g., agroforestry wastes). The CO2 emissions coming from the microbial oxidation of gaseous contaminants of the packing material and also from the urea hydrolysis and methanogenesis in slurries. In the present study, a decrease in CO2 losses from the biofilter of the treated slurries was observed in relation to the untreated slurry (Table 5), which may be related to the pH modification by the acidification/alkalinization processes that reduced the microbial activity.
Other studies [31,40,41] found up to 85% CH4 removal efficiency using different biofilter packaging materials, including 69% reduction for the same type of biofilter packaging material used in this study. The mechanisms responsible for the high removal of CH4 from the biofilter are its adsorption by packaging materials and conversion to CO2 and H2O by methanotrophic bacteria [31,42]. Compared with the untreated slurry, high CH4 removal efficiencies (74 to 83% reduction) were observed in the three treated slurries, with high values for neutralized slurry (Table 5), which may be due to an inhibition of methanotrophic bacteria by acidification/alkalinization processes.
Although the results of this study suggest that the biofilter packaging material, with 75% tomato waste and 25% rice husk, has the potential to retain NH3 and GHG from a combined alkalinization/neutralization treatment, further studies are needed under real conditions to confirm these findings.
5. Conclusions
The results of this study showed that the mixture of biofiltering media, composed of tomato waste and rice husk, had the potential to retain NH3 and GHG from a simple and low-cost solution for slurry hygienization by pH modification. Compared to the treatment raw slurry biofilter, the treatment neutralized slurry biofilter, subjected to a combined treatment by alkalinization/neutralization, retained 19% NH3, 4% CO2, and 83% CH4 losses and had no impact on N2O and global warming potential. Thus, the use of tomato waste biofilter during alkalinization did not increase the loss of NH3 and reduced GHG compared to raw slurry, avoiding the subsequent neutralization of slurry for environmental reasons, and could be used as an organic fertilizer in horticulture. However, using the combined alkalinization/neutralization treatment will improve the fertilizer value of the slurry by adjusting the pH from 9.5 to 7.5.
Author Contributions
Conceptualization, J.L.S.P. and D.F.; methodology, J.L.S.P., A.P. and D.F.; software, J.L.S.P., A.P. and D.F.; validation, J.L.S.P., A.P. and D.F.; formal analysis, J.L.S.P., A.P. and D.F.; investigation, J.L.S.P., A.P. and D.F.; resources, J.L.S.P., A.P. and D.F.; data curation, J.L.S.P., A.P. and D.F.; writing—original draft preparation, J.L.S.P.; writing—review and editing, J.L.S.P.; visualization, J.L.S.P. and D.F.; supervision, J.L.S.P. and D.F.; project administration, J.L.S.P. and D.F.; funding acquisition, J.L.S.P. and D.F. All authors have read and agreed to the published version of the manuscript.
Funding
This research was funded by National Funds by FCT—Portuguese Foundation for Science and Technology, under the projects UIDB/04033/2020 (CITAB) and UID/AGR/04129/2020 (LEAF), and project Cleanslurry PTDC/ASP-SOL/28769/2017 (FCT).
Institutional Review Board Statement
Not applicable.
Informed Consent Statement
Not applicable.
Data Availability Statement
Not applicable.
Conflicts of Interest
The authors declare no conflict of interest.
References
- Lopez-Ridaura, S.; van der Werf, H.M.G.; Paillat, J.M.; Le Bris, B. Environmental evaluation of transfer and treatment of excess pig slurry by life cycle assessment. J. Environ. Manag. 2009, 90, 1296–1304. [Google Scholar] [CrossRef] [PubMed]
- Halberg, N.; van der Werf, H.M.G.; Basset-Mens, C.; Dalgaard, R.; de Boer, I.J.M. Environmental assessment tools for the evaluation and improvement of European livestock production systems. Livest. Prod. Sci. 2005, 90, 33–50. [Google Scholar] [CrossRef] [Green Version]
- Scarlat, N.; Fahl, F.; Dallemand, J.-F.; Monforti, F.; Motola, V. A spatial analysis of biogas potential from manure in Europe. Renew. Sustain. Energy Rev. 2018, 94, 915–930. [Google Scholar] [CrossRef]
- FAO. World Reference Base for Soil Resources: A Framework for International Classification, Correlation and Communication; World Soil Resources Reports 103; Food and Agriculture Organization of the United Nations: Rome, Italy, 2006. [Google Scholar]
- Wei, X.M.; Chen, B.; Qu, Y.H.; Lin, C.; Chen, G.Q. Emergy analysis for ‘four in one’ peach production system in Beijing. Commun. Nonlinear Sci. Numer. Simul. 2009, 14, 946–958. [Google Scholar] [CrossRef]
- Cederberg, C. Life cycle assessment of animal products. In Environmentally-Friendly Food Processing; Mattsson, B., Sonesson, U., Eds.; Woodhead Publishing: Cambridge, UK, 2003. [Google Scholar]
- Fangueiro, D.; Senbayram, M.; Trindade, H.; Chadwick, D. Cattle slurry treatment by screw-press separation and chemically enhanced settling: Effect on greenhouse gas emissions after land spreading and grass yield. Bioresour. Technol. 2008, 99, 7132–7142. [Google Scholar] [CrossRef]
- Ceotto, E.; Spallacci, P. Pig slurry applications to alfalfa: Productivity, solar radiation utilization, N and P removal. Field Crops Res. 2006, 95, 135–155. [Google Scholar] [CrossRef]
- Jackson, D.R.; Smith, K.A. Animal manure slurries as a source of nitrogen for cereals: Effect of application time on efficiency. Soil Use Manag. 1997, 13, 75–81. [Google Scholar] [CrossRef]
- Rotz, C.A.; Taub, F.; Russell, M.P.; Oenema, J.; Sanderson, M.A.; Wachendorf, M. Whole-farm perspectives of nutrient flows in grassland agriculture. Crop Sci. 2004, 45, 2139–2159. [Google Scholar] [CrossRef]
- Sieling, K.; Ghunter-Borstel, O.; Hanus, H. Effect of slurry application and mineral nitrogen fertilization on N leaching in different crop combinations. J. Agric. Sci. 1997, 128, 79–86. [Google Scholar] [CrossRef]
- Cushman, K.E.; Snyder, R.G. Swine effluent compared to inorganic fertilizers for tomato production. J. Plant Nutr. 2002, 25, 809–820. [Google Scholar] [CrossRef]
- Bernal, M.P.; Roig, A. The influence of pig slurry fertilization on the mineral content of horticultural crops grown in calcareous soils. J. Sci. Food Agric. 1993, 62, 129–135. [Google Scholar] [CrossRef]
- Moral, R.; Moreno-Caselles, J.; Perez-Murcia, M.D.; Perez-Espinosa, A.; Paredes, C.; Bustamante, M.A. Fertilizing capacity of fresh and composted solid fraction of swine manure on Brassica oleracea var. capitata. In Proceedings of the 14th International Symposium on Fertilizers (CIEC), Debrecen, Hungary, 22–25 June 2003. [Google Scholar]
- Reganold, J.P.; Glover, P.K.; Andrews, P.K.; Hinman, H.R. Sustainability of three apple production systems. Nature 2001, 410, 926–929. [Google Scholar] [CrossRef]
- Cordell, D.; Drangert, J.O.; White, S. The story of phosphorus: Global food security and food for thought. Glob. Environ. Chang. 2009, 19, 292–305. [Google Scholar] [CrossRef]
- Unc, A.; Goss, M. Transport of bacteria from manure and protection of water resources. Appl. Soil Ecol. 2004, 25, 1–18. [Google Scholar] [CrossRef]
- Pell, A.N. Manure and microbes: Public and animal health problem? J. Dairy Sci. 1997, 80, 2673–2681. [Google Scholar] [CrossRef]
- Nicholson, F.A.; Groves, S.J.; Chambers, B.J. Pathogen survival during livestock manure storage and following land application. Bioresour. Technol. 2005, 96, 135–143. [Google Scholar] [CrossRef]
- Bolton, D.J.; Ivory, C.; McDowell, D.A. The effect of urea and ammonia treatments on the survival of Salmonella spp. and Yersinia enterocolitica in pig slurry. J. Appl. Microbiol. 2012, 114, 134–140. [Google Scholar] [CrossRef]
- Park, J.I.; Yun, Y.; Park, J.M. Long term operation of slurry bioreactor for decomposition of food wastes. Bioresour. Technol. 2002, 84, 101–104. [Google Scholar] [CrossRef]
- Guan, T.Y.; Holley, R.A. Pathogen survival in swine manure environments and transmission of human enteric illness-a review. J. Environ. Qual. 2003, 32, 383–392. [Google Scholar] [CrossRef]
- Strauch, D.; Ballarini, G. Hygienic aspects of the production and agricultural use of animal wastes. J. Vet. Med. 1994, 41, 176–228. [Google Scholar] [CrossRef]
- Ottoson, J.; Nordin, A.; von Rosen, D.; Vinneras, B. Salmonella reduction in manure by addition of urea and ammonia. Bioresour. Technol. 2008, 99, 1610–1615. [Google Scholar] [CrossRef]
- Park, G.W.; Diez-Gonzalez, F. Utilization of carbonate and ammonia-based treatments to eliminate Escherichia coli O157:H7 and Salmonella typhimurium T104 from cattle manure. J. Appl. Microbiol. 2003, 94, 675–685. [Google Scholar] [CrossRef] [Green Version]
- Vinneras, B.; Holmqvist, A.; Bagge, E.; Albihn, A.; Jonsson, H. The potential for disinfection of separated faecal matter by urea and by peracetic acid for hygienic nutrient recycling. Bioresour. Technol. 2003, 89, 155–161. [Google Scholar] [CrossRef]
- Gibbs, R.; Hu, C.; Ho, G.; Unkovich, I. Regrowth of faecal coliforms and Salmonella in stored biosolids and soil amended with biosolids. Water Sci. Technol. 1997, 35, 269–275. [Google Scholar] [CrossRef]
- Fangueiro, D.; Surgy, S.; Coutinho, J.; Vasconcelos, E. Impact of cattle slurry acidification on carbon and nitrogen dynamics during storage and after soil incorporation. J. Plant. Nutr. Soil Sci. 2013, 176, 540–550. [Google Scholar] [CrossRef]
- Fangueiro, D.; Ribeiro, H.; Coutinho, J.; Cardenas, L.; Trindade, H.; Cunha-Queda, C.; Vasconcelos, E.; Cabral, F. Nitrogen mineralization and CO2 and N2O emissions in a sandy soil amended with original or acidified pig slurries or with the relative fractions. Biol. Fertil. Soils 2010, 46, 383–391. [Google Scholar] [CrossRef]
- Rodrigues, J.; Alvarenga, P.; Silva, A.C.; Brito, L.; Tavares, J.; Fangueiro, D. Animal Slurry Sanitization through pH Adjustment: Process Optimization and Impact on Slurry Characteristics. Agronomy 2021, 11, 517. [Google Scholar] [CrossRef]
- Pereira, J.L.S.; Perdigão, A.; Marques, F.; Coelho, C.; Mota, M.; Fangueiro, D. Evaluation of Tomato-Based Packing Material for Retention of Ammonia, Nitrous Oxide, Carbon Dioxide and Methane in Gas Phase Biofilters: A Laboratory Study. Agronomy 2021, 11, 360. [Google Scholar] [CrossRef]
- Fangueiro, D.; Hjorth, M.; Gioelli, F. Acidification of animal slurry—A review. J. Environ. Manag. 2015, 149, 46–56. [Google Scholar] [CrossRef] [PubMed]
- Regueiro, I.; Coutinho, J.; Gioelli, F.; Balsari, P.; Dinuccio, E.; Fangueiro, D. Acidification of raw and co-digested pig slurries with alum before mechanical separation reduces gaseous emission during storage of solid and liquid fractions. Agric. Ecosyst. Environ. 2016, 227, 42–51. [Google Scholar] [CrossRef]
- Fangueiro, D.; Surgy, S.; Napier, V.; Menaia, J.; Vasconcelos, E.; Coutinho, J. Impact of Slurry Management Strategies on Potential Leaching of Nutrients and Pathogens in a Sandy Soil Amended with Cattle Slurry. J. Environ. Manag. 2014, 146, 198–205. [Google Scholar] [CrossRef] [PubMed]
- Soares, A.S.; Miranda, C.; Teixeira, C.A.; Coutinho, J.; Trindade, H.; Coelho, A.C. Impact of different treatments on Escherichia coli during storage of cattle slurry. J. Environ. Manag. 2019, 236, 323–327. [Google Scholar] [CrossRef] [PubMed]
- Liu, T.; Dong, H.; Zhu, Z.; Shang, B.; Yin, F.; Zhang, W.; Zhou, T. Effects of biofilter media depth and moisture content on removal of gases from a swine barn. J. Air Waste Manag. Assoc. 2017, 67, 1288–1297. [Google Scholar] [CrossRef] [PubMed]
- Melse, R.W.; Hol, J.M. Biofiltration of exhaust air from animal houses: Evaluation of removal efficiencies and practical experiences with biobeds at three field sites. Biosyst. Eng. 2017, 159, 59–69. [Google Scholar] [CrossRef]
- Melse, R.W.; Hol, J.M.G.; Nijeboer, G.M.; van Hattum, T.G. Measurements on a Biofilter for Treatment of Exhaust Air from a Fattening Pig House (in Dutch); Livestock Research; Report 802; Wageningen UR: Wageningen, The Netherlands, 2014. [Google Scholar]
- Martinec, M.; Hartung, E.; Jungbluth, T.; Schneider, F.; Wieser, P. Reduction of Gas, Odor and Dust Emissions from Swine Operations with Biofilters. In Proceedings of the 2001 ASAE Annual International Meeting Sponsored by ASAE, Sacramento, CA, USA, 29 July–1 August 2001. [Google Scholar]
- Hartung, E.; Jungbluth, T.; Bascher, W. Reduction of Ammonia and Odor Emissions from a Piggery with Biofilters. Trans. ASAE 2001, 44, 113–118. [Google Scholar] [CrossRef]
- Melse, R.W.; Van Der Werf, A.W. Biofiltration for Mitigation of Methane Emission from Animal Husbandry. Environ. Sci. Technol. 2005, 39, 5460–5468. [Google Scholar] [CrossRef]
- Hanson, R.S.; Hanson, T.E. Methanotrophic bacteria. Microbiol. Rev. 1996, 60, 439–471. [Google Scholar] [CrossRef]
Figure 1.
Schematic view of the laboratory system developed by Pereira et al. [31] and used in this study.
Figure 1.
Schematic view of the laboratory system developed by Pereira et al. [31] and used in this study.


Table 1.
Physicochemical characteristics of the packing materials and pig slurry used in the experiment (mean ± standard deviation) (n = 3).
Table 1.
Physicochemical characteristics of the packing materials and pig slurry used in the experiment (mean ± standard deviation) (n = 3).
| Wastes | pH | DM | TC | TN | NH4+ | NO3− | C/N | BD | PO |
|---|---|---|---|---|---|---|---|---|---|
| Tomato waste | 5.7 ± 0.1 c | 842.2 ± 3.8 b | 779.8 ± 1.7 a | 39.6 ± 5.4 b | 14.9 ± 0.7 b | 7.3 ± 0.6 | 19.9 ± 2.7 b | 90.6 ± 0.1 c | 87.4 ± 0.1 b |
| Rice husk | 7.0 ± 0.1 b | 895.6 ± 7.7 a | 843.4 ± 0.5 a | 3.3 ± 0.4 c | 0.2 ± 0.1 c | 4.3 ± 3.4 | 257.4 ± 31.9 a | 149.3 ± 0.1 b | 44.4 ± 3.2 a |
| Tomato + rice husk (biofilters) | 7.1 ± 0.1 b | 500.0 ± 0.1 c | 774.4 ± 6.0 a | 29.8 ± 5.0 b | 26.7 ± 2.9 b | 6.4 ± 0.8 | 26.4 ± 4.5 b | 105.3 ± 0.1 c | 88.0 ± 6.8 b |
| Pig slurry (raw slurry) | 8.3 ± 0.1 a | 22.2 ± 0.3 d | 493.3 ± 31.8 b | 59.4 ± 1.0 a | 25,082.6 ± 4757.5 a | 5.8 ± 0.5 | 8.3 ± 0.6 b | 1000.0 ± 0.1 a | nd |
Note: n = 3 (three replications per treatment), pH: pH (H2O), DM: dry matter (g kg−1), TC: total C (g C kg−1 DM), TN: total N (g N kg−1 DM), NH4+: NH4+-N (mg N kg−1 DM), NO3−: NO3−-N (mg N kg−1 DM), C/N: C:N ratio, BD: bulk density (kg m−3), PO: porosity (%), nd: not determined. Values presented with different lowercase letters within columns are significantly different (p < 0.05) by Tukey test.
Table 2.
Physicochemical characteristics of each slurry treatment at the beginning of the experiment (mean ± standard deviation) (n = 3).
Table 2.
Physicochemical characteristics of each slurry treatment at the beginning of the experiment (mean ± standard deviation) (n = 3).
| Treatments (Slurries) | pH | DM | TC | TN | NH4+ | NO3− | C/N | BOD |
|---|---|---|---|---|---|---|---|---|
| Raw slurry | 8.3 ± 0.1 b | 22.2 ± 0.3 a | 493.3 ± 31.8 | 59.4 ± 1.0 a | 25.1 ± 4.8 | 5.8 ± 0.5 | 8.3 ± 0.6 | 1535.0 ± 2.5 a |
| Acidified slurry | 5.0 ± 0.1 d | 23.8 ± 0.3 a | 473.9 ± 2.8 | 46.9 ± 3.0 b | 21.4 ± 3.6 | 4.2 ± 0.5 | 10.2 ± 0.5 | 26.7 ± 2.9 d |
| Alkalinized slurry | 9.5 ± 0.1 a | 21.6 ± 0.5 b | 442.1 ± 18.8 | 52.3 ± 0.9 ab | 24.5 ± 3.4 | 6.0 ± 0.7 | 8.4 ± 0.5 | 155.0 ± 17.5 c |
| Neutralized slurry | 7.5 ± 0.2 c | 23.3 ± 0.7 a | 440.0 ± 39.8 | 52.1 ± 1.1 ab | 23.5 ± 1.3 | 5.2 ± 0.5 | 8.4 ± 0.6 | 1040.0 ± 13.3 b |
Note: n = 3 (three replications per treatment), pH: pH (H2O), DM: dry matter (g kg−1), TC: total C (g C kg−1 DM), TN: total N (g N kg−1 DM), NH4+: NH4+-N (g N kg−1 DM), NO3−: NO3−-N (mg N kg−1 DM), C/N: C:N ratio, Biological oxygen demand: BOD (mg O2 L−1). Values presented with different lowercase letters within columns are significantly different (p < 0.05) by Tukey test.
Table 3.
Physicochemical characteristics of the biofilter of each treatment at the end of the experiment (mean ± standard deviation) (n = 3).
Table 3.
Physicochemical characteristics of the biofilter of each treatment at the end of the experiment (mean ± standard deviation) (n = 3).
| Treatments (Biofilters) | pH | DM | TC | TN | NH4+ | NO3− | C/N |
|---|---|---|---|---|---|---|---|
| Raw slurry | 8.1 ± 1.0 | 286.2 ± 35.0 | 460.1 ± 13.2 | 37.4 ± 0.9 a | 92.1 ± 0.5 a | 5.6 ± 0.5 | 12.3 ± 0.5 b |
| Acidified slurry | 7.4 ± 1.6 | 363.9 ± 30.5 | 476.7 ± 16.4 | 29.6 ± 3.7 b | 40.3 ± 6.5 b | 5.1 ± 0.5 | 16.3 ± 1.1 a |
| Alkalinized slurry | 7.0 ± 0.4 | 349.0 ± 39.1 | 469.9 ± 5.7 | 32.0 ± 1.9 ab | 62.4 ± 7.6 ab | 4.6 ± 0.5 | 14.7 ± 0.5 ab |
| Neutralized slurry | 7.7 ± 0.9 | 298.5 ± 38.8 | 462.3 ± 2.7 | 34.5 ± 1.0 ab | 72.9 ± 5.1 ab | 5.2 ± 0.5 | 13.4 ± 0.5 ab |
Note: n = 3 (three replications per treatment), pH: pH (H2O), DM: dry matter (g kg−1), TC: total C (g C kg−1 DM), TN: total N (g N kg−1 DM), NH4+: NH4+-N (mg N kg−1 DM), NO3−: NO3−-N (mg N kg−1 DM), C/N: C:N ratio. Values presented with different lowercase letters within columns are significantly different (p < 0.05) by Tukey test.
Table 4.
Average gas concentrations in the biofilter outlet air of each treatment (mean ± standard deviation) (n = 3).
Table 4.
Average gas concentrations in the biofilter outlet air of each treatment (mean ± standard deviation) (n = 3).
| Treatments (Biofilters) | Days of Experiment | ||||||||
|---|---|---|---|---|---|---|---|---|---|
| 1–2 | 3–5 | 6–10 | 11–15 | 16–20 | 21–25 | 26–30 | 31–35 | 0–35 | |
| NH3 concentrations (mg m−3) | |||||||||
| Raw slurry | 5.8 ± 0.4 b | 8.8 ± 1.3 b | 8.4 ± 1.1 a | 6.4 ± 0.8 a | 7.5 ± 1.2 a | 11.2 ± 1.6 a | 7.0 ± 0.5 | 3.9 ± 0.2 | 7.4 ± 0.8 b |
| Acidified slurry | 3.9 ± 0.5 c | 3.8 ± 0.7 c | 3.4 ± 0.7 c | 2.9 ± 0.6 b | 3.3 ± 0.6 b | 5.6 ± 0.4 b | 4.3 ± 0.5 | 3.0 ± 0.4 | 3.8 ± 0.5 c |
| Alkalinized slurry | 45.7 ± 4.5 a | 20.8 ± 1.5 a | 2.6 ± 0.5 c | 1.7 ± 0.1 c | 2.2 ± 0.2 c | 6.2 ± 1.2 b | 4.4 ± 0.6 | 2.7 ± 0.2 | 10.8 ± 1.0 a |
| Neutralized slurry | 7.5 ± 1.4 b | 6.3 ± 0.7 b | 4.2 ± 0.1 b | 3.6 ± 0.4 b | 4.7 ± 0.2 b | 8.9 ± 0.6 b | 6.9 ± 0.8 | 4.4 ± 0.3 | 5.8 ± 0.1 b |
| N2O concentrations (µg m−3) | |||||||||
| Raw slurry | 535.8 ± 3.7 | 533.2 ± 0.8 | 479.2 ± 0.7 | 527.3 ± 2.0 | 484.5 ± 7.1 | 429.8 ± 10.4 | 508.2 ± 4.5 | 536.3 ± 5.0 | 504.3 ± 3.3 |
| Acidified slurry | 558.4 ± 2.5 | 551.3 ± 3.2 | 484.7 ± 1.4 | 528.1 ± 1.1 | 496.6 ± 7.4 | 449.4 ± 7.4 | 520.9 ± 2.5 | 543.9 ± 2.0 | 516.7 ± 2.9 |
| Alkalinized slurry | 551.5 ± 11.5 | 546.0 ± 4.8 | 480.2 ± 0.5 | 528.1 ± 1.4 | 486.0 ± 7.9 | 431.1 ± 3.3 | 507.0 ± 1.5 | 533.7 ± 2.0 | 508.0 ± 0.6 |
| Neutralized slurry | 534.7 ± 2.9 | 531.3 ± 3.1 | 479.1 ± 0.5 | 529.1 ± 0.7 | 495.5 ± 6.6 | 439.4 ± 9.3 | 514.6 ± 1.7 | 537.9 ± 0.9 | 507.7 ± 1.7 |
| CO2 concentrations (mg m−3) | |||||||||
| Raw slurry | 973.3 ± 12.6 b | 907.6 ± 13.6 a | 906.7 ± 13.4 a | 931.5 ± 26.9 | 1111.4 ± 64.3 | 1288.3 ± 72.9 | 1058.7 ± 66.5 | 973.4 ± 58.4 | 1018.9 ± 40.7 |
| Acidified slurry | 1158.1 ± 49.3 a | 814.8 ± 1.3 b | 848.8 ± 0.5 b | 937.6 ± 11.6 | 1100.0 ± 29.7 | 1178.5 ± 73.4 | 961.9 ± 32.6 | 900.0 ± 25.0 | 987.4 ± 16.9 |
| Alkalinized slurry | 842.5 ± 2.1 b | 811.2 ± 6.0 b | 845.6 ± 3.0 b | 882.7 ± 20.6 | 1062.4 ± 62.0 | 1304.0 ± 84.0 | 1095.8 ± 13.4 | 984.3 ± 10.3 | 978.6 ± 16.8 |
| Neutralized slurry | 1139.8 ± 33.7 a | 883.0 ± 7.8 a | 885.6 ± 2.2 b | 889.6 ± 1.9 | 994.7 ± 19.5 | 1161.1 ± 58.4 | 1005.0 ± 18.3 | 920.7 ± 14.4 | 984.9 ± 5.6 |
| CH4 concentrations (µg m−3) | |||||||||
| Raw slurry | 173.6 ± 52.5 a | 191.6 ± 20.4 a | 7.0 ± 2.4 | 1.3 ± 0.9 | 7.8 ± 3.9 | 158.8 ± 26.2 a | 8.2 ± 1.6 | 3.6 ± 2.0 | 69.0 ± 6.3 a |
| Acidified slurry | 60.4 ± 52.3 b | 161.7 ± 16.4 a | 0.7 ± 0.9 | 0.9 ± 0.9 | 3.7 ± 1.6 | 72.1 ± 12.7 b | 3.3 ± 1.5 | 0.9 ± 0.9 | 37.7 ± 2.6 b |
| Alkalinized slurry | 59.2 ± 15.8 b | 122.9 ± 10.6 a | 3.2 ± 1.2 | 0.9 ± 0.9 | 0.9 ± 0.9 | 108.5 ± 16.4 b | 2.9 ± 2.5 | 0.9 ± 0.9 | 37.2 ± 2.9 b |
| Neutralized slurry | 0.9 ± 0.9 b | 44.7 ± 16.5 b | 2.6 ± 0.9 | 0.9 ± 0.9 | 0.9 ± 0.9 | 147.6 ± 13.5 a | 0.9 ± 0.9 | 0.9 ± 0.9 | 24.4 ± 3.9 b |
Note: n = 3 (three replications per treatment). For each gas, values presented with different lowercase letters within columns are significantly different (p < 0.05) by Tukey test.
Table 5.
Gas elimination efficiency and pollutant elimination capacity in the biofilter outlet air of each treatment (mean ± standard deviation) (n = 3).
Table 5.
Gas elimination efficiency and pollutant elimination capacity in the biofilter outlet air of each treatment (mean ± standard deviation) (n = 3).
| Treatments (Biofilters) | Gas Elimination Efficiency (EE) (%) | Pollutant Elimination Capacity (EC) (µg m−3 s−1) | |||||||
|---|---|---|---|---|---|---|---|---|---|
| NH3 | N2O | CO2 | CH4 | NH3 | N2O | CO2 | CH4 | GWP | |
| Raw slurry | 0.01 ± 0.01 c | 0.01 ± 0.01 | 0.01 ± 0.01 b | 0.01 ± 0.01 b | 0.01 ± 0.01 c | 0.01 ± 0.01 | 0.01 ± 0.01 b | 0.01 ± 0.01 b | 0.01 ± 0.01 b |
| Acidified slurry | ↓42.74 ± 12.87 a | ↑2.41 ± 1.16 | ↓3.55 ± 5.37 a | ↓74.45 ± 0.24 a | ↓168.89 ± 63.41 a | ↑0.52 ± 0.25 | ↓2154.65 ± 2910.84 a | ↓1.13 ± 0.12 a | ↓2049.52 ± 2847.93 a |
| Alkalinized slurry | ↑4.61 ± 0.89 c | ↑0.48 ± 0.76 | ↓2.78 ± 2.70 a | ↓78.46 ± 1.98 a | ↓10.07 ± 14.17 c | ↑0.10 ± 0.16 | ↓1362.01 ± 1447.63 a | ↓1.05 ± 0.05 a | ↓1363.82 ± 1406.19 a |
| Neutralized slurry | ↓18.54 ± 4.75 b | ↑0.95 ± 0.59 | ↓4.15 ± 3.29 a | ↓83.29 ± 4.75 a | ↓82.04 ± 32.13 b | ↑0.20 ± 0.13 | ↓2397.28 ± 1756.46 a | ↓1.28 ± 0.29 a | ↓2382.39 ± 1737.65 a |
Note: n = 3 (three replications per treatment), (↓): reduction of gas emission in comparison to raw slurry, (↑): increase of gas emission in comparison to raw slurry. Values presented with different lowercase letters within columns are significantly different (p < 0.05) by Tukey test. GWP: global warming potential as CO2-equivalents and expressed in µg (CO2-equivalents) m−3 s−1 = 0.01 × [NH3] + 265 × [N2O] + 1 × [CO2] + 28 × [CH4].
Publisher’s Note: MDPI stays neutral with regard to jurisdictional claims in published maps and institutional affiliations. |
© 2022 by the authors. Licensee MDPI, Basel, Switzerland. This article is an open access article distributed under the terms and conditions of the Creative Commons Attribution (CC BY) license (https://creativecommons.org/licenses/by/4.0/).
Share and Cite
MDPI and ACS Style
Pereira, J.L.S.; Perdigão, A.; Fangueiro, D. Evaluation of a Tomato Waste Biofilter for the Retention of Gaseous Losses from Pig Slurry Hygienization by pH Modification. Agronomy 2022, 12, 1838. https://doi.org/10.3390/agronomy12081838
AMA Style
Pereira JLS, Perdigão A, Fangueiro D. Evaluation of a Tomato Waste Biofilter for the Retention of Gaseous Losses from Pig Slurry Hygienization by pH Modification. Agronomy. 2022; 12(8):1838. https://doi.org/10.3390/agronomy12081838
Chicago/Turabian StylePereira, José L. S., Adelaide Perdigão, and David Fangueiro. 2022. "Evaluation of a Tomato Waste Biofilter for the Retention of Gaseous Losses from Pig Slurry Hygienization by pH Modification" Agronomy 12, no. 8: 1838. https://doi.org/10.3390/agronomy12081838
Note that from the first issue of 2016, this journal uses article numbers instead of page numbers. See further details here.