Article

Industrial Hemp Clone Selection Method under LED Smart Farm Condition Based on CBD Production per Cubic Meter

1
Department of Bio-Health Convergence, Kangwon National University, Chuncheon 24341, Korea
2
Department of Research and Development, Chuncheon Bioindustry Foundation, Chuncheon 24232, Korea
3
Physiology and Sugar Chemistry Division, Bangladesh Sugarcrop Research Institute, Ishurdi, Pabna 6620, Bangladesh
*
Authors to whom correspondence should be addressed.
Agronomy 2022, 12(8), 1809; https://doi.org/10.3390/agronomy12081809
Submission received: 21 June 2022 / Revised: 13 July 2022 / Accepted: 27 July 2022 / Published: 30 July 2022
(This article belongs to the Topic Plants Nutrients)

Abstract

:
Cannabis breeders are combining several genes to develop economically valuable fiber, seed, and medicinal hemp. This study analyzed the characteristics and selection of traits based on cannabidiol production of medicinal cannabis lines successfully grown under artificial light and nutrient solution cultivation conditions in smart farm conditions. Sixteen female plants were selected by seeding medical hemp F1 hybrid specimens obtained by randomly crossing Cherry Wine and native hemp from each country. The F1 generation was treated with 12 h light to induce flower differentiation. CBD production peaked on day 50 of the treatment, and this was selected as the harvesting day. All F1 hybrids were separated by leaf and inflorescence after collecting morphological data, and fresh and dry weights were measured. The CBD production of leaf and inflorescence per cubic meter was calculated. The CW21-5 line produced a total of 53.002 ± 0.228 g of CBD per cubic meter, the highest CBD producer. In addition, heatmap correlation analysis showed that most morphological data were not related to cannabinoid content. Principal Component Analysis (PCA) and Self-Organizing Map (SOM) analysis showed that CW21-5 is an arbitrary line that does not cluster with other lines, and the reason for its excellent CBD yield per cubic meter is that it has a narrow plant diameter and a high CBD content at the same time.

1. Introduction

Cannabis sativa L. (2n = 20), called hemp or cannabis, has an upright stem and is 1–6 m high, depending on the phenotype and chemical type. The roots are from 30–60 cm to about 2.5 m deep, and the lateral root is well developed. The leaves are palmate and the number of leaflets varies. The leaf surface is covered with white to yellowish-brown resinous glands. The flowers are divided into staminate (male) or pistillate (female) [1]. The plants can be hermaphroditic or dioecious, depending on genetic factors or the environment in which they are grown.
The hemp plant contains more than 500 secondary metabolites such as polyketides, terpenoids, polyphenolics, alkaloids, flavonoids, stilbenoids, quinones, and terpenophenolics [2]. Cannabinoids (terpenophenolic C21 or the neutral C22 form) are only observed in C. sativa [3].
To date, more than 100 types of cannabinoids, one of the most prominent components of hemp, have been identified. Additionally, neutral cannabinoids (Δ9-tetrahydrocannabinol (Δ9-THC) and cannabidiol (CBD)) are activated from acidic cannabinoids (Δ9-tetrahydrocannabinolic acid (Δ9-THCA) and cannabidiolic acid (CBDA)) through the decarboxylation process [4]. Δ9-THC is a major psychotropic cannabinoid, causing transient psychotic and anxiety symptoms [5] and mental illness, even in adults without major psychosis [6]. From 1995 to 2015, the THC content of hemp for psychoactive purposes increased by 212%, and concentrated THC products resembling regular products, such as chocolate and jelly, have been produced. This has resulted in a significant increase in accidental exposure and overdose in children [7]. Δ9-THC is also used for medicinal purposes, depending on its purpose, but in this study, the purpose was to produce CBD. Conversely, CBD has positive effects on schizophrenia [8], reduces the incidence of seizures in epilepsy [9], improves sleep in patients with Parkinson’s disease [10], reduces anxiety, and has antipsychotic and neuroprotective effects such as improving cognitive processes [11].
Biosynthesis of cannabinoids begins with the prenylation of olivetolic acid (OA) to produce cannabigerolic acid (CBGA). CBGA is then converted to different cannabinoid carboxylic acid forms. Tetrahydrocannabinoic acid (THCA) is converted to cannabidiolic acid (CBDA) by THCA synthase, and cannabichromenic acid (CBCA) by CBDA synthase and CBCA synthase [12,13]. In addition, acidic cannabinoids decompose into a neutral form through heat, and also, the additional decomposition reaction of metabolites is caused by exposure to light, UV-B irradiation, oxidizing agents, and high temperatures. It is known that 95% of cannabinoids in undried hemp are in an acidic precursor state [14].
Analyzing the cannabinoid profile of plants over time showed that the concentration of cannabinoids increased when the flowering period was reached [15]. Changes in these concentrations are dependent on moisture [16], geographical location [17], mineral quality [18], UV-B [19], temperature and humidity, fertilization status, breeding method [20], and variety. In addition, CBC and CBG gradually decreased from seedling state to harvest, and the THC content gradually increased from germination to flowering. To maximize the Δ9-THC yields, crops should be harvested during the flowering period. The relatively high ratio of CBC and CBG to THC was maintained for approximately 146 h in the seedling state and up to 29 days in the vegetative state [15].
Cannabinoids are secondary metabolites synthesized and stored in trichomes mainly found in female flowers [21]. Trichomes are divided into six types, i.e., unicellular non-glandular trichomes, cytolytic trichomes, capitate-stalked trichomes, capitate sessile trichomes, simple bulbous trichomes, and complex bulbous trichomes [22]. However, they are generally called capitate-sessile, capitate-stalked, and bulbous types. Usually, the stalked type trichome is dominant along the leaf veins, and the sessile type is dominant in the non-vein parts [23]. The stalk type has more cannabinoids and terpenes than the sessile type [24].
Cannabinoid biosynthesis in trichomes follows the same initial pathway (Figure 1) [14]. Hexanoic acid is produced through the oxidative cleavage of fatty acids in the cytoplasm, and geranyl diphosphate (GPP), which converts olivetolic acid to cannabigerolic acid (CBGA), is derived from the MEP pathway in chloroplasts [12]. The produced CBGA produces acidic precursor cannabinoids by the respective synthases (cannabidiolic acid synthase, tetrahydronnabinolic acid synthase, and cannabichromenic acid synthase) [25]. The biosynthesis of these cannabinoids involves movement between the cytosol, plasmid, and apoplast, but the migration method of the precursors has not yet been identified [26].
The ‘Cherry Wine’ variety used in this experiment is a hybrid of The Wife × Charlotte’s Cherries and is a CBD-only variety with a total THC content of less than 0.3% [27]. Initially, wild cannabis provided beneficial seeds, fibers, and drugs for humans. Cannabis breeders combine several genes to develop economically valuable fiber, seed, and medicinal hemp [28].
Cannabis is dioecious, with separate male and female plants. However, crossbreeding also produces hermaphroditic lines with male and female flowers on the same plant [29]. Due to the cross-fertilization requirements and its high heterozygosity, it takes a long time to breed [25]. However, CBDA synthase has a higher affinity for the precursor molecule CBGA than THCA synthetase, and more CBGA substrate is converted to CBDA than THCA [28]. Therefore, the potential for medicinal hemp breeding is high.
In vitro studies have shown that CBDA synthase produces CBDA and THCA at a ratio of approximately 20:1, implying that the higher the CBD content, the greater the likelihood that the THC content will exceed legally acceptable standards [30].
In general, if the THC content of an inflorescence is less than 0.2–1.0%, it is classified as hemp, and if it exceeds that, it is classified as marijuana [31,32]. Cannabis with these characteristics is listed as a schedule-1 illicit drug by the UN [33]. It can be grown under highly restricted conditions in Korea and Singapore, the only Asia-Pacific region licensed for growing cannabis for medical use in Australia, New Zealand, and Thailand [34]. Similarly, in the United States, many states still classify cannabis as an illegal drug [35]. Owing to the characteristics of cannabis, smart farms are considered suitable for the production of medicinal hemp. This is because security is periodically upgraded [36], space can be used efficiently, environmental factors can be adjusted [37], and yield predictions are more accurate [38].
Kanjilal et al. (2014) described the smart farm as an automated system that extended to the farm level, with automatic lighting, climate control, fire and smoke detection, auto-lock and release doors, humidity and moisture control, pre-set wash times, feeder control, and remote mobile connectivity. Smart farms can be controlled remotely using the Internet of Things (IoT) and smartphone technology [39,40].
This study focused on analyzing the characteristics and selection of traits involved in cannabidiol production of medicinal hemp lines that were successfully grown under artificial light and nutrient solutions.

2. Materials and Methods

2.1. Generating the F1 Population

About 1000 F1 hybrid seeds collected from open-pollinated Cherry wine variety were used to select excellent clones with high CBD and low THC under the LED smart farm and hydroponics conditions. The Pollen parent was a native hemp randomly collected from USA, UK, Latvia, Lithuania, France, India and Portugal. The F1 hybrid seeds were received from the Chuncheon Bio-Industry Foundation (Chuncheon, Korea). They were sown in media mixed with bio-soil (Heungnong Jongmyo Co., Pyeongtaek, Korea) and soil (Taeheung F&G, Bucheon, Korea) in a 2:1 ratio and light conditions of 16 h/day were used for 2 weeks. About 100 lines with strong germination force, overall vitality, and which were highly branched were selected from among the sown F1 individuals. The selected excellent lines were transferred to LED and artificial nutrient medium for cultivation adaptation tests. Of these, 60 individuals grew well in artificial cultivation conditions. All unnecessary male lines and morphologically inferior female lines were removed during LED Smart Farm cultivation. After eliminating inferior lines under smart farm cultivation conditions, 16 female individuals (named clones in CW21-1 to CW21-16) were finally selected as superior clones with desirable morphological characteristics with the mother plant.

2.2. Cultivation Conditions

The hydroponic system consisted of 75 × 75 mm growth blocks (Gordan Co., Roermond, The Netherlands). The nutrient solution was supplied every 30 min for 30 s.
The composition of the nutrient solution followed that in the previous study on the cultivation of hemp nutrient solution [41]. Nutrient solution composition is shown in Table 1 and all fertilizers used for hydroponic cultivation were products of DOFagro (Pyeongtaek, Korea). The LED (Bissol LED, Seoul, Korea) conditions were: brightness 40,076 ± 307 lux, PPFD 692.4, PFD-R 291.2, PFD-G 254.8, and PGF-B 146.5. The spectrum is shown in Figure 2. Reproductive growth was induced at 16 h/day for 60 days, and flower differentiation was induced by switching to 12 h/day (short daylight treatment) on day 60.

2.3. Sample for F1 Hybrid Selection

Samples were collected on days 21, 35, 44, and 50 of the flowering treatment (short-daylight treatment), and leaf and inflorescence parts were sampled. Samples from the top, middle, and bottom were collected and freeze-dried (ilSinBioBase Co., Dongduchoen, Korea). After drying, the sample was pulverized to a homogeneous particle size of 12 mesh using a chopper (YPT-1402; Young Polymer Tech Co., Incheon, Korea), and 0.1 g of the sample was added to 30 mL pure-grade MeOH (Daejung Chemicals and Metals Co., Ltd., Siheung, Korea). Ultrasonic extraction using JEIO TECH ultrasonicator (Daejeon, Korea) was performed at 23 ± 2 °C for 30 min. The extracted supernatant was filtered through a 0.45 μm syringe filter (Advantec, Tokyo, Japan) and transferred to HPLC vials. Components were analyzed by HPLC at a wavelength of 220 nm with an LC-20AD (Shimadzu Co., Kyoto, Japan) instrument, using internal standards (CBDA (Cerilliant, Round Rock, TX, USA) △9-THCA (Sigma-Aldrich Co., St. Louis, MO, USA), and Δ9-THC (CAYMAN, Ann Arbor, MI, USA)). HPLC conditions are shown in Table 2. The gradient conditions were as follows: 70% B initially, 70% B for 2 min, 85% B for 6 min, 70% B for 1 min, and 70% B for 3 min.
Plant height, leaf length, leaf width, branch number, stem diameter, inflorescence number, petiole color (red%), stem color (red%), and plant diameter were evaluated when samples were collected on day 50 of the flowering treatment. The redness was calculated as the ratio of the red part area to the green part area, and the CBD production per cubic meter was calculated using Equation (1).
Total   CBD   production   per   cubic   meter   ( g ) = a × b Width 2 × height
a, Total CBD concentration (ppm; μg/g).
b, dry weight of leaf or inflorescence (g).
The width and height were used in centimeter

2.4. Statistical Analysis

All data were analyzed in triplicate and expressed as the mean ± standard deviation. One-way analysis of variance (ANOVA) and Duncan’s multiple range test (DMRT) were used to confirm the significance of the differences between groups (* p < 0.05). All statistical analyses were performed using SAS software (Ver. 9.4, SAS Institute Inc., Cary, NC, USA).
Principal component analysis (PCA), heatmap, and clustering analysis were performed from normalized mean values using MetaboAnalyst 5.0 (www.metaboanalyst.ca, accessed on 3 March 2022). Hierarchical cluster analysis was conducted using the Euclidean distance algorithm.

3. Results and Discussion

3.1. Selection according to Cannabidiol Content

The terminal stems of the mother plant and 16 specimens of F1 generation hemp that had adapted to the transition from growing in soil to LED smart farming are shown in Figure 3.
The cannabinoid content depends on the time of harvest, the environment [42], and the characteristics of the variety [43]. Therefore, it is essential to analyze the content. Analysis of CBDA + CBD during the flowering treatment showed a similar cannabinoid pattern in all plants. The CBDA + CBD content of the leaves was 0.7586 ± 0.3549% on day 21, the lowest at 0.6061 ± 0.2747% on day 35 day, 0.3659 ± 0.1962% on day 44, and the highest at 1.7316 ± 0.7442% on day 50 (Figure 4A). The CBDA + CBD content of inflorescences increased to 2.6513 ± 0.6371% on day 21 and 5.0402 ± 1.6898% on day 35, then decreased to 2.2593 ± 0.9702% on day 44 and peaked at 5.4966 ± 1.5041% on day 50. Ref. [43] also reported that the highest CBD content was found 6–7 weeks after flowering, which is consistent with our results (Figure 4B).
Δ9-THCA + Δ9-THC content in the leaves had a slightly different pattern from the CBDA + CBD content. The leaf content was 0.1221 ± 0.0325% on day 21, 0.0956 ± 0.0306% on day 35, 0.0594 ± 0.0270% on day 44, and 0.0471 ± 0.0232% on day 50 (Figure 4C). The Δ9-THC(A) content of inflorescence was 0.0607 ± 0.0133% on day 21, increased to 0.1747 ± 0.0607% on day 35, decreased to 0.0583 ± 0.0185 on day 44, and increased to 0.2214 ± 0.0579% on day 50, which was similar to the CBD(A) trend of the inflorescence (Figure 4D). The lowest Δ9-THC content and the highest CBD content in the leaf were observed on day 50, and the plant harvest time was set on day 50 of the short-day length treatment.
Table 3 shows the morphological data collected prior to harvesting. The mother plant was fixed as ‘Cherry wine’ variety, but had various traits, including cannabinoid content. All petioles and the stems of most plants of the F1 line were red. The morphological data were important for further evaluation of CBD production per unit and correlation with cannabinoids.
The number of branches showed a higher number (16.25) than the ‘NB100′ variety (7.67) investigated in the previous study [44]. However, considering that the number of branches varies depending on the cultivation environment or the number of days of vegetative growth, comparison with the mother plant is preferable to comparison with other plants [45]. Lines CW21-3, 4, 5, 6, and 7 showed a higher number of branches than the mother plant grown under the same conditions, indicating that it is more advantageous in the ‘cutting and plant’ propagation of cannabis plants. In addition, the lower the plant height, the higher the space use efficiency in a multi-floor smart farm. CW21-1, 2, 3, 5, 6, 8, 10, 12, 13, 14, and 16 varieties showed lower plant height than the mother plant.
Table 4 shows the results of measuring CBD production per unit meter based on morphological data, additionally measured dried leaf and inflorescence weight, and average cannabinoid content of flowers and leaves of the whole plant.
The CW21-5 hybrid showed the highest total CBD production per cubic meter at 53.002 ± 0.228 g/m3; the second-highest yielding line was CW21-1 (38.102 ± 0.457 g/m3), and the third was CW21-4 (33.304 ± 0.444 g/m3). As a result of breeding for the F1 generation for the purpose of CBD production under artificial nutrient solution culture conditions, the CW21-5 line among the clones provided the most suitable results.

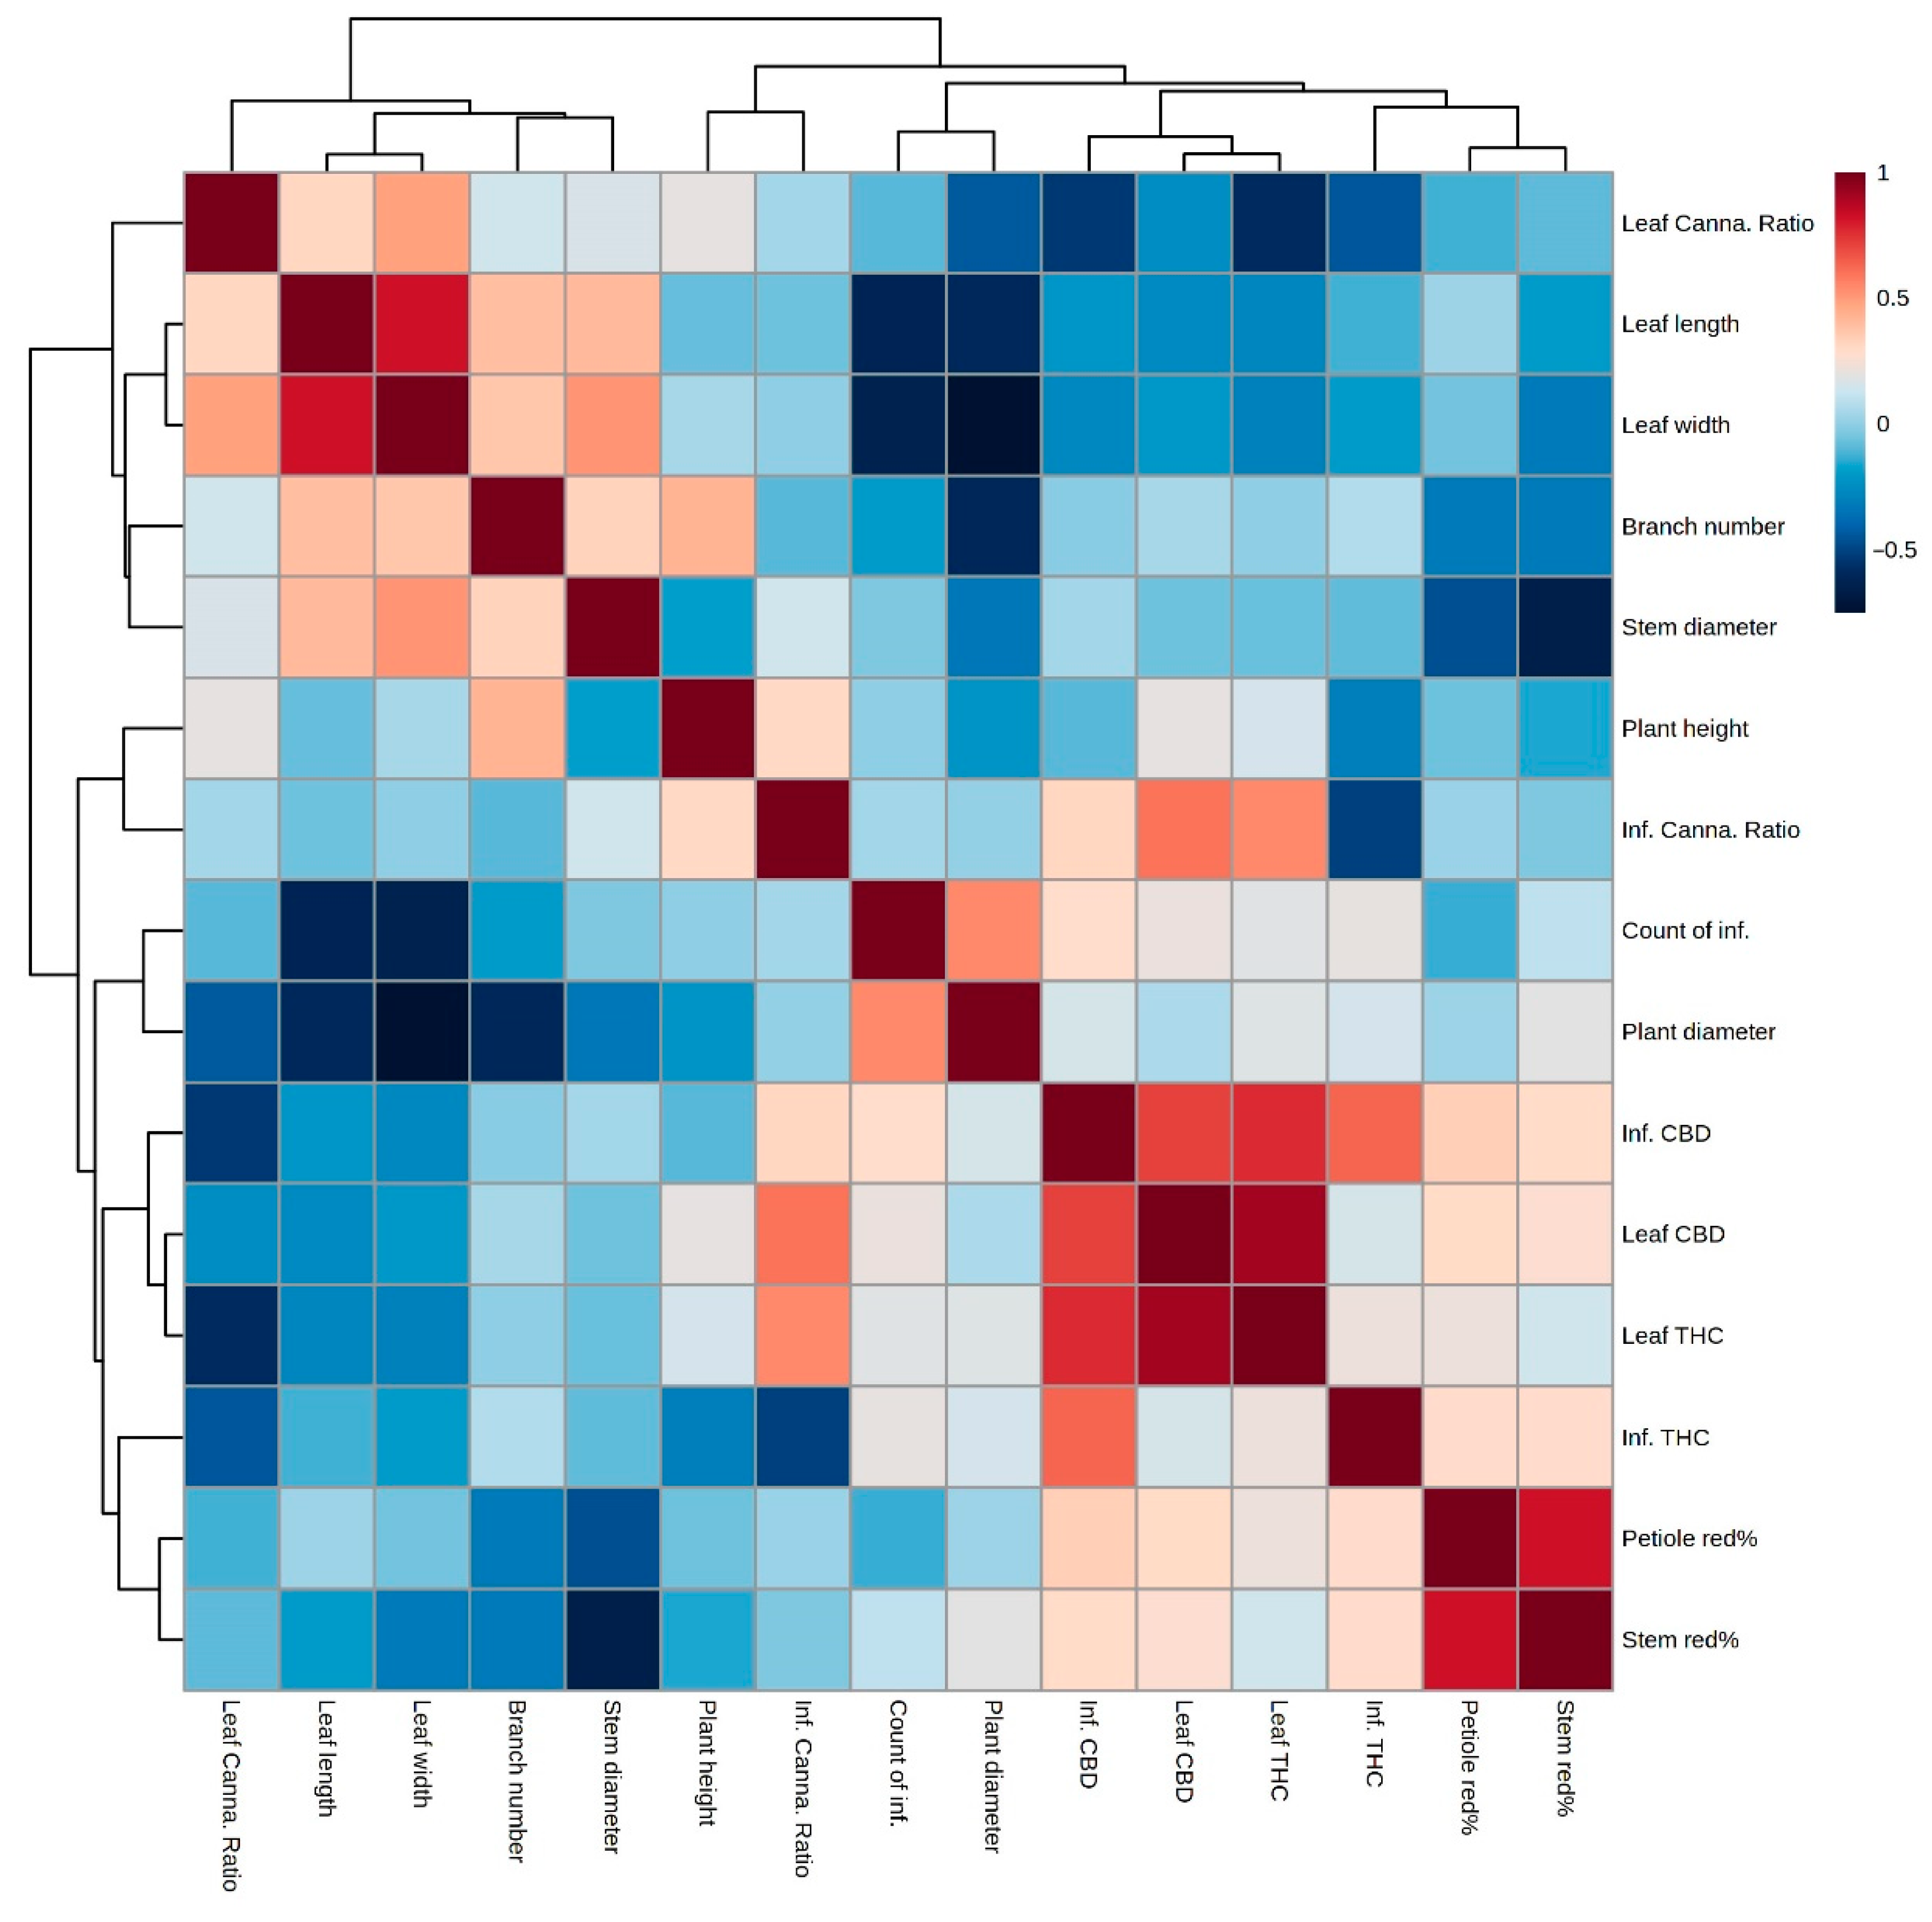
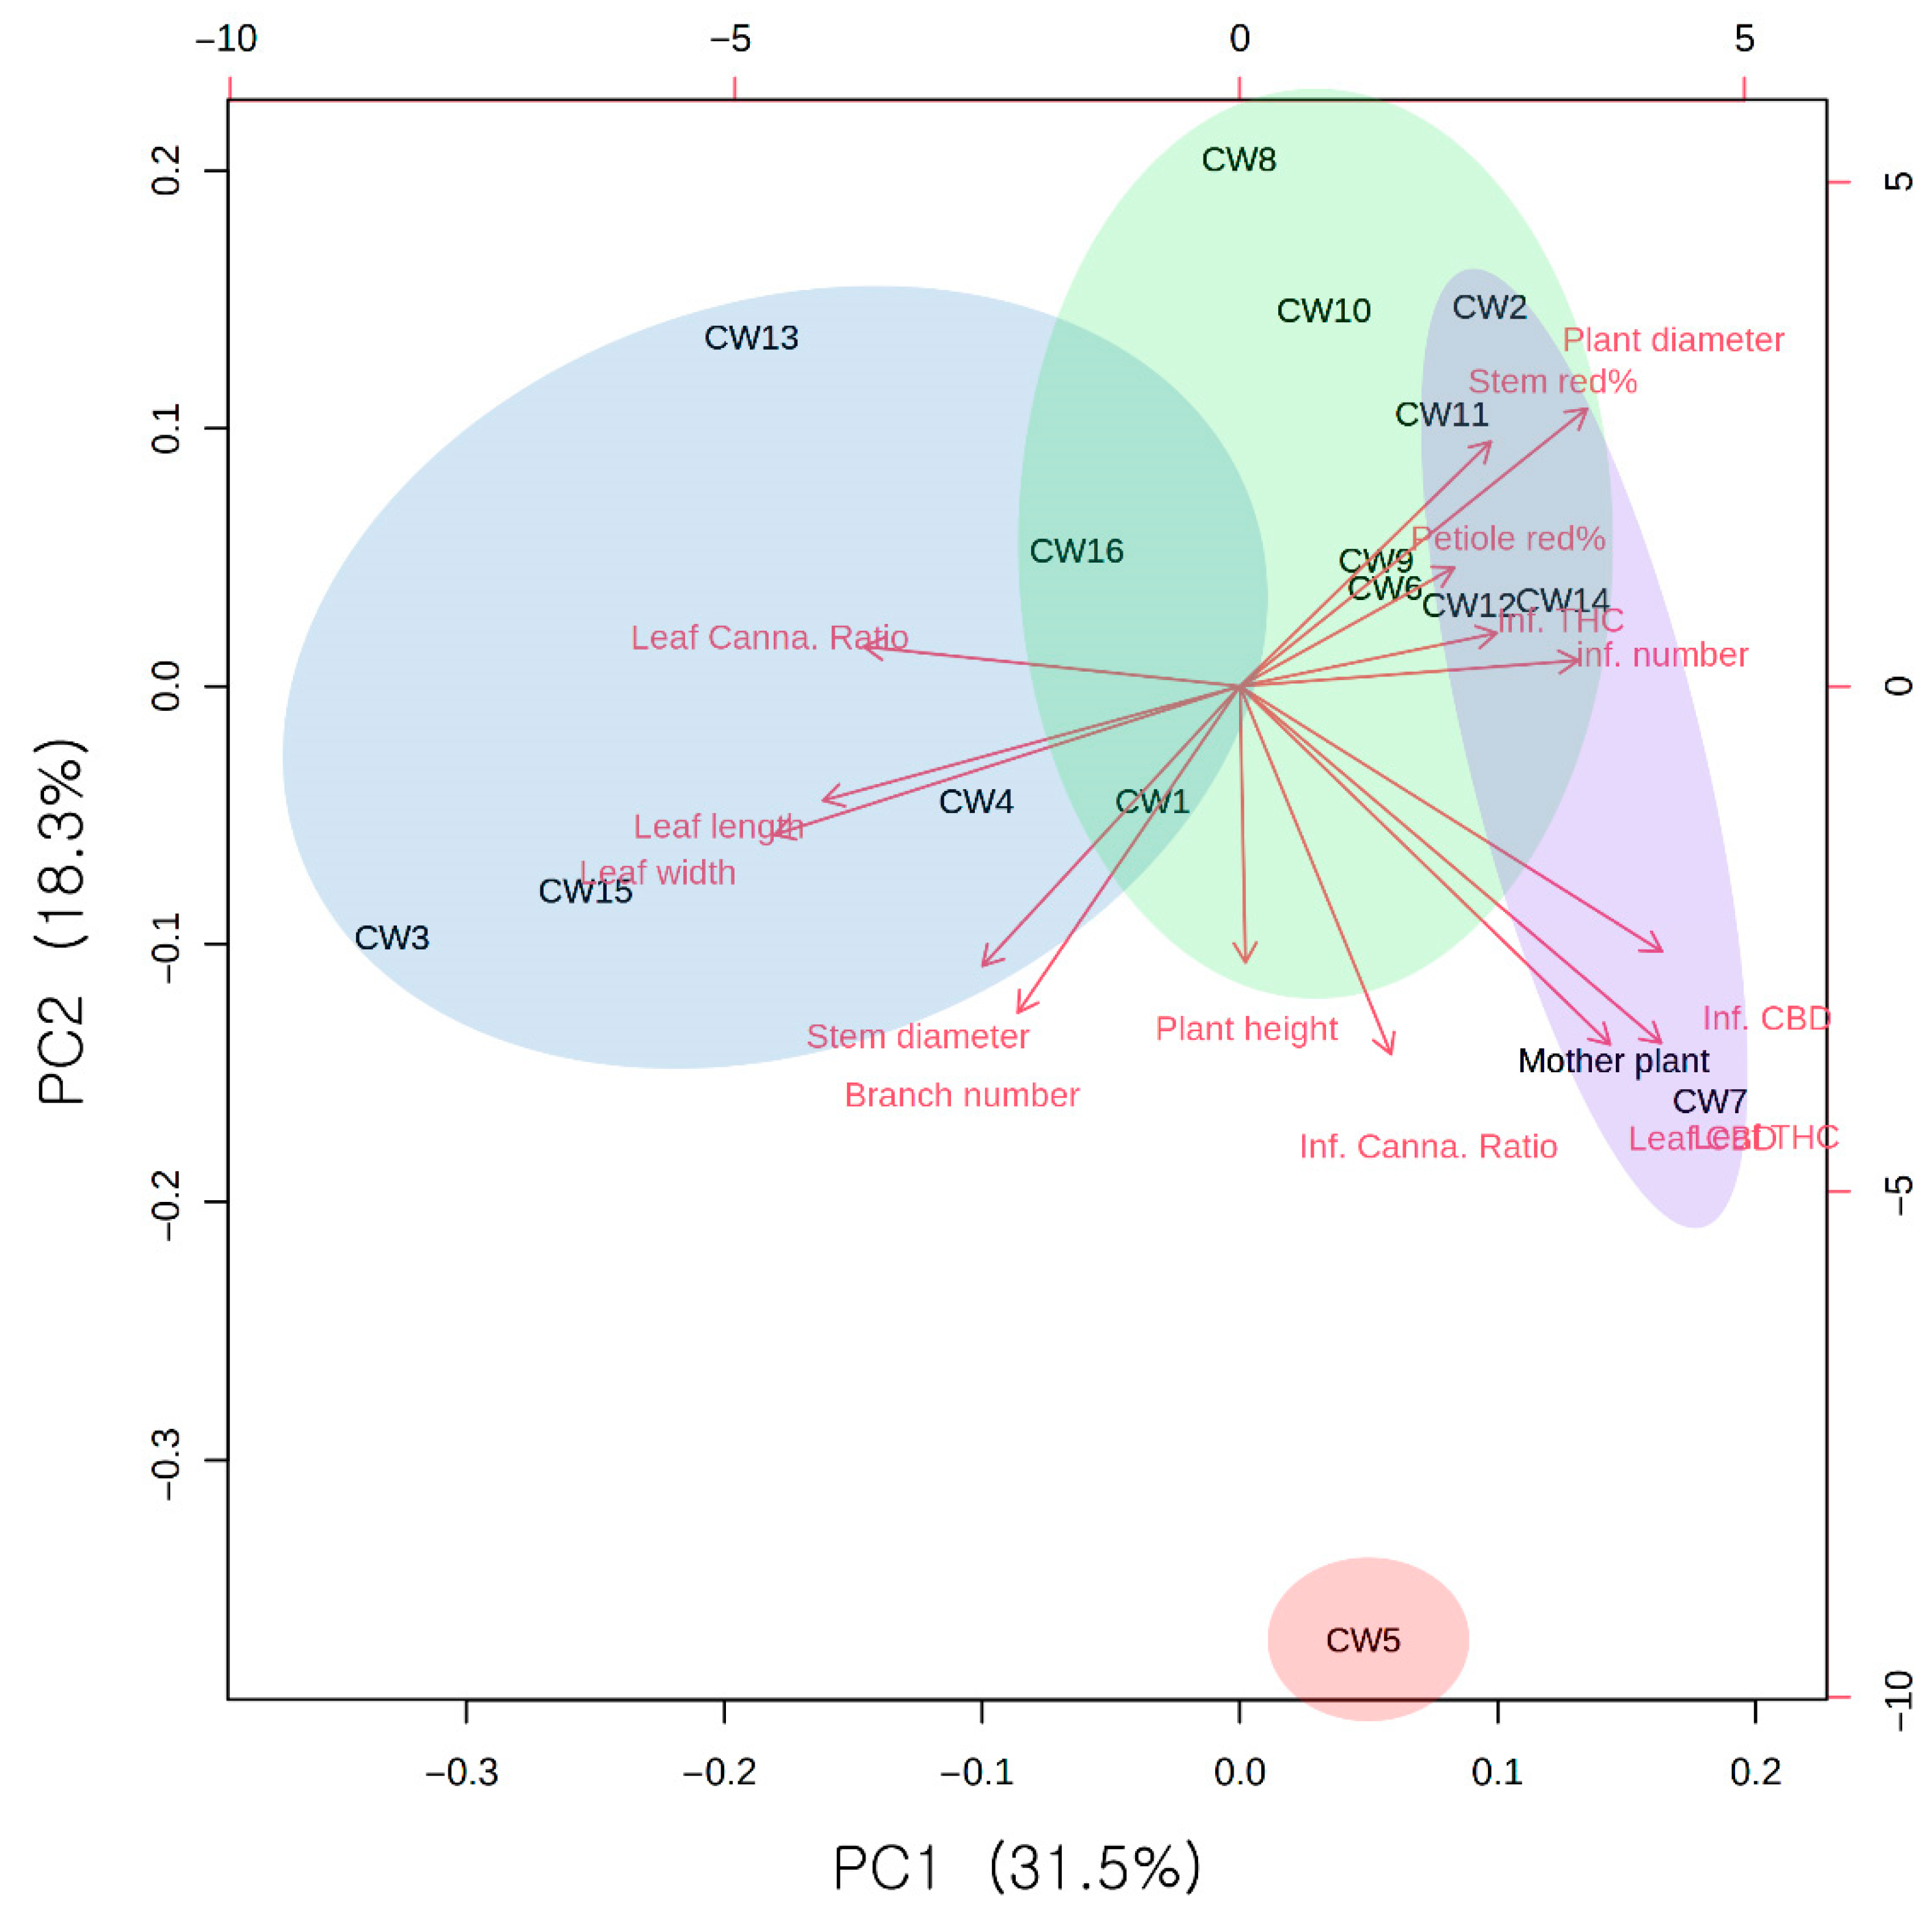
3.2. Component and Morphological Correlation

We compared the morphological and compositional data to determine why the CW21-5 line could have such a high total CBD content per meter. On day 50 of the flowering treatment, morphological investigations of all hemp F1 plants were conducted. Heatmap analysis of the analyzed plant height, branch number, cannabinoid ratio (total CBD/total Δ9-THC) of the leaves, stem diameter, leaf length, and leaf width formed one cluster group. The cannabinoid ratio (total CBD/total Δ9-THC) of inflorescences, total CBD concentration of inflorescences, total CBD concentration of leaves, and total Δ9-THC concentration of leaves constituted a second cluster group. The redness percentage of petioles, redness percentage of stems, total Δ9-THC concentration of inflorescences, count of inflorescences, and plants constituted a third cluster group. According to the heat map analysis, total CBD content and plant diameter showed a strong inverse relationship on CW21-5. As a result, the CW21-5 line occupies less space, but has a high cannabinoid content, increasing the total CBD production per unit meter.
Several morphological features and cannabinoid content were classified into different clusters, indicating very little or no correlation. In addition, Vergara et al. (2021) investigated the correlation between cannabinoids and the morphological characteristics of the leaves of 297 types of hybrid hemp but found no correlation [46].
The results from the principal correlation heatmap showed that the number of flowers and the plants’ diameter was proportional (Figure 5). Many morphological parameters, such as stem diameter and leaf length, were inversely proportional to the diameter of the plant. In addition, most of the morphological data and cannabinoid content did not have a significant correlation, except for the THC content of inflorescence, where all cannabinoids had a proportional relationship with each other. In addition, stem redness percentages had an inverse relationship with stem diameter. Abot et al. (2013) reported that overall growth was sluggish, and stems turned red in cannabis subjected to moisture stress. In addition, this did not have a significant effect on the cannabinoid content, suggesting the possibility that anthocyanin, which can be confirmed with the naked eye in medicinal hemp, can be applied as a stress marker, and further studies are needed using more medicinal hemp varieties [47].
Morphological data and component data values of cannabis were expressed through clustering principal component analysis. Each F1 line generated three clusters, cluster 1 consisted of CW21-13, CW21-16, CW21-3, CW21-15, CW21-4, and CW21-1, and cluster 2 was composed of CW21-8, CW21-10, CW21-2, CW21-11, CW21-16, CW21-9, CW21-6, CW21-12, CW21-14, CW21-1, and cluster 3 comprised CW21-2, CW21-11, CW21-12, CW21-14, CW12-7, and the mother plant. CW21-5 did not belong to any group and had a negative correlation with plant diameter, and positive correlation with CBD content of inflorescence and leaf. In other words, the characteristics of CW21-5, which has a high total CBD production per unit area, were explained due to the narrow plant diameter and high CBD content in the leaves and inflorescence at the same time (Figure 5).
The inflorescence cannabinoid ratio (total CBD/total Δ9-THC) was high, confirming the superiority of the CW21-5 strain with regard to low total Δ9-THC content and high CBD content in the inflorescence (Figure 6).

4. Conclusions

Currently, hemp is regulated in many countries due to the THC, and most medicinal cannabis growers have to cultivate within the allowed spaces. Therefore, a smart farm cultivation facility that is secure, enclosed, easily managed, and maximizes the space will be the most suitable cultivation method for hemp.
In this study, the mother plant was from the Cherry Wine strain, and the father plants were randomly selected. The F1 generation was obtained via open pollination. Sixteen female individuals of the F1 generation were successfully cultivated in nutrient solution culture under artificial light conditions. The cannabinoid content was analyzed over time, and morphological data were collected on day 50 of the short-day-length treatment when the cannabinoid production peaked.
The total CBD production per cubic meter was based on the dry weight, plant height, plant diameter, and cannabinoid content. The F1 generation with the highest total CBD content was CW21-5 (53.078 ± 0.242 g/m3). Heatmap analysis revealed that the decisive reason for the high yield was the high CBD content and narrow plant diameter.
The first hemp hybrid (2n = 10) was ‘Skunk No. 1’, produced in the early 1970s. The Skunk No. 1 cultivar was bred by selecting the F2 progeny based on various traits, performing nine repeated inbreedings, selecting 10 female and 10 male individuals, and crossing combinations [48].
In addition, it is possible to induce male flowers in female individuals by treating them with silver nitrate at flowering time, thereby creating intentional hermaphrodites [49]. After securing the F1 generation using this method, genetic stability and higher cannabinoid content can be expected if individuals are treated with silver nitrate and are self-pollinated for several generations to ensure genetic fixation. As hemp varieties become legal worldwide, their economic value as an agricultural product is developing into a multi-billion-dollar industry [50]. Although breeding of individuals for high CBD production has not been actioned in Korea yet, many varieties are emerging abroad [51,52,53,54,55].
For hemp growers, the method of selecting hemp varieties based on CBD production per cubic meter is more systematic and easier to predict than the existing methods.
‘CW21-5’, bred based on these factors, was successfully adapted to the smart farm’s nutrient solution cultivation and LED system. Like the ‘Sinsemilla’ variety, it can be registered as an F1 generation bred exclusively for vegetative breeding, and it will have new value as a cannabis breeding source in future research and hemp breeding.

Author Contributions

B.-R.R. conceived and designed the experiments, carried out all the experimental works, C.-H.K., T.-H.K. and J.-H.H. carried out general tasks related to breeding. G.-J.G. and M.J.I. drafted the final manuscript and analyzed and translated the data. M.O.K.A., M.H.R. and M.S.R. improved the manuscript. Y.-S.L. supervised the breeding process and J.-D.L. validated all the protocols in this study. All authors have read and agreed to the published version of the manuscript.

Funding

This research did not receive any specific grants.

Institutional Review Board Statement

Not applicable.

Informed Consent Statement

The standard products and samples used in this study were received and tested with the approval of the Seoul Regional Food and Drug Administration (approval number: 1806).

Data Availability Statement

Not applicable.

Acknowledgments

This research was supported by the Ministry of Science and ICT (MSIT, Korea) (support program: 2021-DD-UP-0379) and the BK21 FOUR program of the National Research Foundation (NRF, Korea).

Conflicts of Interest

The authors declare no conflict of interest.

Sample Availability

Samples of the compounds are not available from the authors.

References

  1. Clarke, R.C. Marijuana Botany: An Advanced Study: The Propagation and Breeding of Distinctive Cannabis; Ronin Publishing: Berkeley, CA, USA, 1981; ISBN 1579511090. [Google Scholar]
  2. Appendino, G.; Chianese, G.; Taglialatela-Scafati, O. Cannabinoids: Occurrence and Medicinal Chemistry. Curr. Med. Chem. 2011, 18, 1085–1099. [Google Scholar] [CrossRef] [PubMed]
  3. Page, J.E.; Nagel, J. Biosynthesis of Terpenophenolic Metabolites in Hop and Cannabis. Recent Adv. Phytochem. 2006, 40, 179–210. [Google Scholar]
  4. Śledziński, P.; Nowak-Terpiłowska, A.; Zeyland, J. Cannabinoids in Medicine: Cancer, Immunity, and Microbial Diseases. Int. J. Mol. Sci. 2021, 22, 263. [Google Scholar] [CrossRef] [PubMed]
  5. Ryu, B.R.; Islam, M.J.; Azad, M.O.K.; Go, E.-J.; Rahman, M.H.; Rana, M.S.; Lim, Y.-S.; Lim, J.-D. Conversion Characteristics of Some Major Cannabinoids from Hemp (Cannabis sativa L.) Raw Materials by New Rapid Simultaneous Analysis Method. Molecules 2021, 26, 4113. [Google Scholar] [CrossRef] [PubMed]
  6. Hindley, G.; Beck, K.; Borgan, F.; Ginestet, C.E.; McCutcheon, R.; Kleinloog, D.; Ganesh, S.; Radhakrishnan, R.; D’Souza, D.C.; Howes, O.D. Psychiatric Symptoms Caused by Cannabis Constituents: A Systematic Review and Meta-Analysis. Lancet Psychiatry 2020, 7, 344–353. [Google Scholar] [CrossRef]
  7. Stuyt, E. The Problem with the Current High Potency THC Marijuana from the Perspective of an Addiction Psychiatrist. Mo. Med. 2018, 115, 482–486. [Google Scholar] [PubMed]
  8. Sarris, J.; Sinclair, J.; Karamacoska, D.; Davidson, M.; Firth, J. Medicinal Cannabis for Psychiatric Disorders: A Clinically-Focused Systematic Review. BMC Psychiatry 2020, 20, 24. [Google Scholar] [CrossRef] [PubMed] [Green Version]
  9. Yep, B.; Gale, N.V.; Zheng, Y. Comparing Hydroponic and Aquaponic Rootzones on the Growth of Two Drug-Type Cannabis sativa L. Cultivars during the Flowering Stage. Ind. Crops Prod. 2020, 157, 112881. [Google Scholar] [CrossRef]
  10. Elsaid, S.; Kloiber, S.; Le Foll, B. Chapter Two—Effects of Cannabidiol (CBD) in Neuropsychiatric Disorders: A Review of Pre-Clinical and Clinical Findings. In Molecular Basis of Neuropsychiatric Disorders: From Bench to Bedside; Rahman, S., Ed.; Academic Press: Cambridge, MA, USA, 2019; Volume 167, pp. 25–75. ISSN 1877-1173. [Google Scholar]
  11. Crippa, J.A.; Guimarães, F.S.; Campos, A.C.; Zuardi, A.W. Translational Investigation of the Therapeutic Potential of Cannabidiol (CBD): Toward a New Age. Front. Immunol. 2018, 9, 2009. [Google Scholar] [CrossRef] [Green Version]
  12. Fellermeier, M.; Eisenreich, W.; Bacher, A.; Zenk, M.H. Biosynthesis of Cannabinoids: Incorporation Experiments with 13C-labeled Glucoses. Eur. J. Biochem. 2001, 268, 1596–1604. [Google Scholar] [CrossRef]
  13. Taura, F.; Sirikantaramas, S.; Shoyama, Y.; Shoyama, Y.; Morimoto, S. Phytocannabinoids in Cannabis sativa: Recent Studies on Biosynthetic Enzymes. Chem. Biodivers. 2007, 4, 1649–1663. [Google Scholar] [CrossRef] [PubMed]
  14. Tahir, M.N.; Shahbazi, F.; Rondeau-Gagné, S.; Trant, J.F. The Biosynthesis of the Cannabinoids. J. Cannabis Res. 2021, 3, 7. [Google Scholar] [CrossRef]
  15. Muntendam, R.; Happyana, N.; Erkelens, T.; Bruining, F.; Kayser, O. Time Dependent Metabolomics and Transcriptional Analysis of Cannabinoid Biosynthesis in Cannabis sativa Var. Bedrobinol and Bediol Grown under Standardized Condition and with Genetic Homogeneity. Online Int. J. Med. Plant Res 2012, 1, 31–40. [Google Scholar]
  16. Mandolino, G.; Bagatta, M.; Carboni, A.; Ranalli, P.; de Meijer, E. Qualitative and Quantitative Aspects of the Inheritance of Chemical Phenotype in Cannabis. J. Ind. Hemp 2003, 8, 51–72. [Google Scholar] [CrossRef]
  17. Hillig, K.W.; Mahlberg, P.G. A Chemotaxonomic Analysis of Cannabinoid Variation in Cannabis (Cannabaceae). Am. J. Bot. 2004, 91, 966–975. [Google Scholar] [CrossRef] [PubMed] [Green Version]
  18. Mahlberg, P.G.; Hemphill, J.K. Effect of Light Quality on Cannabinoid Content of Cannabis sativa L. (Cannabaceae). Bot. Gaz. 1983, 144, 43–48. [Google Scholar] [CrossRef]
  19. Zhang, W.J.; Björn, L.O. The Effect of Ultraviolet Radiation on the Accumulation of Medicinal Compounds in Plants. Fitoterapia 2009, 80, 207–218. [Google Scholar] [CrossRef] [PubMed]
  20. Vanhove, W.; van Damme, P.; Meert, N. Factors Determining Yield and Quality of Illicit Indoor Cannabis (Cannabis Spp.) Production. Forensic Sci. Int. 2011, 212, 158–163. [Google Scholar] [CrossRef]
  21. Wenger, J.P.; Dabney III, C.J.; ElSohly, M.A.; Chandra, S.; Radwan, M.M.; Majumdar, C.G.; Weiblen, G.D. Validating a Predictive Model of Cannabinoid Inheritance with Feral, Clinical, and Industrial Cannabis sativa. Am. J. Bot. 2020, 107, 1423–1432. [Google Scholar] [CrossRef]
  22. Andre, C.M.; Hausman, J.-F.; Guerriero, G. Cannabis sativa: The Plant of the Thousand and One Molecules. Front. Plant Sci. 2016, 7, 19. [Google Scholar] [CrossRef] [PubMed] [Green Version]
  23. Mahlberg, P.G.; Kim, E.S. Accumulation of Cannabinoids in Glandular Trichomes of Cannabis (Cannabaceae). J. Ind. Hemp 2004, 9, 15–36. [Google Scholar] [CrossRef]
  24. Livingston, S.J.; Quilichini, T.D.; Booth, J.K.; Wong, D.C.J.; Rensing, K.H.; Laflamme-Yonkman, J.; Castellarin, S.D.; Bohlmann, J.; Page, J.E.; Samuels, A.L. Cannabis Glandular Trichomes Alter Morphology and Metabolite Content during Flower Maturation. Plant J. 2020, 101, 37–56. [Google Scholar] [CrossRef] [PubMed]
  25. Schachtsiek, J.; Warzecha, H.; Kayser, O.; Stehle, F. Current Perspectives on Biotechnological Cannabinoid Production in Plants. Planta Med. 2018, 84, 214–220. [Google Scholar] [CrossRef] [Green Version]
  26. Gülck, T.; Møller, B.L. Phytocannabinoids: Origins and Biosynthesis. Trends Plant Sci. 2020, 25, 985–1004. [Google Scholar] [CrossRef]
  27. Berthold, E.C.; Yang, R.; Sharma, A.; Kamble, S.H.; Kanumuri, S.R.; King, T.I.; Popa, R.; Freeman, J.H.; Brym, Z.T.; Avery, B.A. Regulatory Sampling of Industrial Hemp Plant Samples (Cannabis sativa L.) Using UPLC-MS/MS Method for Detection and Quantification of Twelve Cannabinoids. J. Cannabis Res. 2020, 2, 42. [Google Scholar] [CrossRef] [PubMed]
  28. Clarke, R.C.; Merlin, M.D. Cannabis Domestication, Breeding History, Present-Day Genetic Diversity, and Future Prospects. Crit. Rev. Plant Sci. 2016, 35, 293–327. [Google Scholar] [CrossRef]
  29. Moliterni, V.M.C.; Cattivelli, L.; Ranalli, P.; Mandolino, G. The Sexual Differentiation of Cannabis sativa L.: A Morphological and Molecular Study. Euphytica 2004, 140, 95–106. [Google Scholar] [CrossRef]
  30. Schilling, S.; Dowling, C.A.; Shi, J.; Ryan, L.; Hunt, D.; OReilly, E.; Perry, A.S.; Kinnane, O.; McCabe, P.F.; Melzer, R. The Cream of the Crop: Biology, Breeding and Applications of Cannabis sativa. Authorea Prepr. 2020, 1–46. [Google Scholar] [CrossRef]
  31. Mead, A. The Legal Status of Cannabis (Marijuana) and Cannabidiol (CBD) under US Law. Epilepsy Behav. 2017, 70, 288–291. [Google Scholar] [CrossRef] [Green Version]
  32. Brunetti, P.; Faro, A.F.L.; Pirani, F.; Berretta, P.; Pacifici, R.; Pichini, S.; Busardò, F.P. Pharmacology and Legal Status of Cannabidiol. Ann. Dell’istituto Super. Sanità 2020, 56, 285–291. [Google Scholar]
  33. Bifulco, M.; Pisanti, S. Medicinal Use of Cannabis in E Urope: The Fact That More Countries Legalize the Medicinal Use of Cannabis Should Not Become an Argument for Unfettered and Uncontrolled Use. EMBO Rep. 2015, 16, 130–132. [Google Scholar] [CrossRef] [PubMed] [Green Version]
  34. Areesantichai, C.; Perngparn, U.; Pilley, C. Current Cannabis-Related Situation in the Asia-Pacific Region. Curr. Opin. Psychiatry 2020, 33, 352–359. [Google Scholar] [CrossRef] [PubMed]
  35. Goodman, S.; Wadsworth, E.; Leos-Toro, C.; Hammond, D. Prevalence and Forms of Cannabis Use in Legal vs. Illegal Recreational Cannabis Markets. Int. J. Drug Policy 2020, 76, 102658. [Google Scholar] [CrossRef] [PubMed]
  36. Chae, C.-J.; Cho, H.-J. Enhanced Secure Device Authentication Algorithm in P2P-Based Smart Farm System. Peer-to-Peer Netw. Appl. 2018, 11, 1230–1239. [Google Scholar] [CrossRef]
  37. Lee, S.; Hong, Y.; Lee, E.; Han, Y.; Kim, E.; Park, J.; Lee, S.; Jung, Y.; You, Y. Effects of Sources and Quality of LED Light on Response of Lycium Chinense of Photosynthetic Rate, Transpiration Rate, and Water Use Efficiency in the Smart Farm. Korean J. Ecol. Environ. 2019, 52, 171–177. [Google Scholar] [CrossRef]
  38. Lohchab, V.; Kumar, M.; Suryan, G.; Gautam, V.; Das, R.K. A Review of IoT Based Smart Farm Monitoring. In Proceedings of the 2018 Second International Conference on Inventive Communication and Computational Technologies (ICICCT), Coimbatore, India, 20–21 April 2018; IEEE: Piscataway, NJ, USA, 2018; pp. 1620–1625. [Google Scholar]
  39. Kanjilal, D.; Singh, D.; Reddy, R.; Mathew, J. Smart Farm: Extending Automation to the Farm Level. Int. J. Sci. Technol. Res. 2014, 3, 109–113. [Google Scholar]
  40. Yoon, C.; Huh, M.; Kang, S.-G.; Park, J.; Lee, C. Implement Smart Farm with IoT Technology. In Proceedings of the 2018 20th International Conference on Advanced Communication Technology (ICACT), Chuncheon, Korea, 11–14 February 2018; IEEE: Piscataway, NJ, USA, 2018; pp. 749–752. [Google Scholar]
  41. Islam, M.J.; Ryu, B.R.; Azad, M.O.K.; Rahman, M.H.; Cheong, E.J.; Lim, J.-D.; Lim, Y.-S. Cannabinoids Accumulation in Hemp (Cannabis sativa L.) Plants under LED Light Spectra and Their Discrete Role as a Stress Marker. Biology 2021, 10, 710. [Google Scholar] [CrossRef] [PubMed]
  42. Islam, M.J.; Ryu, B.R.; Azad, M.O.K.; Rahman, M.H.; Rana, M.S.; Kang, C.-W.; Lim, J.-D.; Lim, Y.-S. Comparative Growth, Photosynthetic Pigments, and Osmolytes Analysis of Hemp (Cannabis sativa L.) Seedlings under an Aeroponics System with Different LED Light Sources. Horticulturae 2021, 7, 239. [Google Scholar] [CrossRef]
  43. Yang, R.; Berthold, E.C.; McCurdy, C.R.; da Silva Benevenute, S.; Brym, Z.T.; Freeman, J.H. Development of Cannabinoids in Flowers of Industrial Hemp (Cannabis sativa L.): A Pilot Study. J. Agric. Food Chem. 2020, 68, 6058–6064. [Google Scholar] [CrossRef]
  44. Bernstein, N.; Gorelick, J.; Koch, S. Interplay between Chemistry and Morphology in Medical Cannabis (Cannabis sativa L.). Ind. Crops Prod. 2019, 129, 185–194. [Google Scholar] [CrossRef]
  45. Burgel, L.; Hartung, J.; Schibano, D.; Graeff-Hönninger, S. Impact of Different Phytohormones on Morphology, Yield and Cannabinoid Content of Cannabis sativa L. Plants 2020, 9, 725. [Google Scholar] [CrossRef] [PubMed]
  46. Vergara, D.; Feathers, C.; Huscher, E.L.; Holmes, B.; Haas, J.A.; Kane, N.C. Widely Assumed Phenotypic Associations in Cannabis sativa Lack a Shared Genetic Basis. PeerJ 2021, 9, e10672. [Google Scholar] [CrossRef] [PubMed]
  47. Abot, A.; Bonnafous, C.; Touchard, F.; Thibault, F.; Chocinski-Arnault, L.; Lemoine, R.; Dedaldechamp, F. Effects of Cultural Conditions on the Hemp (Cannabis sativa) Phloem Fibres: Biological Development and Mechanical Properties. J. Compos. Mater. 2013, 47, 1067–1077. [Google Scholar] [CrossRef]
  48. Barcaccia, G.; Palumbo, F.; Scariolo, F.; Vannozzi, A.; Borin, M.; Bona, S. Potentials and Challenges of Genomics for Breeding Cannabis Cultivars. Front. Plant Sci. 2020, 11, 1472. [Google Scholar] [CrossRef]
  49. Moon, Y.H.; Koo, B.C.; Choi, Y.H.; Bark, S.T.; Ahn, S.H.; Cha, Y.L.; An, G.H.; Kim, J.K.; Suh, S.J. Seed production by induction of male flowers on female plants of hemp (Cannabis sativa L.). Korean J. Crop Sci. 2010, 55, 327–332. [Google Scholar]
  50. Silver, R.; Wakshalg, J.; Wynn, S.; Kramer, K. Nutritional Analysis of Cannabis. In Cannabis Therapy in Veterinary Medicine; Springer: Berlin/Heidelberg, Germany, 2021; pp. 271–293. [Google Scholar]
  51. Mölleken, H.; Theimer, R.R. Survey of Minor Fatty Acids in Cannabis sativa L. Fruits of Various Origins. J. Int. Hemp Assoc. 1997, 4, 13–17. [Google Scholar]
  52. Fischedick, J.T.; Hazekamp, A.; Erkelens, T.; Choi, Y.H.; Verpoorte, R. Metabolic Fingerprinting of Cannabis sativa L., Cannabinoids and Terpenoids for Chemotaxonomic and Drug Standardization Purposes. Phytochemistry 2010, 71, 2058–2073. [Google Scholar] [CrossRef] [PubMed]
  53. Chandra, S.; Lata, H.; Khan, I.A.; ElSohly, M.A. Temperature Response of Photosynthesis in Different Drug and Fiber Varieties of Cannabis sativa L. Physiol. Mol. Biol. Plants 2011, 17, 297–303. [Google Scholar] [CrossRef] [PubMed] [Green Version]
  54. Lynch, R.C.; Vergara, D.; Tittes, S.; White, K.; Schwartz, C.J.; Gibbs, M.J.; Ruthenburg, T.C.; deCesare, K.; Land, D.P.; Kane, N.C. Genomic and Chemical Diversity in Cannabis. Crit. Rev. Plant Sci. 2016, 35, 349–363. [Google Scholar] [CrossRef] [Green Version]
  55. Russo, E.B. The Case for the Entourage Effect and Conventional Breeding of Clinical Cannabis: No “Strain,” No Gain. Front. Plant Sci. 2019, 9, 1969. [Google Scholar] [CrossRef]
Figure 1. Cannabinoid synthesis pathway.
Agronomy 12 01809 g001
Figure 2. LED light spectrum.
Agronomy 12 01809 g002
Figure 3. Branch tip shape of hemp mother plant and F1 hybrids. The samples were collected on day 50 of the flowering treatment (short light length, 12 h light/day). (A) Mother plant; (B) CW21-5 line; (CQ) F1 generation except CW21-5 line.
Agronomy 12 01809 g003
Figure 4. Cannabinoid content by strain and date. (A) CBD + CBDA of leaf, (B) CBD + CBDA of inflorescence, (C) Δ9-THC + 9-THCA of leaf, (D) Δ9-THC + Δ9-THCA of inflorescence. Indications of 21st–50th represent the days of short daylight treatment.
Agronomy 12 01809 g004
Figure 5. Heat map of Pearson’s correlation coefficient matrix between morphological and chemotype. The color scale indicates the intensity of correlation (red is directly proportional, blue is inversely proportional). All cannabinoids included acidic precursors.
Agronomy 12 01809 g005
Figure 6. Principal Component Analysis (PCA). All cannabinoids included acidic precursors. Three types of clusters were presented through the Self-Organizing Map (SOM), which were grouped based on morphology and cannabinoid. In PCA, the lines starting from the central point of the biplots display negative or positive associations of different variables, and their proximity specifies the degree of correlation with specific treatment.
Agronomy 12 01809 g006
Table 1. Nutrient solution composition.
Nutrient NameA Solution (50 L)B Solution (50 L)
Ca(NO3)·4H2O1.50 kg
KNO33.79 kg3.79 kg
(NH4)H2PO4 1.60 kg
MgSO4 4.30 kg
Fe-EDTA460.0 g
MnSO4 30.8 g
H3BO3 57.2 g
ZnSO4 3.6 g
CuSO4 1.3 g
(NH4)6Mo7O24·4H2O 0.4 g
Solutions A and B were mixed to maintain an EC range between 1.2 to 1.7 (dSm−2), pH 6.0.
Table 2. HPLC conditions.
EquipmentCondition
InstrumentShimadzu LC-20AT HPLC system
ColumnReverse phase Zorbax SB-C18 (4.6 mm × 100 mm, 3.5 µm)
DetectorUV-Vis detector (220 nm)
Elution typeGradient
Mobile phaseSolvent A: Water containing 0.05% TFA
Solvent B: Acetonitrile containing 0.05% TFA
Flow rate1.5 mL/min
Oven27 °C
Injection volume10 µL
Table 3. Morphological characteristics of the Cherry Wine F1 generation.
Plant LinePlant Height
(cm)
Leaf Length (cm)Leaf Width (cm)Branch NumberStem Diameter (mm)Inf. NumberInf. Length (1)Petiole Color (Red%)Stem Color (Red%)Whole Plant Diameter (cm)
Mother plant78.1 ± 5.112 ± 21.1 ± 0.317 ± 210.17 ± 3.70410 ± 112++++40060 ± 11
CW21-144.1 ± 4.318 ± 23.2 ± 0.612 ± 315.40 ± 3.12198 ± 25++60566 ± 5
CW21-252.5 ± 8.112 ± 33.0 ± 0.610 ± 28.62 ± 2.75320 ± 49+++957568 ± 13
CW21-350.2 ± 3.223 ± 45.1 ± 0.626 ± 414.86 ± 3.3476 ± 14+15537 ± 18
CW21-484.0 ± 8.414 ± 42.5 ± 0.423 ± 610.44 ± 3.11146 ± 43++50550 ± 16
CW21-568.2 ± 4.515 ± 53.1 ± 0.519 ± 313.06 ± 2.02205 ± 51++++30543 ± 11
CW21-669.3 ± 4.412 ± 21.4 ± 0.220 ± 37.04 ± 3.55330 ± 44++405058 ± 21
CW21-778.9 ± 5.714 ± 41.8 ± 0.220 ± 510.50 ± 2.13460 ± 37+++402078 ± 17
CW21-838.5 ± 6.112 ± 21.5 ± 0.412 ± 210.09 ± 4.00248 ± 44++5087 ± 21
CW21-962.1 ± 6.611 ± 31.3 ± 0.217 ± 613.27 ± 2.76512 ± 85++++5090 ± 18
CW21-1047.0 ± 4.319 ± 82.1 ± 0.414 ± 58.15 ± 1.11245 ± 64++++858070 ± 20
CW21-11 72.0 ± 11.113 ± 12.0 ± 0.314 ± 56.84 ± 1.04179 ± 51++808070 ± 11
CW21-1254.2 ± 5.315 ± 41.8 ± 0.616 ± 48.51 ± 1.31295 ± 52++++756073 ± 17
CW21-1359.0 ± 4.015 ± 42.8 ± 0.514 ± 611.06 ± 2.34349 ± 105++15050 ± 12
CW21-1461.2 ± 7.710 ± 21.2 ± 0.411 ± 48.39 ± 1.08300 ± 13++++303089 ± 11
CW21-1588.9 ± 6.019 ± 54.0 ± 0.817 ± 311.23 ± 3.11201 ± 91++30058 ± 21
CW21-1669.3 ± 3.118 ± 63.1 ± 0.515 ± 77.51 ± 2.5385 ± 37++40068 ± 16
Data were selected based on the females that successfully survived the transition to the nutrient solution conditions. (1) +: very short, ++: short, +++: long, ++++: very long. The diameter and length of the leaf are expressed as the average of the top, middle, and bottom of the plant, on the basis of three identical clones.
Table 4. Total CBD content per cubic meter.
Plant NameTotal CBD Content (g, CBD + CBDA)
LeafInflorescenceTotal
Mother plant2.663 ± 0.211 f23.612 ± 0.861 c26.275 ± 0.724 e
CW21-17.791 ± 0.354 d30.310 ± 0.434 b38.102 ± 0.457 b
CW21-21.751 ± 0.133 g11.913 ± 0.060 f13.663 ± 0.119 i
CW21-38.680 ± 0.297 c20.916 ± 0.451 d29.596 ± 0.441 d
CW21-49.865 ± 0.188 b23.440 ± 0.510 c33.304 ± 0.444 c
CW21-514.936 ± 0.266 a38.066 ± 0.088 a53.002 ± 0.228 a
CW21-60.505 ± 0.037 ij5.767 ± 0.174 h6.272 ± 0.145 k
CW21-71.823 ± 0.157 g14.637 ± 0.354 e16.460 ± 0.316 h
CW21-81.040 ± 0.104 hi8.313 ± 0.396 g9.353 ± 0.334 j
CW21-91.238 ± 0.104 h14.759 ± 0.069 e15.998 ± 0.102 h
CW21-102.831 ± 0.097 f15.219 ± 0.160 e18.050 ± 0.153 g
CW21-111.016 ± 0.149 hi3.619 ± 0.186 i4.635 ± 0.194 m
CW21-124.096 ± 0.128 e14.991 ± 0.189 e19.087 ± 0.187 f
CW21-134.248 ± 0.096 e12.104 ± 0.306 f16.352 ± 0.262 h
CW21-140.661 ± 0.011 ij5.745 ± 0.095 h6.406 ± 0.078 k
CW21-151.840 ± 0.075 g3.314 ± 0.030 i5.154 ± 0.066 l
CW21-161.184 ± 0.095 h8.099 ± 0.303 g9.283 ± 0.259 j
Means with different letters varied significantly with DMRT (Duncan’s Multiple Range Test) at the 5% level (p < 0.05) within the same part of the plant. After harvesting all leaves or flowers, they were ground and homogenized, and random sampling was performed using the cone quadrant method. The morphological data used for calculation were average values.
Publisher’s Note: MDPI stays neutral with regard to jurisdictional claims in published maps and institutional affiliations.

