Article

The Effect of Different Nitrogen Fertilizer Rates, Sowing Density, and Plant Growth Regulator Application on the Quality and Milling Value of Triticum durum Desf. Grain

by
Kamila Sabina Bożek
1,
Krystyna Żuk-Gołaszewska
1,
Jarosław Bojarczuk
2 and
Janusz Gołaszewski
3,*
1
Department of Agrotechnology and Agribusiness, Faculty of Agriculture and Forestry, University of Warmia and Mazury in Olsztyn, ul. Oczapowskiego 8, 10-719 Olsztyn, Poland
2
Plant Breeding Smolice Ltd., IHAR Group, Smolice 146, 63-740 Smolice, Poland
3
Department of Genetics, Plant Breeding and Bioresource Engineering, Faculty of Agriculture and Forestry, University of Warmia and Mazury in Olsztyn, Pl. Łódzki 3, 10-724 Olsztyn, Poland
*
Author to whom correspondence should be addressed.
Agronomy 2022, 12(7), 1622; https://doi.org/10.3390/agronomy12071622
Submission received: 7 May 2022 / Revised: 27 June 2022 / Accepted: 4 July 2022 / Published: 6 July 2022
(This article belongs to the Topic Plants Nutrients)

Abstract

:
Agronomic treatments and environmental conditions of cultivation affect the nutritional value and technological quality of durum-wheat-based products. The aim of this study was to determine the effect of 18 agronomic treatments that differed in nitrogen rate, sowing density, and growth regulator application on variability in the quality and milling parameters of durum wheat grain, and the interrelationships between these parameters. The study demonstrated that the investigated parameters were modified by the agronomic treatments. However, environmental variance resulting from differences in soil characteristics and climatic conditions dominated in most cases (44–93%). The percentage of variance induced by differences between treatments in total variance was distinctly higher only in the case of the gluten index (59%). The treatments without nitrogen fertilization and with or without the application of the growth regulator, and the treatments with the application of the growth regulator and the nitrogen rate of 120 kg N ha−1, discriminated between the milling parameters associated with sifting (bran, type 1 semolina) and grading of milling products (flour, type 2 semolina, and type 3 semolina), respectively.

Graphical Abstract

1. Introduction

The determination of changes in the quality parameters of durum wheat grain resulting from different crop cultivation and grain processing methods poses a challenge, and the effort is undertaken to obtain food products with the optimal nutritional value and processing suitability. Durum wheat grain is a source of nutrients, and its quality determines the culinary value of the end product, which is mostly pasta [1,2,3], but also bread, couscous, pizza, and other regional products [4,5]. Therefore, it is assumed that the technological quality of durum wheat is influenced mainly by grain and milling parameters that are responsible for the high quality of pasta [6]. High-quality pasta should have a smooth, semi-translucent surface, vitreous appearance at the cross-section, golden-amber color, distinctive taste and aroma both before and after cooking, and it should not be brittle or easy to break [7,8]. These attributes are influenced by numerous grain quality parameters that determine the structure and quality of bran yield, flour yield and semolina yield, and, consequently, processing suitability. In turn, grain quality parameters are affected by various environmental and agronomic factors, in particular cultivar, nitrogen fertilization, and the application of growth regulators [9].
The quality of durum wheat grain, including grain health and milling potential, are determined mainly by the bulk density of grain and thousand grain weight, which are directly associated with grain size and are largely affected by weather conditions during harvest. Precipitation during harvest and grain drying by aeration lead to kernel wrinkling, loss of vitreousness, reduced endosperm content, higher protein content, and lower semolina content. The thousand grain weight of durum wheat is estimated to be in the range of 35 g to 40 g [10]. Grain size is associated with vitreousness, which is strongly related to agricultural and climatic conditions [11,12]. Vitreous kernels have rough and cornified cross-sectional surfaces. Grain vitreousness is associated with lower flour yield and higher semolina yield, and a high percentage of hard vitreous kernels is required to produce high-quality pasta [13]. Grain with high protein content (>13%) increases the protein content of semolina (to approx. 12%), which makes the resulting pasta harder, less viscous, and less susceptible to overcooking [14].
The ash content of grain is an indirect indicator of the ash content and purity of semolina. Grain with high ash content (1.18–1.24%) decreases semolina brightness and yellowness, thus compromising pasta quality [2,15].
Grain quality is also significantly influenced by the content of the yellow pigment, a trait that is genetically conditioned, stable, and not significantly affected by agronomic or environmental factors [15,16]. The yellow pigment is associated with the presence of natural carotenoids in semolina, and it is responsible for the desirable yellow color of pasta. Yellow pigment is indirectly linked with the presence of natural antioxidants which condition photosynthetic processes in plants [17] and deliver health benefits [18,19]. According to Matsuo and Dexter [20], the color of pasta (brightness and yellowness) is inversely proportional to the ash content of semolina.
The nutritional value of durum wheat grain is determined by the content of minerals-macronutrients and micronutrients [21]. With the exception of copper, mineral nutrients are accumulated mainly in bran and germ. With regards to nutrient distribution in durum wheat grain, whole-meal semolina is preferred in the production of pasta with high nutritional value [22]. The concentration of minerals in grain is determined mostly by genetic factors as well as by environmental conditions, such as soil properties and water availability. In biofortified crops, nutrient content is also influenced by the supply of specific macronutrient or micronutrient fertilizers [22,23,24,25,26].
Numerous studies have demonstrated that the physicochemical properties of durum wheat grain affect its milling properties and the quality of semolina [15,27,28]. In the milling process, bran and germ are separated from the endosperm, and kernel brittleness contributes to semolina contamination with bran particles [3,29].
All of the above grain quality parameters, excluding yellow pigment content, are strongly affected by the agricultural practices associated with sowing, fertilization, and harvesting, as well as soil conditions and climate. Rational nitrogen fertilization is the key agronomic factor in durum wheat production because it is responsible for the protein content of grain [30], grain vitreousness [31], high semolina yield and, consequently, desirable grain quality parameters [32]. Sowing date and density are also important considerations in agricultural practice. Delayed sowing decreases the content of wet gluten, the gluten index, and semolina quality [33], and an excessive sowing density per 1 m2 decreases the number of grains per spike and thousand grain weight [34]. In a temperate climate, the optimal sowing density ranges from 300 to 600 grains per 1 m2 [35]. Growth regulators are applied to intensify the production of durum wheat grain by modifying the physiological processes of plant growth and development that impact canopy and yield formation [36,37].
The aim of this study was to assess the quality parameters and milling value of durum wheat grain grown in different agronomic treatment systems. Two research hypotheses were formulated and verified: (i) agronomic treatments influence the variability of physicochemical parameters and milling value of durum wheat grain, and (ii) agronomic treatments affect the mutual correlations between grain quality parameters, content of macronutrients and micronutrients in grain, and milling yield components.

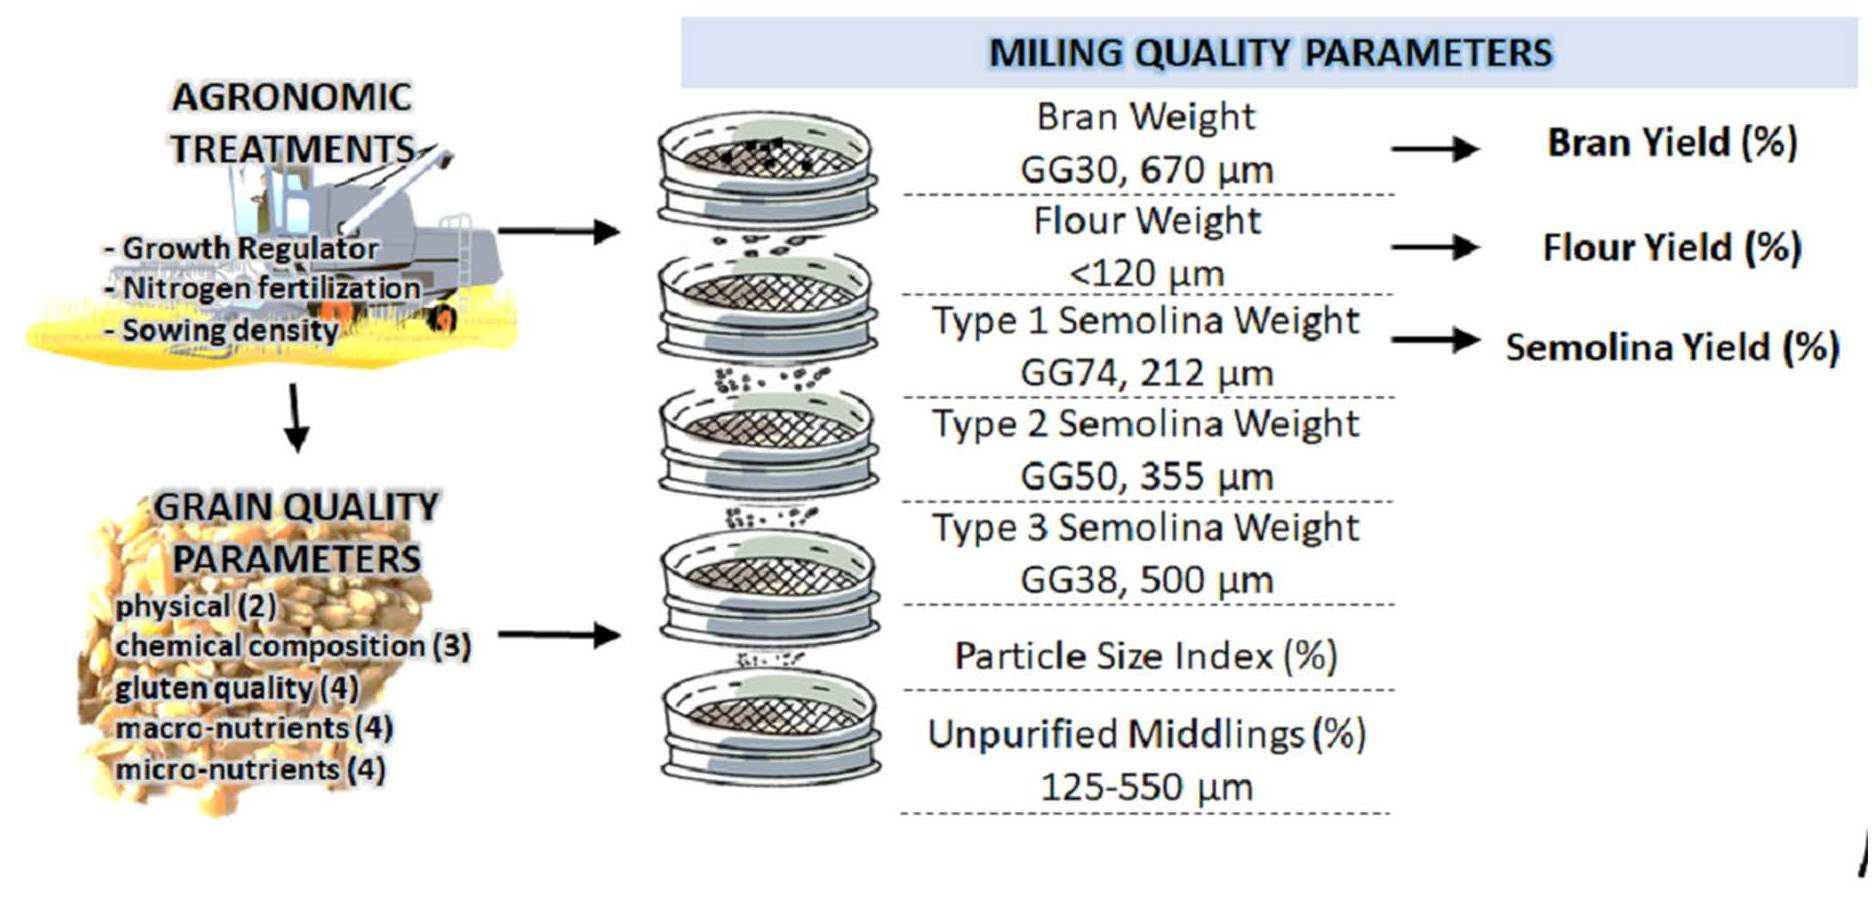
2. Materials and Methods

Durum wheat cv. SMH 87 was grown in field experiments (2015–2017) in 18 experimental treatment systems that differed in the application of the growth regulator (0: No; 1: Yes), nitrogen fertilizer rate (0: 0, 1: 80, and 2: 120 kg ha−1) and sowing density (0: 350, 1: 450, and 2: 550 germinating seeds m−2) [37] (see Table S1 in the Supplementary Material). The field experiments with three replicates were established in the Agricultural Experiment Station in Bałcyny, Poland (53°40′ N, 19°50′ E). Harvested grain was cleaned and dried to a 13 ± 0.5% moisture content. Grain parameters and milling value were determined in laboratory analyses with the AACC Method 26–50 [38].
In the first stage of the analysis, the physical properties of grain were evaluated by determining thousand grain weight and vitreousness. The chemical properties of grain, including ash content, falling number, and protein content, were determined in grain ground in a laboratory mill. Grain was also analyzed for the content of macronutrients (P, K, Mg, and Ca) and micronutrients (Cu, Fe, Zn, and Mn). The following parameters were determined in an analysis of the milling value of grain: bran weight, flour weight, and weight of three semolina types, as well as indicators for classifying the end products of the milling process, including particle size index, semolina yield, and unpurified middlings yield. The content of wet gluten and dry gluten, water-binding capacity of gluten, and the gluten index were calculated. The color of durum wheat kernels was also analyzed, but the results were not presented due to the absence of differences between the examined kernels.
The values of vitreousness, thousand grain weight, falling number, ash content, and protein content were determined using the methods proposed by the Canadian Grain Commission, Methods–Wheat 2004 [39]. Vitreousness was measured in a sifted grain sample of 25 g to determine the natural glassiness associated with kernel hardness. Ash content was determined with AACC Method 08–01. Samples were incinerated overnight in a muffle furnace at 600 °C. The falling number was determined in 7 g samples of ground wheat by the AACC Method 56–81B. To determine macronutrient and micronutrient concentrations, grain samples of 0.5 g were mineralized in concentrated sulfuric acid (VI) with hydrogen dioxide as the oxidant. Protein content (Nx5.7) was determined with the method recommended by the Canadian Grain Commission (Methods–Wheat 2004) [32]. Phosphorus content was determined by the vanadium-molybdenum method. Potassium and calcium concentrations were analyzed by atomic emission spectroscopy (ESA). Magnesium content was determined by atomic absorption spectroscopy (ASA). Micronutrient concentrations were measured by ASA in a Shimadzu spectrophotometer. Semolina was passed through a sieve made of SEFAR NYTAL® fabric [40]. Semolina (100 g) was shaken for 5 min, and the fractions separated on the top of each sieve were weighed and expressed as a percentage of the sample. The method produces lower values than the ICC Standard Method No. 137/1 used prior to 1 August 1998. The value of particle size index, an indicator of wheat kernel texture, was determined by the AACC Method 55–30 [41]. The wet gluten content of semolina was determined using the AACC Standard Method 38–12A [39].

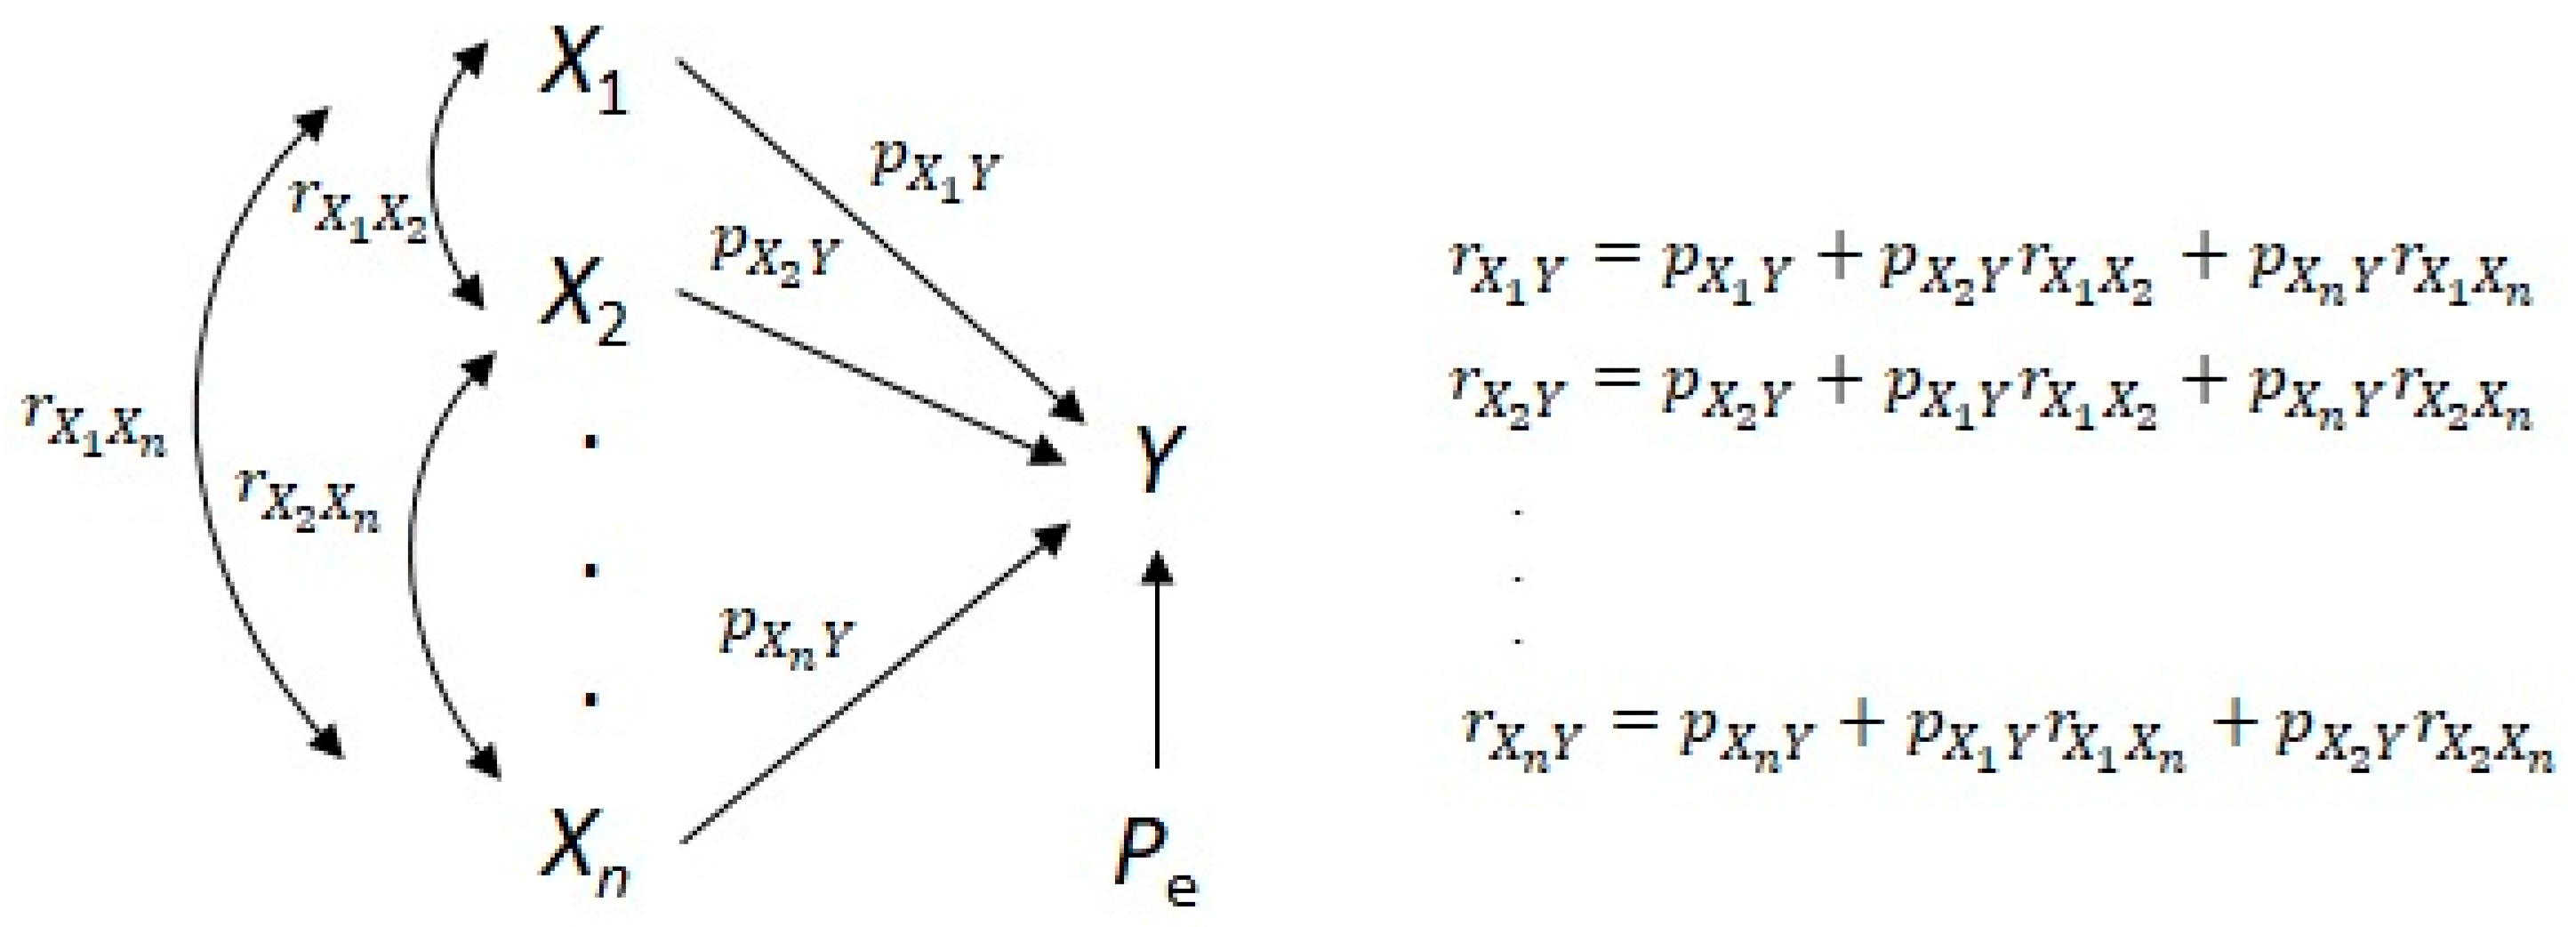
Statistical Analysis

The examined variables were characterized with the use of descriptive statistics, including the arithmetic mean and standard deviation. The variance associated with the examined agronomic treatments was evaluated by analysis of variance (ANOVA), and the significance of differences between means was determined with Fisher’s LSD procedure at α = 0.05. Eta-squared ( η 2 ) was calculated based on the results of ANOVA, and it was used to determine the proportion of variance associated with environmental factors (variance across years and experimental blocks), agronomic treatments (variance across treatments) and random factors (experimental error) (see Table S2 in the Supplementary Material). The mean values of 18 agronomic treatments were used to assess interrelationships among parameters (see Table S3 in the Supplementary Material). The correlations between grain quality parameters, macronutrient and micronutrient content of grain, milling value, and gluten content were determined by calculating simple correlation coefficients and path coefficients that describe the milling yield components’ percentage content of bran, flour, and semolina (Figure 1).
Figure 1. Diagram of path coefficients in the analysis of T. durum milling yield components. Key: Y is the dependent variable (percentage content of bran, flour, and semolina); X i is the independent variable (grain quality parameters, macronutrient, and micronutrient content), where I = 1, 2, … n, and n is the number of independent variables; r X i X i + 1 is the coefficient of simple correlation between independent variables; r X i Y is the coefficient of simple correlation between independent and dependent variables; p X i Y is the direct effect; p X i Y r X i X i + 1 is the indirect effect; P e is the random effect.
Agronomy 12 01622 g001
Grain and milling value parameters were classified as principal components, and their contribution to the total variance was evaluated in the principal component analysis (PCA) (see Table S4 in the Supplement). The PCA involves a correlation matrix, and the principal components denote the proportion of variance explained by each component. The first principal component explains the largest amount of total variance in the data, and subsequent principal components explain the largest amount of the remaining variance [42]. In this study, three principal components explaining around 70% of total variance were identified based on the calculated eigenvalues. The statistical analyses were performed with the use of STATISTICA [43] and Solver for EXCEL.

3. Results and Discussion

The analyzed physicochemical parameters of durum wheat grain, milling parameters, gluten quality, and basic descriptive statistics are presented in Table 1.
Table 1. Variables and descriptive statistics relating to durum wheat grain and milling quality parameters.
No.VariablesSymbolUnitMeanStandard Deviation
Physicochemical Parameters of Grain
1Thousand grain weightTGWG44.96.1
2VitreousnessV%59.719.2
3Ash contentAC%1.90.2
4Falling numberFNS232.334.7
5Protein contentPC%14.51.5
6Phosphorus contentPg kg−12.830.23
7Potassium contentKg kg−15.080.17
8Magnesium contentMgg kg−11.380.09
9Calcium contentCag kg−10.580.21
10Copper contentCumg kg−13.070.60
11Iron contentFemg kg−152.47.19
12Zinc contentZnmg kg−138.47.16
13Manganese contentMnmg kg−129.93.22
Milling Value Parameters
14Bran weight (GG30, 670 μm)BWg566.673.7
15Flour weight (<112 μm)FWg57.027.2
16Type 1 semolina weight (GG74, 212 μm)SW1g287.477.7
17Type 2 semolina weight (GG50, 355 μm)SW2g338.489.5
18Type 3 semolina weight (GG38, 500 μm)SW3g419.397.0
19Particle size indexPSI%5.72.5
20Semolina yieldSY%62.23.5
21Unpurified middlings yield (>125–<550 μm)UMY%37.14.2
Gluten Quality Parameters
22Wet glutenGW%21.481.58
23Dry glutenGD%7.330.54
25Water-binding capacityGWC%14.21.06
25Gluten indexGI%21.1913.51
Agronomic treatments significantly affected grain quality and milling value parameters of durum wheat (Table 2). Falling number and semolina yield were the only exceptions, and the mean values of these parameters approximated the arithmetic mean. The treatments had no significant effect on the macronutrient and micronutrient content of grain. According to Ficco et al. [21], the macronutrient and micronutrient content of grain is largely determined by genetic and environmental factors, which explained 62%, 52%, 51%, and 49% of total variance in the content of P, K, Na, and Mn, respectively. In a study by Pataco et al. [22], biofortification of durum wheat grain did not induce significant differences in nutrient concentrations. P content was 5.26–7.47 g kg−1, K content–5.26–8.65 g kg−1, Mg content–1.45–1.91 g kg−1, Cu content–6.99–9.70 mg kg−1, Fe content-44.03–50.23 mg kg−1, and Zn content–92.96–132.54 mg kg−1. Only Ca concentration increased by nearly 76.5% in biofortified grain.
The contribution of agronomic, environmental, and random factors to total variance in the analyzed parameters was strongly differentiated (Figure 2). Agronomic treatments exerted a strong influence only on GI (58.9%), whereas the remaining parameters were affected mostly by environmental factors. Environmental factors exerted the weakest influence on PSI (44.8%) and grain vitreousness (47.7%), and the greatest influence on TGW (92.9%) and type 2 semolina weight (92.7%). In a study by Makowska et al. [44] the analyzed agronomic factor, i.e., the nitrogen fertilizer rate of 140 kg ha−1, had the greatest influence on grain vitreousness and TGW.
An analysis of the effect of agronomic factors in the examined treatments revealed that treatment means were significantly affected mainly by the nitrogen rate and the application of the growth regulator, whereas the mean values in treatments with different sowing density differed only in the values of GW, GD, and GWC (Table 3).
In durum wheat, TGW is an indicator of the size and health status of kernels [15]. Heavier kernels have a higher endosperm-to-bran ratio, which increases SY. In this study, the mean TGW was 44.9 g, and it ranged from 34.6 to 55.8 g. Heavier grain was produced in treatments with nitrogen rates of 80 and 120 kg N ha−1. Vitreousness is closely linked with kernel hardness, protein content, and semolina granulation [45]. The percentage of vitreous kernels varied widely (28–96%) across the examined treatments. The highest average percentage of vitreous kernels (71.9%) was noted at the highest nitrogen rate (120 kg N ha−1). Sowing density and the application of the growth regulator had a relatively small effect on the percentage of vitreous kernels. In the work of Subira et al. [46], the percentage of vitreous durum wheat kernels ranged from 80% to 92%. In spring durum wheat cv. SMH87, this parameter was determined at 80–94% [38]. Grain vitreousness was clearly lower in the present study.
The AC of durum wheat grain is associated with semolina brightness [47]. High-quality durum wheat semolina should not contain more than 0.8–0.9% of ash [48]. In this study, the mean value of AC was high (1.9%), ranging from 1.4% to 2.2%. This parameter was influenced by nitrogen fertilization and the application of the growth regulator. Ash content significantly increased in response to the highest nitrogen rate and the application of the growth regulator.
The FN denotes alpha-amylase activity in ground grain, and low FN can indirectly point to unfavorable weather conditions during durum wheat harvest which trigger germination [49]. In the analyzed treatments, FN ranged from 159 s to 338 s, with a mean value of 232.3 s. In the group of agronomic factors, nitrogen rates of 80 and 120 kg N ha−1 induced a significant increase (approx. 7.5%) in FN from 220 s to 239 s for 80 kg N ha−1 and to 236 s for 120 kg N ha−1, on average. According to Sulewska et al. [50], the minimum value of FN for durum wheat is 250 s, and the optimal value is 350 to 400 s. In the present study, mean FN values were lower, and similar observations were made by Rachoń [49], who determined FN values in the range of 64 to 374 s in a study analyzing different durum wheat varieties, sowing dates and weather conditions of Poland. Such a wide range of FN values implies that this attribute is considerably affected by genotype and agricultural practice.
Protein content is closely linked with flour and semolina quality [3]. At the same time, pasta quality is influenced by the correlation between protein content and vitreousness of durum wheat grain. In the evaluated agronomic treatments, PC varied widely from 11.9% to 18.8%, with a mean value of 14.5%. These results indicate that the PC of grain is influenced mostly by environmental factors (65.6%), but agronomic factors also play a role (10.6%). The analyzed parameter was highest in the treatment with a nitrogen rate of 120 kg N ha−1 (15.1%) and the application of the growth regulator (14.7%). Similar results were reported by Ruisi et al. [5] in whose study, the PC of durum wheat grain ranged from 11.4% to 16.6%.
Milling value parameters were determined based on the weight of five yield components: bran (BW), flour (FW), and three different types of semolina with particle sizes of 212 μm (SW1), 355 μm (SW2), and 500 μm (SW3). Three indicators for classifying the end products of the milling process were applied: particle size index (PSI), total semolina yield (SY), and unpurified middlings yield (UMY). In the present study, milling yield components denote the percentage of three T. durum yield components: bran (BY), flour (FY), and semolina (SY).
The analyzed agronomic factors affected milling yield components. In the treatments without nitrogen fertilization and with a nitrogen rate of 80 kg N ha−1, durum wheat grain was characterized by a relatively higher content of bran and type 1 semolina (Table 3).
Similarly to grain quality parameters, milling value parameters were influenced by nitrogen fertilization (with the exception of SY), whereas flour weight and the PSI of semolina were determined by the application of the growth regulator. These observations could imply that fertilization rates did not affect total semolina weight but differentiated the weight of the three types of semolina.
In general, an increase in the nitrogen rate from 0 to 80 kg N ha−1 and from 0 to 120 kg N ha−1 was accompanied by a decrease in bran weight (−1% and −4%), weight of type 1 semolina (−1% and −18%), and unpurified middlings weight (0 and −6%), as well as an increase in flour weight (45% and 32%), weight of type 2 semolina (2% and 5%), weight of type 3 semolina (10% and 3%), and the particle size index (12% and 28%). At the same time, the growth regulator decreased flour weight (−21%) and the particle size index (−21%).
The PSI denotes the milling yield of grain, which is directly associated with grain hardness and flour granulation. In the analyzed agronomic treatments, the PSI of durum wheat grain ranged from 1.7 to 13.6, with a mean value of 5.7. These results imply that durum wheat grain can be classified as hard or very hard regardless of the applied treatments, nitrogen rate, and the presence or absence of the growth regulator.
The milling value of durum wheat cv. SMH 87 was also determined based on UMY (125–550 μm). Grain with a higher UMY is characterized by higher milling value. In this study, UMY values were low (35.6–37.9%), and they decreased significantly (by approx. 6%) in response to the highest nitrogen rate of 120 kg N ha−1. In the work of Rachoń et al. [2] UMY reached 61%, which testifies to the high milling value of the examined durum wheat cultivars.
The gluten index represents the rheological properties and culinary value of pasta [51], and this parameter was influenced by different factors than the PC of grain. Considerable differences in GI values were noted across the treatments without nitrogen fertilization. In unfertilized treatments, GI values were 10% higher than in treatments fertilized with 80 kg N ha−1, and 62.6% higher than in treatments fertilized with 120 kg N ha−1. This parameter was also 87.8% higher in treatments without the growth regulator than in treatments where the growth regulator was applied. The above differences in GI values in response to changes in agronomic factors confirm the previous observation that this grain quality parameter was strongly determined by the tested agronomic treatments.
The nitrogen rate of 80 kg N ha−1 significantly increased (by 9%) the content of GW and GD, and the value of GWC. However, further changes in these parameters were not observed when the nitrogen rate was increased to 120 kg N ha−1. In turn, gluten-related parameters decreased by 5% in treatments with the highest sowing density. These parameters responded differently only to the growth regulator. In treatments with the growth regulator, GW content was 7% lower, whereas GD content and GWC were 3–5% higher than in treatments where the growth regulator was not applied. Woźniak [52] found that an increase in the nitrogen rate from 90 to 140 kg N ha−1 combined with chemical crop protection increased the GW content of durum wheat grain by 4.2%. It should also be noted that the ratio of GW content to PC is a useful indicator of flour quality [53]. In a study by Mohan and Gupta [54], the ratio of GW content to PC in bread wheat grain ranged from 2.50 to 2.70.
The tested agronomic treatments of T. durum affected grain quality parameters, but they did not induce significant differences in the content of macronutrients or micronutrients in grain. Simple correlation coefficients were estimated and decomposed into direct and indirect effects to explore the relationships between grain quality parameters, nutrient content, and milling yield components (Table 4, Figure 2). The presence of a significant correlation between GW content, GD content, and GWC resulted from strong collinearity between these parameters. Therefore, in the correlation analysis, only GI was considered as a gluten-related parameter.
An analysis of the correlations between grain quality parameters and milling yield components revealed that TGW and FN were positively correlated with flour yield (0.537 and 0.603, respectively), and grain vitreousness was negatively correlated with bran yield (−0.484), whereas grain quality parameters and semolina yield were not bound by significant correlations. A similar correlation analysis conducted by Aalami et al. [13] demonstrated that TGW and vitreousness were significantly correlated with SY, and the corresponding correlation coefficients were 0.81 and 0.61. Grain vitreousness was also positively correlated (0.84) with the PC of semolina [3].
None of the analyzed micronutrients and macronutrients were correlated with bran yield; flour yield was positively correlated with the content of P (0.708), Cu (0.625), and Fe (0.560), and semolina yield was negatively correlated with P content (−0.514). The decomposition of correlation coefficients into direct and indirect effects revealed a hidden pattern of relationships in the determination of milling yield components (Figure 3).
The percentage share of bran, flour, and semolina was determined by relatively strong direct and indirect effects of three grain quality parameters: vitreousness, protein content, and ash content. These effects differed in sign, magnitude, and dominancy (Figure 3a). PC and AC had the greatest direct and indirect effects on bran yield. In general, these parameters exerted mutually antagonistic effects, and AC had a high positive effect on the correlation between bran yield and V, PC, and AC. The significant simple negative correlation between vitreousness and bran yield resulted from the negative direct effect of vitreousness and the negative indirect effect of PC, which surpassed the positive effect of AC. Only the FN had a dominant direct effect and a marginal indirect effect on the remaining parameters. In the determination of flour yield, the dominant positive effect of vitreousness was balanced by the negative effects of PC and AC, whereas semolina yield was determined by the strong positive effect of PC balanced by the negative effects of V and AC. Relatively strong effects were noted for the GI. In the determination of bran yield, the positive indirect effect of PC was masked by the negative indirect effect of AC, whereas a reverse relationship with the dominant negative effect of PC was noted for semolina yield. According to Mariani et al. [55], gluten content is strongly influenced by genotype, but it is also correlated with the PC of grain. In the work of Makowska et al. [44], wet gluten content was positively correlated with the nitrogen rate and protein content.
Macronutrients exerted varied effects on milling yield components. The results indicate that Ca and K exerted positive effects on bran yield, P on flour yield, and Mg on semolina yield. In the group of micronutrients, Cu and Zn content exerted dominant effects. The positive effect of Cu content determined flour yield, and the positive effect of Zn content determined bran yield. In the determination of semolina yield, all effects of micronutrients were negative, and the negative effect of Cu content was dominant. The results of correlation analyses conducted by other authors point to the presence of correlations between the studied nutrients [21]. A positive correlation was reported between Zn content and the content of P (0.40), Ca (0.63), Cu (0.28), Fe (0.49), Mg (0.76), and Mn (0.44). The correlation coefficients describing the relationship between grain yield and the content of P, C, Mg, Na, and Zn were relatively low and ranged from 0.24 (Ca) to 0.53 (Mg).
The principal component analysis of grain quality, milling value parameters, and agronomic treatments revealed that the first three principal components explained 67.5% of total variance. The loading vectors of grain quality and milling value parameters (vectors), and the factorial scores of agricultural treatments (black dots) for the first two principal components, are presented in Figure 4.
The first principal component (PC1: 32.4%) was positively correlated with type 1 semolina weight (0.895) and bran weight (0.484), and it was negatively correlated with vitreousness (−0.827), type 3 semolina weight (−0.810), protein content (−0.777), parameters associated with gluten weight (GWC: –0.747, WG: −0.752, DG: −0.740), thousand grain weight (−0.671), and flour weight (−0.552). PC1 discriminated between treatments without the application of the growth regulator and without nitrogen fertilization (000, 001, and 002) or treatments with the application of the growth regulator and without nitrogen fertilization (100, 101, and 102), which contributed to the highest weight of type 1 semolina and the highest bran weight, whereas the treatment with the application of the growth regulator and the highest nitrogen rate (120, 121, and 122) contributed to the highest weight of type 3 semolina, as well as the highest vitreousness, protein content, ash content, and parameters associated with gluten weight. Consequently, treatments without the application of the growth regulator and with the highest nitrogen rate (020, 021, and 022) made the greatest contribution to thousand grain weight, flour weight, falling number, and type 2 semolina weight. These observations suggest that data points where the first coordinates are positive correspond to milling products composed of SW1 and BW, whereas data points where the first coordinates are negative correspond to grain quality parameters (V, TGW, PC, GW, GWC, and GD) correlated with milling products (SW3, FW, and SW2). Therefore, the discrimination by PC1 into two groups of milling parameters can be associated with sifting and grading final milling products.
The second principal component (PC2: 19.9%) was highly negatively associated with the gluten index (−0.598), the content of copper (−0.871), phosphorus (−0.630), and iron (−0.583), and it was positively associated with protein content (0.566), ash content (0.585), and calcium content (0.484). Negative correlations between PC2 and the above parameters were noted in treatments without the application of the growth regulator and in treatments with a medium nitrogen rate (010, 011, and 012), whereas positive correlations were noted in treatments with the application of the growth regulator and with a medium nitrogen rate (110, 111, and 112). It can be assumed that PC2 discriminated between grain quality parameters PC and AC that were correlated with macronutrients Ca and Mg, and the gluten index that was correlated with micronutrients Cu and Fe.
It is worth noting that the third principal component, which was strongly correlated with gluten parameters (GW: 0.580, GD: 0.592, and GWC: 0.565), micronutrients (Zn: 0.681 and Mn: 0.543) and bran weight (0.629), also made a relatively high contribution to total variance (PC3: 15.2%). The agronomic treatments with optimal values of the above parameters were differentiated mostly by sowing density in treatments without the application of the growth regulator, without nitrogen fertilization, or with a nitrogen rate of 80 kg N ha−1.

4. Conclusive Summary

The variability in grain and milling parameters was induced mainly by environmental factors (40–93%) associated with soil conditions and climate. The only exception was the gluten index, where environmental variance accounted for less than 10% of total variance. Environmental factors induced the greatest variability in thousand grain weight, weight of type 2 and type 3 semolina, and bran weight. The percentage of variance resulting from differences between agronomic treatments in total variance was highest in the gluten index (59%), followed by grain vitreousness (25%), flour weight (15%) and particle size index (15%).
The estimated correlations between grain quality parameters, macronutrients, micronutrients, and milling yield components can be attributed to a specific configuration of direct and indirect effects of other parameters. Vitreousness, protein content, and ash content were the main grain quality parameters that were associated with bran, flour, and semolina yield in different ways.
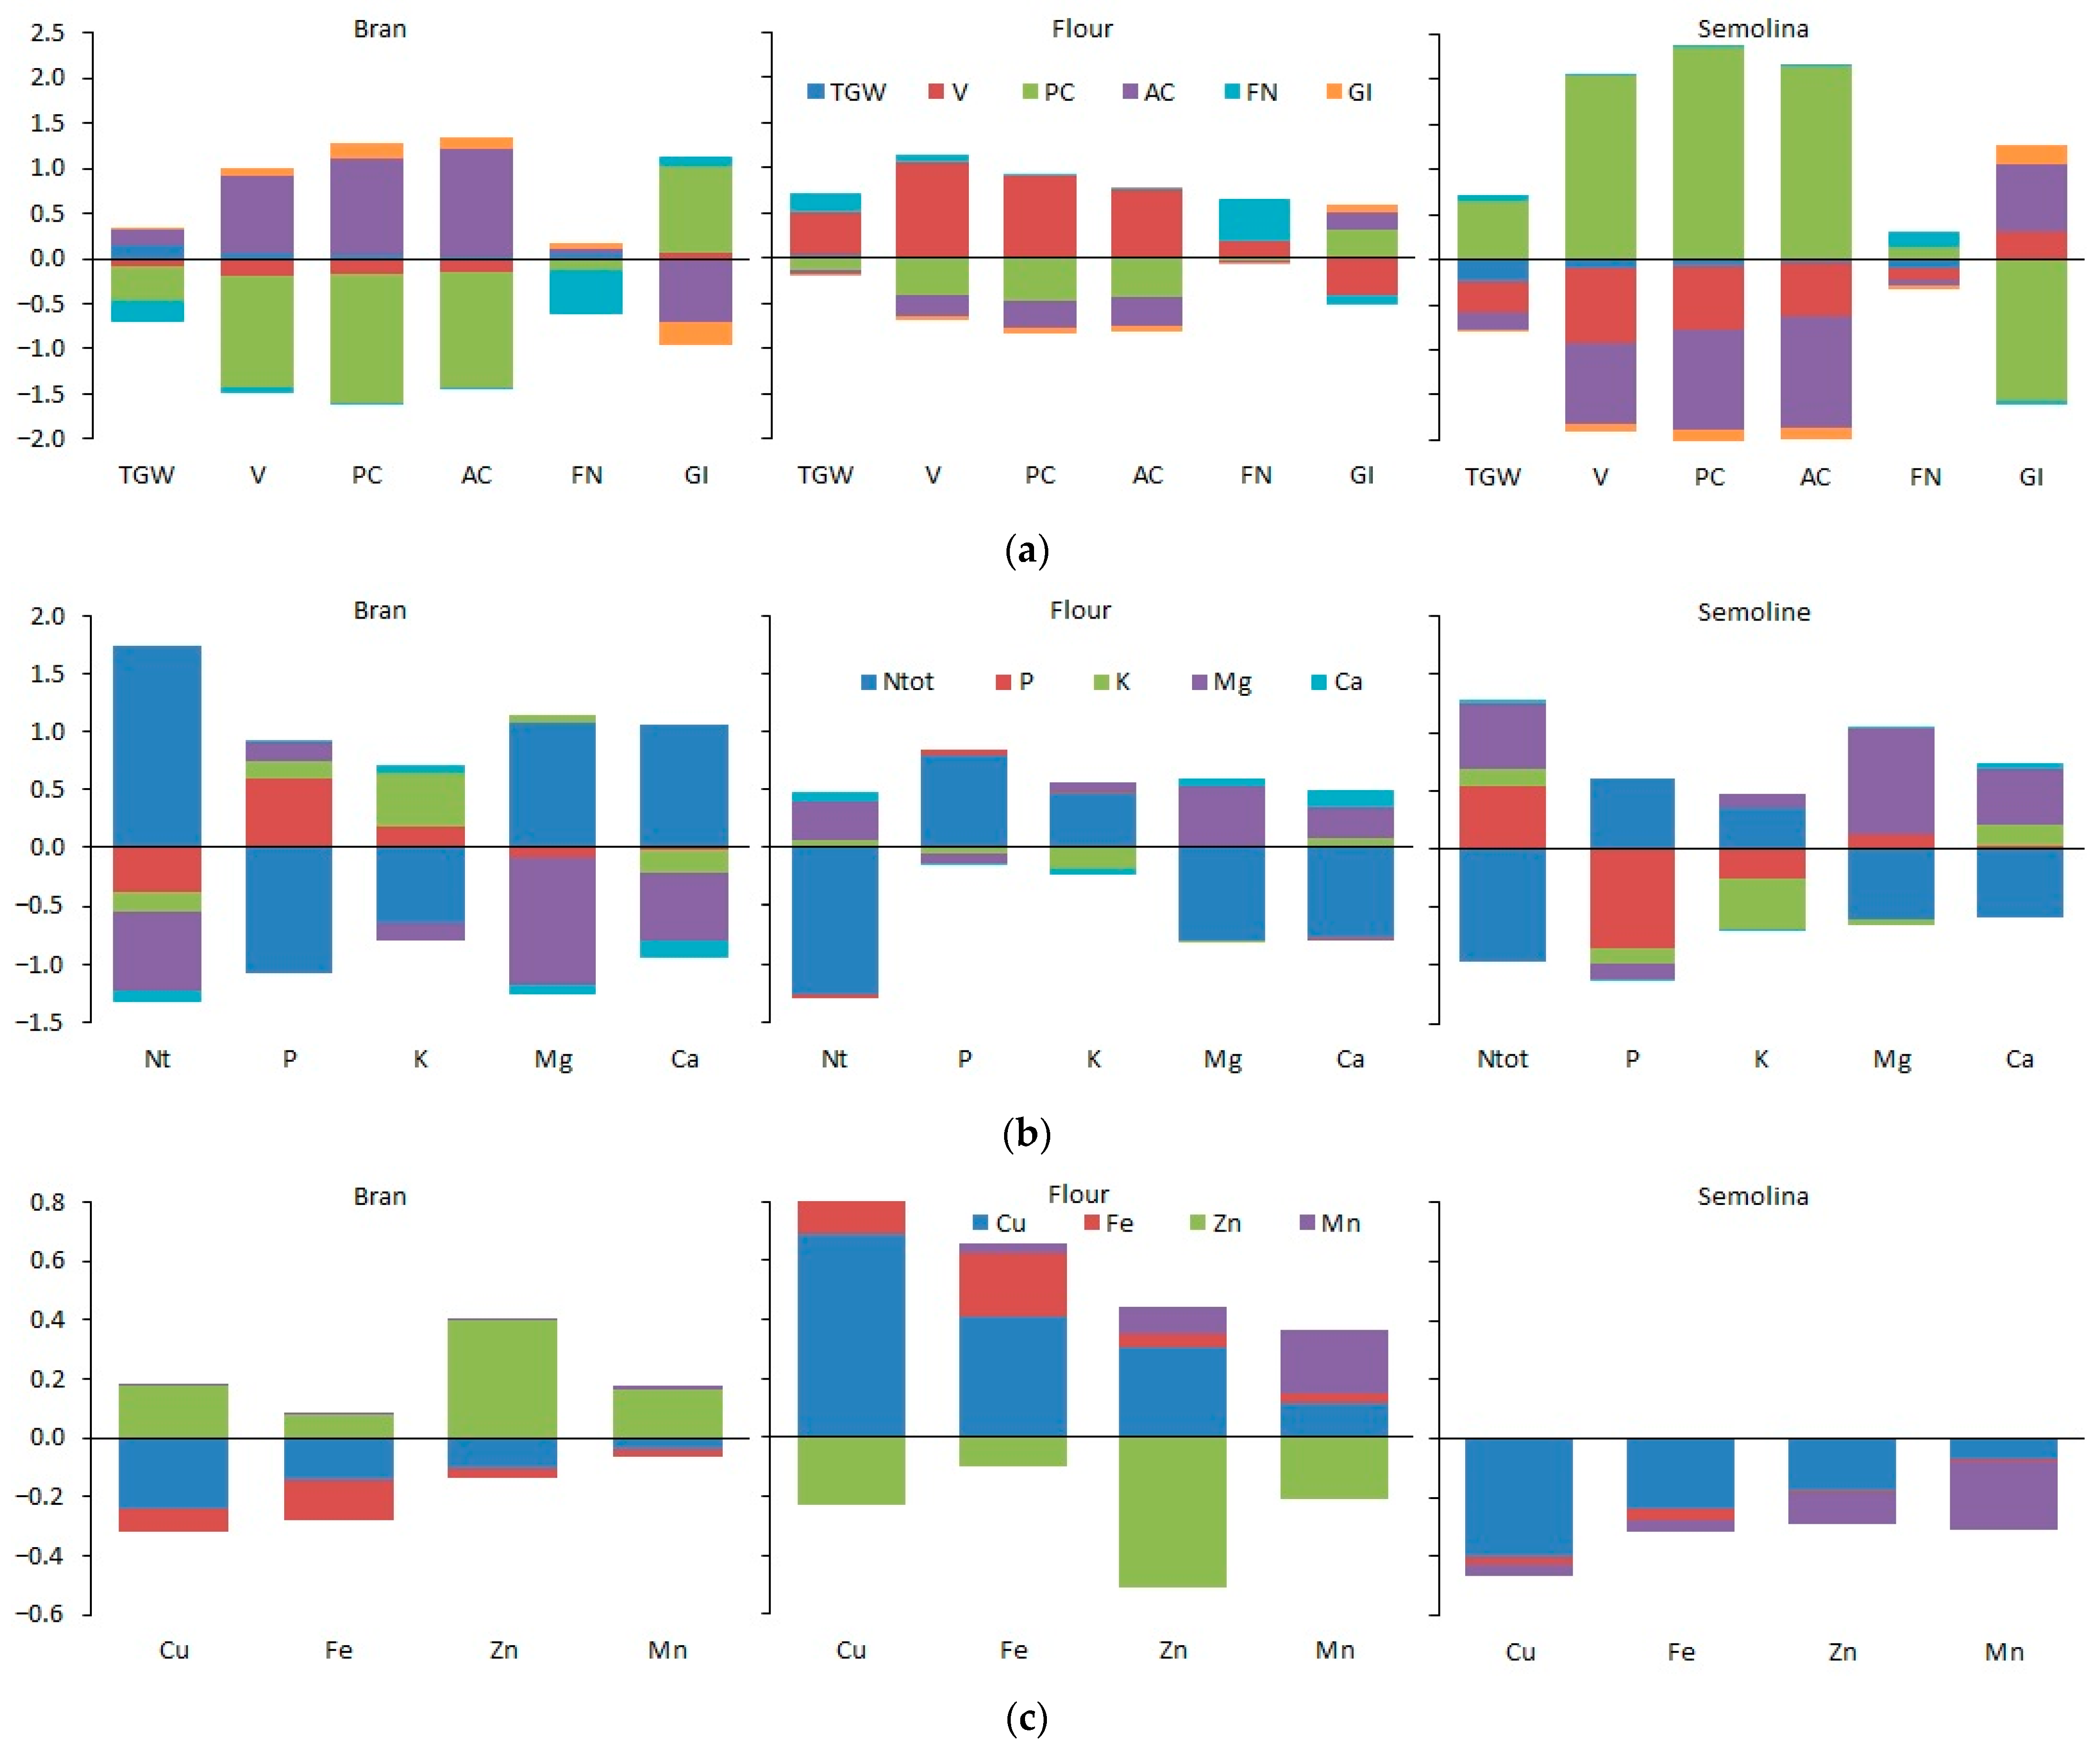
  • Bran yield was determined by high direct and indirect effects of protein content and ash content that exerted mutually antagonistic effects. Regarding macronutrients, calcium exerted a relatively strong positive direct effect, whereas magnesium exerted a negative direct effect. Zinc was the only micronutrient that exerted positive direct and indirect effects.
  • Flour yield was determined by the high positive effect of vitreousness, which was masked by the negative effects of protein content and ash content. Regarding nutrients, positive effects were associated mainly with phosphorus and copper, whereas negative effects were associated mainly with zinc.
  • Semolina yield was strongly determined by the direct and indirect effects of protein content that were masked by the negative effects of ash content and vitreousness. In addition, the correlation between semolina content and nutrients was explained by the dominant positive direct effect of magnesium content and the negative effect of copper content.
The first three components in the principal component analysis of grain quality, macronutrients, micronutrients, milling value parameters, and agronomic treatments explained 67.5% (32.4%, 19.9%, and 15.2%, respectively) of total variance.
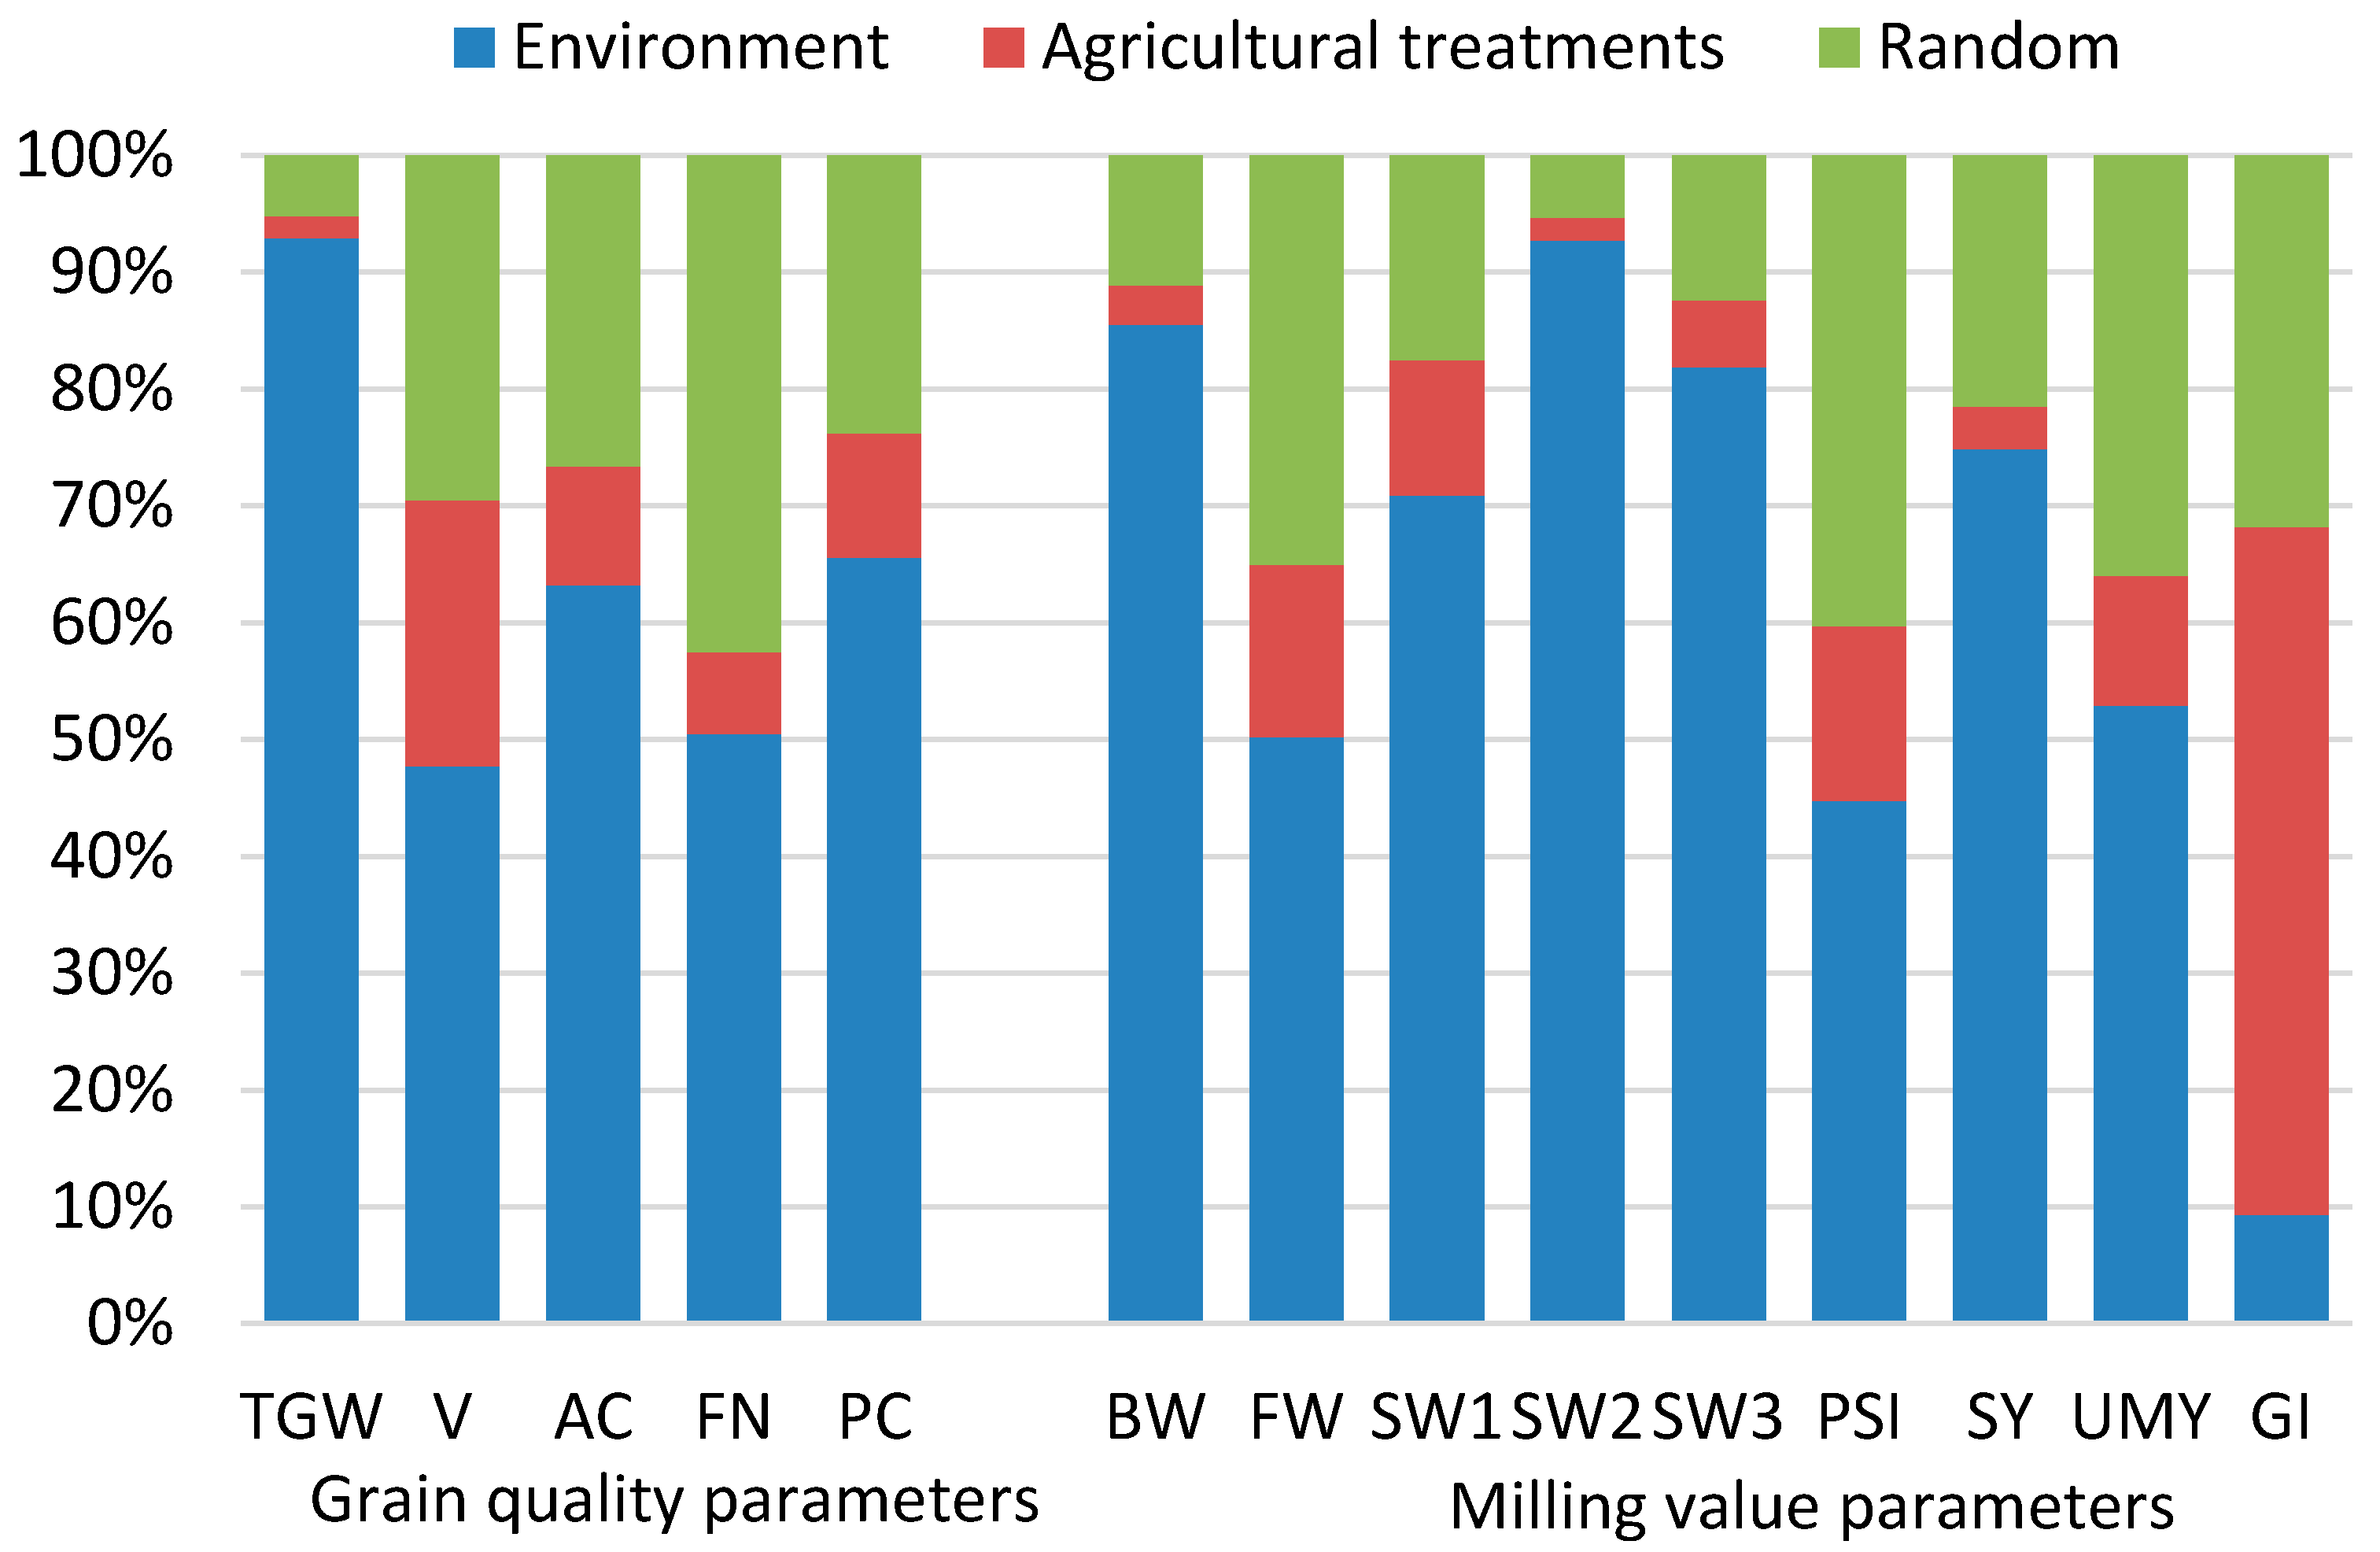
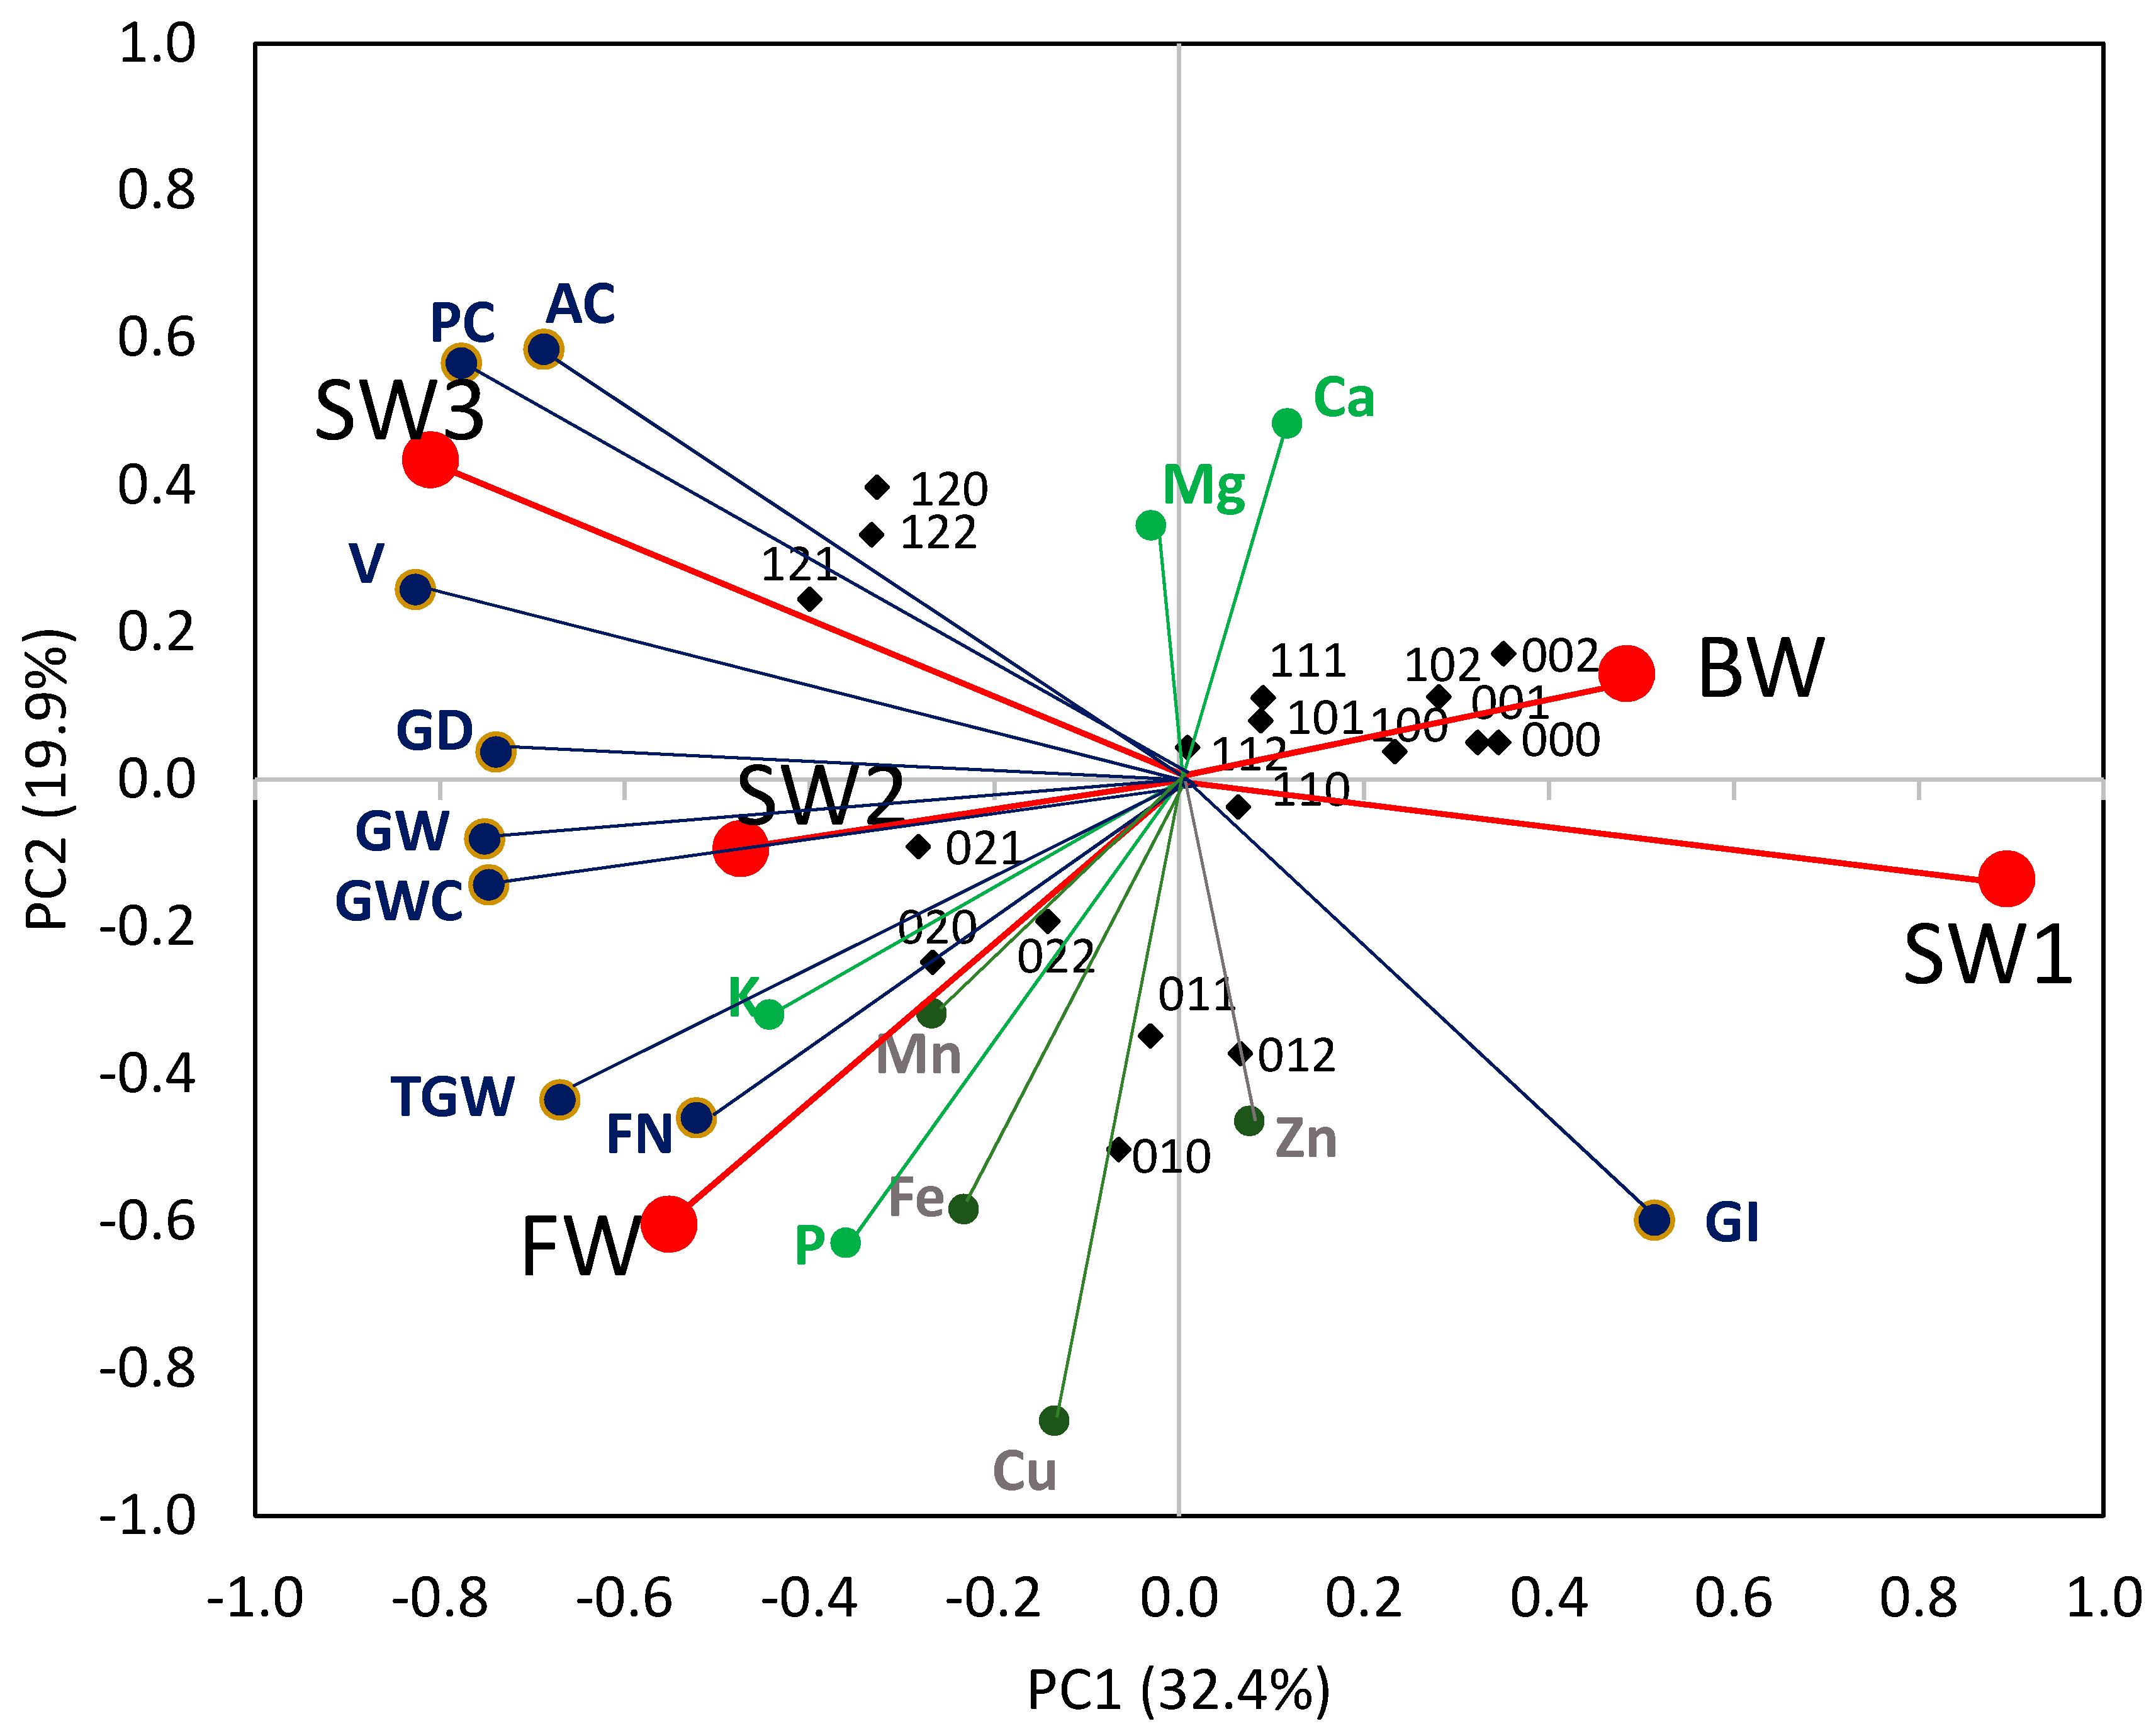
  • The first principal component discriminated between two groups of milling value parameters associated with sifting, i.e., separation of bran and type 1 semolina from other milling components, and the grading of final milling products, i.e., type 3 semolina, flour, and type 2 semolina. The two groups of parameters were correlated with the treatments without nitrogen fertilization and with or without the growth regulator, and with the treatments where the growth regulator and the highest nitrogen rate (120 kg N ha−1) were applied, respectively. At the same time, the treatments without the growth regulator and with the highest nitrogen rate made the greatest contribution to the high values of thousand grain weight, flour weight, falling number, and type 2 semolina weight.
  • The second principal component discriminated between the following grain quality parameters: protein content and ash content correlated with calcium and magnesium content, and the gluten index correlated with copper and iron content. These parameters were optimized in treatments without the growth regulator and with a medium nitrogen rate (80 kg N ha−1), and in treatments with the growth regulator and a medium nitrogen rate, respectively.
  • The third principal component discriminated between gluten parameters, zinc and manganese content, and bran weight. The agronomic treatments correlated with these parameters were differentiated by sowing density in treatments without growth regulator, without nitrogen fertilization or with a medium nitrogen rate.

Supplementary Materials

The following supporting information can be downloaded at: https://www.mdpi.com/article/10.3390/agronomy12071622/s1, Table S1: Symbols of durum wheat grain parameters and agronomic treatments; Table S2: Analysis of variance for grain and milling value parameters, Table S3: Matrices of simple correlation coefficients and estimates of main effects (n = 18 agronomic treatments); Table S4: PC1-3 loadings.

Author Contributions

Conceptualization, K.Ż.-G.; methodology, J.B. and K.Ż.-G.; validation, J.G; investigation, K.Ż.-G., K.S.B. and J.G.; data curation, J.B. and J.G.; writing—original draft preparation, K.S.B., K.Ż.-G., and J.G.; writing—review and editing, K.Ż.-G. and J.G.; visualization, J.G. All authors have read and agreed to the published version of the manuscript.

Funding

The results presented in this paper were obtained as part of a comprehensive study financed by the University of Warmia and Mazury in Olsztyn, Faculty of Agriculture and Forestry, Department of Agrotechnology and Agribusiness (grant No. 30.610.013−110), and the Department of Genetics, Plant Breeding and Bioresource Engineering (grant No. 30.610.007−110). The project was financially supported by the Minister of Education and Science under the program entitled “Regional Initiative of Excellence” for the years 2019–2022, Project No. 010/RID/2018/19, with the amount of funding of PLN 12,000,000.

Institutional Review Board Statement

Not applicable.

Informed Consent Statement

Not applicable.

Data Availability Statement

The data that support the findings of this study are available from the corresponding author, JG, upon reasonable request.

Conflicts of Interest

The authors declare no competing financial interest.

References

  1. Alzuwaid, N.T.; Pleming, D.; Fellows, M.C.; Sissons, M. Fortification of durum wheat spaghetti and common wheat bread with wheat bran protein concentrate-impacts on nutrition and technological properties. Food. Chem. 2021, 334, 127497. [Google Scholar] [CrossRef] [PubMed]
  2. Rachoń, L.; Dziamba, S.; Obuchowski, W.; Kołodziejczyk, P. Ocena przydatności ziarna odmian pszenicy twardej (Triticum durum) i zwyczajnej (Triticum aestivum ssp. vulgare) do produkcji makaronu. Ann. UMCS Sec. E 2002, 57, 77–86. [Google Scholar]
  3. Samaan, J.; El-Khayat, G.H.; Manthey, F.A.; Fuller, M.P.; Brennan, C.S. Durum wheat quality: II. The relationship of kernel physicochemical composition to semolina quality and end product utilisation. J. Food Sci. Technol. 2006, 41, 47–55. [Google Scholar] [CrossRef]
  4. Boggini, G.; Tusa, P.; Pognal, N.E. Bread making quality of durum wheat genotypes with some novel glutenin subunit compositions. J. Cereal Sci. 1995, 22, 105–113. [Google Scholar] [CrossRef]
  5. Ruisi, P.; Ingraffia, R.; Urso, V.; Giambalvo, D.; Alfonzo, A.; Corona, O.; Settanni, L.; Frenda, A.S. Influence of grain quality, semolinas and baker’s yeast on bread made from old landraces and modern genotypes of Sicilian durum wheat. Food Res. Int. 2021, 140, 110029. [Google Scholar] [CrossRef] [PubMed]
  6. Banach, K.; Majewska, K.; Żuk-Gołaszewska, K. Effect of cultivation system on quality changes in durum wheat grain and flour produced in North-Eastern Europe. PLoS ONE 2021, 16, e0236617. [Google Scholar] [CrossRef]
  7. Segit, Z.; Szwed-Urbaś, K. Ocena cech jakościowych ziarna wybranych linii pszenicy twardej. Biuletyn IHAR 2006, 240/241, 75–82. [Google Scholar]
  8. Żuk-Gołaszewska, K.; Żerańska, A.; Krukowska, A.; Bojarczuk, J. Biofortification of the nutritional value of foods from the grain of Triticum durum Desf. by an agrotechnical method: A scientific review. J. Elem. 2016, 21, 963–975. [Google Scholar] [CrossRef]
  9. Graziano, S.; Marando, S.; Prandi, B.; Boukid, F.; Marmiroli, N.; Francia, E.; Pecchioni, N.; Sforza, S.; Visioli, G.; Gullì, M. Technological Quality and Nutritional Value of Two Durum Wheat Varieties Depend on Both Genetic and Environmental Factors. J. Agric. Food Chem. 2019, 67, 2384–2395. [Google Scholar] [CrossRef]
  10. Abaye, A.O.; Brann, D.E.; Alley, M.M.; Griffey, C.A. Winter Durum Wheat: Do We Have All the Answers? 1997; Publication 424–802. Available online: https://citeseerx.ist.psu.edu/viewdoc/download?doi=10.1.1.296.4795&rep=rep1&type=pdf (accessed on 4 January 2022).
  11. Dziki, D.; Laskowski, J. Wheat kernel physical properties and milling process. Acta Agrophys. 2005, 6, 59–71. [Google Scholar]
  12. Gerba, L.; Getachew, B.; Walelign, W. Nitrogen fertilization effects on grain quality of durum wheat (Triticum turgidum L. var. durum) varieties in central Ethiopia. Agric. Sci. 2013, 4, 123–130. [Google Scholar] [CrossRef] [Green Version]
  13. Aalami, M.; Prasada-Rao, U.J.S.; Leelavathi, K. Physicochemical and biochemical characteristics of Indian durum wheat varieties: Relationship to semolina milling and spaghetti making quality. Food Chem. 2007, 102, 993–1005. [Google Scholar] [CrossRef]
  14. Troccoli, A.; Borrelli, G.M.; De Vita, P.; Fares, C.; Di Fonzo, N. Durum Wheat Quality: A Multidisciplinary Concept. J. Cereal Sci. 2000, 32, 9–113. [Google Scholar] [CrossRef]
  15. Wang, K.; Taylor, D.; Chen, Y.; Suchy, J.; Fu, B.X. Effect of Kernel Size and Its Potential Interaction with Genotype on Key Quality Traits of Durum Wheat. Foods 2021, 10, 2992. [Google Scholar] [CrossRef]
  16. de Simone, V.; Menzo, V.; Leonardis, A.M.D.; Ficco, D.B.M.; Trono, D.; Cattivelli, L.; de Vita, P. Different mechanisms control lipoxygenase activity in durum wheat kernels. J. Cereal Sci. 2010, 52, 121–128. [Google Scholar] [CrossRef]
  17. Britton, G.; Liaaen-Jensen, S.; Pfander, H.P. (Eds.) Carotenoids; Birkheuser Verlag: Basel, Switzerland, 1995; Volumes I–II. [Google Scholar]
  18. Howitt, C.A.; Pogson, B.J. Carotenoid accumulation and function in seeds and non-green tissues. Plant Cell Environ. 2006, 29, 435–445. [Google Scholar] [CrossRef]
  19. Mellado-Ortega, E.; Hornero-Méndez, D. Lutein Esterification in Wheat Flour Increases the Carotenoid Retention and Is Induced by Storage Temperatures. Foods 2017, 6, 111. [Google Scholar] [CrossRef] [Green Version]
  20. Matsuo, R.R.; Dexter, J.E. Relationship between some durum wheat physical characteristics and semolina milling properties. Can. J. Plant Sci. 1980, 60, 49–53. [Google Scholar] [CrossRef]
  21. Ficco, D.B.M.; Riefolo, C.; Nicastro, G.; de Simone, V.; Gesu, A.M.; Beleggia, R.; Platani, C.; Cattivelli, L.; De Vita, P. Phytate and mineral elements concentration in a collection of Italian durum wheat cultivars. Field Crops Res. 2009, 111, 235–242. [Google Scholar] [CrossRef]
  22. Pataco, I.M.; Lidon, F.C.; Ramos, I.; Oliveira, K.; Guerra, M.; Pessoa, M.F.; Riefolo, C.; Nicastro, G. Biofortification of durum wheat (Triticum turgidum L. ssp. durum (Desf.) Husnot) grains with nutrients. J. Plant. Interact. 2017, 12, 39–50. [Google Scholar] [CrossRef]
  23. Bilgin, O.; Korkut, K.Z.; Baser, I.; Daglioglu, O.; Ozturk, I.; Kahraman, T.; Balkan, A. Variation and Heritability for Some Semolina Characteristics and grain yield and their relations in durum wheat (Triticum durum Desf.). World J. Agric. Sci. 2010, 6, 301–308. [Google Scholar]
  24. Fana, G.; Deressa, H.; Dargie, R.; Bogale, M.; Mehadi, S.; Getachew, F. Grain Hardness, Hectolitre Weight, Nitrogen and Phosphorus Concentrations of Durum Wheat (Triticum turgidum L. var. durum) as Influenced by Nitrogen and Phosphorus Fertilisation. World Appl. Sci. J. 2012, 20, 1322–1327. [Google Scholar] [CrossRef]
  25. Klikocka, H.; Marks, M.; Barczak, B.; Szostak, B.; Podleśna, A.; Podleśny, J. Response of spring wheat to NPK and S fertilization. The content and uptake of macronutrients and the value of ionic ratios. Open Chem. 2018, 16, 1059–1065. [Google Scholar] [CrossRef]
  26. White, P.J.; Broadley, M.R. Biofortification of crops with seven mineral elements often lacking in human diets-iron, zinc, copper, calcium, magnesium, selenium and iodine. New Phytol. 2009, 182, 49–84. [Google Scholar] [CrossRef]
  27. Dexter, J.E.; Symons, S.J. Impact of durum wheat test weight, kernel size, kernel weight and protein content on semolina milling quality. Arthur Miller J. 2007, 1, 27–33. [Google Scholar]
  28. Wang, K.; Fu, B.X. Inter-relationships between test weight, thousand kernel weight, kernel size distribution and their effects on durum wheat milling, semolina composition and pasta processing quality. Foods 2020, 9, 1308. [Google Scholar] [CrossRef]
  29. Peyron, S.; Mabille, F.; Rouau, J.; Autran, C.; Abecassis, J. Relationship between the Structure and Rheological Properties of Durum Wheat Bran. Durum Wheat Semolina and Pasta Quality. Recent Achievements and New Trends; INRA: Montpellier, France; Paris, France, 2001; Volume 2, pp. 113–117. [Google Scholar]
  30. Podolska, G.; Wyzińska, M. 2013. The influence of nitrogen fertilization on selected grain quality parameters of hard wheat (Triticum durum Desf.) cv. Komnata. Fragm. Agronom. 2013, 30, 148–158. [Google Scholar]
  31. Jarecki, W.; Buczek, J.; Bobrecka-Jamro, D. Influence of nitrogen fertilization on yield of durum wheat (Triticum durum Desf.). Fragm. Agron. 2013, 30, 68–75. [Google Scholar]
  32. Ottman, M.J.; Doergeand, T.; Martin, E.C. Durum grain quality as affected by nitrogen fertilization near anthesis and irrigation during grain fill. Agron. J. 2000, 92, 1035–1041. [Google Scholar] [CrossRef]
  33. Ghaffari, A.; Cook, H.F.; Lee, H.C. Simulating Winter Wheat Yields under Temperate Conditions: Exploring Different Management Scenarios. Eur. J. Agron. 2001, 15, 231–240. [Google Scholar] [CrossRef]
  34. Arduini, I.; Masoni, A.; Ercoli, L.; Mariotti, M. Grain Yield, and Dry Matter and Nitrogen Accumulation and Remobilization in Durum Wheat as Affected by Variety and Seeding Rate. Eur. J. Agron. 2006, 25, 309–318. [Google Scholar] [CrossRef]
  35. Panasiewicz, K.; Koziara, W.; Sulewska, H. Reakcja pszenicy ozimej Triticum durum Desf. odmiany Komnata na gęstość siewu i nawożenie azotem. Biuletyn IHAR 2009, 253, 125–134. [Google Scholar]
  36. Voronov, S.I.; Vlasova, O.I.; Shtyrkhunov, V.D.; Govorkova, S.B.; Savinov, E.V. The effect of growth regulators with retardant properties on the growth and development of winter wheat. IOP Conf. Ser. Earth Environ. Sci. 2021, 843, 012022. [Google Scholar] [CrossRef]
  37. Bożek, K.S.; Żuk-Gołaszewska, K.; Bochenek, A.; Gołaszewski, J.; Kalaji, K.M. Modelling the growth, development and yield of Triticum durum Desf under the changes of climatic conditions in North-Eastern Europe. Sci. Rep. 2021, 11, 21753. [Google Scholar] [CrossRef] [PubMed]
  38. AACC International. AACC Approved Methods of Analysis, 11th ed.; Cereals & Grains Association: St. Paul, MN, USA, 2011. [Google Scholar]
  39. Canadian Grain Commission. Methods−Wheat—2004. Available online: https://grainscanada.gc.ca/en/grain-research/export-quality/methods-tests.html (accessed on 4 January 2022).
  40. ISO 9001: 2015—Quality Management System. Available online: https://www.iso.org/standard/62085.html (accessed on 4 January 2022).
  41. Williams, P.C.; Sobering, D.C. Attempts at standardization of hardness testing of wheat. I. The grinding/sieving (particle size index) method. Cereal Foods World 1986, 31, 362–364. [Google Scholar]
  42. Everitt, B.S.; Dunn, G. Applied Multivariate Data Analysis; Oxford University Press: New York, NY, USA, 1992. [Google Scholar]
  43. Dell Inc. Dell Statistica (Data Analysis Software System), Version 13. 2016. Available online: https://www.unipo.sk/public/media/22108/statistica_cnet_installation_instructions.pdf4 (accessed on 4 January 2022).
  44. Makowska, A.; Obuchowski, W.; Sulewska, H.; Koziara, W.; Paschke, H. Effect of nitrogen fertilization of durum wheat varieties on some characteristics important for pasta production. Acta Sci. Pol. Technol. Aliment. 2008, 7, 29–39. [Google Scholar]
  45. Rachoń, L.; Bobryk-Mamczarz, A.; Kiełtyka-Dadasiewicz, A. Ocena krajowej odmiany Triticum durum ’SMH87’ jako surowca do produkcji makaronu. Agron. Sci. 2021, 76, 5–16. [Google Scholar] [CrossRef]
  46. Subira, J.; Peña, R.J.; Álvaro, F.; Ammar, K.; Ramdani, A.; Royo, C. Breeding progress in the pasta-making quality of durum wheat cultivars released in Italy and Spain during the 20th Century. Crop Pasture Sci. 2014, 65, 16–26. [Google Scholar] [CrossRef] [Green Version]
  47. Obuchowski, W. Ocena jakości surowców zbożowych wykorzystywanych do produkcji makaronu. Prz. Zboż. Młyn. 2000, 1, 32–34. [Google Scholar]
  48. Feillet, P.; Autran, J.; Icard-Verniere, C. Pasta Brownness: An Assessment. Mini Review. J. Cereal Sci. 2000, 32, 215–233. [Google Scholar] [CrossRef]
  49. Rachoń, L. Studia nad plonowaniem i jakością pszenicy twardej (Triticum durum Desf.). Rozp. Nauk AR Lublinie 2001, 248. [Google Scholar]
  50. Sulewska, H.; Koziara, W.; Bojarczuk, J. Kształtowanie plonu i jakości ziarna wybranych genotypów Triticum durum Desf. w zależności od nawożenia azotem i gęstości siewu. Biuletyn IHAR 2007, 245, 17–28. [Google Scholar]
  51. Cecchini, C.; Bresciani, A.; Menesatti, P.; Pagani, M.A.; Marti, A. Assessing the Rheological Properties of Durum Wheat Semolina: A Review. Foods 2021, 10, 2947. [Google Scholar] [CrossRef] [PubMed]
  52. Woźniak, A. Plonowanie i jakość ziarna pszenicy jarej zwyczajnej (Triticum aestivum L.) i twardej (Triticum durum Desf.) w zależności od poziomu agrotechniki. Acta Agrophys. 2006, 8, 755–763. [Google Scholar]
  53. Guo, J.; Wang, F.; Zhang, Z.; Wu, D.; Bao, J. Characterization of gluten proteins in different parts of wheat grain and their effects on the textural quality of steamed bread. J. Cereal Sci. 2021, 102, 103368. [Google Scholar] [CrossRef]
  54. Mohan, D.; Gupta, R.K. Understanding dynamics of gluten harvest in augmenting bread quality in high yielding Indian wheats. Indian J. Genet. Plant Breed. 2015, 75, 318–323. [Google Scholar] [CrossRef] [Green Version]
  55. Mariani, B.M.; D’Egidio, M.G.; Novaro, P. Durum wheat quality evaluation: Influence of genotype and environment. Cereal Chem. 1995, 72, 194–197. [Google Scholar]
Figure 2. Percentage contribution of environmental, agronomic, and random factors to total variance in grain quality and milling value parameters. Refer to Table 1 for the key and to Table S2 in the Supplementary Material for the sums of squares used in the calculation of eta-squared.
Agronomy 12 01622 g002
Figure 3. Decomposition of correlation coefficients into direct and indirect effects of: (a) grain quality parameters and milling yield components, (b) macronutrients and milling yield components, and (c) micronutrients and milling yield components (the direct effect of a given independent variable is marked in color and denoted on the X-axis). Refer to Table 1 for the key and to Figure 1 for the diagram of direct and indirect effects (e.g., bran in Figure 3a: TGW values marked in blue on the X-axis indicate a direct effect, whereas the parameters marked in other colors indicate indirect effects).
Agronomy 12 01622 g003
Figure 4. PCA biplot of 9 grain quality parameters (blue lines: TGW, V, PC, AC, GI, GW, GD, and GWC), 4 macronutrients (green lines: P, K, Mg, and Ca), 4 micronutrients (brown lines: Cu, Fe, Mn, and Zn), and 5 milling weight components (red lines: BW, FW, SW1, SW2, and SW3) assessed in 18 agronomic treatments (treatment levels are marked with symbols: e.g., “000” denotes a treatment without the growth regulator, without nitrogen fertilization, and with a sowing density of 350 seeds per m2). Please refer to Table 1 for the key.
Agronomy 12 01622 g004
Table 2. Variability in the mean values of grain quality and milling value parameters across agronomic treatments.
No.Agronomic Treatments (Treatment Level )Grain Quality ParametersMilling Value and Gluten Quality Parameters
TGW gV %AC %FN %PC %BWg FW gSW1 gSW2 gSW3 gPSI %SY %UMY %GW %GD %GWC %GI %
1R0N0D350 (000)44.954.51.8322014.057050.33173284015.1162.438.619.86.6513.233.3
2R0N0D450 (001)44.060.01.8922514.257348.63053314124.8262.438.019.46.7512.732.6
3R0N0D550 (002)43.753.01.8722614.156756.33053423965.7362.138.519.06.4212.627.9
4R0N80D350 (010)46.055.01.9024114.158956.92973244055.6360.836.523.57.9015.634.4
5R0N80D450 (011)45.252.51.8724314.056071.72883493997.0061.737.621.57.3114.227.2
6R0N80D550 (012)44.753.51.8324113.955766.63073353976.8061.938.121.47.2714.127.1
7R0N120D350 (020)46.071.51.9223814.856375.72503374437.4661.134.721.77.2914.420.9
8R0N120D450 (021)46.370.51.8624014.753673.72563734277.1162.937.522.57.6814.815.9
9R0N120D550 (022)45.867.51.9323814.955172.62573514367.0762.136.220.97.0713.829.3
10R1N0D350 (100)44.453.01.8821114.458044.93103244104.6062.137.621.17.2413.929.8
11R1N0D450 (101)44.457.51.9121614.558247.43003264154.7162.037.421.87.5314.215.6
12R1N0D550 (102)42.949.51.8723514.258348.93033264054.9261.737.520.26.8813.312.1
13R1N80D350 (110)44.853.51.9123114.456347.73173384044.7363.138.822.37.5614.825.5
14R1N80D450 (111)45.549.01.8723814.458141.13093304074.1562.337.922.47.7614.712.8
15R1N80D550 (112)45.152.01.9223814.555855.13073514025.2962.938.721.37.3014.010.2
16R1N120D350 (120)45.374.52.0323115.556355.42483524545.4862.435.422.57.7014.89.6
17R1N120D450 (121)45.275.52.0523015.457556.32473294625.5561.634.223.58.0615.48.0
18R1N120D550 (122)44.672.02.0024115.354757.12503434715.6063.435.421.87.6114.29.0
Femp.2.212.322.290.992.671.822.533.962.322.762.231.001.854.224.913.712.17
p-value0.0080.0110.0060.4760.0010.0360.0020.0000.0050.0010.0070.4640.0320.0000.0000.0010.027
LSD0.051.6317.440.105-0.900.90018.8638.124.140.21.89-2.921.760.5791.2418.44
Refer to Table 1 for the key. Description of agronomic treatments, e.g., R0N0D350 (000): treatment without the growth regulator (0), without nitrogen fertilization (0), and with a sowing density of 350 germinating seeds per m2 (0).
Table 3. Comparison of treatment means for grain quality and milling value parameters.
Quality ParameterUnitTreatments
N0N80N120D350D450D550R0R1
Grain Quality Parameters
TGWg44.1b45.2a45.5a45.345.144.545.244.7
V%54.6b52.6b71.9a60.360.857.959.859.6
AC%1.88b1.88b1.96a1.911.911.91.88b1.94a
FNs222b239a236a229232236235230
PC%14.2b14.2b15.1a14.514.514.514.3b14.7a
Milling Value Parameters
BWg576a568a556b571568561563570
FWg49.4b56.5b65.1a55.156.559.463.6a50.4b
SW1g307a304a251b290284288287288
SW2g330b338ab347a334340341341336
SW3g407b403b449a420421418413426
PSI%4.98b5.60ab6.38a5.505.565.906.30a5.00b
SY%62.162.162.362.062.262.461.962.4
UMY%37.9a37.9a35.6b36.937.137.437.337.0
Gluten Quality
GW%20.2b22.1a22.2a21.8a21.9a20.8b21.9a20.2b
GD%6.91b7.52a7.57a7.39a7.52a7.09b7.15b7.52a
GWC%13.3b14.5a14.6a14.4a14.3a13.7b13.9b14.4a
GI%25.2a22.9ab15.5b25.618.719.327.6a14.7b
Refer to Table 1 for the key. Means with the same letter are not significantly different from each other (Fisher’s LSD procedure at α = 0.05).
Table 4. Correlation matrix of grain quality parameters, macronutrients, micronutrients, and milling yield components (n = 18).
ParameterPearson’s Correlation CoefficientsDirect Effects
BYFYSYBYFYSY
TKW−0.3850.537 *−0.0490.1420.046−0.235
V−0.484 *0.4620.160−0.1961.044 *−0.825
PC−0.3470.1170.337−1.419−0.4692.363 *
AC−0.102−0.0240.1601.186 *−0.325−1.230
FN−0.4630.603 *−0.014−0.5050.485*0.163
GI0.1810.092−0.335−0.2370.0950.215
Pe = 0.223 R2 = 0.603 p < 0.067Pe = 0.127 R2 = 0.762 p < 0.006Pe = 0.364 R2 = 0.405 p < 0.355
P−0.1680.708 *−0.514 *−0.2840.704 *−0.356
K−0.0790.318−0.2260.234−0.010−0.300
Mg−0.120−0.2280.396−0.4140.0230.523
Ca0.117−0.2860.1430.422−0.277−0.270
Pe = 0.642
R2 = 0.128
p < 0.751
Pe = 0.246
R2 = 0.569
p < 0.020
Pe = 0.352
R2 = 0.419
p < 0.108
Cu−0.1410.625 *−0.462−0.2380.689 *−0.402
Fe−0.2010.560 *−0.316−0.1400.213−0.036
Zn0.268−0.067−0.2840.397−0.507 *0.002
Mn0.1130.154−0.3090.0110.215−0.237
Pe = 0.588
R2 = 0.169
p < 0.629
Pe = 0.215
R2 = 0.616
p < 0.010
Pe = 0.355
R2 = 0.270
p < 0.356
BY1−0.665 *−0.631 *
FY−0.665 *1−0.160
SY−0.631 *−0.1601
* Significant at p < 0.05. Refer to Figure 1 and Table 1 for the key.
Publisher’s Note: MDPI stays neutral with regard to jurisdictional claims in published maps and institutional affiliations.

