Article

Morphoagronomic Evaluation of Yellow Pitahaya (Selenicereus megalanthus Haw.) in Miraflores, Colombia

by
Ana Cruz Morillo-Coronado
1,*,
Elsa Helena Manjarres-Hernández
1,
Óscar Javier Saenz-Quintero
1 and
Yacenia Morillo-Coronado
2
1
Grupo CIDE Competitividad Innovación y Desarrollo Empresarial, Universidad Pedagógica y Tecnológica de Colombia, Tunja 150003, Colombia
2
Corporación Colombiana de Investigación Agropecuaria-AGROSAVIA, Palmira 763531, Colombia
*
Author to whom correspondence should be addressed.
Agronomy 2022, 12(7), 1582; https://doi.org/10.3390/agronomy12071582
Submission received: 20 May 2022 / Revised: 27 June 2022 / Accepted: 28 June 2022 / Published: 29 June 2022

Abstract

:
Selenicereus megalanthus is a native fruit tree with broad phenotypic variations that has not been characterized. The objective of this research was to morphoagronomically evaluate yellow pitahaya genotypes in open fields and under cover in the municipality of Miraflores, Boyacá. A diagnostic census of the productive system was carried out. The morphoagronomic characterization used a completely random design with qualitative and quantitative descriptors for fruits and cladodes taken in situ and analyzed with frequency, descriptive, multivariate, conglomerate, and sperm correlation analyses. The pitahaya production system was based on empirical practices carried out by farmers. The weight of the largest fruit in open fields was 219.04 g on average; the average was 186.48 g with the covered system. The open-field systems had the largest genotypes in all the dimensions (length and width). The covered systems had the highest number of fruits per cladode (3.70) and the longest cladodes in the entire study (121.24 cm). Both production systems showed similar values for titratable acidity (0.20), and the soluble solids values were slightly higher in the open-field system than in the covered system (15.20 and 14.66 °Brix, respectively), desirable characteristics for the market. Genotypes 7 (under cover) and 3 (open field) presented outstanding morphological and agronomic characteristics. This study identified genotypes that can be included in selection programs for yellow pitahaya in Miraflores, Colombia.

1. Introduction

New trends in global consumption are geared towards fresh, healthy, and safe foods that are sources of vitamins, proteins, and fiber, increasing the global demand for these foods [1]. The yellow pitahaya is listed by the International Colombia Corporation (CCI) as a promising fruit for export because of its sensory and organoleptic attributes and its prevention of some disorders related to oxidative stress [2,3], as well as some respiratory, gastrointestinal, and urinary disorders [4,5]. It has attracted attention not only because of its flavor, color, and attractive appearance but also because of its enormous health benefits [6,7]. Currently, pitahaya is the most important cactus in the country and one of the most important native genetic resources from ethno-botanical and economic points of view [2].
At the global level, the main importing countries are the United States, Japan, the European Union, and Canada, while the main exporters are Israel, Mexico, and Nicaragua. Colombia provides 38% of the international exports, reaching 17,773 t in 2018, where the main producing departments were Huila, Santander, and Boyacá [8], The latter has edaphoclimatic conditions and an advantageous geographical position that focus economic activities on traditional agriculture, with 12 yellow-pitahaya-producing municipalities that yield 6.59 t ha−1 [8]. Despite its productive potential, limiting factors in the development of this crop in Colombia include the high incidence of pests and diseases, the low fruit quality, the technological level, the associativity, and the lack of certified planting material, which generate significant crop losses [3,9,10].
The pitahaya is a native fruit that has not been domesticated; however, genetic variants related to improving fruit size, increased sugars, ease of vegetative propagation, parthenocarpy, loss of thorns and self-incompatibility, and resistance to pests, as well as increased productivity, quality, storage, and shelf-life, have been selected [2]. Worldwide, morphological characterization studies on yellow pitahaya have found great morphological and genetic heterogeneity in many of this fruit’s characteristics, such as sweetness, size, shape, color, and number of bracts, resulting from intra- or interspecific hybridizations between different cultivated and wild materials, which make it difficult to raise quality standards for the export market, posing serious problems when it comes to improving yield and post-harvest shelf-life [6]. Studies carried out by [6] through morphological, biochemical, and molecular characterizations allowed the correct identification of four Hylocereus species. The authors of [11] determined in Pangadaran that differences in the morphological, physiological, and anatomical structures of the plants allowed them to adapt to different agroclimatic conditions. A previous study showed that morphoagronomic characterizations could be used to determine the variation in natural pitahaya populations [6].
In Colombia, morphological, molecular, and biochemical characterization studies are scarce [3]; most studies have been focused on the physiological component of seeds for in vitro propagation and on the identification of limiting pathogens in production, among others [12,13,14,15]. Morphological and molecular characterization studies carried out on the germplasm at the Department of Boyacá have shown that there is genetic diversity in the province of Lengupá, which is the basis for the establishment of any selection process that would identify elite materials that respond to the needs of the farmer, producers, and consumers. Selenicereus megalanthus, or yellow pitahaya, a native fruit tree, constitutes a key product for the fruit and vegetable sector, with significant demand for its flavor, appearance, quality, and nutraceutical properties. In addition, it has market potential, both domestically and internationally. However, the prospects for the international market require research to raise the fruit quality and to supply elite genotypes for planting and managing the production chain with added value.
The municipality of Miraflores has the productive potential to make pitahaya an economically profitable crop, but first, it must generate strategies to promote cultivation in a technical way to position itself with the highest quality and develop research and technology for the yellow pitahaya production chain. Therefore, this research seeks to morphoagronomically evaluate yellow pitahaya genotypes in the municipality of Miraflores to identify elite genotypes adapted to the edaphoclimatic conditions that respond to current market needs.

2. Materials and Methods

2.1. Diagnostic-Technical Census of Yellow Pitahaya Cultivation

The diagnostic census of the yellow pitahaya production system was carried out in Miraflores, Boyacá, and the in situ morphoagronomic characterization was carried out at 13 producing farms in the same municipality, which has an average annual temperature of 19.5 °C and a relative humidity of 88.9%. The morphoagronomic and physiological descriptors associated with the fruit were carried out at the Plant Physiology Laboratory of the Pedagogical and Technological University of Colombia (UPTC), Tunja, Boyacá, with coordinates of 5°32′25″ N 73°21′41″ W, an altitude of 2735 m above sea level, an average annual temperature of 12.3 °C, and relative humidity of 63.9%. A diagnostic census of the organizations and producers of yellow pitahaya in Miraflores (Figure S1) was carried out, and a survey was applied (Table 1), which was initially validated in a pilot study with a few farmers and then applied to a total of 13 producers in Miraflores.

2.2. Morphoagronomic Characterization

The morphoagronomic characterization of yellow pitahaya materials was carried out based on a completely random design, selecting ten plants from each of the farms and from each production system (open field and under cover), with each plant being an experiment unit. Qualitative and quantitative morphological characteristics were evaluated in situ for clades and fruits, which have already been evaluated in genetic characterization studies on yellow pitahaya [3,9]. For the characterization of the phylloclades, a total of 12 characteristics were evaluated, six of a quantitative type and six of a qualitative type (Table 2).
For the morphological and physiological characterization of the fruits, ten fruits were taken per farm in two stages of maturity (green and mature) in the two production systems (open field and under cover), implementing a simple, stratified sampling under the criterion of greater and lesser production. The number of phylloclades per plant and the number of fruits per phylloclade in production were considered, which were in good phytosanitary conditions, without mechanical damage, and at physiological maturity (that is to say, the entire fruit had taken on the characteristic intense coloration of the species S. megalanthus as a harvest indicator with easy detachment of thorns). The descriptors in Table 3 were measured.
The physical-chemical analysis of the collected fruits was conducted at the Plant Physiology Laboratory. All the variables were evaluated at the stage of commercial maturity (75% coloration in the pericarp):
  • Equatorial diameter, polar diameter, and thickness of the pericarp: measured with a vernier caliper;
  • Fruit weight, pulp weight, and peel weight: estimated using an Acculab VIC 612 analytical balance (Sartorius Group, Germany);
  • Total soluble solids (SS): AOAC [16] methodology was used, where two (2) drops of fruit juice were extracted and deposited in a HANNA HI 96,803 digital refractometer (Hanna Instruments, Spain) for measurement;
  • Titratable acidity (TA): determined with the AOAC method [16], where 50 mL of fruit juice was taken, deposited in a 50 mL cylinder for weighing, and then, with the help of a burette (Brand GmbH & Co KG, Germany), NaOH, and phenolphthalein, was titrated by recording the displaced volume.

2.3. Statistical Analysis

For the analysis of the information obtained from the surveys, descriptive and qualitative statistics were applied using InfoStat version 2020. The statistical analysis of the morphoagronomic characterization was carried out in three steps: (1): descriptive, (2) multivariate, and (3) grouping. First, with the data from the morphoagronomic characterization, a descriptive analysis was carried out for the quantitative and qualitative variables with InfoStat version 2020 [17]. Pearson’s correlation was estimated for the quantitative variables, and the significance was evaluated using a t-test (the null hypothesis was H0: r = 0; 5% significance). Second, a principal component analysis was performed between the quantitative variables using the correlation matrix between the characteristics, which were plotted on a two-dimensional plane to group the accessions with R Core Team Software (2020). For the qualitative variables, a frequency and multiple correspondence analysis was carried out. Thirdly, for the clustering analysis, the Euclidean distance and Ward’s minimum distance were taken into account using the algorithms in the Factoextra package of the R program [18].
For the joint analysis of the qualitative and quantitative descriptors, a factorial analysis of mixed data was carried out with the Factoextra package of the R program. In addition, a dendrogram was generated using a hierarchical clustering method and the Euclidean distance of the minimum variance of Ward with the FactoMineR package [19].

3. Results

3.1. Diagnostic-Technical Census of Yellow Pitahaya Cultivation

The diagnostic census of the production systems for yellow pitahaya, open fields and under cover, showed the current state of production in Miraflores, Boyacá. Of the 13 farms evaluated, 12 implemented a covered system, which showed more favorable results in terms of yield and fruit quality. Six farms had an open-field system (Table 4).
The majority of the farms had certification: BPA and ICA (46%), BPA (8%), and ICA (31%); 15% did not have any certification (Figure 1A). Land tenancy is an important factor for any agricultural production system since it determines the percentage of production that returns as profit and what covers costs. This study found that 10 of the 13 producers owned their properties, which did not exceed eight hectares (Figure 1B). All the yellow pitahaya systems used some type of trellis: rocky, cement, or wooden (Figure 1C). The fertilization was edaphic and rich in major elements. Diseases with high incidence included basal rot (Fusarium oxysporum) and bacteriosis (Erwinia carotovora), and pests included the flower bud fly (Dasiops saltans) and the potato bug (Leptoglossus zonatus).
One of the three non-owner producers had a lease for more than 10 hectares, an indicator of the profitability of pitahaya production and the crops associated with this fruit tree.
Likewise, the census showed the procedures that the producers used to select seeds. Generally, health and vigor were sought. Homogenizing the criteria of the producers for seed selection showed that they look for pencas or phylloclades from totally healthy plants that are free of pests and disease, not in production, and from productive plants. The producers also considered plant age, the maturity of the stalk to be cut, and the section of the plant from which it was selected, i.e., the basal part and the middle-third of the plant (Figure 1D).

3.2. Morphoagronomic Characterization Using Quantitative Descriptors for Fruit and Phylloclades

The evaluation of the fruits and phylloclades with the morphological descriptors in the six (6) yellow pitahaya genotypes in the open-field systems showed low coefficients of variation: NF = 35.96%; PL = 18.34%; DBA = 4.92%; NSA = 7.90%; RW = 10.97%; LS = 8.73%; LF = 5.01%; FW = 12.2%; RLW = 25.68%; FEW = 24.14%; SW = 21.61%; PW = 21.58%; PT = 18.77%; PFR = 21.21%; NB = 6.32%; SS = 9.09%; and TA = 12.11%. The variables that showed higher percentages of variation were: number of fruits (NF) with 35.96%, followed by length/width ratio (RWA) with 25.68% and fruit weight (FWE) with 24.14%. The genotypes that showed higher fruit weights were genotype 7 (293.75 g), genotype 5 (274.10 g), and genotype 1 (204.90 g).
Genotype 15 obtained the lowest value for the content of soluble solids (SS) with 12.43 °Brix, almost 3 °Brix below the average. In addition, this genotype presented the highest number of fruits per phylloclade (4), and its length was the second largest (116.2 cm). Genotype 17 had a peel/pulp ratio (PFR) of 0.46, indicating that the fruits had a higher pulp weight in relation to the peel weight. It also presented outstanding physicochemical characteristics (°Brix = 15.85; titratable acidity = 0.24) (Table 5).
Likewise, in covered systems, the morphological descriptors used to evaluate the fruits and phylloclades in the 12 yellow pitahaya genotypes showed low coefficients of variation: NF = 32.12%; LF = 25.45%; DBA = 8.37%; NSA = 5.6%; RW = 13.63%; LS = 8.88%; LF = 5.27%; FW = 21.85%; RLW = 8.01%; FWE = 25.58%; SW = 26.59%; PW = 24.53%; PT = 22.86%; PFR = 27.51%; NB = 9.28%; SS = 12.65%; and TA = 20.51%. The variables that showed higher percentages of variation were: number of fruits (NF) with 32.12%, followed by peel/pulp ratio (PFR) with 27.51% and peel weight (SW) with 26.59%. The genotypes that showed higher fruit weights were genotype 5 (278.5 g), genotype 3 (265.6 g), and genotype 15 (223.2 g). Likewise, eight of the twelve genotypes presented weights lower than the average (186.48 g). The genotypes that showed higher numbers of fruit per phylloclade were genotype 4 (5.9) and genotype 15 (5.0). Genotypes 1, 2, 3, and 6 showed higher than average peel/pulp ratio values (0.91, 1.45, 1.03, and 0.95, respectively), indicating a low pulp weight associated with the peel weight (Table 6).

3.3. Correlation Analysis for the Quantitative Variables of Fruits and Cladodes in Open Fields and under Cover

Pearson’s correlation analysis (p ≤ 0.05) in the open-field systems showed high and positive correlations between the distance between the areolas (DBA) and the length of the largest spine (LS), with a value of 0.89; between the thickness of the pericarp (PT) and the peel/pulp ratio (PFR), with a correlation value of 0.89; and between the width of the fruit (FW) and its weight (FWE), with a value of 0.84. Likewise, high and negative correlations were evidenced between the variables of length/width ratio (RLW) and soluble solids (SS), with a correlation value of −0.96; and between the length/width ratio (RLW) and the width of the fruit (FW). There was no correlation between the length of the phylloclades (LF) and the length of the largest spine (LS) (Figure 2a).
Pearson’s correlation analysis (p ≤ 0.05) for the covered system showed high and positive correlations between the variables of fruit weight (FWE) and peel weight (SW) (r = 0.87), between the fruit weight (FWE) and the pulp weight (PW) (r = 0.85), between the fruit weight (FWE) and the length of the fruit (LF) (r = 0.72), and between the thickness of the pericarp (PT) and the peel-to-pulp ratio (PFR) (r = 0.79). In addition, it showed high and negative correlations between the fruit weight (FWE) and the fruit length-to-width (RWL) ratio (r = −0.81) (Figure 2b).

3.4. Principal Component Analysis for the Quantitative Variables of Fruits and Cladodes in Open Fields and under Cover

The principal component analysis in the open-field system showed that 64% of the total variance was explained by the first two components (CP1 = 37.5% and CP2 = 26.5%) (Figure 3a). The variables that contributed more to the variation of CP1 were fruit width, pulp weight, fruit weight, and peel weight, while the thickness of the pericarp, peel/pulp ratio and number of bracts contributed to CP2. On the other hand, the variables associated with fruit were more correlated with yield than the morphoagronomic characteristics of the phylloclades.
The analysis of the principal components for the quantitative variables of morphoagronomic nature in the covered system showed that the total variance was expressed in two (2) principal components with an accumulated value of 52.7%, where the first component grouped most of the analyzed variables. Large, negative associations were observed with fruit weight (PF), peel weight (SW), pulp weight (PW), and fruit length (LF). Genotypes 3 and 5 showed negative associations with CP1. The second principal component (CP2) only associated two variables: the length/width ratio (RLW) (positive association) and the number of bracts (NB) (Figure 3b).

3.5. Cluster Analysis for the Quantitative Variables of Fruits and Cladodes in Open Fields and under Cover

The cluster analysis grouped the genotypes of the open-field system into five clusters considering quantitative variables (Figure 4a). The first group had genotype 2, which presented the highest value for fruit width (70.14 mm), a peel weight of 105.85 g, and a pulp weight of 148.83 g. The second group was represented by genotype 4, which was characterized by presenting the highest values for fruit weight (293.75 g) and soluble solids (16.10 °Brix). The genotypes of the third group were genotype 3 and genotype 5, which presented a number of thorns per areola of approximately three, as well as lower values for fruit length (89.16 to 93.39 mm) and fruit weight (average of 171.15 g). The genotype in the fourth group was genotype 1, which presented an average rib width of 5.60 cm, a fruit weight higher than the average (204.90 g), a number of fruits of 2.40, and a pulp weight of 129.16 g. Finally, group five was represented by genotype 6, which presented a phylloclade length of 127.10 cm, an average fruit weight of 199.16 g, and a peel/pulp ratio of 0.46. These analyses were consistent with the principal component analysis, where the importance of the quantitative characteristics associated with the fruits was revealed.
In the covered system, the cluster analysis grouped the genotypes into five clusters (Figure 4b). However, the groups were not established according to the collection area or place of origin. The first group had genotypes 3 and 5, which presented the highest values for fruit weight (265.60 to 278.50 g), fruit length (100.37 to 111.70 mm), and pericarp thickness (4.41 to 5.45 cm). On the contrary, the second was represented by genotype 16, which was characterized by the longest phylloclade (205.70 cm) and a fruit weight of 175.80 g. The genotypes in the third group presented an average fruit weight of 138.13 g, a peel/pulp ratio from 0.91 to 1.45, and an average number of fruits of 3.57. The genotypes in the fourth group presented an average number of spines per areola of 2.77, fruit weight between 155.30 and 180.80 g, and soluble solids of 15.72 °Brix, on average. Finally, group five had the genotypes that presented a phylloclade length from 114.90 to 135.21 cm, an average fruit weight of 197.70 g, and an average titratable acidity of 0.18. These analyses were consistent with the principal component analysis.

3.6. Frequency Analysis for Qualitative Variables for Fruits and Cladodes in Open Fields and under Cover

The frequency analysis for the qualitative descriptors of the yellow pitahaya genotypes grown in open fields and under cover showed similarity patterns between genotypes of the same production system and between the two systems (Table 7 and Table 8). In the open-field system, characteristics such as the smooth texture of the phylloclade surface, the presence of wax, and the concave shape of the margin between areolas prevailed (Table 7).

3.7. Multiple Correspondence Analysis for Qualitative Variables of Fruits and Cladodes in Open Fields and under Cover

The multiple correspondence analysis performed for the qualitative descriptors in the open-field system showed that 67.8% of the total variance was explained by the first two components: CP1 (40.2%) and CP2 (27.6%). The first component grouped the genotypes according to characteristics such as the rough texture of the phylloclade surface (STP), the absence of pigmentation in the vegetative shoots (PVS), and light gray coloration in the areolas (CAR). The second component presented intense pigmentation in the vegetative shoots (PVS), in addition to having a compressed mature fruit shape (MFS) and a dark brown color of the spines (CES) (Figure 5a).
In the covered system, the multiple correspondence analysis revealed that 57.8% of the total variance was explained by the first two components: CP1 (37.2%) and CP2 (20.6%). The first component had a rough texture of the phylloclade surface (STP), a straight margin between the areolas (MSA), and dark brown spines (CES). The second component had dark brown areolas (CAR) and slight pigmentation in the vegetative shoots (PVS) (Figure 5b).

3.8. Cluster Analysis for Qualitative Variables of Fruits and Cladodes in Open Fields and under Cover

The cluster analysis of the qualitative variables in the open-field system grouped the six (6) yellow pitahaya genotypes into three (3) clusters (Figure 6a). The first cluster was represented by genotype 15, characterized by a predominance of rough phylloclade surface texture (TXF, 80%), convex shape of the margin between the areolas (MSA, 80%), and fruits with no wax (PW, 20%). The second cluster grouped genotypes 6 and 17, which were characterized by mostly dark gray areolas (CAR) and pigmentation in vegetative shoots (PVS) (80 and 70%, respectively) that was intense in both materials. Finally, the third cluster associated genotypes 5, 7, and 1, which exhibited convex margins between the areolas (MSA) for genotypes 7 and 1, a smooth phylloclade surface texture, and a compressed fruit shape.
The cluster analysis in the covered system grouped the 12 genotypes evaluated into six (6) clusters (Figure 6b). The first cluster was represented by genotypes 7 and 3, which showed similar percentages for the shape of the margin between the areolas (MSA; 70% and 80% concave, respectively), as well as for the pigmentation in the vegetative suckers (PVS; 30% and 40% intense pigmentation, respectively). The shapes of the green and ripe fruit remained elongated in both genotypes. The second cluster was represented by genotype 2, which presented a texture of the phylloclade surface (STP) that was 50% smooth and 50% rough, a shape of the margin between the areolas that was mostly concave (70%), and coloration of areolas (CAR) that was predominantly dark gray, a distinctive attribute among the other genotypes. The third cluster associated genotypes 14, 15, 6, and 9, with a greater strength of grouping between genotypes 14 and 15, which presented bone-colored and opaque brown spines (CES; 70% and 80% respectively). Genotypes 6 and 9 presented shapes of the margins between the areolas that were 70% concave and 30% straight (Figure 6b).
The fourth cluster grouped genotypes 16, 8, and 4, which showed an association based on the texture of the phylloclade surface (STP), which was 100% smooth for genotypes 4 and 8, while being 90% smooth and 10% rough for genotype 16. In addition, they showed similarities in terms of the shapes of the green and ripe fruit, where the elongated shape predominated in the three (3) materials.
Finally, the fifth and sixth clusters were represented by genotypes 5 and 1, respectively, where genotype 5 showed particularities in the shape of the mature fruit (MFS; where the compressed shape predominated), in the shape of the margin between the areolas (with 50% concave and 50% straight), and in the color of the thorns (CES; predominately light gray color) for 80% of the fruits of this material. Genotype 1 showed a rough texture of the phylloclade surface in 70%, as well as a straight shape of the margins between the areolas in 70%. All the genotypes showed the presence of wax (PW) as a general characteristic in all the fruits.

3.9. Analysis of Mixed Factors for Fruit and Cladode in Open-Field and Covered Systems

In the analysis of mixed factors, both quantitative and qualitative variables were integrated to generate a complete grouping of the genotypes evaluated. Thus, in the principal component analysis in the open-field system, it was observed that 60.22% of the total variance was expressed in the first two components (CP1 = 35.98% and CP2 = 24.24%) (Figure S2). The variables that contributed more to the variance of CP1 were peel weight (SW), fruit weight (FWE), pulp weight (PW), and fruit width (FW), respectively.
On the other hand, the analysis of mixed factors in the covered system showed that 36.9% of the total variance was represented in the first two components (CP1 = 19.97% and CP2 = 16.93%). The variables that made the greatest contributions to the total phenotypic variance observed in PC1 were length/width ratio (RLW), peel weight (SW), and fruit weight (FWE). On the other hand, the soluble solids (SS), the number of spines per areola (NSA), the texture of the phylloclade surface (STP), and the shape of the margin between the areolas (MSA) contributed more to the variance of CP2 (Figure S3).
The grouping analysis in the open-field system placed the six (6) genotypes into three (3) clusters (Figure 7a), where cluster 1 was made up of genotype 15, which presented a higher number of fruits per phylloclade than the rest of the genotypes (four fruits/phylloclade). In addition to having phylloclades with an average length of 116.2 cm, genotype 15 had mostly (80%) rough-textured phylloclades, with only 20% smooth-textured. There was a marked absence of pigmentation in the vegetative shoots (PVR) in 80% of the individuals.
The second cluster grouped genotypes 1, 6, and 17, which were characterized by higher values of titratable acidity (TA) of 0.20, 0.21, and 0.24, respectively. The genotypes with the lowest fruit weights (161.5 g and 199.16 g) were genotype 6 and genotype 17. Likewise, genotypes 6 and 17 had mostly dark gray areolas (CAR) of 80% and 70%, respectively. In genotype 1, this coloration was light gray (100%). These results showed that the variable that generated this association between the genotypes was titratable acidity (Table 6).
The third cluster grouped genotypes 5 and 7, which presented average phylloclade lengths of 100.28 cm and 100.33 cm, respectively, and numbers of fruits per phylloclade between 1.9 and 2.9. These two genotypes had smooth surface textures and elongated green fruit shapes (GFS), but by the time the fruit was ripe (MFS), genotype 7 changed to a compressed shape in 38% of the genotypes (Table 6). All the fruits in each genotype had wax.
The cluster analysis in the covered system grouped the 12 yellow pitahaya genotypes into six (6) clusters (Figure 7b). The first and second groups separately discriminated genotypes 3 and 5, respectively, which presented higher values for fruit weight (265.60 and 278.50 g), fruit length (100.37 and 111.70 mm), and pericarp thickness (4.41 and 5.45 cm). Genotype 3, characterized by larger fruit dimensions than genotype 5, also had a higher peel/pulp ratio (1.03), a variable of little agronomic interest since the shell represents half of the total weight of the fruit. It also had the highest contents of titratable acidity (0.28) and soluble solids (17.6 °Brix). The third cluster grouped genotypes 6, 7, 8, and 9, which showed lower peel/pulp ratios (less than 1). The fruit weights were close to the mean (98.46), with an elongated shape (PLW = 1.80). The fourth cluster grouped genotypes 4, 14, 15, and 16, with pulp weights higher than average (100 g), with the exception of genotype 16, which was lower by 1.5%. The peel/pulp ratios for these genotypes ranged from 0.69 to 0.75, and they presented cladode lengths greater than average, especially genotype 16 (205.7 cm), which was 69.6% higher.
Finally, the analysis grouped genotypes 1 and 2 into two different clusters. Genotype 1 had the lowest value for soluble solids (SS = 12.13 °Brix) and the second lowest fruit weight (137.4 g), 49 g below average. Genotype 1 had a rough phylloclade surface texture (70%), which differed from the other genotypes.

4. Discussion

The yellow pitahaya (Selenicereus megalanthus Haw.) is native to the southern and central regions of Mexico and the Americas. It is an exotic and nutritious fruit tree that is cultivated in the tropical and subtropical regions of the world. Pitahaya production has attracted interest from the United States, Australia, southeast Asia, Israel, and other regions [1]. This fruit has attracted considerable attention from consumers because of the particular shape of the fruit and its richness in polyphenols, vitamins, sugar, amino acids, and betalains [20]. In addition, it presents great adaptation to extreme environmental conditions [12], mainly because of its broad phenotypic and genetic variations in its fruits and cladodes [3,6,21].
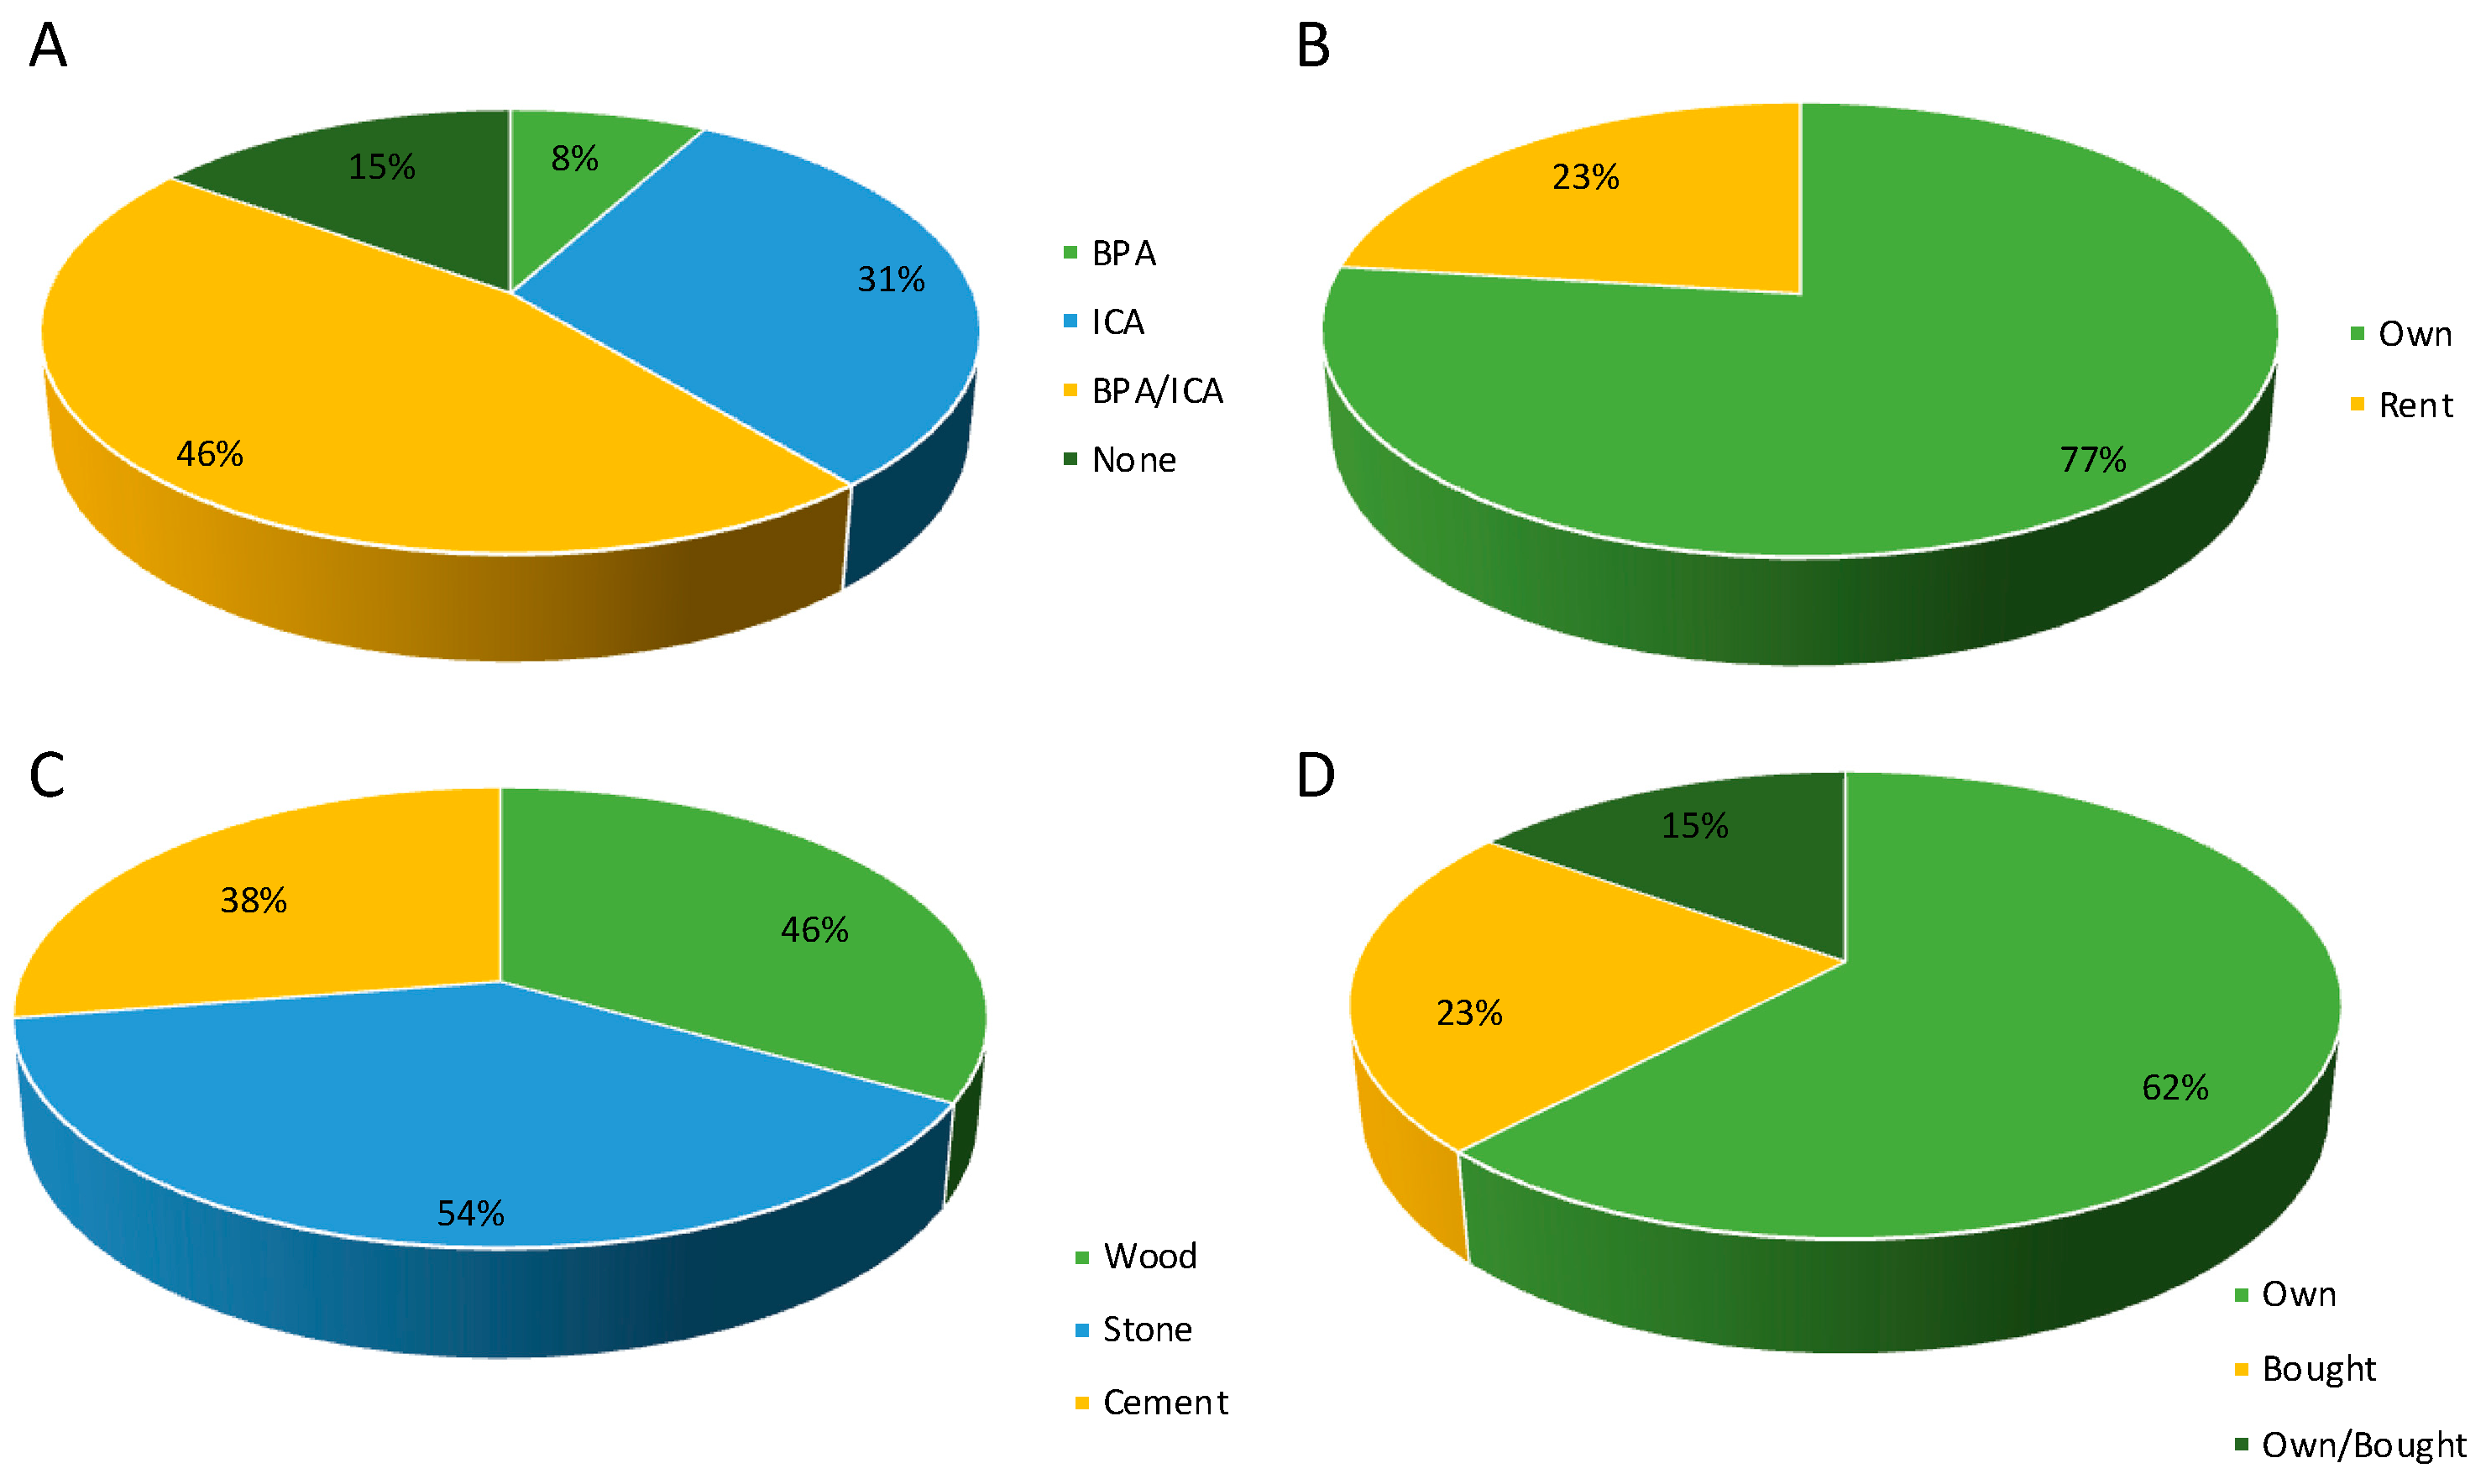
Taking into account the results obtained in the diagnostic census of the production systems for yellow pitahaya in open fields and under cover, it was observed that, despite the fact that it is an export crop in growing demand both nationally and internationally, there is no technological package for this crop that is applied by all producers (Figure 1). Rather, they use empirical practices for the agronomic management of the crop, which has led to many farms not being highly productive and yellow pitahaya not generating the expected profitability. Hence, characterizations of the germplasm and sustainable management alternatives that result in better crop productivity in the municipality of Miraflores are needed.
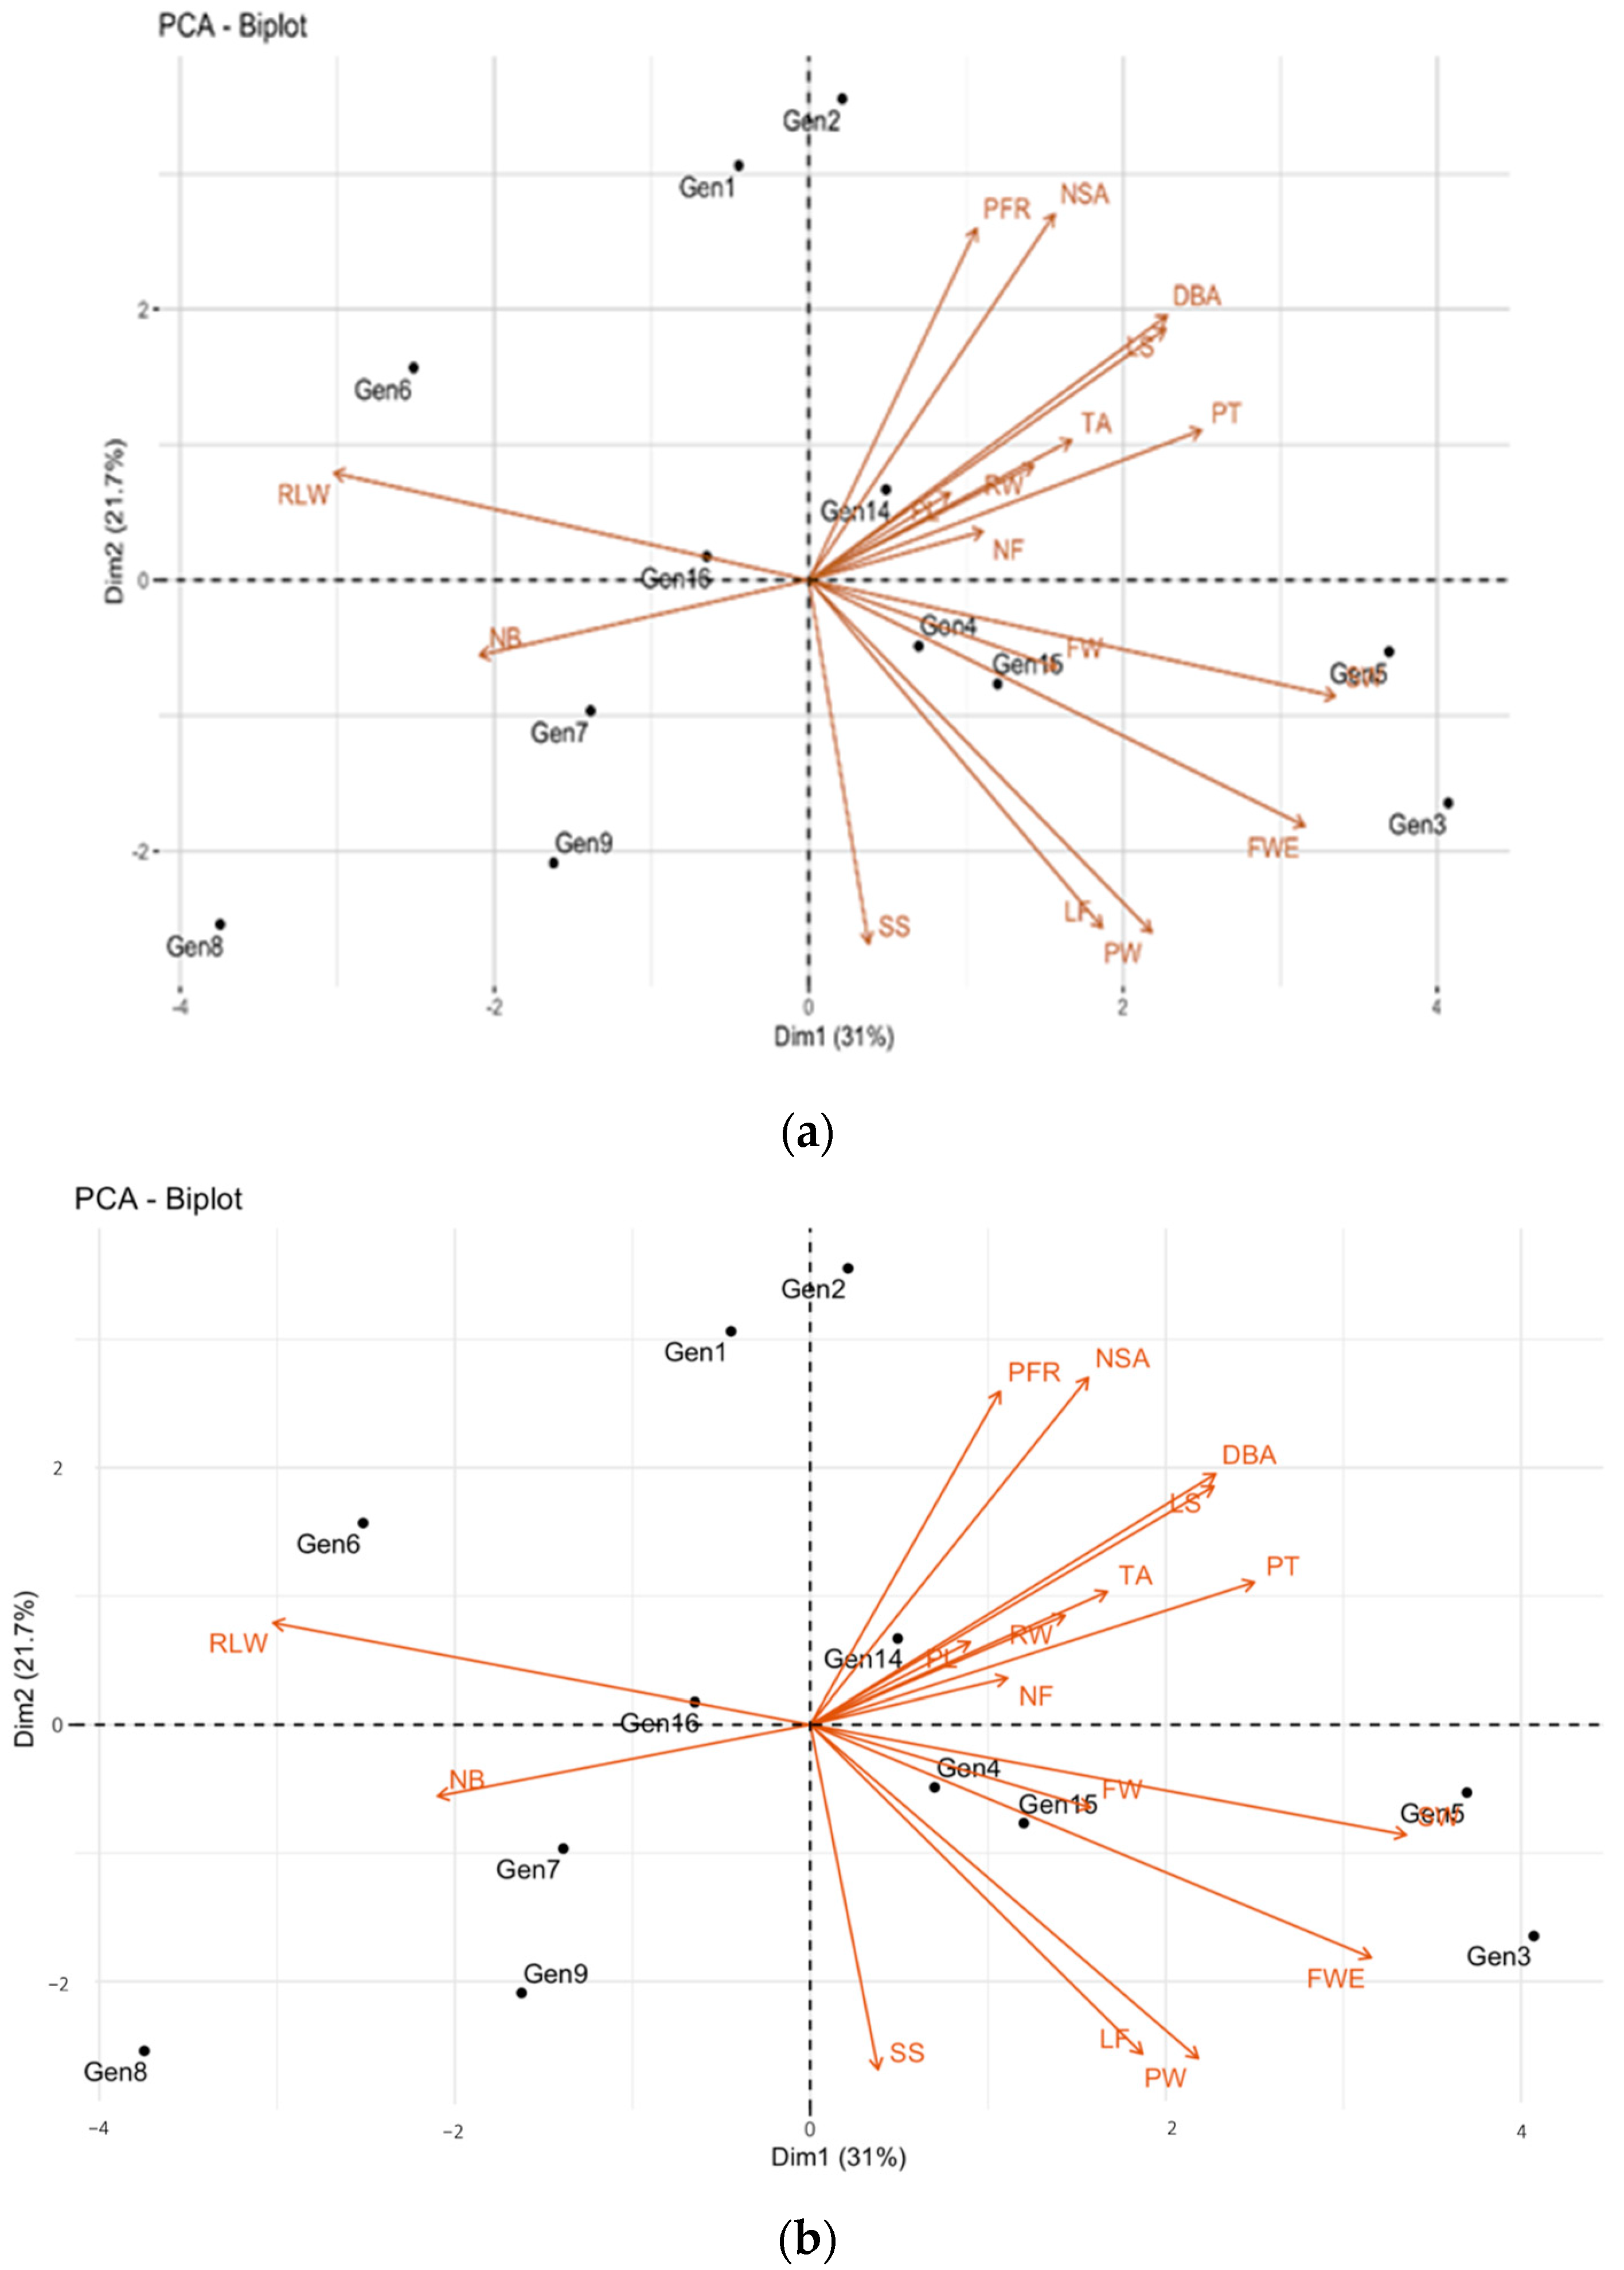
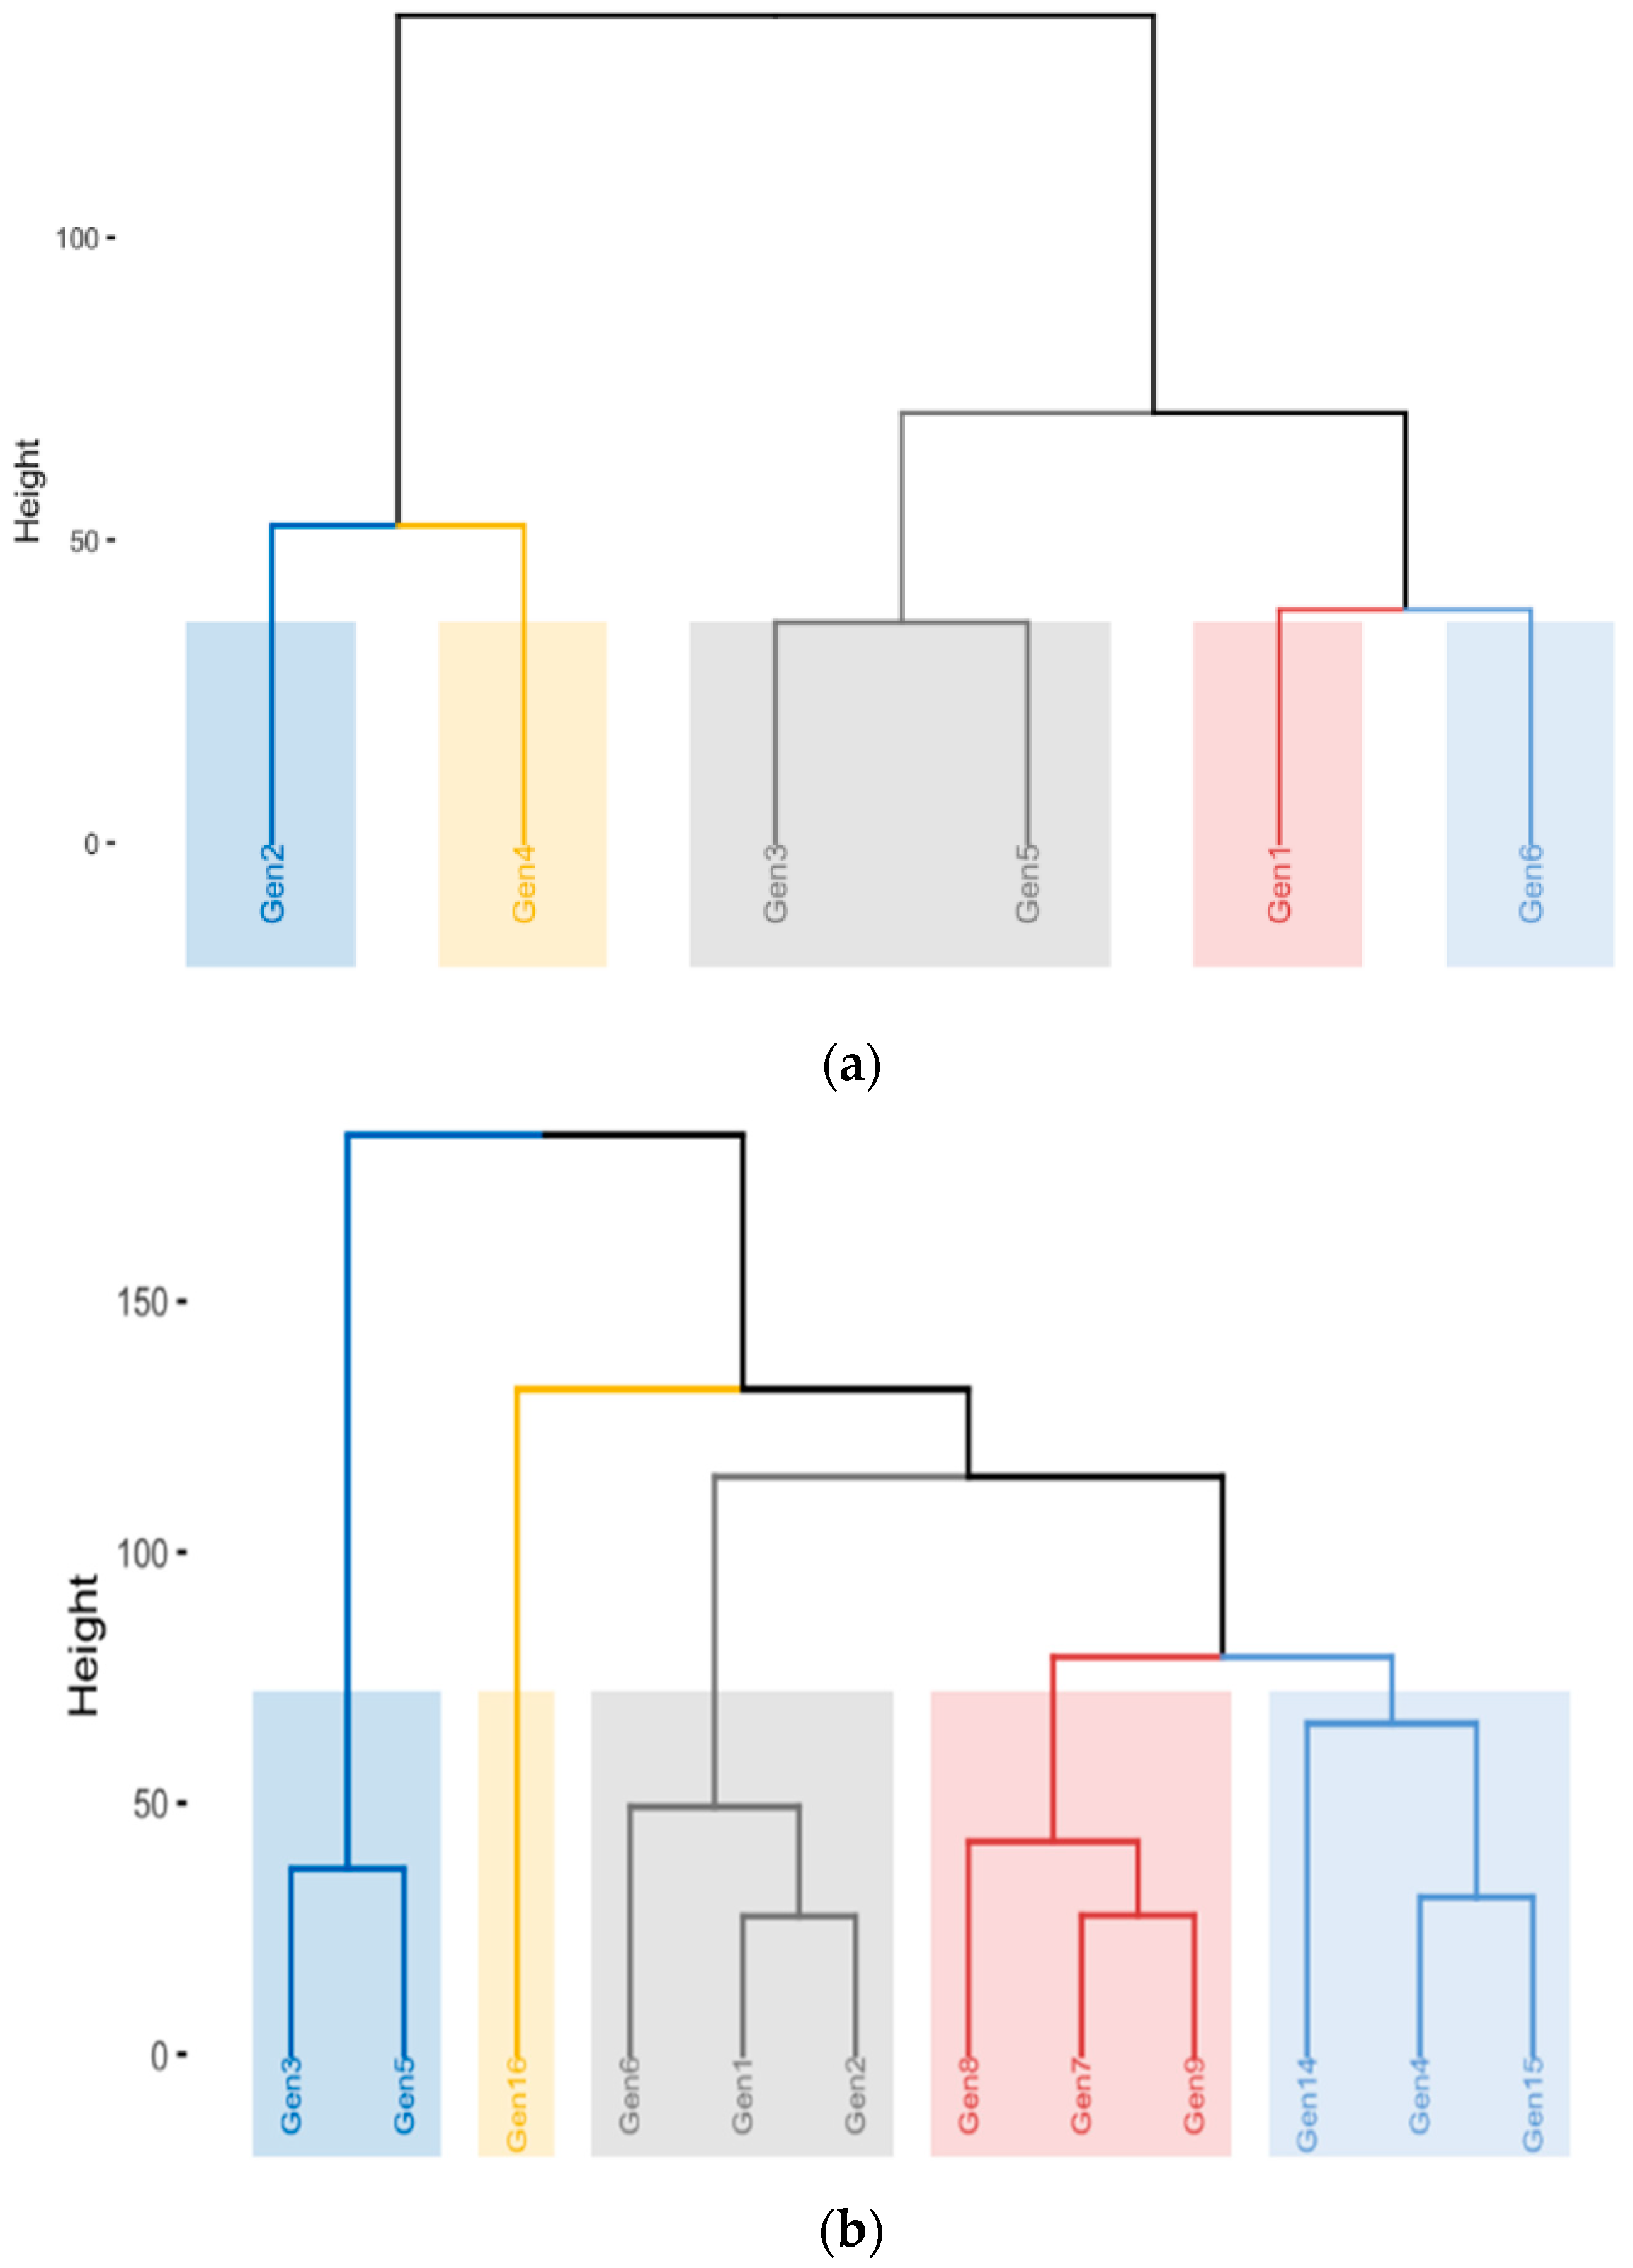
In this study, the evaluation of 12 yellow pitahaya genotypes in the municipality of Miraflores showed a significant phenotypic segregation for both the qualitative and quantitative characteristics associated with fruits and cladodes in the two productive systems (open field and under cover) (Figure 7). This has been reported previously in characterization studies of Hylocereus germplasm at the international level, where the wide variation in fruit characteristics was confirmed, along with the usefulness of morphological descriptors in the discrimination and identification of species in the genus Hylocereus and Selenicereus [6], as well as the adaptability to different environments [11].
Results similar to those obtained in this study for the characteristics associated with cladodes have been found in studies of morphological characterizations for Hylocereus species, as reported by [9,22], who concluded that the more discriminating characteristics for cladodes included texture, the presence of wax, the distance between areolas, the height of undulations between successive areolas, the number of spines per areola, the color of the spines, and the pigmentation of the buds. The authors of [23] stated that the main differences between Hylocereus species were the size and color of the fruits and the shape and number of the spines. This affirmation corresponded with the analysis carried out on 12 Selenicereus materials, in which differences were observed in the shapes of the stems and the spines (Figure 5). The authors of [24] stated that the number of spines per areola was just as important as the height of the undulations because it differentiated genotypes. However, [25] observed statistical differences in the stem variables, one of the most important being the presence of wax. The authors of [26] carried out a study on the effect of pollination methods on fruit set and fruit characteristics in several pitahaya clones to improve fruit quality and yield by making pollination processes more efficient. Pitahaya plants grown in Pasuruan, Sukaharjo, and Bantul showed significant differences in cladode morphology between the different species and varieties [27]. Variations in stem morphology, such as stem curvature, margin hardness (presence of sclerenchyma), distance between the areolas, number of spines, rib height, rib thickness, length, and stem color are important for species differentiation [22].
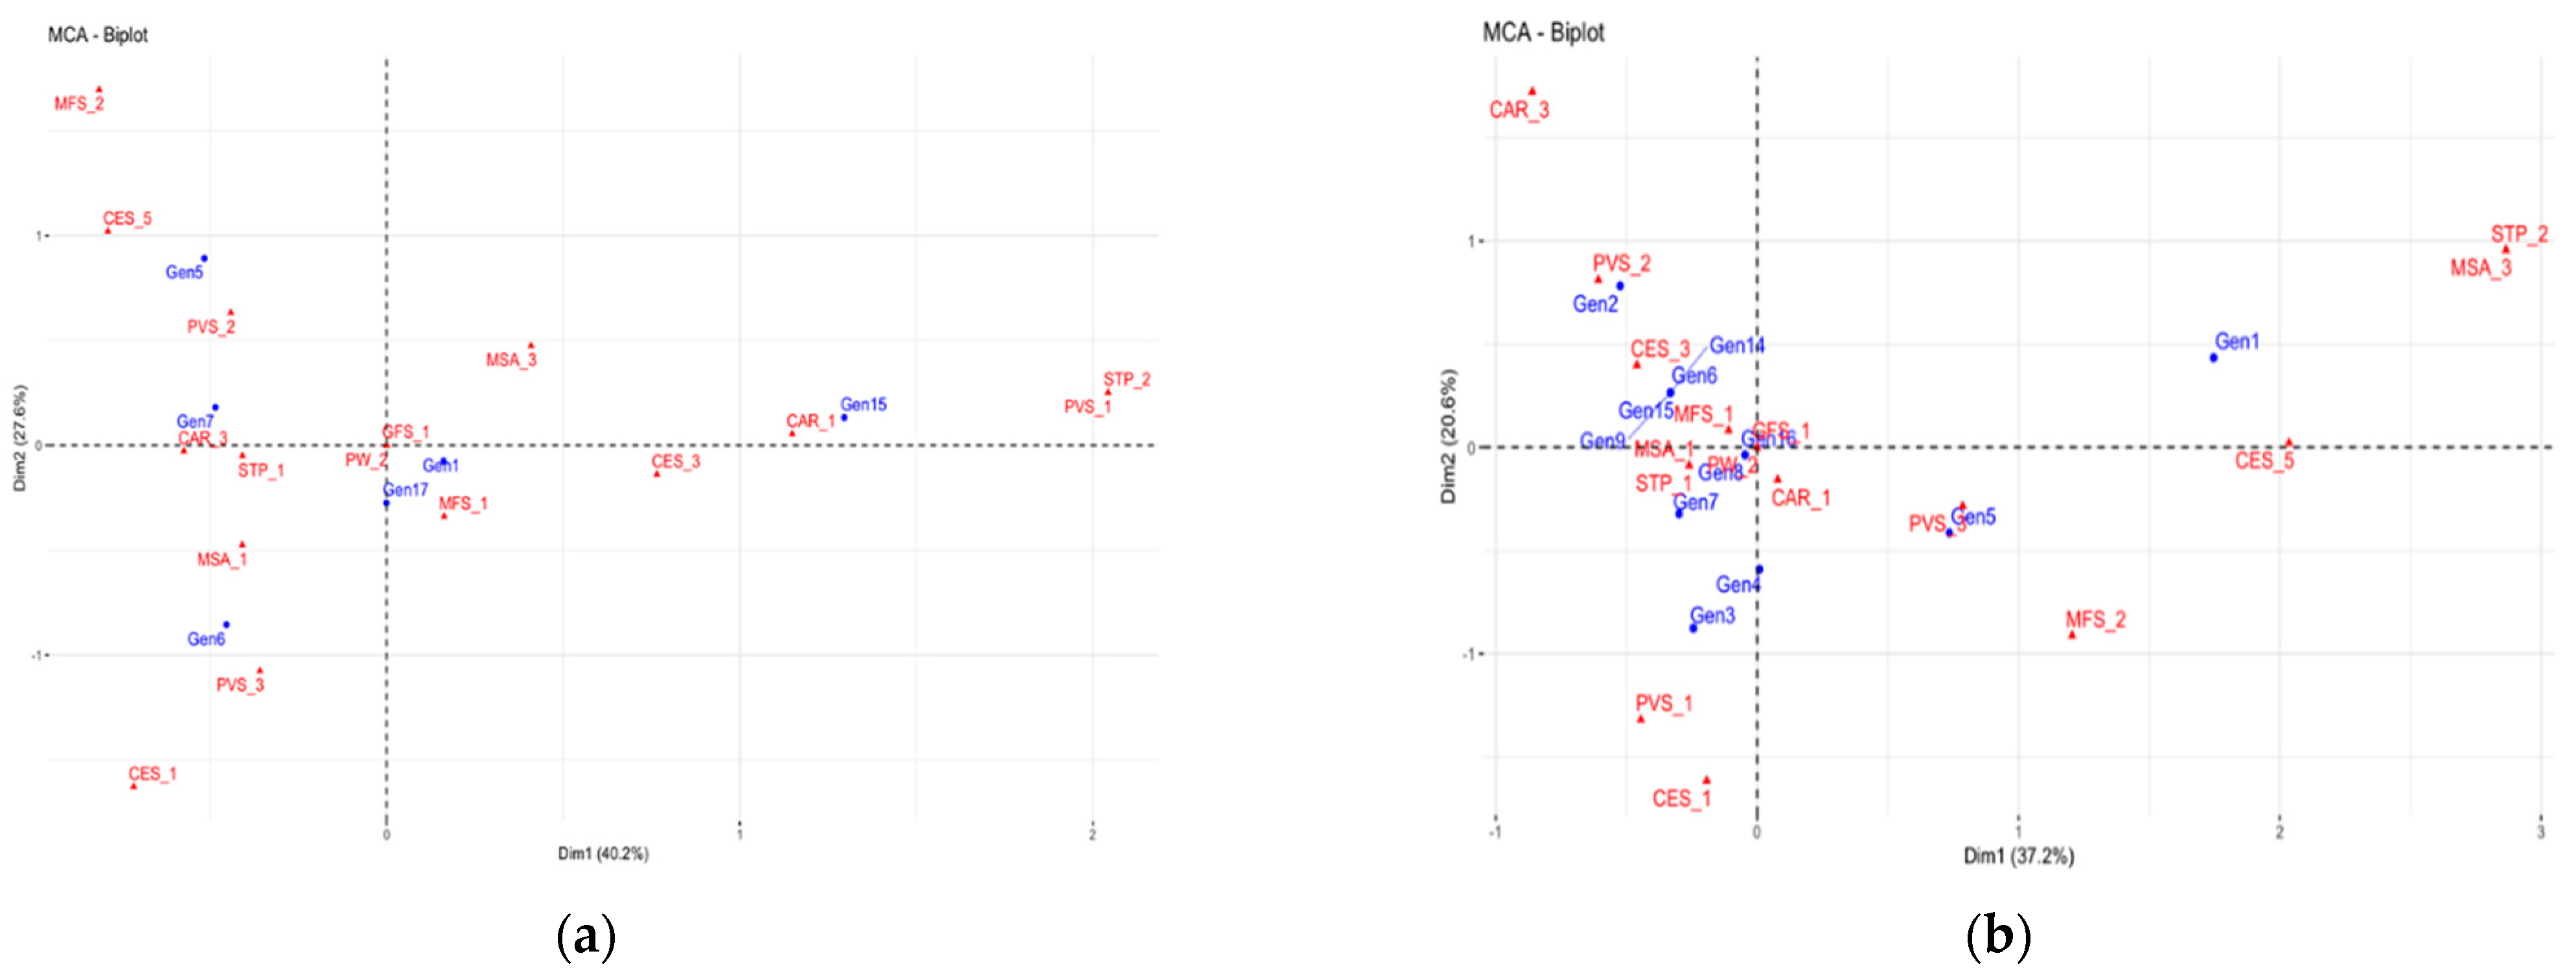
In this study, it was observed that most of the genotypes (more than 70%) exhibited phenotypic variability for the pigmentation characteristics of the vegetative shoots (PVS), the shape of the margins between the areolas (MSA), and the coloration of the areolas (CAR) (Table 7 and Table 8). The qualitative characteristics that presented less variability were the texture of the phylloclade surface (STP), spine color (CES), presence of wax (PW) and fruit shape in both green and ripe states (GFS and MFS, respectively) (Figure 5). This may be due to the way in which the species propagates (asexual) and the exchange of seeds between producers in the same region or between producing regions, which has led to the homogenization of some phenotypic characteristics [3].
The evaluation of the yellow pitahaya genotypes in this study showed that the characteristics associated with the fruit were the most variable, which agrees with those that have been found in other pitahaya species by [2,3,28], who have found that the most important characteristics for fruits were length, width, length/width ratio, pulp color, weight of the pulp, number of bracts, length and width of the bracts, fruit weight, pulp color, and Brix degrees, which contribute significantly to the separation of groups. The total soluble solids, being the most desirable characteristic for consumer preference, is measured in °Brix and can be affected by a set of factors, such as genetic, climatic, soil, and management factors, among others [13]. In the present study, the SS values for the yellow pitahaya materials evaluated under cover and in open fields were 14.7 and 15 °Brix, respectively (Table 7 and Table 8).
The chemical analysis of the present study also corroborated the results obtained by [29] for the concentration of soluble solids (SS) in mature fruits, who recorded values between 10.23 and 18.84 °Brix with an average of 14.27 °Brix. In [30], a study carried out in Ecuador on fully mature S. megalanthus fruits, the authors found that the content of soluble solids reached 20.74 °Brix, significantly different from the present results where the genotype that showed the highest content of sugars only accumulated 17.6 °Brix. In general, the values obtained in this study in terms of SS showed that the materials had good fruit quality since previous studies have reported SS values between 11 and 15%, with a good preference in the market [2].
For fruit weight, most genotypes had values above 100 g, which is a desirable characteristic for the market (Table 5 and Table 6). The materials with the highest weights were genotype 15 (223.20 g), genotype 3 (265.60 g), and genotype 5 (278.50 g). The results are comparable to those obtained by [29] in the physicochemical and proximal characterization of yellow pitahaya cultivated in Colombia, where the average fruit weight was 222.81 g, 16% higher than that found in the genotypes of the covered system and only 1.7% greater than those of the open-field system. In addition, the percentage of pulp in relation to the total weight of the fruit was 62.64%, 15% higher than the average in both systems. The study in question covered other localities, including municipalities in the Department of Valle del Cauca, where variables such as fruit weight and pulp weight were predominant over the other materials, reporting values of 348.95 g and 225.40 g, respectively, 15.81% higher than the most outstanding genotype in the open-field system (Table 5) and 20.18% higher than the best genotype in the covered system (Table 6, Figure 5).
According to Colombian Technical Standard NTC-3554,1996 for the classification of yellow pitahaya fruits, the fruits evaluated in this study, according to their unit weight (g), belonged to the following sizes: size 9 (261 to 360 g) for genotypes 3 and 5 (UC, under cover) and genotypes 5 and 7 (OF, open field); size 12 (201 to 260 g) for genotypes 15 (UC) and 1 (OF); size 14 (151 to 200 g) for genotypes 2, 4, 7, 8, 9, 14, and 16 (UB) and genotypes 6, 15, and 17 (OF); and size 16 (111 to 150 g) for genotypes 1 and 6 (UC) (Table 5 and 6). The fruits from genotype 5 in both production systems belonged to size 9, the second-highest category for the classification of fruits according to their weight (ICONTEC).
The titratable acidity (TA) reached an average value of 0.20 for both systems, registering maximum values of 0.28 in genotype 3 of the covered system and 0.24 in genotype 17 of the open-field system (OF), as well as minimum values of 0.13 in genotype 8 (UC) and 0.18 in genotypes 5, 7, and 15 (OF) (Table 5 and 6). Studies carried out on Hylocereus undatus Haw in three stages of maturity showed that the percentage of titratable acidity (TA) in the state of complete maturity decreased from 0.63 (harvest time) to 0.10 (at the end of storage) [31]. Studies in other countries have found great variation in characteristics of agronomic importance, even within the same species of Hylocereus spp. and Megalanthus [6,13,22], which is favorable for future breeding studies. Several studies on diversity in dragon fruits have been reported. For example, a study by [32] found variations in dragon fruits based on morphology, isoenzymes, and vitamin C content in the Pasuruan (East Java), Sukoharjo, Klaten (Central Java), and Bantul sub-districts (Yogyakarta).
Apart from differences in species or accessions, differences in fruit morphology may be related to changes at the physiological level in various stages of fruit development [32]. The main differences between various Hylocereus species were reported in terms of the size and color of fruits and the number and shape of spines [23]. In addition, the variety and flowering time have large influences on the physiomorphological characteristics of pitahayas [24,33].
In Colombia, morphoagronomic characterization studies of pitahaya species have obtained results similar to those reported in this study, highlighting the existence of genetic variability that can be used in conservation and genetic improvement programs that can lead to the identification of elite materials, where genotypes 7 and 6 could be good production alternatives. However, it is necessary to complement these morphological characterization studies with biochemical and molecular data that better discriminate the germplasm given the limitations of this type of descriptor. Research on yellow pitahaya plants should be intensified by emphasizing value chain and production aspects for a long-term perspective.

5. Conclusions

The diagnostic census showed that the most-implemented system in the cultivation of yellow pitahaya in Miraflores is the covered system and that there was no technological management plan for yellow pitahaya in Miraflores. On the contrary, farmers carried out agronomic activities based on their experience and those of their neighbors.
The morphoagronomic characteristics associated with phylloclades and fruits contributed to the discrimination of the yellow pitahaya materials, as well as to the formation of groups. The more discriminating quantitative variables were associated with the fruits, such as weight, length, peel/pulp ratio, number of fruits, and soluble solids, important characteristics for marketing and fruit consumption. The qualitative descriptors in the open-field and covered production systems showed patterns of similarity between the genotypes of the same system and between the two evaluated systems, showing phenotypic segregation for characteristics such as texture of the phylloclade surface, shape of the areolas, degree of pigmentation, and fruit shape.
The genotypes in the open-field system showed the best results for fruit weight and pulp weight. Likewise, they obtained the highest values for sugar content, an important characteristic for excellent commercial quality. The more outstanding genotypes in terms of commercial attributes were genotype 7 and genotype 3, which can be included in selection and genetic improvement programs for yellow pitahaya in Colombia.

Supplementary Materials

The following supporting information can be downloaded at: https://www.mdpi.com/article/10.3390/agronomy12071582/s1: Figure S1: Georeferencing of the 13 farms evaluated in the municipality of Miraflores, Boyacá. Source: Google Earth, 2022. Figure S2: Mixed factor analysis in the open-field system. Figure S3: Mixed factor analysis in the covered system.

Author Contributions

Conceptualization, A.C.M.-C., E.H.M.-H. and Y.M.-C.; methodology, A.C.M.-C. and E.H.M.-H.; validation, A.C.M.-C., Ó.J.S.-Q. and Y.M.-C.; formal analysis, A.C.M.-C., Ó.J.S.-Q. and E.H.M.-H.; investigation, A.C.M.-C., E.H.M.-H., Y.M.-C. and Ó.J.S.-Q.; resources, A.C.M.-C.; data curation, E.H.M.-H.; writing—original draft preparation, A.C.M.-C., E.H.M.-H., Y.M.-C. and Ó.J.S.-Q.; writing—review and editing, A.C.M.-C., E.H.M.-H., Y.M.-C. and Ó.J.S.-Q.; visualization, A.C.M.-C., E.H.M.-H., Y.M.-C. and Ó.J.S.-Q.; supervision, A.C.M.-C.; project administration, A.C.M.-C.; funding acquisition, A.C.M.-C. All authors have read and agreed to the published version of the manuscript.

Funding

This research was funded by the Patrimonio Autónomo Fondo Nacional de Financiamiento para la Ciencia, la Tecnología y la Innovación Francisco José de Caldas- MinCiencias, Gobernación de Boyacá (Cód: 110986575466).

Data Availability Statement

Not applicable.

Conflicts of Interest

The authors declare no conflict of interest.

References

  1. Jalgaonkar, K.; Kumar, M.; Bibwe, B.; Kannaujia, P. Postharvest profile, processing and waste utilization of dragon fruit (Hylocereus Spp.): A Review. Food Rev. Int. 2022, 38, 733–759. [Google Scholar] [CrossRef]
  2. Betancur, J.; Muriel, S.; González, E. Morphological characterization of the red dragon fruit Selenicereus undatus (Haw.) D.R. Hunt—under growing conditions in the municipality of San Jerónimo (Antioquia, Colombia). Rev. Fac. Nac. Agron. 2020, 73, 9019–9027. [Google Scholar] [CrossRef]
  3. Morillo, A.; Manjarres, E.; Forero, M. Phenotypic diversity of morphological characteristics of pitahaya (Selenicereus megalanthus haw.) germplasm in Colombia. Plants 2021, 10, 2255. [Google Scholar] [CrossRef] [PubMed]
  4. Thokchom, A.; Hazarika, B.N.; Angami, T. Dragon fruit: An advanced potential crop for Northeast India. Agric. Food 2019, 1, 253–256. [Google Scholar]
  5. Verona-Ruiz, A.; Urcia-Cerna, J.; Paucar-Menacho, L. Pitahaya (Hylocereus spp.): Culture, physicochemical characteristics, nutritional composition, and bioactive compounds. Sci. Agropecu. 2020, 11, 439–453. [Google Scholar] [CrossRef]
  6. Abirami, K.; Swain, S.; Baskaran, V.; Venkatesan, K.; Sakthivel, K.; Bommayasamy, N. Distinguishing three Dragon fruit (Hylocereus spp.) species grown in Andaman and Nicobar Islands of India using morphological, biochemical and molecular traits. Sci. Rep. 2021, 11, 2894. [Google Scholar] [CrossRef]
  7. Pásko, P.; Galanty, A.; Zagrodzki, P.; Gyu-Ku, Y.; Luksirikul, P.; Weisz, M.; Gorinstein, S. Bioactivity and cytoxicity of different species of pitaya fruits—A comparative study with advanced chemometric analysis. Food Biosci. 2021, 40, 100888. [Google Scholar] [CrossRef]
  8. Red de Información y Comunicación Del Sector Agropecuario Colombiano—Agronet, (2021). Available online: https://www.agronet.gov.co/estadistica/Paginas/home.aspx/cod=1 (accessed on 22 April 2022).
  9. Morillo, A.; Tovar, Y.; Morillo, Y. Caracterización morfológica de Selenicereus megalanthus (K. Schum. ex Vaupel) Moran en la provincia de Lengupá. Cienc. En Desarro. 2016, 7, 23–33. [Google Scholar] [CrossRef]
  10. González, M.A.; Peraza, A.R.; Brochero, H. Insectos asociados a cultivos de pitaya amarilla (Selenicereus megalanthus) en Inzá, Cauca, Colombia. Rev. Colomb. De Entomol. 2019, 45, 1–8. [Google Scholar]
  11. Sudarjat; Leovika, A.; Suminar, E.; Isnaniawardhani, V.; Hasan, M.; Albi, A.; Mubarok, S. Morphological characterization and adaptation of four dragon fruit genotypes in Pangandaran regency of Indonesia. Asian J. Plant Sci. 2019, 18, 21–25. [Google Scholar]
  12. De Oliveira, M.M.T.; Shuhua, L.; Kumbha, D.S.; Zurgil, U.; Raveh, E.; Tel-Zur, N. Performance of Hylocereus (Cactaceae) species and interspecific hybrids under high-temperature stress. Plant Physiol. Biochem. 2020, 153, 30–39. [Google Scholar] [CrossRef] [PubMed]
  13. Goenaga, R.; Marrero, A.; Pérez, D. Yield and fruit quality traits of Dragon Fruit cultivars grown in Puerto Rico. Hortic. Sci. 2020, 30, 803–808. [Google Scholar] [CrossRef]
  14. Rabelo, J.; Monteiro, M.; Alves, D.; Lima, J.; Reis, L.; Santos, N. Reproductive phenology of yellow pitaya in a high-altitude tropical region in Brazil. Acta Sci. Agron. 2020, 42, e43335. [Google Scholar] [CrossRef]
  15. Callejas-Chavero, A.; Vargas-Mendoza, C.F.; Gomez-Hinostrosa, C.; Arriola-Padilla, V.J.; Cornejo-Romero, A. Breeding system in a population of the globose cactus Mammillaria magnimamma at Valle del Mezquital, Mexico. Bot. Sci. 2021, 99, 229–241. [Google Scholar] [CrossRef]
  16. AOAC. Official Method of Analysis, 15th ed.; Association of Official Analytical Chemists: Washington, DC, USA, 1998. [Google Scholar]
  17. Di Rienzo, J.A.; Casanoves, F.; Balzarini, M.G.; Gonzalez, L.; Tablada, M.; Robledo, C.W. Manual del usuario, InfoStat Versión 2020; Brujas, Ed.; Universidad Nacional de Córdoba: Córdoba, Argentina, 2020. [Google Scholar]
  18. Kassambara, A.; Mundt, F. Factoextra: Extract and Visualize the Results of Multivariate Data Analyses. R Package Version 2020, 1, 337–354. [Google Scholar]
  19. Le, S.; Josse, J.; Husson, F. FactoMineR: An R Package for Multivariate Analysis. J. Stat. Softw. 2008, 25, 1–18. [Google Scholar] [CrossRef] [Green Version]
  20. Al-Mekhlafi, N.; Mediani, A.; Hadiani, N.; Abas, F.; Dymerski, T.; Lubinska-Szczygeł, M.; Vearasilp, S.; Gorinstein, S. Metabolomic and antioxidant properties of different varieties and origins of Dragon fruit. Microchem. J. 2020, 160, 105687. [Google Scholar] [CrossRef]
  21. Morillo, A.C.; Mora, M.S.; Morillo, Y. Analysis of genetic diversity of dragon fruit based on ISSR markers in Colombia. Braz. J. Biol. 2022, 82, e256451. [Google Scholar] [CrossRef]
  22. Mejía, H.; Muriel, S.; Montoya, C.; Reyes, C. In situ morphological characterization of Hylocereus spp. (Fam.: Cactaceae) genotypes from Antioquia and Córdoba (Colombia). Rev. Fac. Nac. Agron. Medellín 2013, 66, 6845–6854. [Google Scholar]
  23. De Dios, H.C.A. A new subespecies of Hylocereus undatus (Cactaceae) from southeastern Mexico. Haseltonia 2005, 11, 11–17. [Google Scholar] [CrossRef]
  24. Ortíz, T.A.; Assari, L.S. Pitaya fruit quality (Hylocereus undatus [Haworth] Britton & Rose) according to physiological maturity. A review. Rev. Colomb. Cienc. Hort. 2021, 14, 63–75. [Google Scholar] [CrossRef]
  25. Cruz, I. La Pitahaya Roja (Hylocereus Ocamponis) en el Estado de Michoacán. Tesis de Licenciatura, trabajo de pregrado; Universidad Autónoma Chapingo, Departamento de Fitotecnia, Chapingo: Texcoco, México, 2008; p. 66. [Google Scholar]
  26. Tran, D.H.; Yen, C.R. Morphological characteristic and pollination requirement in red pitaya (Hylocereus spp.). Int. Sch. Sci. Res. Innov. 2014, 8, 268–272. [Google Scholar]
  27. Mahmud, L.A.; Angkat, N.U.; Damanik, R.I. Characterization and evaluation of the variability of dragon fruit accesions in Dairi District, North Sumatra Province, Indonesia. Nusant. Biosci. 2021, 13, 138–145. [Google Scholar] [CrossRef]
  28. Castro, A.; Roveri, R.; Chiamolera, F.; Mota, D.; Geraldo, A. Morphological traits as tool to verify genetic variability of interspecific dragon fruit hybrids. Rev. Bras. Frutic. 2017, 39. [Google Scholar] [CrossRef] [Green Version]
  29. Cañar, D.; Caetano, C.; Bonilla, M. Caracterización fisicoquímica y proximal del fruto de pitahaya amarilla (Selenicereus megalanthus (K. Schum. Ex Vaupel) Moran) cultivada en Colombia. Rev. Agron. 2014, 22, 77–87. [Google Scholar]
  30. Sotomayor, A.; Pitizaca, S.; Sánchez, M.; Burbano, A.; Díaz, A.; Nicolás, J.; Viera, W.; Caicedo, C.; Vargas, Y. Evaluación físicoquímica de la fruta de pitahaya (Selenicereus megalanthus Haw.) en diferentes estados de desarrollo. Enf. UTE 2019, 10, 89–96. [Google Scholar] [CrossRef] [Green Version]
  31. Osuna, T.; Ibarra, M.; Rangel, M.; Valdez, J.; Villareal, M.; Hernández, S. Calidad poscosecha de frutos de pitahaya (Hylocereus undatus Haw.) cosechados en tres estados de madurez. Rev. Fitotec. Mex. 2011, 34, 63–72. [Google Scholar]
  32. Rangel, I.M.; Soares, D.; Rodrigues, F.A.; Pasqual, M.; Salles, L.A. Growth and maturation of white-fleshed dragon fruit. Res. Soc. Dev. 2020, 10, e1191071162288. [Google Scholar]
  33. Hossain, F.M.; Numan, S.M.N.; Akhtar, S. Cultivation, nutritional value, and health benefits of Dragon Fruit (Hylocereus spp.): A Review. Int. J. Hortic. Sci. Technol. 2021, 8, 259–269. [Google Scholar] [CrossRef]
Figure 1. Survey responses from 13 producers in the municipality of Miraflores for the diagnostic census: (A) certification level; (B) land tenancy; (C) materials used by the producers for the construction of plant trellises; and (D) origin of the material planted on the farms.
Agronomy 12 01582 g001
Figure 2. Pearson correlations between quantitative variables of yellow pitahaya genotypes: (a) open field and (b) under cover. Number of fruits (NF), length of the phylloclade (LF), distance between areolas (DBA), number of spines per areola (NSA), width of the ribs (RW), length of the largest spine (LS), length of the fruit (LF), fruit width (FW), length/width ratio (RLW), fruit weight (FWE), peel weight (SW), pulp weight (PW), pericarp thickness (PT), peel/pulp ratio (PFR), number of bracts (NB), soluble solids (SS), and titratable acidity (TA).
Agronomy 12 01582 g002
Figure 3. Principal component analysis of the quantitative variables of the yellow pitahaya genotypes: (a) open-field system and (b) under cover. Number of fruits (NF), length of the phylloclade (LF), distance between areolas (DBA), number of spines per areola (NSA), width of the ribs (RW), length of the largest spine (LS), length of the fruit (LF), fruit width (FW), length/width ratio (RLW), fruit weight (FWE), peel weight (SW), pulp weight (PW), pericarp thickness (PT), peel/pulp ratio (PFR), number of bracts (NB), soluble solids (SS), and titratable acidity (TA).
Agronomy 12 01582 g003
Figure 4. Hierarchical cluster analysis of yellow pitahaya genotypes: (a) open-field system and (b) system under cover.
Agronomy 12 01582 g004
Figure 5. Multiple correspondence analysis of the contributions of qualitative variables in the systems: (a) open field and (b) under cover.
Agronomy 12 01582 g005
Figure 6. Cluster analysis showing the grouping of genotypes according to the qualitative variables evaluated in the genotypes of yellow pitahaya in the systems: (a) open field and (b) under cover.
Agronomy 12 01582 g006
Figure 7. Cluster analysis showing the conformation, taking into account the quantitative and qualitative variables evaluated in 12 genotypes of yellow pitahaya in (a) open fields and (b) under cover.
Agronomy 12 01582 g007
Table 1. Model survey for the execution of the diagnostic census of the 13 farms involved in the study.
GENERAL DATA
Farmer name Contact
GeoreferencingLatitude NLongitude WAltitude
DistrictFarm name
Farm DimensionsTenancyOwnedRentedCompanyOrganization
Established crops
PITAHAYA CROP INFORMATION
Production systemCoveredOpen field
Culture establishment date (age)Time of cover implementation
Crop variety Characteristics of the variety
Origin of planting material: (own, purchased)How seeds are selected
Seed treatments Phenological stage
Sowing distanceNumber of plants
Crop dimensionsMachinery and equipment used for crop maintenance
Differences between the plants of the crop? Which?Production per year (Kg/ha)
Production in last harvest Production type
DomesticExport
FERTILIZATION (CHEMICAL, BIOLOGICAL)
Fertilization typeApplication dateCommercial nameCompositionQuantity
Pruning typeMaintenance Production
Pruning dateFootwear disinfection area
Plant waste managementOther practices
DISEASE MANAGEMENT (CHEMICAL, BIOLOGICAL, ECOLOGICAL)
Application dateTarget diseaseCommercial name, active ingredientApplication quantity
PEST MANAGEMENT (CHEMICAL, BIOLOGICAL, ECOLOGICAL)
Application dateTarget pestCommercial name, active ingredientApplication quantity
WEED MANAGEMENT (CHEMICAL)
Application dateWeedCommercial nameApplication quantity
Table 2. Descriptors used in the morphoagronomic characterization of phylloclades.
AbbreviationCharacteristicScale
TXFSurface textureSmooth
Rough
PWPresence of waxPresent
Absent
SMAShape of the margin between areolasConcave
Convex
Straight
CARColor of areolasLight gray
Gray
Dark gray
Dark yellow
CSColor of spinesDark brown
Grayish brown
Light brown
Brown
Blackish brown
PVSPigmentation in vegetative shootsAbsent
Slight
Intense
DBADistance between areolasCentimeters
RWRib width
LSLongest spine length
PLPhylloclade length
NFNumber of fruitsNumber
NSANumber of spines per areola
Table 3. Descriptors used in the morphoagronomic characterization of fruits.
AbbreviationCharacteristicScale
MGFSMature and green fruit shapeElongated
Round
Compressed
LFLengthMillimeters (mm)
WFWidth
PTPericarp thickness
PWPeel weightGrams (g)
PFFruit weight
RLWLength/width ratio
PPRPeel/pulp ratio
NBNumber of bractsNumber
SSTotal soluble solids°Brix
ATTotal titratable acidity%
Table 4. Farms registered and evaluated in the municipality of Miraflores, Boyacá.
Farm NameSidewalkProductive System
Open FieldUnder Cover
El PorvenirRusa++
San AntonioRusa +
Las GuacamayasRusa +
El SecretoRusa +
El PlanRusa++
El PedregalRusa++
La UniónRusa +
El PorvenirHato++
Gran RicardoRusa–La Vega +
El MiradorPueblo y Cajón +
El DerechoSuna Arriba++
SantaféSuna Arriba +
El PensamientoSuna Abajo+
Table 5. Descriptive statistics of quantitative morphoagronomic descriptors of fruits and phylloclades in open-field systems.
VariableGen 1Gen 5Gen 6Gen 7Gen 15Gen 17MeanDeviation%CV
Phylloclade
Number of fruits (NF)2.401.902.102.904.001.502.470.8935.96
Phylloclade length (PL)93.3078.5087.3096.60116.20127.1099.8318.3118.34
Distance between areolas (DBA)4.914.344.854.574.474.794.660.234.92
Number of spines per areola (NSA)3.002.602.902.903.002.502.820.217.59
Rib width (RW)5.604.244.715.234.744.314.810.5310.97
Length of largest spine (LS)0.320.250.310.280.280.280.290.038.73
Fruit
Fruit length (LF)101.22100.2889.16100.3393.3999.3097.284.885.01
Fruit width (FW)60.027.1456.3265.3249.0758.3659.877.3012.20
Length/width ratio (RLW)1.691.431.601.562.691.711.780.4625.68
Fruit weight (FW)204.90274.10161.50293.75180.80199.16219.0452.8824.14
Shell weight (SW)76.16105.8367.8377.3366.0059.5075.4416.3021.61
Pulp weight (PW)129.16148.8386.33114.3387.33129.00115.8325.0021.58
Pericarp thickness (PT)3.544.184.263.853.692.373.650.6818.77
Peel to flesh ratio (PFR)0.590.730.880.670.750.460.680.1421.21
Number of bracts (NB)44.4039.4046.0041.8740.6039.8342.022.656.32
Soluble solids (SS)15.8015.7315.3016.1012.4315.8515.201.389.09
Titratable acidity (TA)0.200.180.210.180.180.240.200.0212.11
CV = Coefficient of variation.
Table 6. Descriptive statistics of quantitative morphoagronomic descriptors of fruit and phylloclade in the undercover system.
VariableGen 1Gen 2Gen 3Gen 4Gen 5Gen 6Gen 7Gen 8Gen 9Gen 14Gen 15Gen 16MeanDeviation%CV
Phylloclade
Number of fruits (NF)4.63.74.55.92.32.42.53.32.42.953.73.71.1932.12
Phylloclade length (PL)119.19127.4127.89128.93110.4890.2292.6289.95112.39135.21114.9205.7121.2430.8525.45
Distance between areolas (DBA)5.656.275.866.076.085.535.365.034.96.295.375.295.640.478.37
Number of spines per areola (NSA)3.33333.13.12.92.72.73.1332.990.175.6
Rib width (RW)6.645.425.537.267.036.165.855.444.566.196.495.025.970.8113.63
Length of largest spine (LS)0.360.350.340.290.370.330.320.270.320.340.360.320.330.038.88
Fruit
Fruit length (LF)91.5595.07111.797.04100.3793.9696.9899.57103.1797.0799.2895.898.465.195.27
Fruit width (FW)52.7855.372.3761.6468.1751.2555.3755.9965.08102.9467.7259.2563.9913.9821.85
Length/width ratio (RLW)1.741.731.541.581.481.841.881.791.71.641.481.631.670.138.01
Fruit weight (FWE)137.4151.2265.6198278.5125.8174.2155.3180.8171.9223.2175.8186.4847.725.58
Shell weight (SW)69.1674.33126.6675.61095683.552.6671.1674.57967.1678.2320.826.59
Pulp weight (PW)7857123113141.3360.33106.595.5109.16109.5108.1698.510024.5324.53
Pericarp thickness (PT)3.755.395.453.14.413.373.712.843.123.113.913.453.80.8722.86
Peel to flesh ratio (PFR)0.911.451.030.750.820.950.80.570.670.760.690.690.840.2327.51
Number of bracts (NB)44.244.946.23837.548.743.85148.847.545.841.744.844.169.28
Soluble solids (SS)12.1312.217.615.7414.7115.316.7516.1614.2512.2815.5113.2514.661.8512.65
Titratable acidity (TA)0.220.230.280.160.180.210.160.130.230.190.190.190.20.0420.51
CV= Coefficient of variation.
Table 7. Frequency analysis of the qualitative descriptors used in the morphoagronomic characterization of the yellow pitahaya genotypes in the open-field system in the municipality of Miraflores, Boyacá.
VariableCharacteristicGen 1Gen 5Gen 6Gen 7Gen 15Gen 17
Surface texture of the phylloclade (STP)Smooth1001005010020100
Rough00500800
Margin shape between areolas (MSA)Concave704070802030
Convex0000800
Recto30603020070
Color of areolas (CAR)Light gray100100201010030
Dark gray008090070
Color of spines (CES)Dark brown100100502010070
Grayish brown0001000
Light brown005070030
Pigmentation in vegetative shoots (PVS)Absent2040103010040
Light600404000
Intense20605030060
Presence of wax (PW)Present10010010010080100
Absent0000200
Green fruit shape (GFS)Elongated10010010010010080
Compressed0000020
Mature fruit shape (MFS)Elongated1001009063100100
Compressed00103800
Table 8. Frequency analysis of the qualitative descriptors used in the morphoagronomic characterization of the yellow pitahaya genotypes in the covered system in the municipality of Miraflores, Boyacá.
Variable CharacteristicGen 1Gen 2Gen 3Gen 4Gen 5Gen 6Gen 7Gen 8Gen 9Gen 14Gen 15Gen 16
Surface texture of the phylloclade (STP)Smooth3050100100100501001001005010090
Rough70500005000050010
Margin shape between areolas (MSA)Concave30708060507070507010010090
Straight7030204050303050300010
Color of areolas (CAR)Light gray90201001001005010060506010080
Dark gray1080000500405040020
Color of spines (CES)Dark brown404050702010902050708080
Grayish brown2000006000020200
Light brown40605030803010805010020
Pigmentation in vegetative shoots (PVS)Absent40907010010050601001008010040
Intense6010300050400020060
Presence of wax (PW)Present100100100100100100100100100100100100
Green fruit shape (GFS)Elongated100100100100701001001001008010090
Compressed000030000020010
Mature fruit shape (MFS)Elongated1008010010020100100100100806080
Round0000000000400
Compressed0200080000020020
Publisher’s Note: MDPI stays neutral with regard to jurisdictional claims in published maps and institutional affiliations.

