
Critical P, K and S Concentrations in Soil and Shoot Samples for Optimal Tedera Productivity and Nodulation


Abstract
:1. Introduction
2. Materials and Methods
2.1. Field Experiments 2017–2019
2.2. Glasshouse Experiment 2021
2.3. Statistical Analyses
3. Results
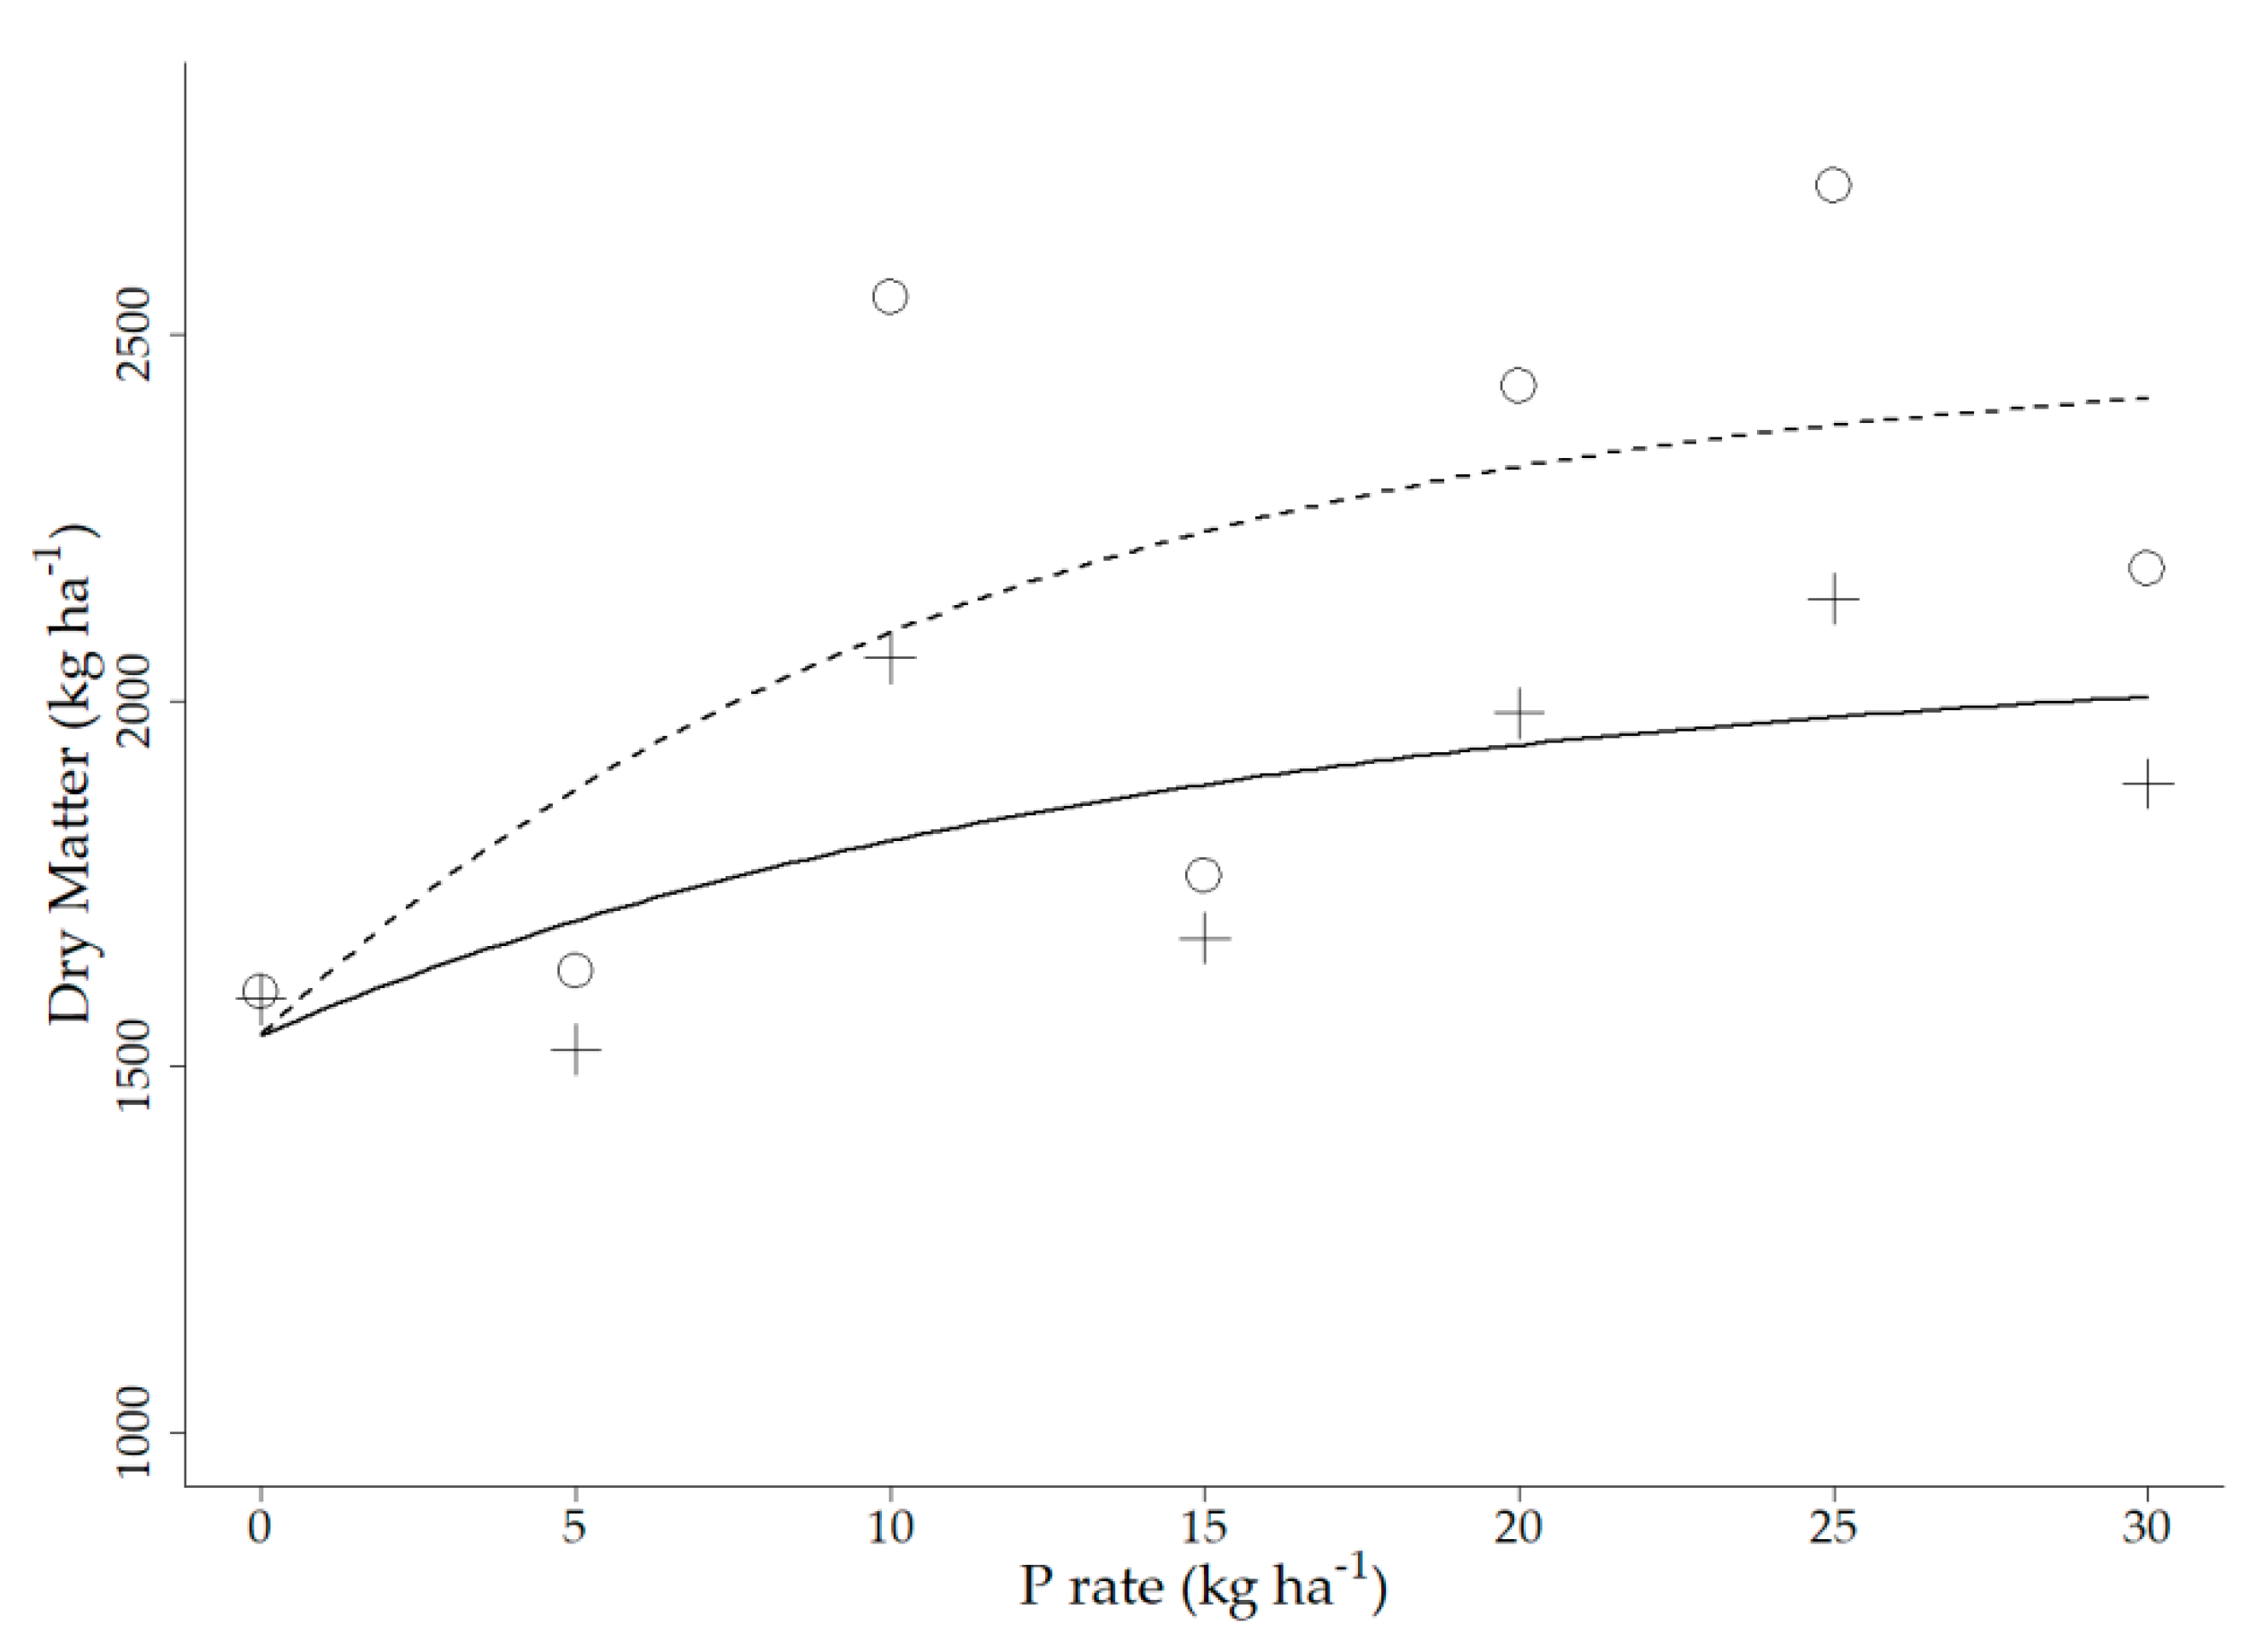
3.1. Field Experiment
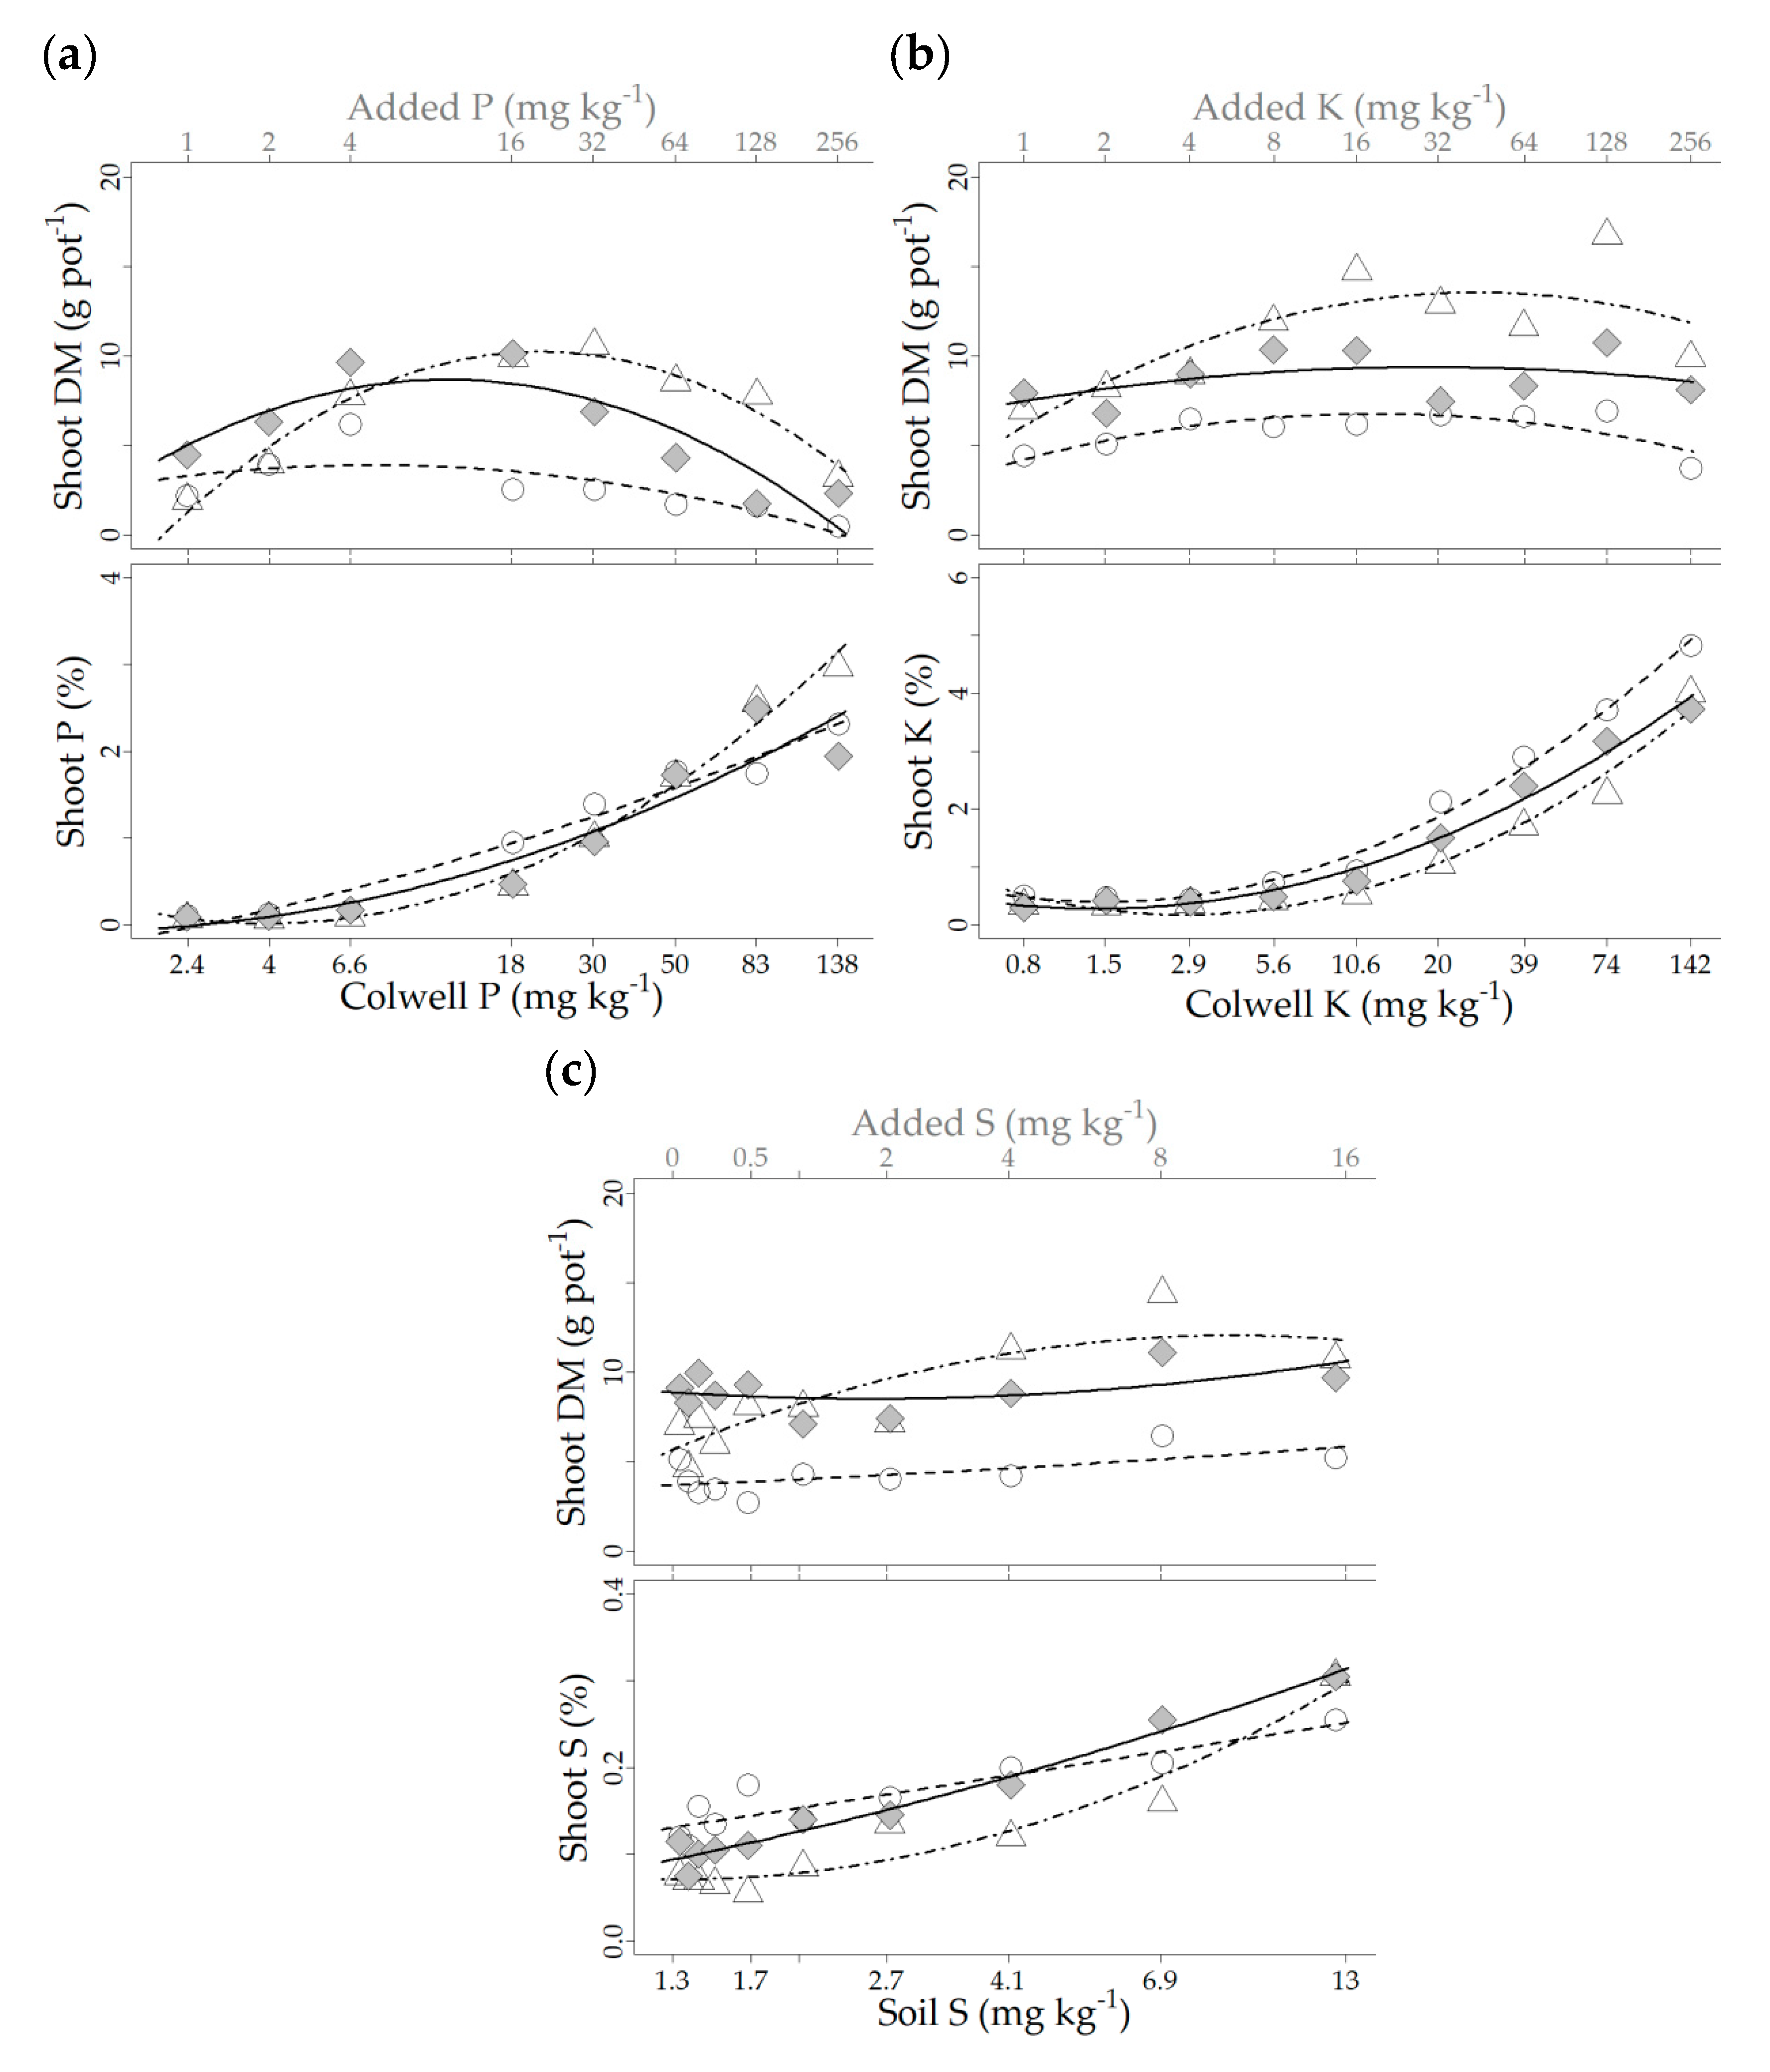
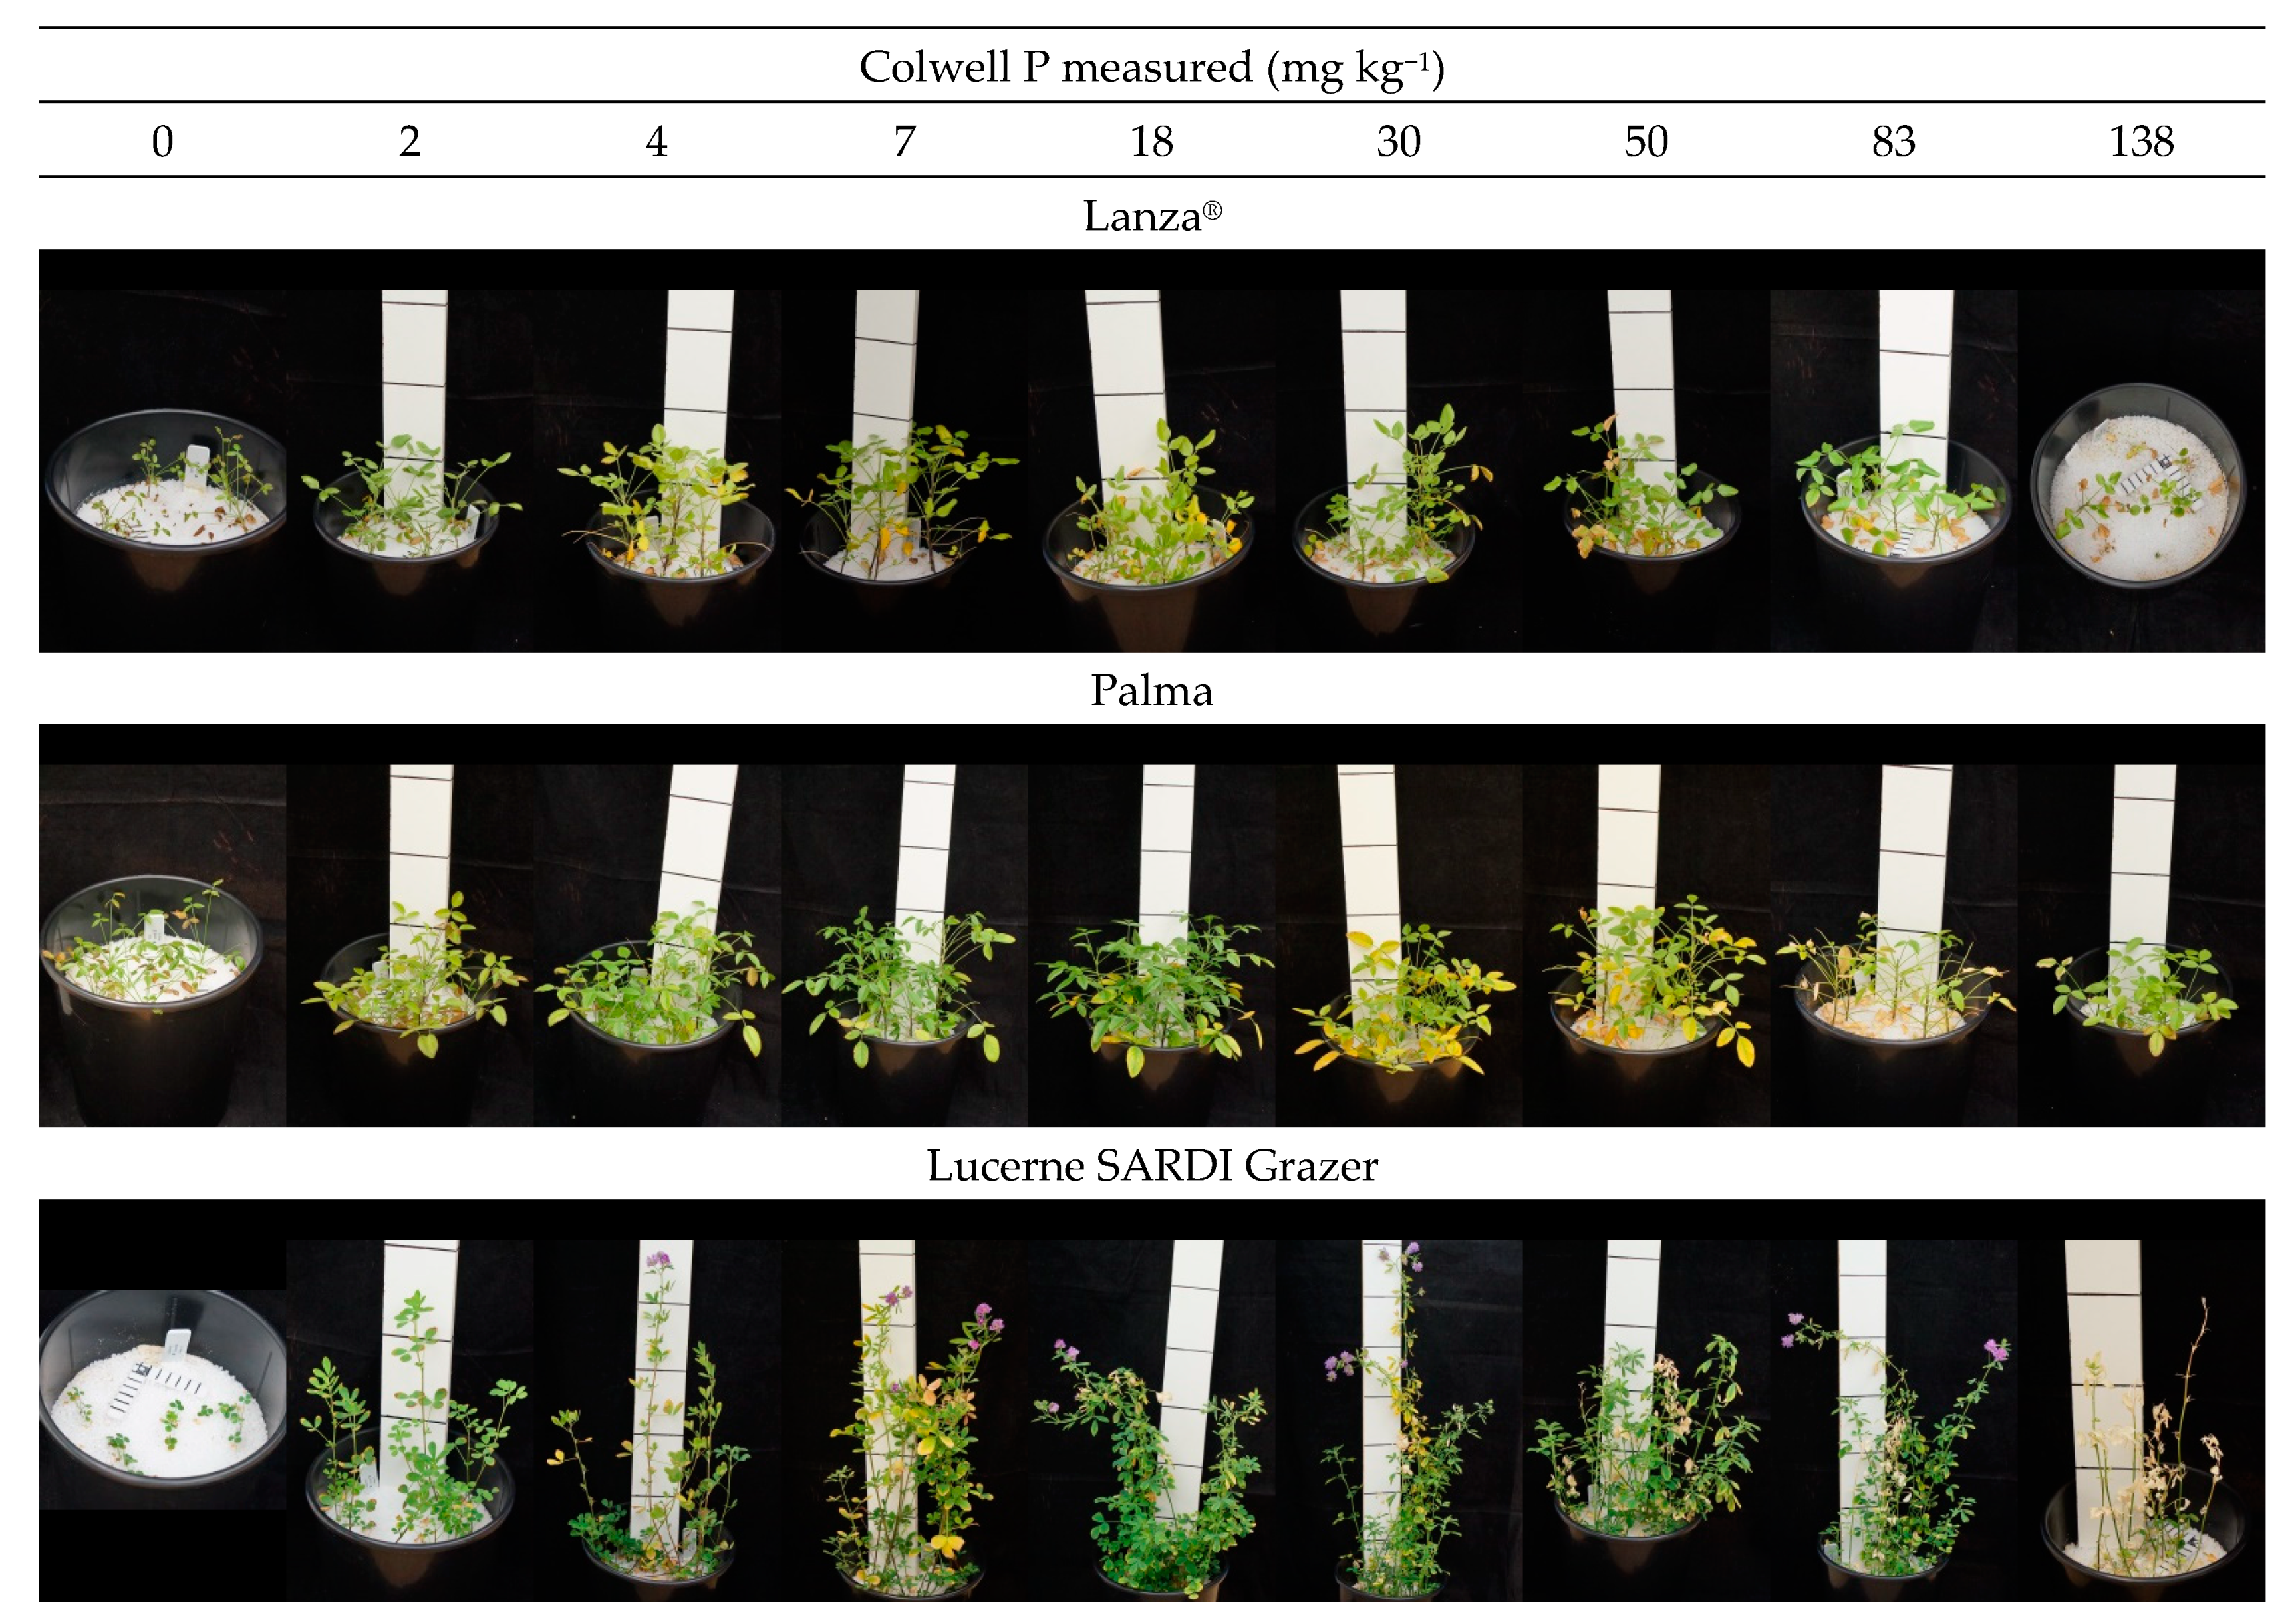
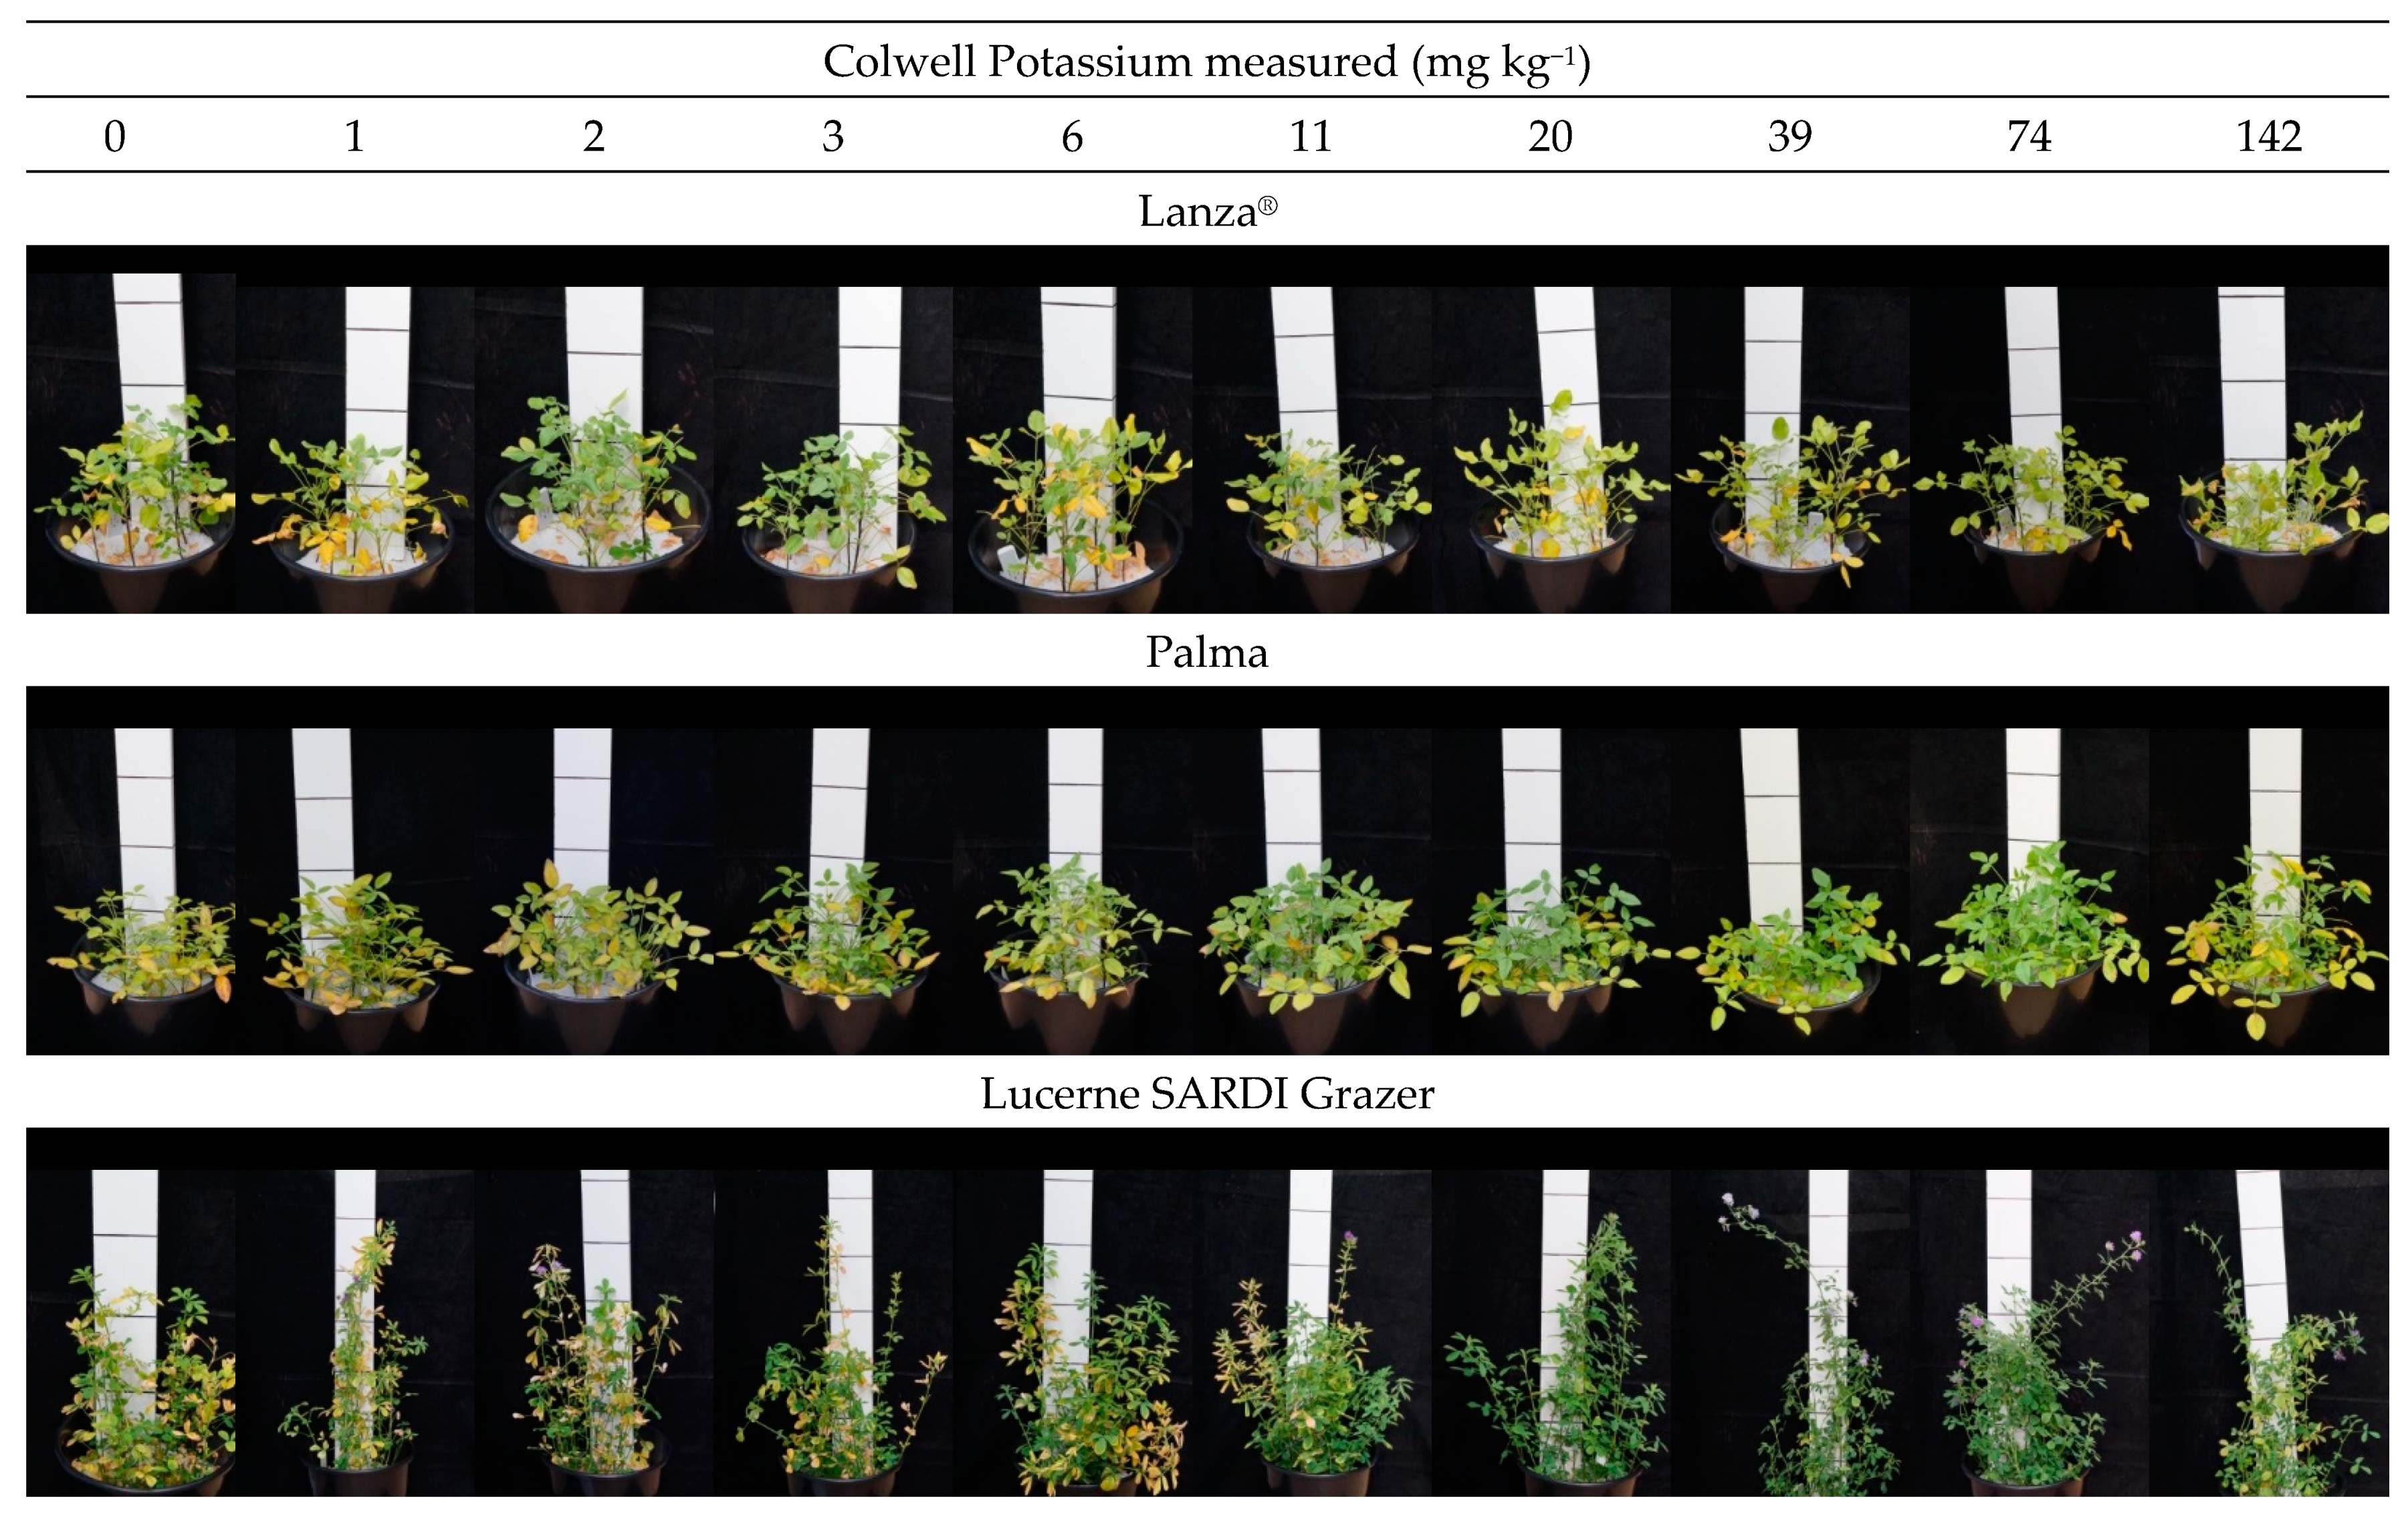
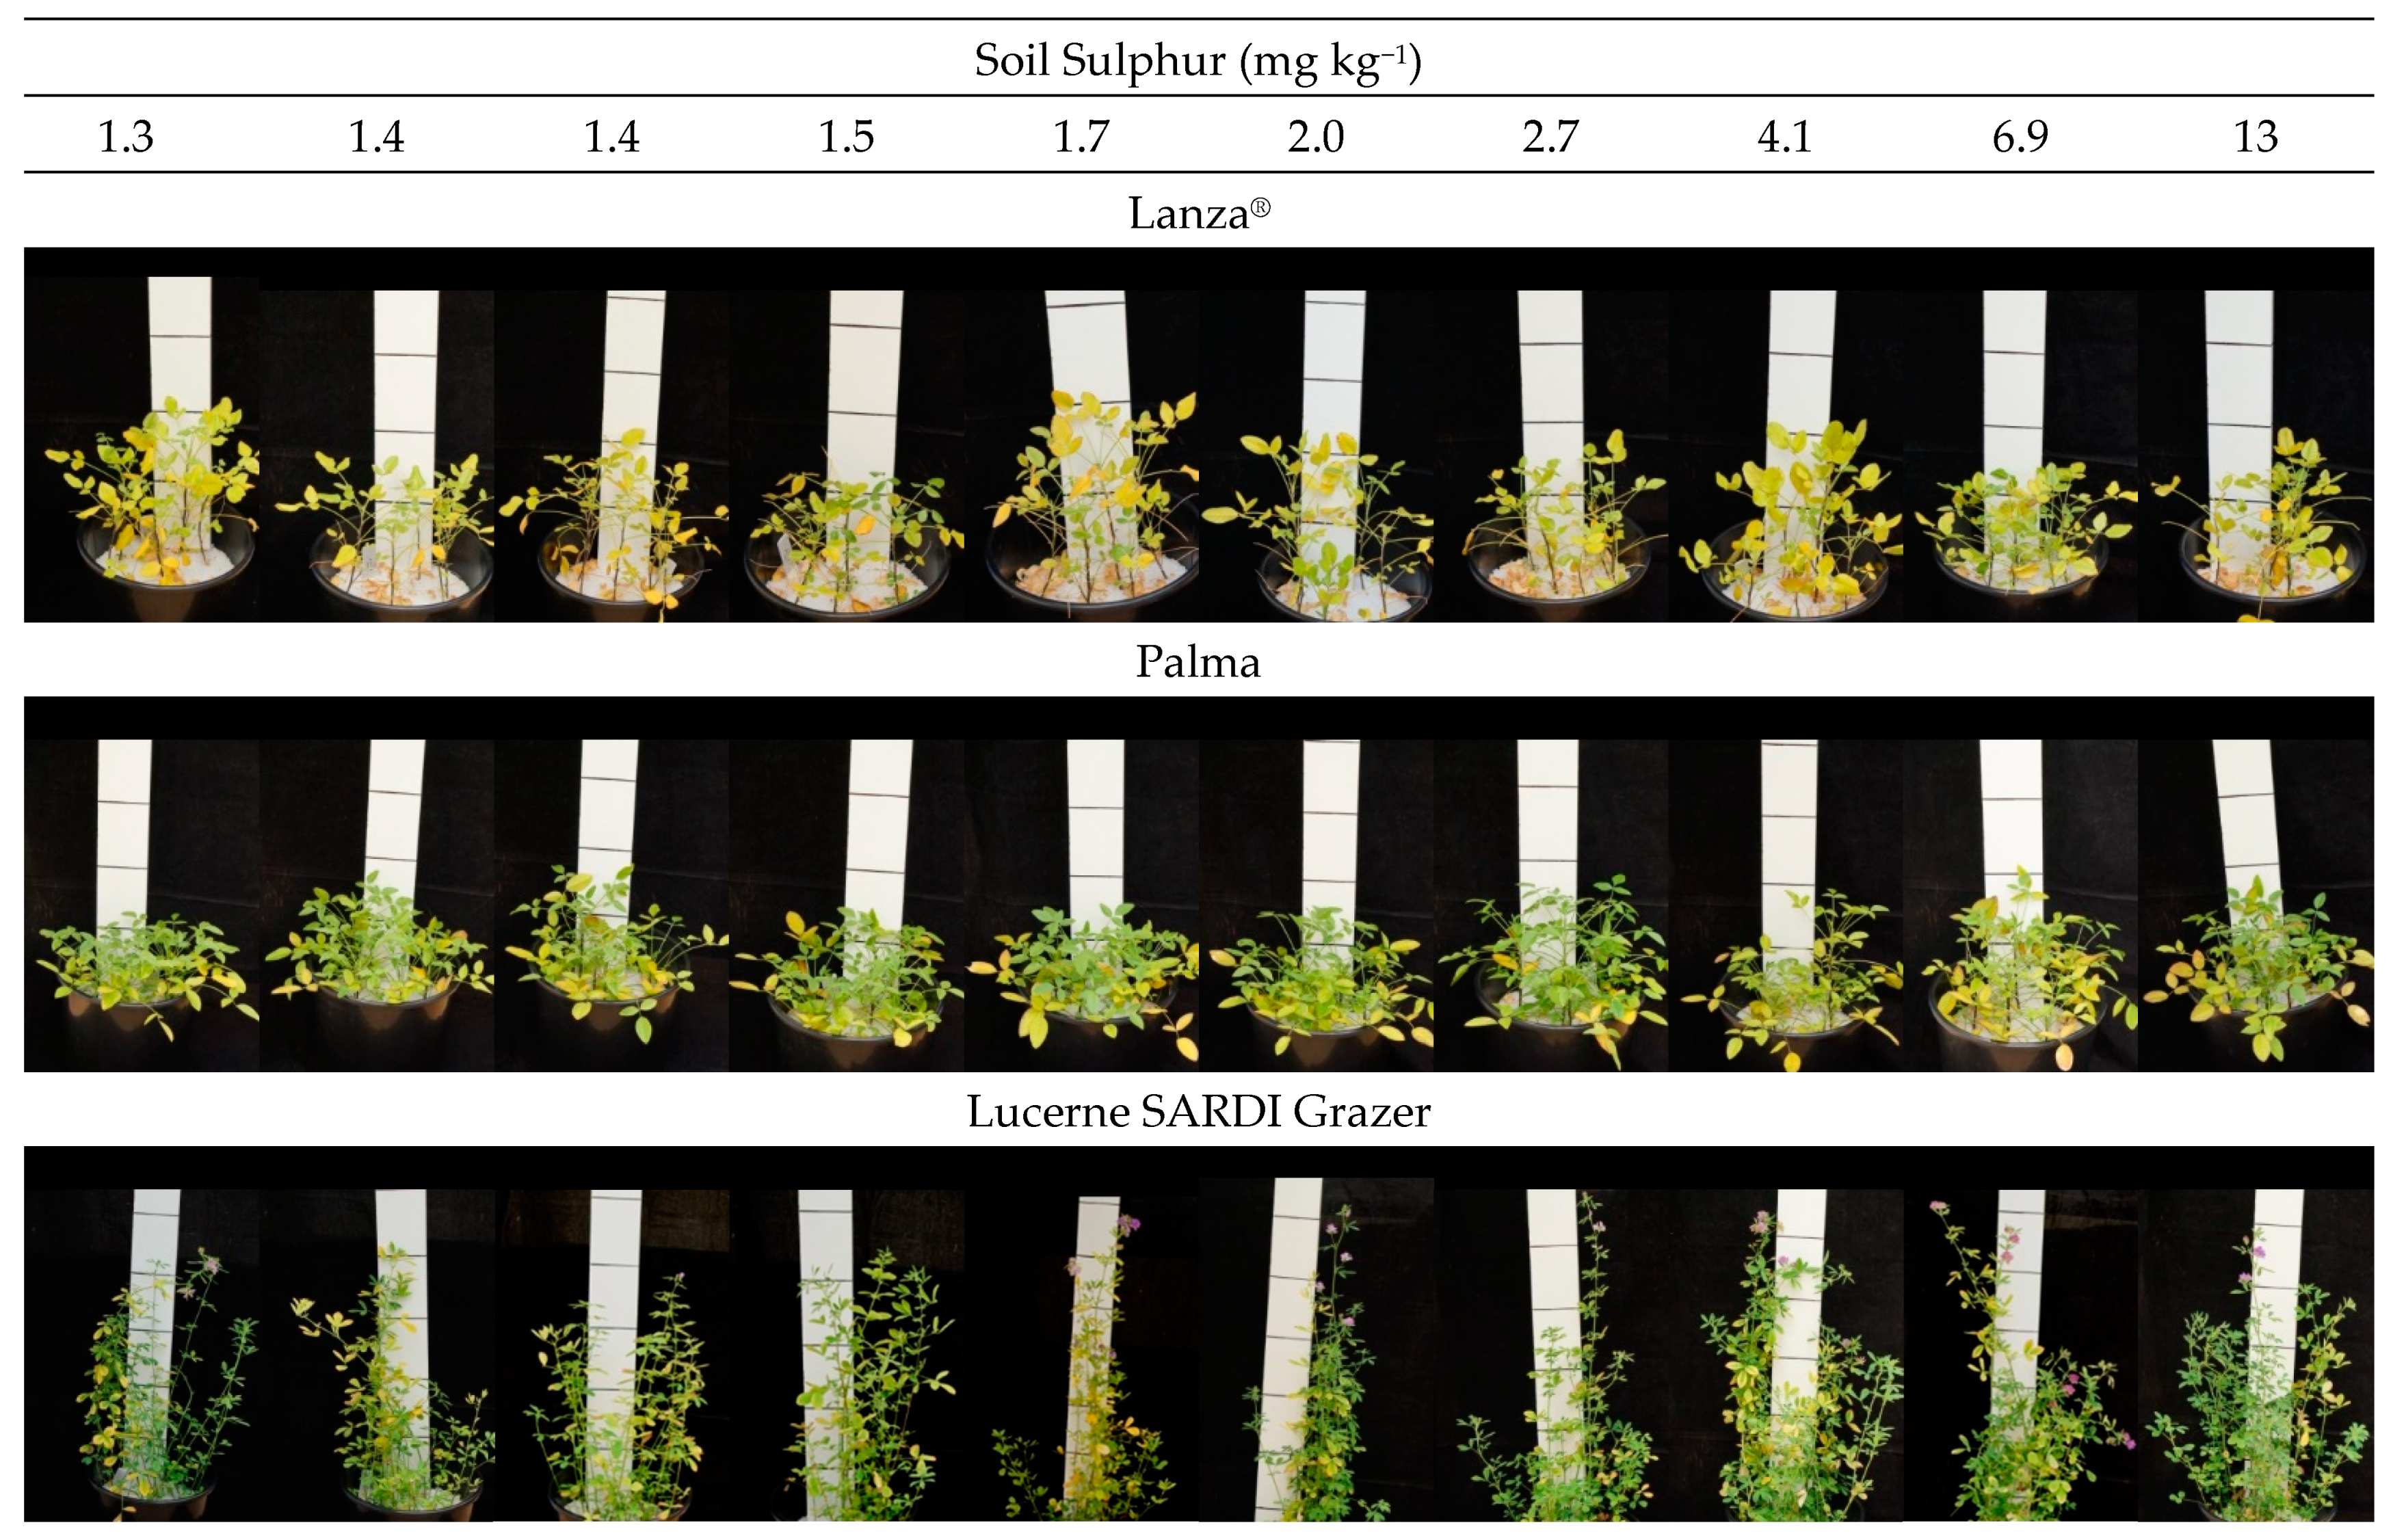
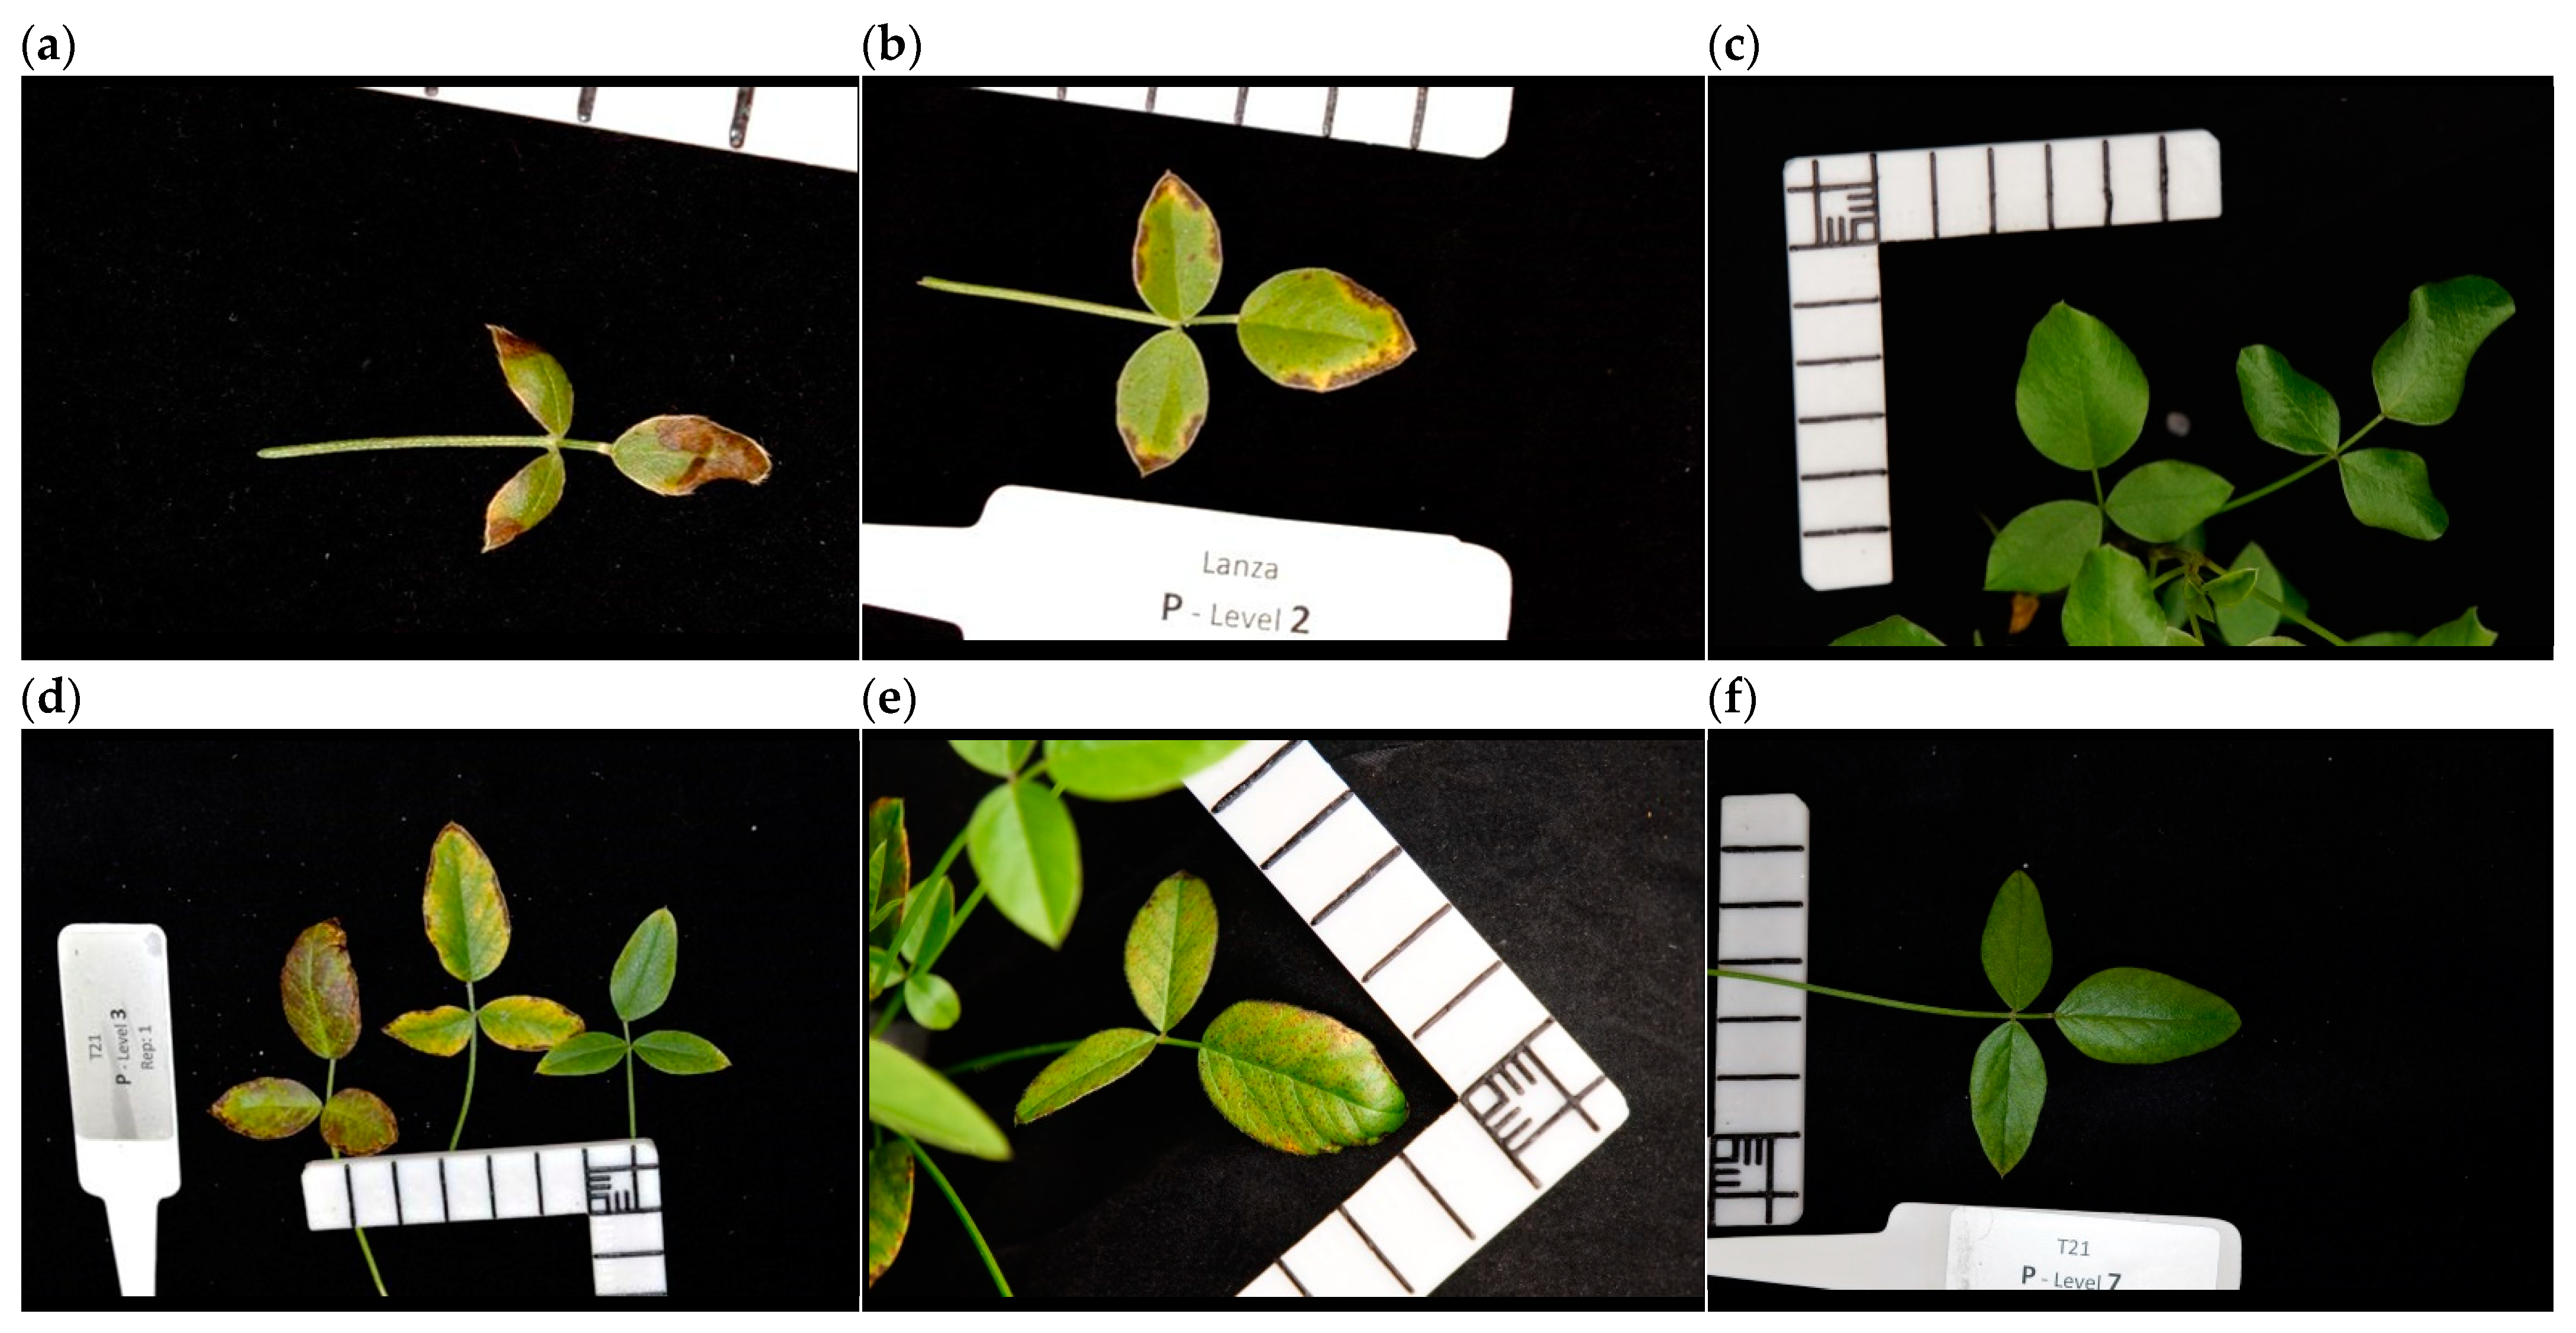
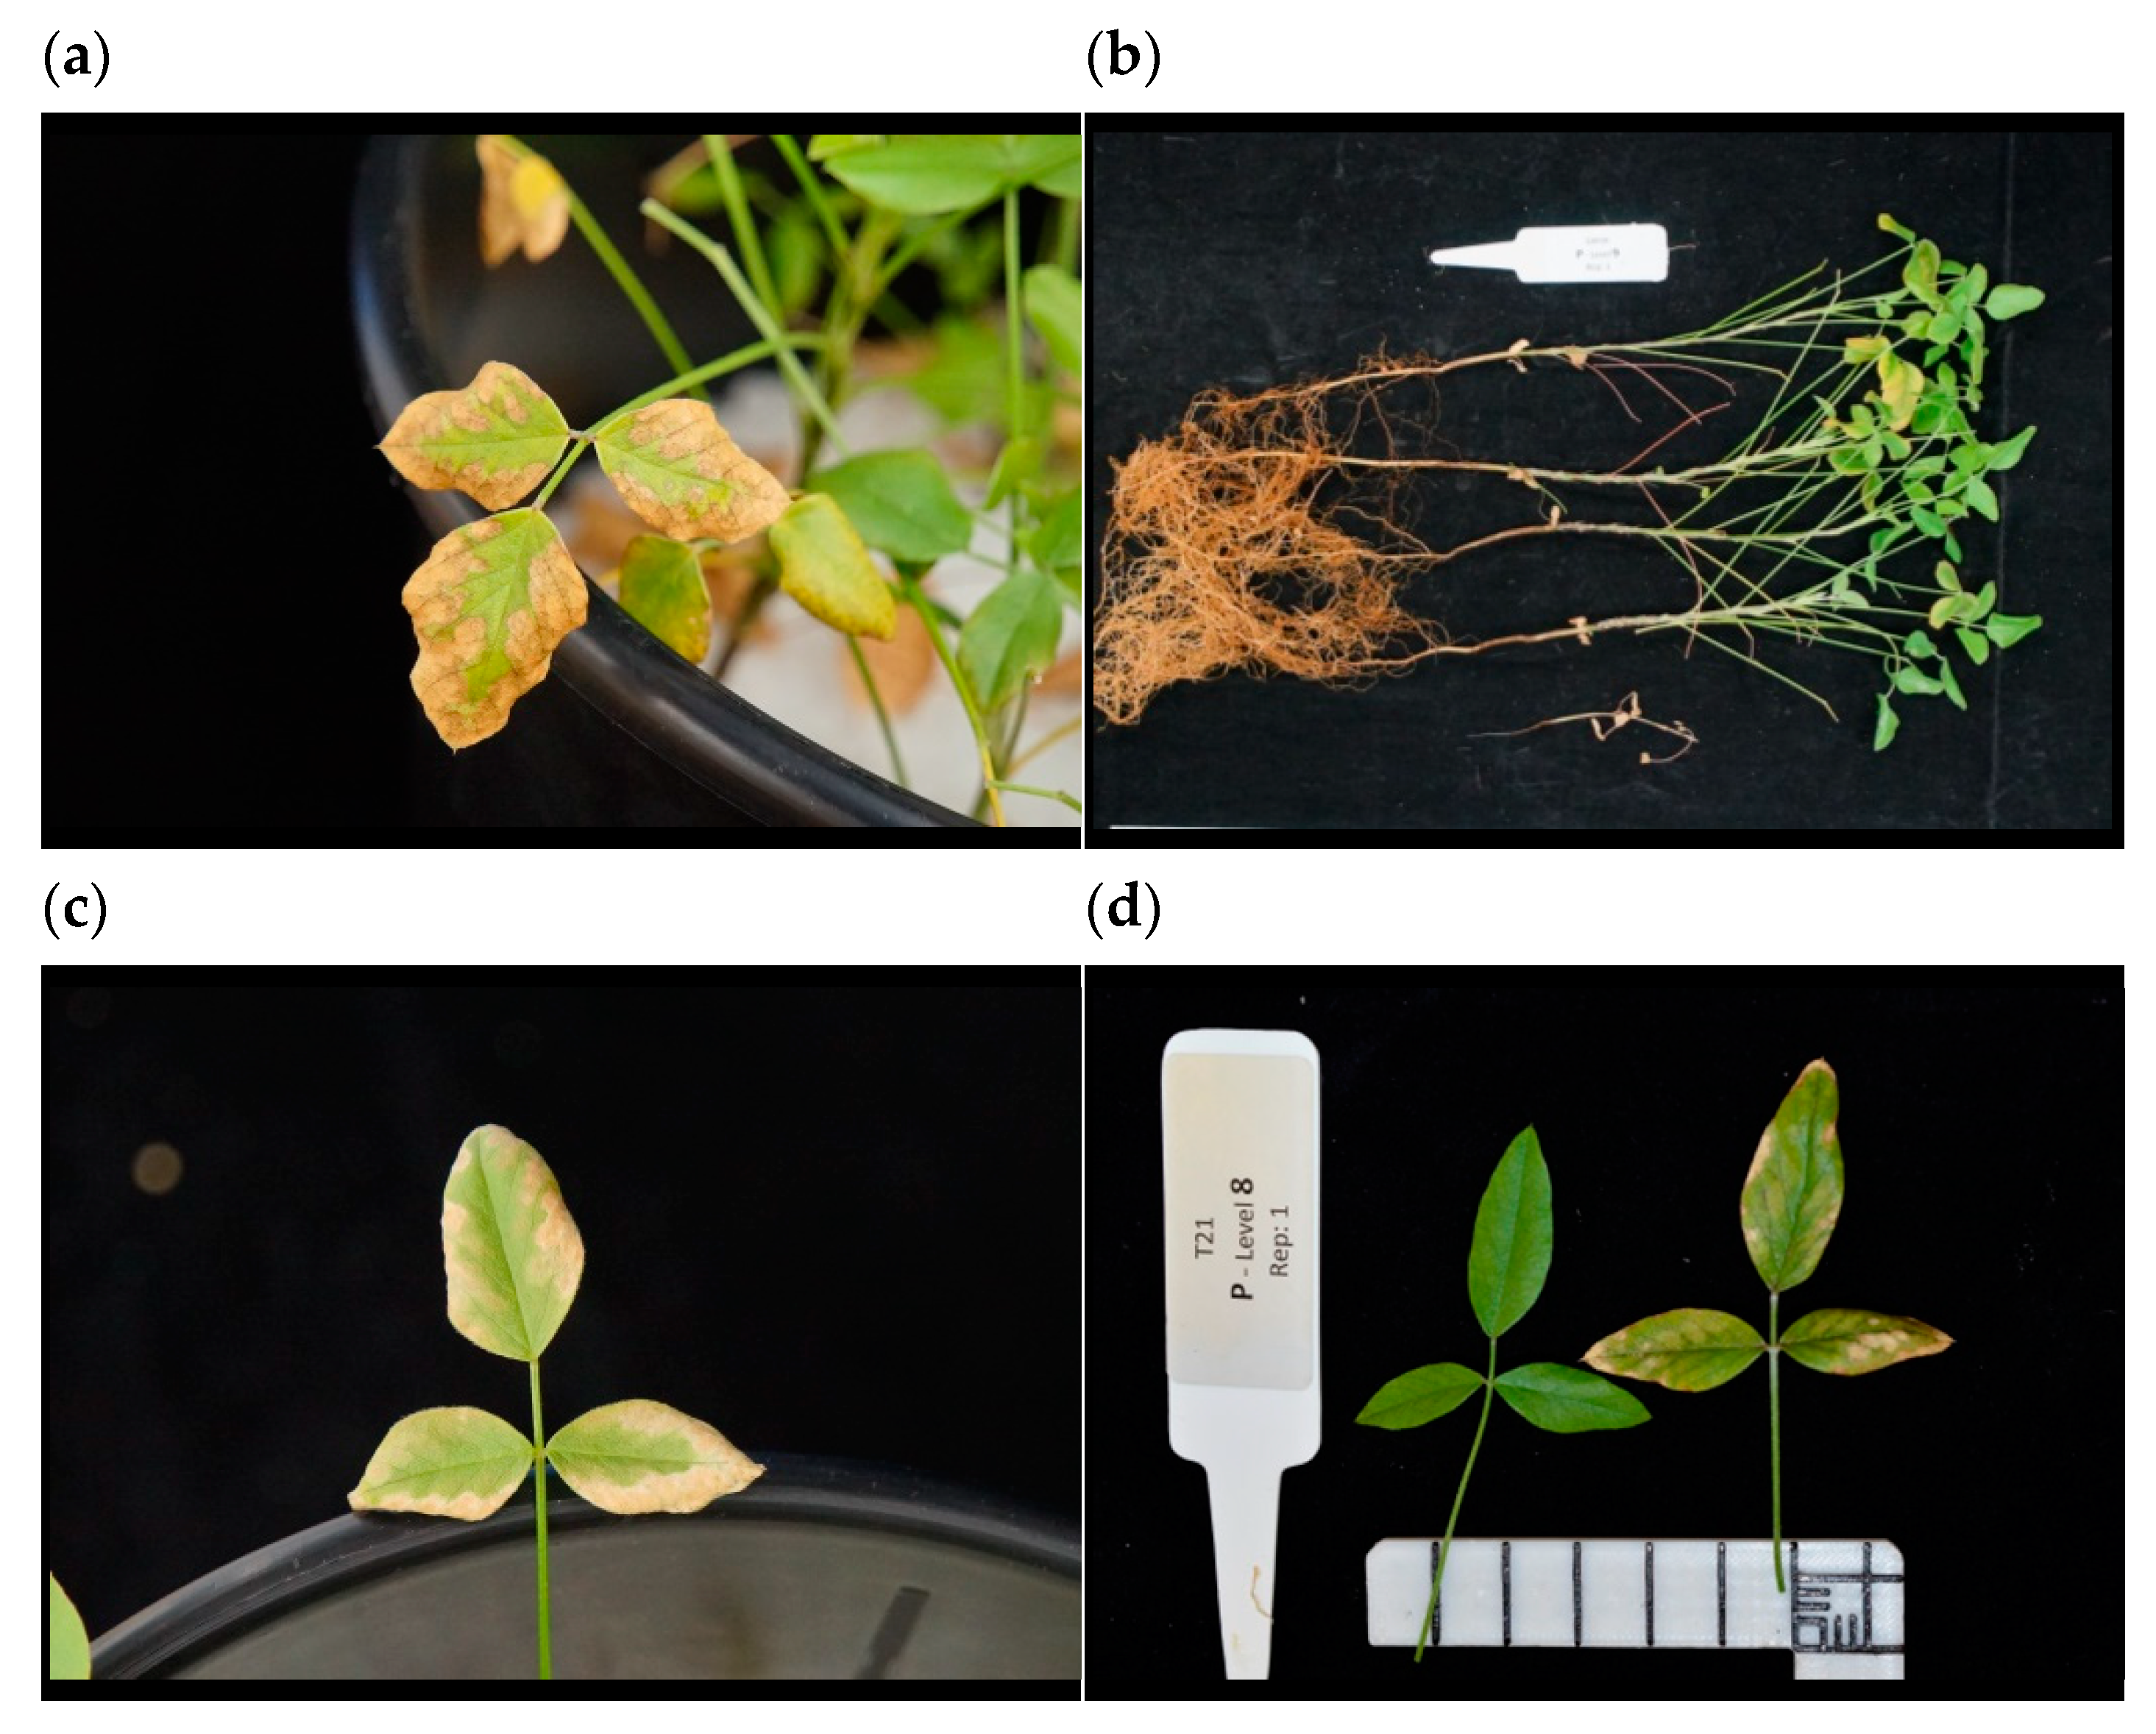
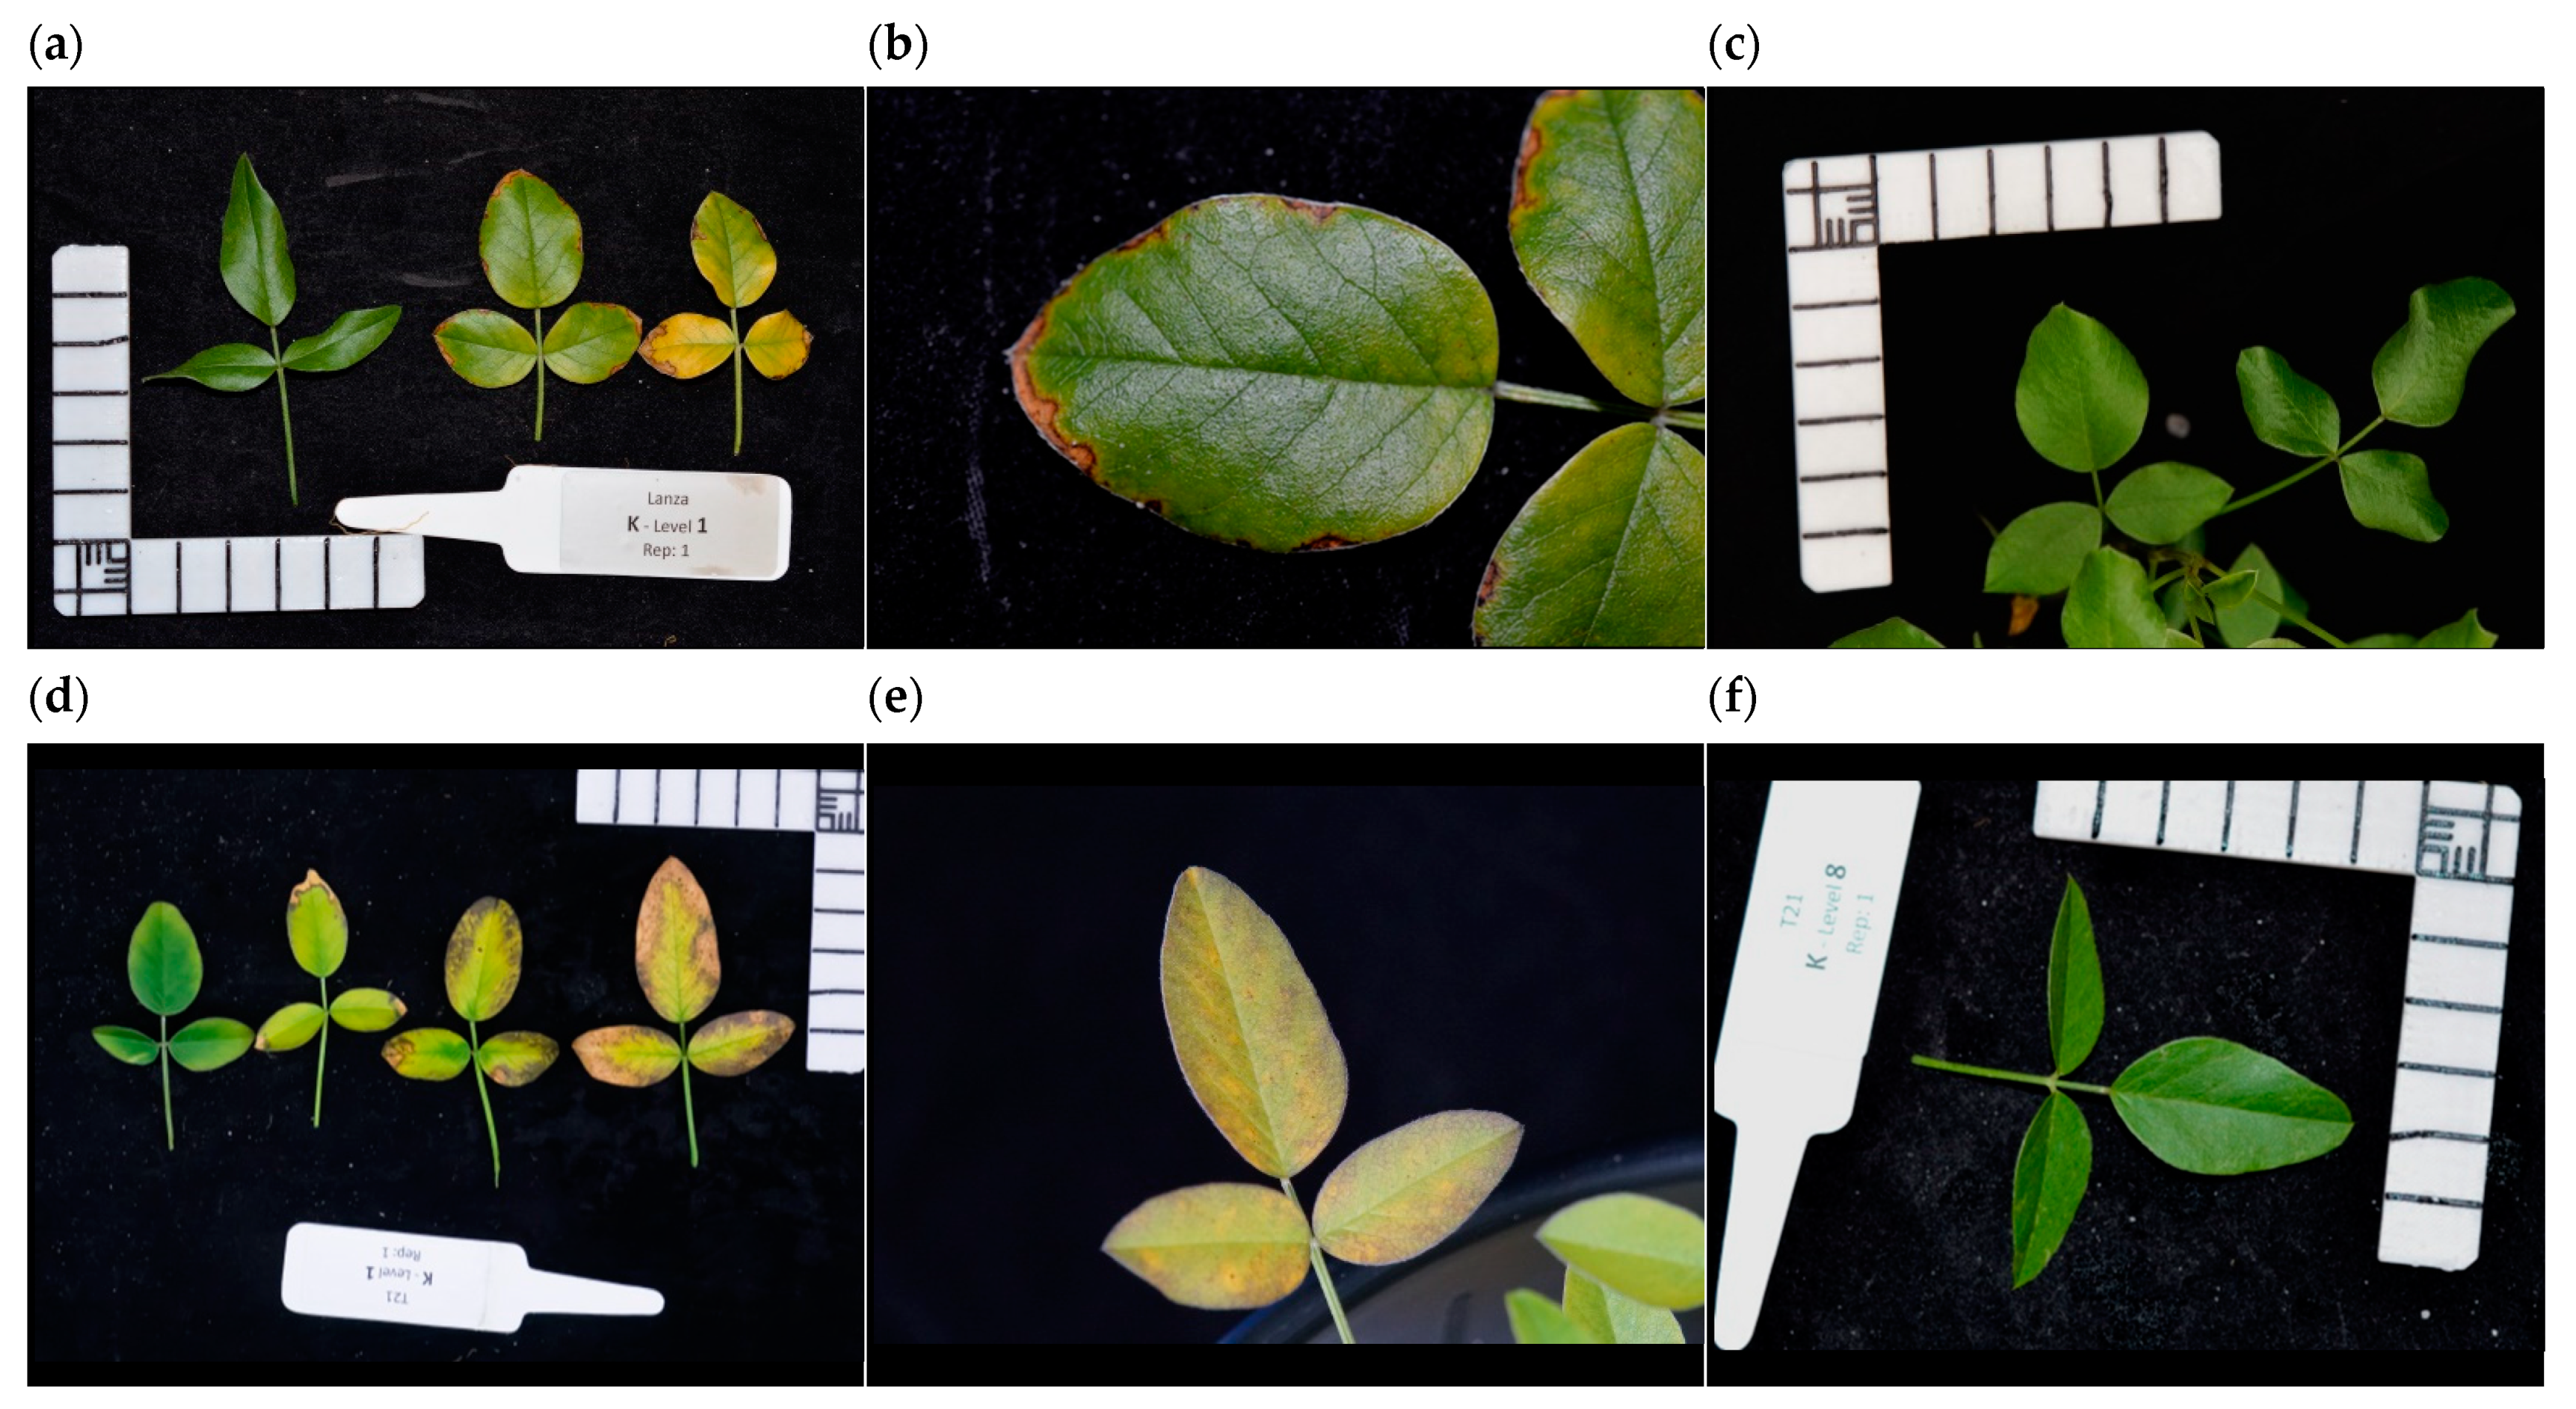
3.2. Glasshouse Experiment 2021
4. Discussion
5. Conclusions
Author Contributions
Funding
Data Availability Statement
Acknowledgments
Conflicts of Interest
References
- Real, D.; Oldham, C.M.; Nelson, M.N.; Croser, J.; Castello, M.; Verbyla, A.; Pradhan, A.; Van Burgel, A.; Méndez, P.; Correal, E.; et al. Evaluation and breeding of tedera for Mediterranean climates in southern Australia. Crop Pasture Sci. 2014, 65, 1114–1131. [Google Scholar] [CrossRef]
- Real, D.; Li, G.D.; Clark, S.; Albertsen, T.O.; Hayes, R.C.; Denton, M.D.; D’Antuono, M.F.; Dear, B.S. Evaluation of perennial forage legumes and herbs in six Mediterranean environments. Chil. J. Agric. Res. 2011, 71, 357–369. [Google Scholar] [CrossRef] [Green Version]
- Real, D.; Oldham, C.M.; Nelson, M.N.; Croser, J.; Castello, M.; Gherardi, S.; Finlayson, J.; Revell, C.; Pradhan, A.; O’Hara, G.W.; et al. Tedera: From a promising novel species to a commercial pasture option for Mediterranean southern Australia. In Proceedings of the Proceedings 22nd International Grassland Congress: Revitalising Grasslands to Sustain Our Communities, Sydney, Australia, 15–19 September 2013; pp. 301–303. [Google Scholar]
- Finlayson, J.D.; Real, D.; Nordblom, T.; Revell, C.; Ewing, M.A.; Kingwell, R. Farm level assessments of a novel drought tolerant forage: Tedera (Bituminaria bituminosa C.H.Stirt var. albomarginata). Agric. Syst. 2012, 112, 38–47. [Google Scholar] [CrossRef]
- Real, D.; Oldham, C.M.; van Burgel, A.; Dobbe, E.; Hardy, J. Tedera proves its value as a summer and autumn feed for sheep in Mediterranean-like climates. Anim. Prod. Sci. 2018, 58, 2269–2279. [Google Scholar] [CrossRef]
- Real, D. Tedera (Bituminaria bituminosa). Plant Var. J. 2016, 29, 97. [Google Scholar]
- Moore, G.A.; Sanford, P.; Dolling, P.J.; Real, D. The challenges of developing resilient perennial pastures for a Mediterranean environment—A review for Western Australia. Crop Pasture Sci. 2021, 72, 613–633. [Google Scholar] [CrossRef]
- Real, D. Tedera (Bituminaria bituminosa)—Palma. Plant Var. J. 2022, 34, 66. [Google Scholar]
- Oldham, C.M.; Real, D.; Bailey, H.J.; Thomas, D.; Van Burgel, A.J.; Vercoe, P.; Correal, E.; Rios, S. Australian and Spanish scientists are collaborating in the domestication of tedera: Young merino sheep grazing a monoculture of tedera in autumn showed preference for certain accessions but no signs of ill health. Crop Pasture Sci. 2013, 64, 399–408. [Google Scholar] [CrossRef]
- Oldham, C.M.; Wood, D.; Milton, J.; Real, D.; Vercoe, P.; van Burgel, A.J. An animal house study on utilisation of fresh tedera (Bituminaria bituminosa var. albomarginata and crassiuscula) by Merino wethers. Anim. Prod. Sci. 2015, 55, 617–624. [Google Scholar] [CrossRef]
- Ghaffari, M.H.; Durmic, Z.; Real, D.; Vercoe, P.; Smith, G.; Oldham, C. Furanocoumarins in tedera do not affect ruminal fermentation in continuous culture. Anim. Prod. Sci. 2014, 55, 544–550. [Google Scholar] [CrossRef]
- Real, D. Critical Agronomic Practices for Establishing the Recently Domesticated Perennial Herbaceous Forage Legume Tedera in Mediterranean-like Climatic Regions in Western Australia. Agronomy 2022, 12, 274. [Google Scholar] [CrossRef]
- Real, D.; Dhammu, H.S.; Moore, J.; Clegg, D.; van Burgel, A.J. Herbicide Tolerance options for weed control in Lanza® tedera. Agronomy 2022, 12, 1198. [Google Scholar] [CrossRef]
- Hawkesford, M.; Horst, W.; Kichey, T.; Lambers, H.; Schjoerring, J.; Møller, I.; White, P. Functions of Macronutrients. In Marschner’s Mineral Nutrition of Higher Plants; Academic Press: Cambridge, MA, USA, 2012; Volume 6, pp. 135–189. [Google Scholar]
- Weaver, D.; Summers, R. Phosphorus status and saturation in soils that drain into the Peel Inlet and Harvey Estuary of Western Australia. Soil Res. 2021, 59, 699–714. [Google Scholar] [CrossRef]
- Menzies, N. The science of phosphorus nutrition: Forms in the soil, plant uptake and plant response. GRDC Update Pap. 2009, 18, 2. [Google Scholar]
- Pang, J.; Ryan, M.H.; Tibbett, M.; Cawthray, G.R.; Siddique, K.H.M.; Bolland, M.D.A.; Denton, M.D.; Lambers, H. Variation in morphological and physiological parameters in herbaceous perennial legumes in response to phosphorus supply. Plant Soil 2010, 331, 241–255. [Google Scholar] [CrossRef]
- Nazeri, N.K.; Lambers, H.; Tibbett, M.; Ryan, M.H. Moderating mycorrhizas: Arbuscular mycorrhizas modify rhizosphere chemistry and maintain plant phosphorus status within narrow boundaries. Plant Cell Env. 2014, 37, 911–921. [Google Scholar] [CrossRef]
- Hardy, J.L.M.; Brennan, R.F.; Real, D. The perennial pasture legume tedera has the same requirement for phosphorus and is more efficient in using potassium and sulfur when compared to subterranean clover. J. Plant Nutr. 2019, 42, 1016–1027. [Google Scholar] [CrossRef]
- Pang, J.; Tibbett, M.; Denton, M.D.; Lambers, H.; Siddique, K.H.M.; Ryan, M.H. Soil phosphorus supply affects nodulation and N : P ratio in 11 perennial legume seedlings. Crop Pasture Sci. 2011, 62, 992–1001. [Google Scholar] [CrossRef]
- Deep P and K—A Call to Action! Critical Soil Indicators, Costs and Benefits of Deep P & K and Timing. Available online: https://grdc.com.au/resources-and-publications/grdc-update-papers/tab-content/grdc-update-papers/2022/03/deep-p-and-k-a-call-to-action!-critical-soil-indicators,-costs-and-benefits-of-deep-p-and-k-and-timing. (accessed on 30 March 2022).
- Bolland, M.D.A.; Cox, W.; Codling, B.J. Soil and tissue tests to predict pasture yield responses to applications of potassium fertiliser in high-rainfall areas of south-western Australia. Aust. J. Exp. Agric. 2002, 42, 149–164. [Google Scholar] [CrossRef]
- Greener Pastures 4—Managing Potassium in Dairy Pastures. Available online: https://researchlibrary.agric.wa.gov.au/cgi/viewcontent.cgi?article=1126&context=bulletins (accessed on 30 March 2022).
- Summers, R. Sulfur for High Rainfall Pastures in Western Australia. Available online: https://www.agric.wa.gov.au/soil-nutrients/sulfur-high-rainfall-pastures-western-australia (accessed on 30 March 2022).
- Ward, G.M. Sulphur deficiency and toxicity symptoms in greenhouse tomatoes and cucumbers. Can. J. Plant Sci. 1976, 56, 133–137. [Google Scholar] [CrossRef] [Green Version]
- Rennenberg, H. The Fate of Excess Sulfur in Higher Plants. Annu. Rev. Plant Physiol. 1984, 35, 121–153. [Google Scholar] [CrossRef]
- Rayment, G.E.; Lyons, D.J. Soil Chemical Methods: Australasia; CSIRO Publishing: Collingwood, Australia, 2011. [Google Scholar]
- Colwell, J.D. An automatic procedure for the determination of Phosphorus in sodium hydrogen carbonate extracts of soils. Chem. Ind. 1965, 22, 893–895. [Google Scholar]
- Blair, G.; Chinoim, N.; Lefroy, R.; Anderson, G.; Crocker, G. A soil sulfur test for pastures and crops. Soil Res. 1991, 29, 619–626. [Google Scholar] [CrossRef]
- Walkley, A.; Black, I.A. An examination of the Degtjareff method for determining soil organic matter, and a proposed modification of the Chromic and Titration method. Soil Sci. 1934, 37, 29–38. [Google Scholar] [CrossRef]
- Yates, R.J.; Abaidoo, R.; Howieson, J.G. Field experiments with rhizobia. In Working with Rhizobia; Howieson, J.G., Dilworth, M.J., Eds.; Australian Centre for International Agricultural Research: Canberra, Australia, 2016; pp. 145–166. [Google Scholar]
- McQuaker, N.R.; Brown, D.F.; Kluckner, P.D. Digestion of environmental materials for analysis by inductively coupled plasma-atomic emission spectrometry. Anal. Chem. 1979, 51, 1082–1084. [Google Scholar] [CrossRef]
- Sandral, G.A.; Price, A.; Hildebrand, S.M.; Fuller, C.G.; Haling, R.E.; Stefanski, A.; Yang, Z.; Culvenor, R.A.; Ryan, M.H.; Kidd, D.R.; et al. Field benchmarking of the critical external phosphorus requirements of pasture legumes for southern Australia. Crop Pasture Sci. 2019, 70, 1080–1096. [Google Scholar] [CrossRef] [Green Version]
- Nelson, M.N.; Jabbari, J.S.; Turakulov, R.; Pradhan, A.; Pazos-Navarro, M.; Stai, J.S.; Cannon, S.B.; Real, D. The First Genetic Map for a Psoraleoid Legume (Bituminaria bituminosa) Reveals Highly Conserved Synteny with Phaseoloid Legumes. Plants 2020, 9, 973. [Google Scholar] [CrossRef]
- Pazos-Navarro, M.; Dabauza, M.; Correal, E.; Hanson, K.; Teakle, N.; Real, D.; Nelson, M. Next generation DNA sequencing technology delivers valuable genetic markers for the genomic orphan legume species, Bituminaria bituminosa. BMC Genet. 2011, 12, 104. [Google Scholar] [CrossRef] [Green Version]
- Premaratne, K.P.; Oertli, J.J. The influence of potassium supply on nodulation, nitrogenase activity and nitrogen accumulation of soybean (Glycine max L. Merrill) grown in nutrient solution. Fertil. Res. 1994, 38, 95–99. [Google Scholar] [CrossRef]
- Jones, G.D.; Lutz, J.A.; Smith, T.J. Effects of Phosphorus and Potassium on Soybean Nodules and Seed Yield1. Agron. J. 1977, 69, 1003–1006. [Google Scholar] [CrossRef]
- de Mooy, C.J.; Pesek, J. Nodulation Responses of Soybeans to Added Phosphorus, Potassium, and Calcium Salts1. Agron. J. 1966, 58, 275–280. [Google Scholar] [CrossRef]
- Biswas, B.R.; Begum, A.; Sharmin, S.; Chowdhury, A.K. Effect of sulphur and molybdenum on nodulation, protein and nutrient content of soybean cv. Shohag. J. Bangladesh Agric. Univ. 2006, 4, 33–42. [Google Scholar]


| Site | Dandaragan | Three Springs | Cunderdin |
|---|---|---|---|
| Latitude | 30°50′14″ S | 29°36′98″ S | 31°37′34″ S |
| Longitude | 115°45′44″ E | 115°44′90″ E | 117°13′14″ E |
| Annual average rainfall (mm) | 480 | 380 | 310 |
| Paddock history: | |||
| 2015 | Wheat | Wheat | Wheat |
| 2016 | Lupins | Wheat | Field Peas |
| Sowing dates 2017 | 30 May | 25 May | 4 July |
| Soil texture | Sandy Loam | Loamy sand | Loam |
| 0–10 cm | |||
| Soil pH(CaCl2) | 6.8 | 5.4 | 7.6 |
| Electrical conductivity (dS m−1) | 0.143 | 0.225 | 0.139 |
| Organic carbon (%) | 2.03 | 0.75 | 1.45 |
| NO3 (mg kg−1) | 36 | 8 | 10 |
| NH4 (mg kg−1) | 3 | 1 | 0 |
| Colwell P (mg kg−1) | 30 | 35 | 22 |
| Phosphorus buffering index (PBI) | 19 | 23 | 120 |
| Colwell K (mg kg−1) | 47 | 170 | 291 |
| S (mg kg−1) KCl 40 | 12 | 19 | 23 |
| 11–30 cm | |||
| Soil pH(CaCl2) | 5.1 | 5.2 | 5.7 |
| Electrical conductivity (dS m−1) | 0.040 | 0.230 | 0.073 |
| Organic carbon (%) | 0.77 | 0.48 | 1.38 |
| NO3 (mg kg−1) | 7 | 5 | 19 |
| NH4 (mg kg−1) | 0 | 0 | 2 |
| Colwell P (mg kg−1) | 11 | 18 | 6 |
| PBI | 26 | 20 | 49 |
| Colwell K (mg kg−1) | 18 | 247 | 414 |
| S (mg kg−1) KCl 40 | 16 | 17 | 15 |
| At Sowing Time (kg ha−1) | Four Weeks after Sowing (kg ha−1) | ||||||||||
|---|---|---|---|---|---|---|---|---|---|---|---|
| Treatment | P | S | Ca | N | Cu | Zn | Mn | Mo | K | Ca | S |
| P 0 | 0.0 | 3.5 | 0.0 | 20.6 | 1.0 | 0.7 | 5.1 | 0.1 | 61.7 | 30.2 | 24.2 |
| P 5 | 5.1 | 3.9 | 4.2 | 20.6 | 1.0 | 0.7 | 5.1 | 0.1 | 61.7 | 30.2 | 24.2 |
| P 10 | 10.3 | 4.3 | 8.5 | 20.6 | 1.0 | 0.7 | 5.1 | 0.1 | 61.7 | 30.2 | 24.2 |
| P 15 | 15.4 | 4.6 | 12.7 | 20.6 | 1.0 | 0.7 | 5.1 | 0.1 | 61.7 | 30.2 | 24.2 |
| P 20 | 20.6 | 5.0 | 17.0 | 20.6 | 1.0 | 0.7 | 5.1 | 0.1 | 61.7 | 30.2 | 24.2 |
| P 25 | 25.7 | 5.4 | 21.2 | 20.6 | 1.0 | 0.7 | 5.1 | 0.1 | 61.7 | 30.2 | 24.2 |
| P 30 | 30.8 | 5.8 | 25.4 | 20.6 | 1.0 | 0.7 | 5.1 | 0.1 | 61.7 | 30.2 | 24.2 |
| K 0 | 25.7 | 5.4 | 21.2 | 20.6 | 1.0 | 0.7 | 5.1 | 0.1 | 0.0 | 30.2 | 24.2 |
| K 5 | 25.7 | 5.4 | 21.2 | 20.6 | 1.0 | 0.7 | 5.1 | 0.1 | 5.1 | 30.2 | 24.2 |
| K 10 | 25.7 | 5.4 | 21.2 | 20.6 | 1.0 | 0.7 | 5.1 | 0.1 | 10.3 | 30.2 | 24.2 |
| K 20 | 25.7 | 5.4 | 21.2 | 20.6 | 1.0 | 0.7 | 5.1 | 0.1 | 20.6 | 30.2 | 24.2 |
| K 40 | 25.7 | 5.4 | 21.2 | 20.6 | 1.0 | 0.7 | 5.1 | 0.1 | 41.1 | 30.2 | 24.2 |
| K 60 | 25.7 | 5.4 | 21.2 | 20.6 | 1.0 | 0.7 | 5.1 | 0.1 | 61.7 | 30.2 | 24.2 |
| K 80 | 25.7 | 5.4 | 21.2 | 20.6 | 1.0 | 0.7 | 5.1 | 0.1 | 82.2 | 30.2 | 24.2 |
| P 15 and K 20 | 15.4 | 4.6 | 12.7 | 20.6 | 1.0 | 0.7 | 5.1 | 0.1 | 20.6 | 30.2 | 24.2 |
| P 30 and K 80 | 25.7 | 5.8 | 25.4 | 20.6 | 1.0 | 0.7 | 5.1 | 0.1 | 82.2 | 30.2 | 24.2 |
| P (mg kg−1) | K (mg kg−1) | N (mg kg−1) | S (mg kg−1) | ||||||||
|---|---|---|---|---|---|---|---|---|---|---|---|
| P treatments | 0, 1, 2, 4, 8, 16, 32, 64, 128, 256 | 24.3 | 18.9 | 23.7 | |||||||
| K treatments | 23.8 | 0, 1, 2, 4, 8, 16, 32, 64, 128, 256 | 18.9 | 111–119 | |||||||
| S treatments | 26.6 | 41.4–72.8 | 17.4 | 0, 0.06, 0.13, 0.25, 0.50, 1.01, 2.01, 4.02, 8.04, 16.1 | |||||||
| mg kg−1 | Mg | Na | Ca | Cl | Cu | Zn | Co | Mn | Mo | B | Fe |
| P treatments | 7.39 | 0.54–190 | 15.3 | 20.1 | 0.74 | 0.57 | 0.035 | 2.33 | 0.53 | 0.012 | 1.01 |
| K treatments | 7.39 | 18.23 | 137–15.3 | 20.1 | 0.74 | 0.57 | 0.035 | 2.33 | 0.53 | 0.012 | 1.01 |
| S treatments | 15.1 | 0.54 | 12.8 | 31.6–24.5 | 0.74 | 0.57 | 0.035 | 2.33 | 0.53 | 0.012 | 1.01 |
| Play Sand | P Treatments | K Treatments | S Treatments | |
|---|---|---|---|---|
| P Colwell | <2 | <2, <2, 4, 6, 12, 20, 32, 39, 87, 147 | 33.3 | 22.9 |
| Smoothed P Colwell | 0, 2, 4, 7, 11, 18, 30, 50, 83, 138 | |||
| K Colwell | <15 | 18.3 | Levels 1 to 6 < 15, 20, 39, 77, 138 | 23–69 |
| Smoothed K Colwell | 0, 1, 2, 3, 6, 11, 20, 39, 74, 142 | |||
| NH4 N | <1 | 3.7 | 4.0 | <1 |
| Available Soil N | <2 | 7.8 | 8.9 | 4.7 |
| Soil S | 1.35 | 13.5 | 254 | 1.1, 1.2, 1.1, 0.8, 1.6, 1.8, 2.8, 3.8, 6.6, 13 |
| Smoothed Soil S | 1.3, 1.4, 1.4, 1.5, 1.7, 2.0, 2.7, 4.1, 6.9, 12.5 | |||
| Conductivity (dS m−1) | <0.01 | 0.052 | 0.37 | 0.032 |
| pH (CaCl2) | 6.1 | 5.6 | 6.3 | 6.1 |
| Two-Way ANOVA of Nutrient Level across Site | ||||
|---|---|---|---|---|
| Biomass Measure | Nutrient | Nutrient Effect Pr (>F) | Site Effect Pr (>F) | Interaction Pr (>F) |
| 2018 Dry Season | K | 0.148 | 0.001 | 0.077 |
| 2018 Growing Season | K | 0.997 | 0.003 | 0.594 |
| 2019 Dry Season | K | 0.788 | 0.000 | 0.781 |
| 2018 Dry Season | P | 0.335 | 0.004 | 0.298 |
| 2018 Growing Season | P | 0.051 | 0.013 | 0.020 |
| 2019 Dry Season | P | 0.356 | 0.000 | 0.140 |
| 2018 Dry Season | P & K | 0.523 | 0.014 | 0.226 |
| 2018 Growing Season | P & K | 0.176 | 0.035 | 0.156 |
| 2019 Dry Season | P & K | 0.151 | 0.000 | 0.143 |
| One-way ANOVA of Nutrient Level at Separate Sites | ||||
| Nutrient effect Pr (>F) | ||||
| Biomass Measure | Nutrient | Cunderdin | Dandaragan | Three Springs |
| 2018 Dry Season | K | 0.774 | 0.055 | 0.730 |
| 2018 Growing Season | K | 0.526 | 0.560 | 0.603 |
| 2019 Dry Season | K | 0.610 | 0.711 | 0.494 |
| 2019 Growing Season | K | - | 0.933 | - |
| 2018 Dry Season | P | 0.715 | 0.170 | 0.703 |
| 2018 Growing Season | P | 0.555 | 0.027 | 0.677 |
| 2019 Dry Season | P | 0.810 | 0.173 | 0.464 |
| 2019 Growing Season | P | - | 0.009 | - |
| 2018 Dry Season | P & K | 0.685 | 0.225 | 0.279 |
| 2018 Growing Season | P & K | 0.653 | 0.167 | 0.765 |
| 2019 Dry Season | P & K | 0.866 | 0.139 | 0.932 |
| 2019 Growing Season | P & K | - | 0.107 | - |
| Variable (y) | Genotype | × (Log10 Transformed) | Model Terms | Model Fit Pr (>F) | ||
|---|---|---|---|---|---|---|
| Quadratic (a) | Linear (b) | Constant (c) | ||||
| Shoot BM | Lanza® | Colwell P | −2.42 | 4.28 | 2.00 | 4.1 × 10³ |
| Shoot BM | Lucerne | Colwell P | −9.83 | 26.3 | −7.30 | 3.2 × 10⁻⁷ |
| Shoot BM | Palma | Colwell P | −7.41 | 16.1 | −0.027 | 2.6 × 10⁻⁴ |
| Shoot BM | Lanza® | Colwell K | −1.83 | 3.98 | 4.59 | 8.1 × 10⁻³ |
| Shoot BM | Lucerne | Colwell K | −3.22 | 9.20 | 6.97 | 1.3 × 10⁻³ |
| Shoot BM | Palma | Colwell K | −1.03 | 2.60 | 7.72 | 2.5 × 10⁻¹ NS |
| Shoot BM | Lanza® | Soil S | 0.52 | 1.50 | 3.49 | 4.1 × 10⁻² |
| Shoot BM | Lucerne | Soil S | −9.22 | 17.4 | 3.80 | 4.0 × 10⁻⁵ |
| Shoot BM | Palma | Soil S | 4.20 | −3.42 | 9.20 | 1.5 × 10⁻¹ NS |
| Shoot [P] | Lanza® | Colwell P | 0.25 | 0.70 | −0.34 | 3.40 × 10⁻⁸ |
| Shoot [P] | Lucerne | Colwell P | 1.31 | −1.55 | 0.47 | 1.45 × 10⁻¹² |
| Shoot [P] | Palma | Colwell P | 0.58 | −0.080 | −0.070 | 1.02 × 10⁻⁶ |
| Shoot [K] | Lanza® | Colwell K | 1.16 | −0.39 | 0.43 | 6.37 × 10⁻¹⁴ |
| Shoot [K] | Lucerne | Colwell K | 1.20 | −1.06 | 0.41 | 4.44 × 10⁻¹² |
| Shoot [K] | Palma | Colwell K | 0.91 | −0.27 | 0.30 | 2.47 × 10⁻¹³ |
| Shoot [S] | Lanza® | Soil S | 0.0012 | 0.12 | 0.12 | 5.24 × 10⁻⁵ |
| Shoot [S] | Lucerne | Soil S | 0.23 | −0.055 | 0.074 | 6.54 × 10⁻⁹ |
| Shoot [S] | Palma | Soil S | 0.058 | 0.15 | 0.076 | 1.09 × 10⁻¹² |
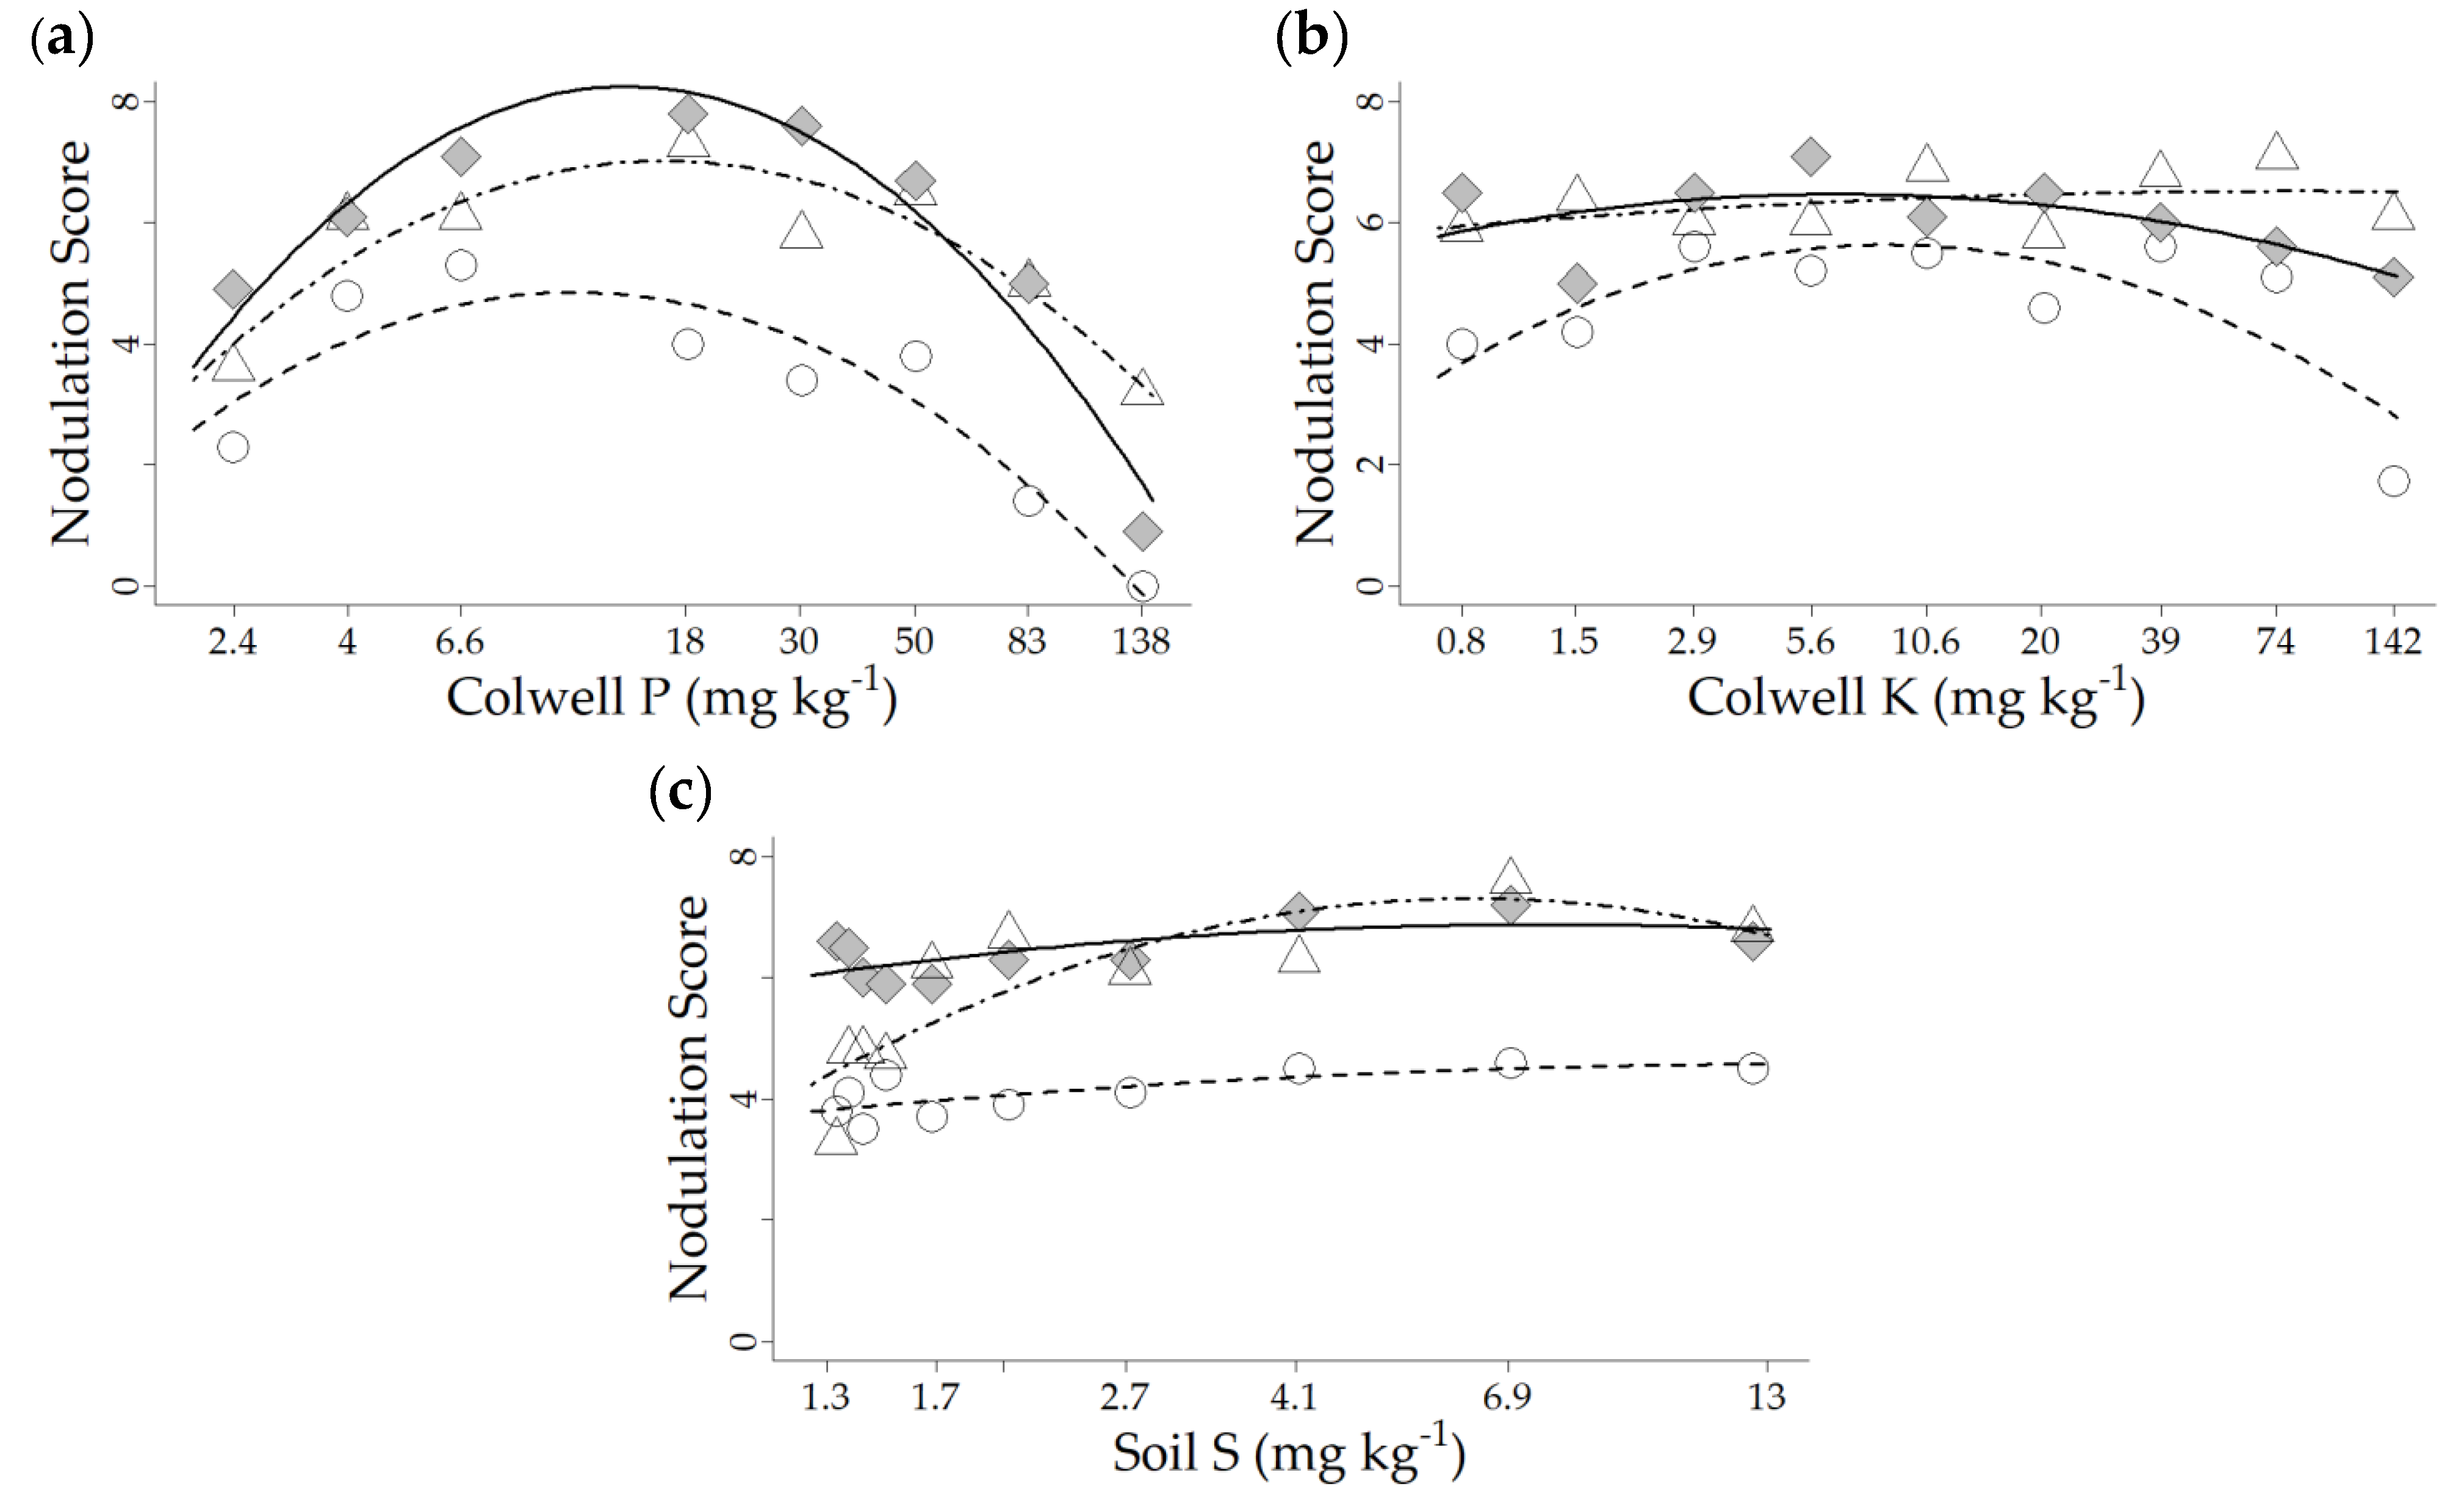
| Nodulation | Lanza® | Colwell P | −4.13 | 8.61 | 0.37 | 2.45 × 10⁻¹⁶ |
| Nodulation | Lucerne | Colwell P | −4.33 | 10.5 | 0.62 | 7.22 × 10⁻⁹ |
| Nodulation | Palma | Colwell P | −6.57 | 15.0 | −0.30 | 1.05 × 10⁻²⁰ |
| Nodulation | Lanza® | Colwell K | −1.87 | 3.46 | 4.03 | 1.27 × 10⁻⁵ |
| Nodulation | Lucerne | Colwell K | −0.14 | 0.55 | 6.00 | 4.97 × 10⁻¹ NS |
| Nodulation | Palma | Colwell K | −0.74 | 1.21 | 5.98 | 1.98 × 10⁻² |
| Nodulation | Lanza® | Soil S | −0.67 | 1.59 | 3.64 | 3.26 × 10⁻¹ NS |
| Nodulation | Lucerne | Soil S | −6.205 | 9.94 | 3.33 | 8.15 × 10⁻¹⁰ |
| Nodulation | Palma | Soil S | −1.39 | 2.43 | 5.82 | 3.34 × 10⁻² |
| Lanza® | Palma | Lucerne | |||||||
|---|---|---|---|---|---|---|---|---|---|
| ≥90% | Peak | ≤90% | ≥90% | Peak | ≤90% | ≥90% | Peak | ≤90% | |
| Colwell soil P (mg kg−1) | 3.0 | 7.6 | 19 | 5.5 | 12 | 26.6 | 10 | 22 | 46 |
| Shoot P (%) | 0.06 | 0.48 | 0.98 | 0.19 | 0.52 | 0.99 | 0.24 | 0.74 | 1.5 |
| Colwell soil K (mg kg−1) | 3.0 | 12 | 50 | NS B | NS | NS | 6.0 | 27 | 120 |
| Shoot K (%) | 0.50 | 1.36 | 3.1 | NS | NS | NS | 0.31 | 1.3 | 3.4 |
| Soil S (mg kg−1) | 7.4 | 12 A | No max | NS | NS | NS | 3.8 | 8.8 | 20 C |
| Shoot S (%) | 0.22 | 0.25 A | No max | NS | NS | NS | 0.12 | 0.23 | 0.39 C |
Publisher’s Note: MDPI stays neutral with regard to jurisdictional claims in published maps and institutional affiliations. |
© 2022 by the authors. Licensee MDPI, Basel, Switzerland. This article is an open access article distributed under the terms and conditions of the Creative Commons Attribution (CC BY) license (https://creativecommons.org/licenses/by/4.0/).
Share and Cite
Real, D.; Bennett, R.G.; Nazeri, N.K.; Weaver, D.M. Critical P, K and S Concentrations in Soil and Shoot Samples for Optimal Tedera Productivity and Nodulation. Agronomy 2022, 12, 1581. https://doi.org/10.3390/agronomy12071581
Real D, Bennett RG, Nazeri NK, Weaver DM. Critical P, K and S Concentrations in Soil and Shoot Samples for Optimal Tedera Productivity and Nodulation. Agronomy. 2022; 12(7):1581. https://doi.org/10.3390/agronomy12071581
Chicago/Turabian StyleReal, Daniel, Richard G. Bennett, Nazanin K. Nazeri, and David M. Weaver. 2022. "Critical P, K and S Concentrations in Soil and Shoot Samples for Optimal Tedera Productivity and Nodulation" Agronomy 12, no. 7: 1581. https://doi.org/10.3390/agronomy12071581