Article

Identification of Low-Light-Resistant Germplasm and Related Loci of Soybean

1
Vegetable Genetics and Breeding Laboratory, College of Horticulture, Anhui Agricultural University, Hefei 230036, China
2
College of Agronomy, Anhui Agricultural University, Hefei 230036, China
3
Key Laboratory of Crop Gene Resource and Germplasm Enhancement (MOA), the National Key Facility for Crop Gene Resources and Genetic Improvement (NFCRI), Institute of Crop Sciences, Chinese Academy of Agricultural Sciences, Beijing 100081, China
*
Authors to whom correspondence should be addressed.
These authors contributed equally to this work.
Agronomy 2022, 12(7), 1483; https://doi.org/10.3390/agronomy12071483
Submission received: 28 April 2022 / Revised: 12 June 2022 / Accepted: 17 June 2022 / Published: 21 June 2022
(This article belongs to the Special Issue Application of Molecular Marker Technology in Crop Breeding)

Abstract

:
Low-light stress will lead to abnormal soybean growth and a subsequent yield reduction. Association mapping is a useful alternative to linkage mapping for the detection of marker–phenotype associations. This study aimed to evaluate low-light-resistant soybean accessions and identify markers associated with low-light resistance. We assessed the plant height, stem diameter, number of bean pods, and cotyledon height of soybean plants under low and normal light conditions. These traits were evaluated in 185 soybean accessions, and the accessions 11HX-020, 11HX-025, 11HX-029, 11HX-064, 11HX-127, 11HX-166, 11HX-183, and 11HX-216 showed stable performance under low-light conditions. These 185 accessions were genotyped with 639 single-nucleotide polymorphism (SNP) markers and 98 simple sequence repeat (SSR) markers. A total of 75 markers—i.e., traits associated with low-light resistance—were identified. These associated markers were distributed on 14 linkage groups (LGs) of soybean, and some markers were associated with two or more traits. According to the results, excellent germplasm material and low-light-resistance related markers can be used for low-light resistance breeding of soybean and will help identify the low-light resistance genes.

1. Introduction

Light is one of the most important factors affecting plant growth and development [1]. Light plays a crucial role in regulating plants’ growth and development, morphogenesis and photosynthesis. Soybean (Glycine max L. Merrill) is a light-loving crop and is sensitive to light throughout the reproductive period [2]. Under shaded conditions, soybeans will experience shade avoidance, reduced photosynthetic capacity of their leaves, excessive elongation of plant stalks, thinning, and susceptibility to collapse, resulting in a decrease in soybean yield and quality [3,4,5,6]. At the soybean seedling stage, shading treatments reduced the light intensity by 40 to 50% and increased the plant height from 46.9 to 57 cm [7]. When soybean was intercropped with maize, maize shading increased the soybean plant height, stem internode length, and petiole thinning [8]. By means of shading (reducing to 60% of normal light intensity) soybean plants in different stages, it was found that shading at the early flowering stage had a significant effect on reducing yield [9].
The mechanism of low-light resistance is unclear. Thick sun-exposed leaves have a larger construction cost per unit leaf area than thin shaded leaves, and in a low-light environment, shaded leaves tend to have a significantly larger net photosynthetic rate (PN) than sun-exposed leaves, while shaded leaves also have a larger daily CO2 assimilation rate per construction cost; this indicates that low-light resistance is not directly related to the photosynthetic rate [10]. The higher levels of activity of sucrose phosphate synthase and sucrose synthetase in the stem are associated with shade tolerance and lodging resistance; good physical strength and high cellulose contents in the stems of shade-tolerant soybean reduced the rate of lodging in the maize soybean intercropping system [11]. The synthesis of many soluble proteins in leaves is regulated by light, and the content of soluble proteins in leaves increases under shaded conditions [12]. The presence of expansion proteins in soybean internodes can induce the elongation of soybean cell walls, and the different activities of expansion proteins in different soybean varieties under shade stress suggest that expansion proteins may play an important role in the response of soybean to shade stress [13]. It is hypothesized that shade adaptation in soybean is likely achieved through epidermal waxing and leaf color change, associated with the light-harvesting complex protein (LHCP) and RUBISCO proteins [14]. Shade significantly increases the auxin and gibberellin contents and significantly decreases the cytokinin content in young, middle-aged, and old leaves [15]. Abscisic acid (ABA) and zeatin (ZT) aggregation in soybean seedlings decrease, while indoleacetic acid (IAA) and gibberellin (GA3) aggregation increases [16]. Analyses revealed that shade remarkably upregulated the expression of the key genes IAA and GA3 as well as brassinosteroid (BR) biosynthesis in soybean hypocotyls, and the GA3 biosynthesis genes were effectively blocked by IAA, GA3, and BR biosynthesis inhibitors in the shade [17].
Association mapping, also known as association analysis, can be divided into two types, namely genome-wide pathways and candidate gene pathways. The former is based on the marker level and is achieved by the genome-wide scanning of mutant loci causing phenotypic variation, which generally does not involve the prediction of candidate genes. The latter association mapping, which is based on linkage disequilibrium (LD) (thus, it is also referred to as LD mapping), involves searching for genotype–phenotype correlations in unrelated individuals. This method is usually faster and more cost-effective than traditional linkage mapping [18]. LD is defined as the non-random association of alleles at different loci [19]. Thus, if LD exists between a marker and a locus associated with a trait, then specific marker alleles or haplotypes can be associated with phenotypic values at a high level of statistical significance [20]. The general steps of association analysis are selection of germplasm material, population structure analysis, selection of target traits, their phenotypic identification, and finally, the data. Polymorphisms of molecular markers or candidate genes can be combined to discover the association loci. Association mapping has been used in crops, for instance, to study disease resistance and stress tolerance in soybean [21,22], for association mapping of the kernel size and milling quality in wheat (Triticum aestivum L.) [23], for association mapping of the yield and its components in rice cultivars [24], and for association mapping of community resources in sorghum [25].
Low light is a normal stress in many regions in China, especially in the Yangtze-Huaihe river basin, where farmers grow vegetable soybean in spring in plastic greenhouses, when this area usually suffers continuous rain, and so low light has become a major stress in recent years. To breed low-light-resistant soybean varieties, low-light-resistant germplasm material should be identified. In this study, 185 representative accessions from different ecological zones in China were identified; the low-light-resistant germplasm identified can be used as parents for low-light-resistant variety breeding. Then, 639 SNP markers and 98 SSR markers were used for association mapping analysis; the marker–trait associations can be used for molecular assistant selection. Additionally, these mapping results are helpful for the fine mapping of low-light-resistant genes. These results ultimately may be used to facilitate the development of low-light-resistant soybean lines using the molecular breeding method.

2. Materials and Methods

2.1. Plant Materials and Field Experiments

In this research, 185 soybean accessions from the Chinese mini-core soybean collection [26] were used for association mapping. For phenotype identification at the seedling stage, the 185 accessions were planted in pots in an artificial climate room of Anhui Agricultural University at 21 °C (day) and 16 °C (night). The light intensity was set at 12,000 and 6000 lux for the control and low-light treatment, respectively, in a 12 h/12 h light/dark photoperiod. The different light intensity was set by setting different numbers of lamps, and then we measured the light intensity using an Illumination photometer (TP-FA-C-GPRS, TOP Instrument, Hangzhou, China). Six plants of each accession were grown in one pot, and there were three pots for each accession. Twenty days after planting, the parameters were measured using a ruler or vernier caliper.
For phenotype identification at the mature stage, the 185 accessions were grown in rows of 2 m in length and with 0.5 m spacing between the rows, at ten plants per row, in a randomized complete-block design with three replicates, at the experimental farm of Suzhou Academy of Agricultural Sciences (33°38′30.61″ N, 117°04′36.32″ E). Twenty days after planting, low-light treatment accessions were shaded using a shading net with a 50% shading rate. After undergoing shading treatment for three weeks, the plant parameters were measured using a ruler or vernier caliper.

2.2. Phenotypic Trait Measurement

The plant height under normal light (PHN), plant height under low light (PHL), stem diameter under normal light (SDN), stem diameter under low light (SDL), number of bean pods under normal light (NOBN), number of bean pods under low light (NOBL), plant height of seedling under normal light (PHSN), plant height of seedling under low light (PHSL), stem diameter of seedling under normal light (SDSN), stem diameter of seedling under low light (SDSL), cotyledon node height of seedling under normal light (CNHSN), and cotyledon node height of seedling under low light (CNHSL) were measured. The diameter was measured at the cotyledonary node of each soybean plant. The data for PHSN, PHSL, SDSN, SDSL, CNHSN, and CNHSL were measured at the seedling stage of the accessions planted in artificial climate room and the data for PHN, PHL, SDN, SDL, NOBN, and NOBL were measured at the mature stage of the accessions planted in field. The data were analyzed using Microsoft Excel.
Plant height increase value (PHC) = PHL − PHN
Plant height increase rate (PHCR) = (PHL − PHN)/PHN
Stem diameter reduction value (SDC) = SDN − SDL
Stem diameter reduction rate (SDCR) = (SDN − SDL)/SDN
Cotyledon node height increase value (CNHSC) = CNHSL − CNHSN
Cotyledon node height increase rate (CNHSCR) = (CNHSL − CNHSN)/CNHSN
Reduction value of bean pods number (NOBC) = NOBN − NOBL
Reduction rate of bean pods number (NOBCR) = (NOBN − NOBL)/NOBN

2.3. DNA Extraction

The improved CTAB method was adopted [27].

2.4. Primer Information and PCR Amplification Reaction

The 610 SSR primer pairs were selected with reference to the public map for soybean published by Song [28]. The sequences of the primers were obtained from the soybean database (https://www.soybase.org, accessed on 1 June 2019) and synthesized by Beijing Saibaisheng Gene Technology.
The reactions conditions were as follows: pre-denaturation at 95 °C for 2 min; denaturation at 94 °C for 30 s; annealing for 45 s at 47–55 °C (annealing temperature was adjusted for different primers); 72 °C extension for 1 min, repeated for 35 cycles; extension at 72 °C for 10 min before saving at 4 °C.

2.5. Assessment of SSR and SNP Polymorphisms

In our work, 610 SSR markers were chosen and verified for polymorphisms in a random sample of 10 accessions. A final set of 98 pairs of SSR primers evenly distributed among the 20 linkage groups (LGs) were selected to genotype the 185 soybean accessions. The amplified products were separated by electrophoresis through 8% non-denaturing polyacrylamide gels and were visualized with silver staining.
An SNP genotyping array was designed using a total of 1536 single-nucleotide polymorphisms (SNPs) originating from putative homologous genes; these SNPs were selected from the SNP dataset produced by the comparison of 55 re-sequenced soybean genomes [28,29]. The exclusion of SNPs with a missing data rate >0.25 and a minor allele frequency <0.05 resulted in 639 SNP markers being retained for the subsequent analysis. The 98 SSR and 639 SNP markers are listed in Supplementary Table S1.

2.6. Population Structural Analysis

The population structure of the 185 soybean accessions was investigated using 639 SNPs according to STRUCTURE program [30]. The subgroup number k values were set at 1 to 10, and both the burn-in time and Markov Chain Monte Carlo (MCMC) repetition number were set at 100,000 for each run. The correct k estimation was determined by combining the log probability of data (ln P(D)) from the STRUCTURE output and an ad hoc statistic, Δk, which was based on the rate of change in the log probability of data between successive k values. Each soybean variety was assigned to a subpopulation for which there was a membership value (Q-value) [30].

2.7. Association Mapping

Using the general linear model (GLM) program of TASSEL 2.0 software [31], the individual Q values were used as covariates for the regression analysis of marker variation against phenotypic variation for each of the 24 sub-traits. The population structure consisted of a Q matrix that described the subpopulation parentage for each line in the analysis; these percentages were inputted into the STRUCTURE software [30]. SNP genotype data from 639 SNP markers were used in the analysis.

2.8. Genetic Map Construction

The markers used to construct the low-light resistance of the soybean genetic map were selected from 639 SNP markers and 98 SSR markers. Mapchart 2.32 was used to draw the map [32].

3. Results

3.1. Stem Height and Thickness Variation of Soybean Accessions under Low-Light

The low-light conditions produced significant changes in the soybean stalk development. At the seedling stage, the cotyledon height and plant height increased and the stem diameter decreased. However, the magnitude of changes varied among accessions, with the plant height and cotyledon node height traits increasing significantly in the low-light-sensitive material, while the stalks of the low-light-resistant material were basically the same as in normal light when studied under low-light conditions (Figure 1).
As shown in Table 1, at the adult stage, most accessions also showed stalk elongation and reduced stem thickness under low light, and the number of bean pods was significantly reduced. Among the 185 representative accessions, the maximum soybean plant height was 143.67 cm, and we found a minimum value of 39 cm and a mean value of 82.03 cm with a coefficient of variation of 0.27. In contrast, the maximum plant height under low-light culture conditions was 215.67 cm and the lowest was 41 cm, with a mean value of 102.09 and a coefficient of variation of 0.29. The coefficients of variation of the plant height and cotyledon node height at the seedling stage after low-light treatment, for all samples, were basically the same as those at the adult plant stage. Meanwhile, the stem diameter and the number of bean pods decreased after the low-light treatment in all samples. Furthermore, the variance of the stem diameter reduction rate under low-light conditions reached 2.17 (Table 1), showing that the stem diameter under low-light conditions varied greatly between different accession materials.

3.2. Accessions with Outstanding Performance in Low-Light Conditions

Under low-light conditions, all mature stage soybean plants showed increased plant height, decreased stem diameter, and a decreased number of bean pods. Accessions with more parameters assuming smaller values of PHCR, SDCR, NOBCR, CNHSCR, PHSCR, or SDSCR were considered to be low-light-resistant as they exhibited smaller changes when under low-light stress compared to normal light. We sorted in ascending order the accessions with each of the PHCR, SDCR, NOBCR, CNHSCR, PHSCR, or SDSCR parameters, and accessions with more parameters in their first 10% were considered to represent low-light-resistant accessions. As an example, the variation rates of plant height, stem diameter, or bean pods number were very small. For example, when 11HX-020 was under low-light treatment, the plant height only increased by 0.01 and the bean pod number of the main stem only decreased by 0.08. In Table 2, we list certain accessions with more than two parameters in their first 10%. Some details of these 185 accessions can be found in Supplementary Table S2; more low-light-resistant accessions can be identified by PHCR and SDCR.

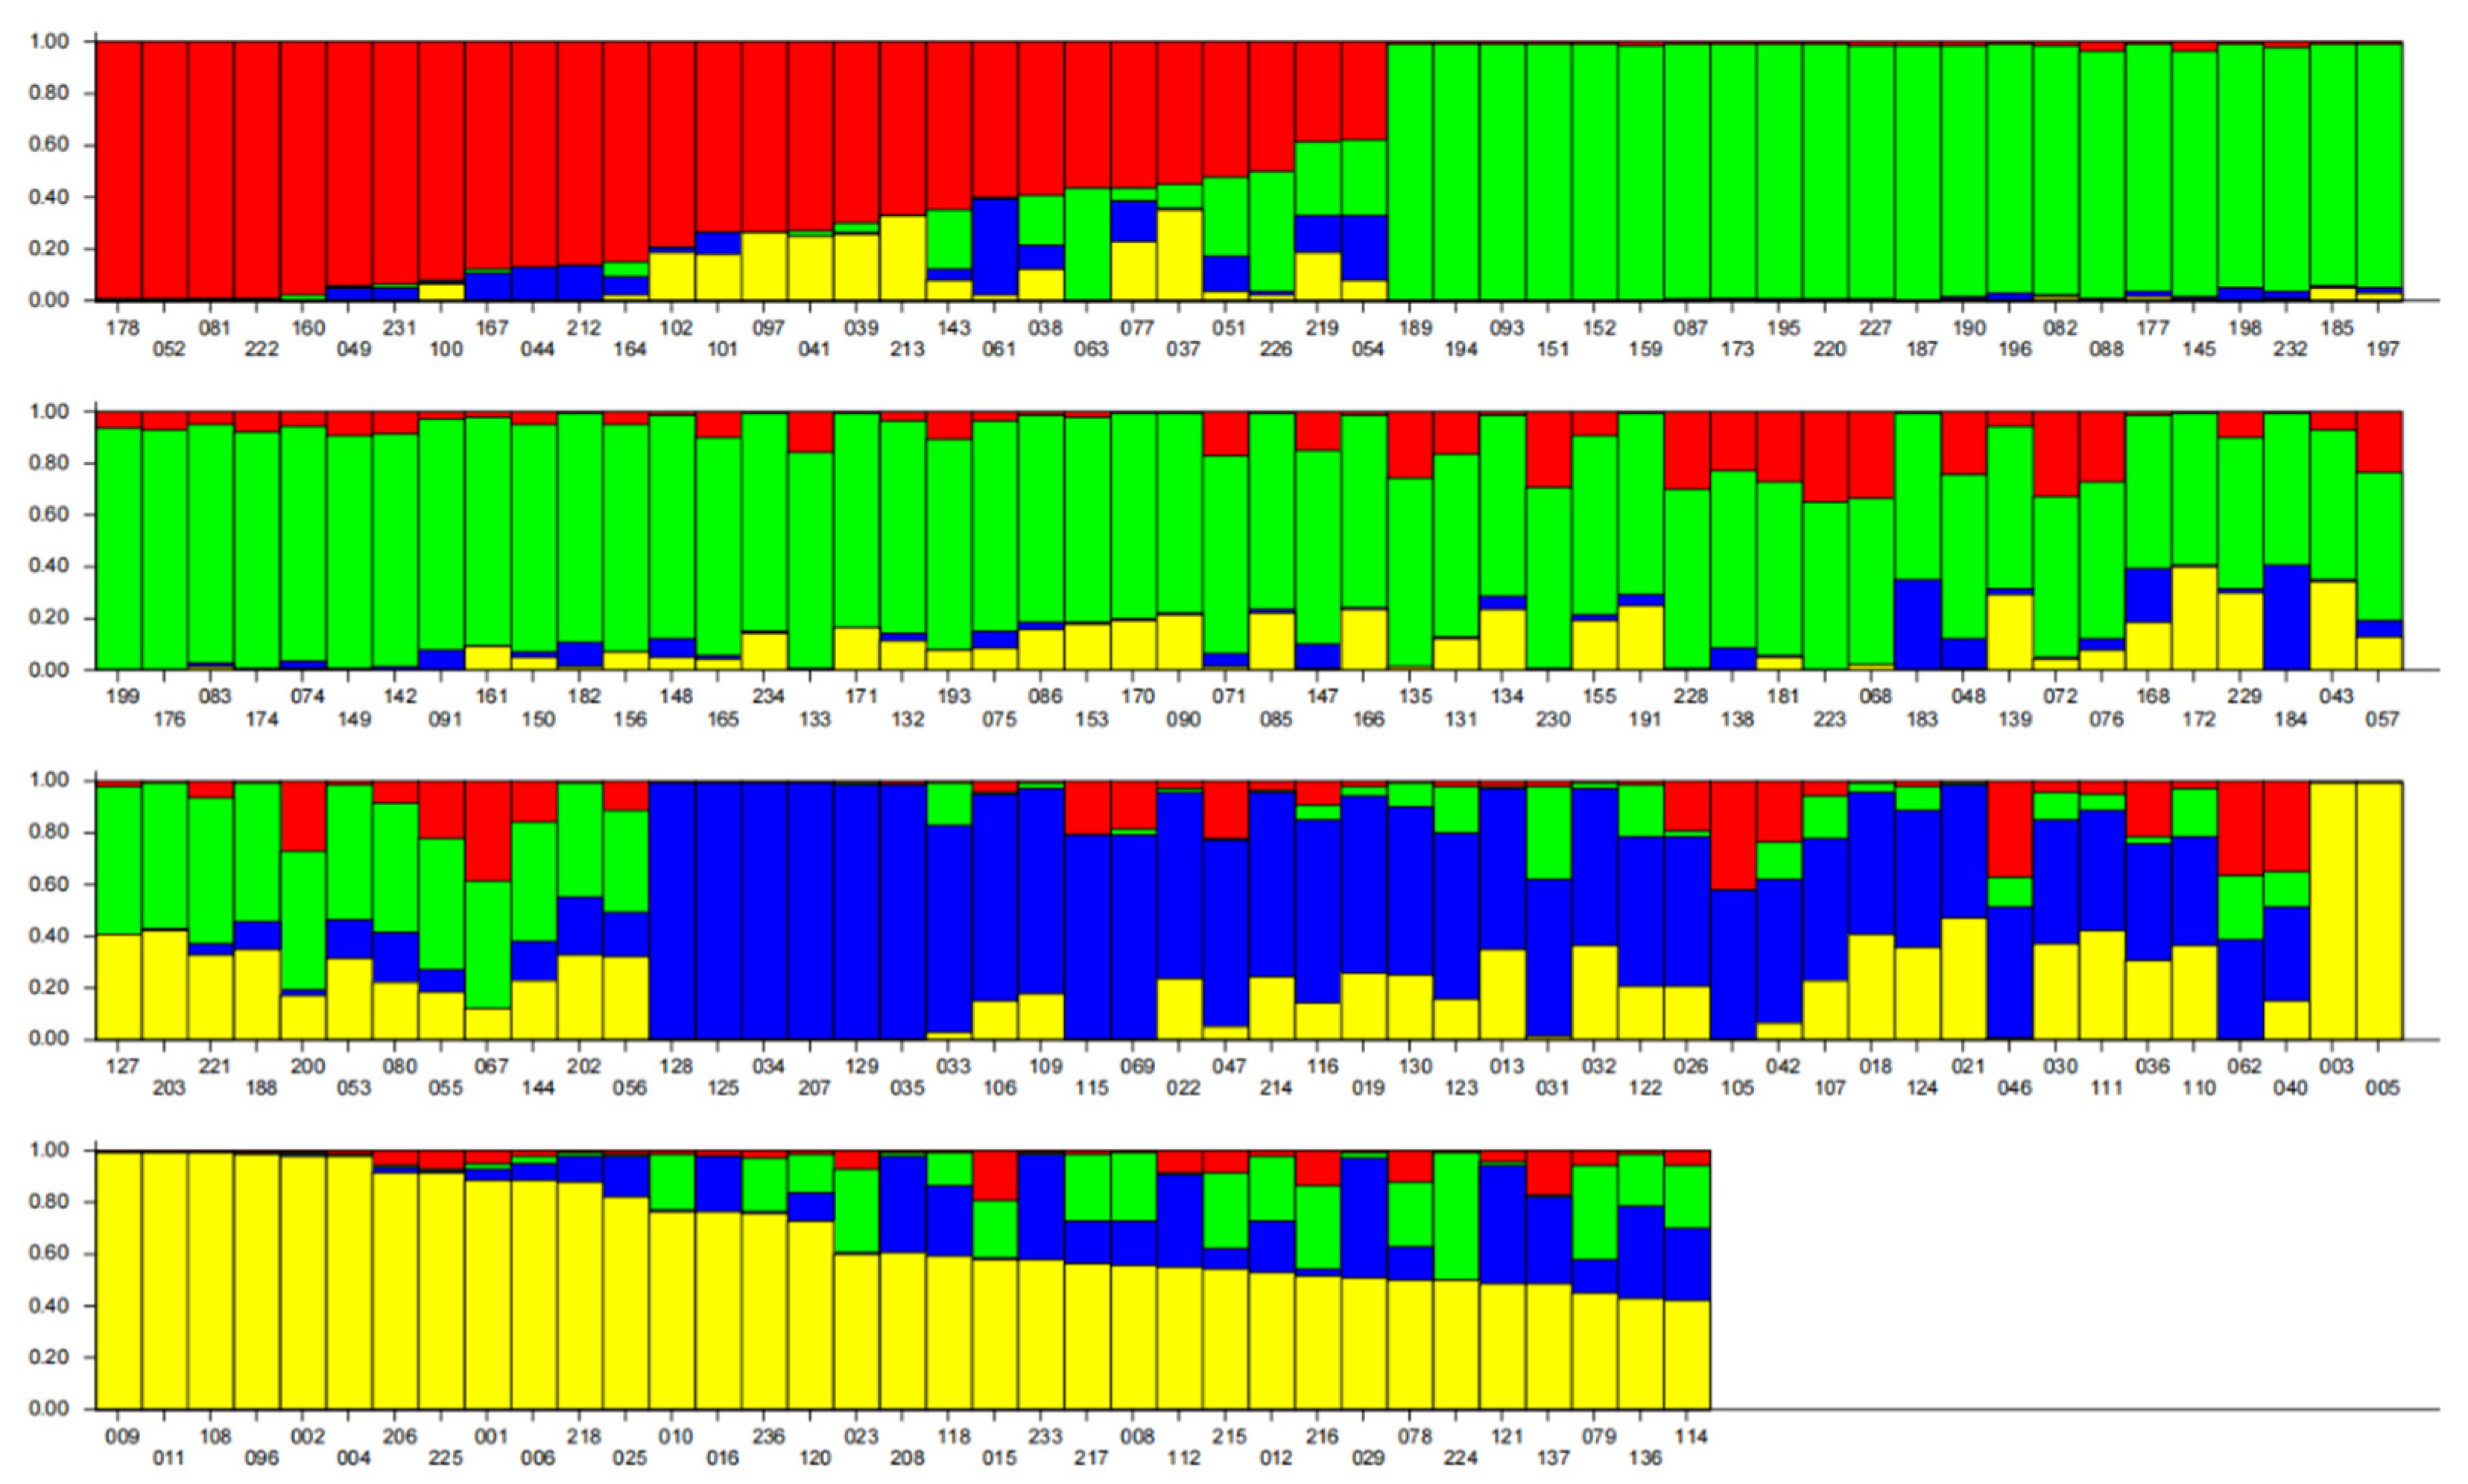
3.3. Population Structure Analysis of Accession Material

To avoid false-positive associations because of population stratification, STRUCTURE was used to estimate the relatedness of 185 soybean accessions using 639 SNPs. The distribution of the ln P(D) value for each given k value did not show a clear peak trend. To find the optimum k value and to determine the number of its subpopulations, the ΔK value was further calculated. The ad hoc quantity (Δk) exhibited a much higher likelihood at k = 4, suggesting that the 185 soybean accessions could be divided into four major subpopulations (Figure 2). Accordingly, when k = 4, the corresponding Q value of each accession was used for the next step of correlation analysis correction. Q value of each accession can be found in Supplementary Table S3.

3.4. Identification of SNP and SSR Loci Related to Low-Light Resistance

Using the GLM model of TASSEL 2.0 software, the population structure was taken as a covariate and the phenotypic values were regressed on each marker separately. A total of 75 SNP or SSR loci were obtained for soybean stalk development closely related to a low-light response.
Eleven markers were related to plant height or its increase or decrease after low-light treatment, eight of which were SNP markers. Among them, BARC-044741-08783 and BARC-025861-05129 had higher phenotypic interpretation rates of 0.35 and 0.36, respectively. Satt144 had a high explanation rate of 0.29 for PHSCR. Eight markers were associated with the effect of stem diameter or its increase or decrease after low-light treatment. Some loci were associated with multiple subtraits. For example, BARC-028407-05864, Satt557, Satt282, and Satt703 were associated with both SDSN and SDSC. Meanwhile, the explanation rates of the phenotypes Satt557, Satt282, and Satt703 were also very high, at 0.33, 0.33, and 0.34, respectively. Sat_315, Sct_187, and Sat_141 were associated with both SDSL and SDSCR. These results indicate that these sites were not only related to the stalk development itself of soybeans but also to low-light tolerance (Table 3).
Six SSR loci and 28 SNP loci were associated with the number of main stem meristems or their increase or decrease after low-light treatment. Three SNP markers—BARC-039561-07508, BARC-025709-05013, and BARC-015535-01992—had higher explanation rates of the phenotype of 0.33, 0.31, and 0.34, respectively, which means they could be suitable for use in further studies. Some markers were significantly associated with more than two traits, and these subtraits did have certain relationships between themselves. Among them, BARC-015535-01992 and BARC-020139-04480 were associated with three subtraits, indicating that they were directly related to both the number of bean pods and also to the low-light response (Table 4).

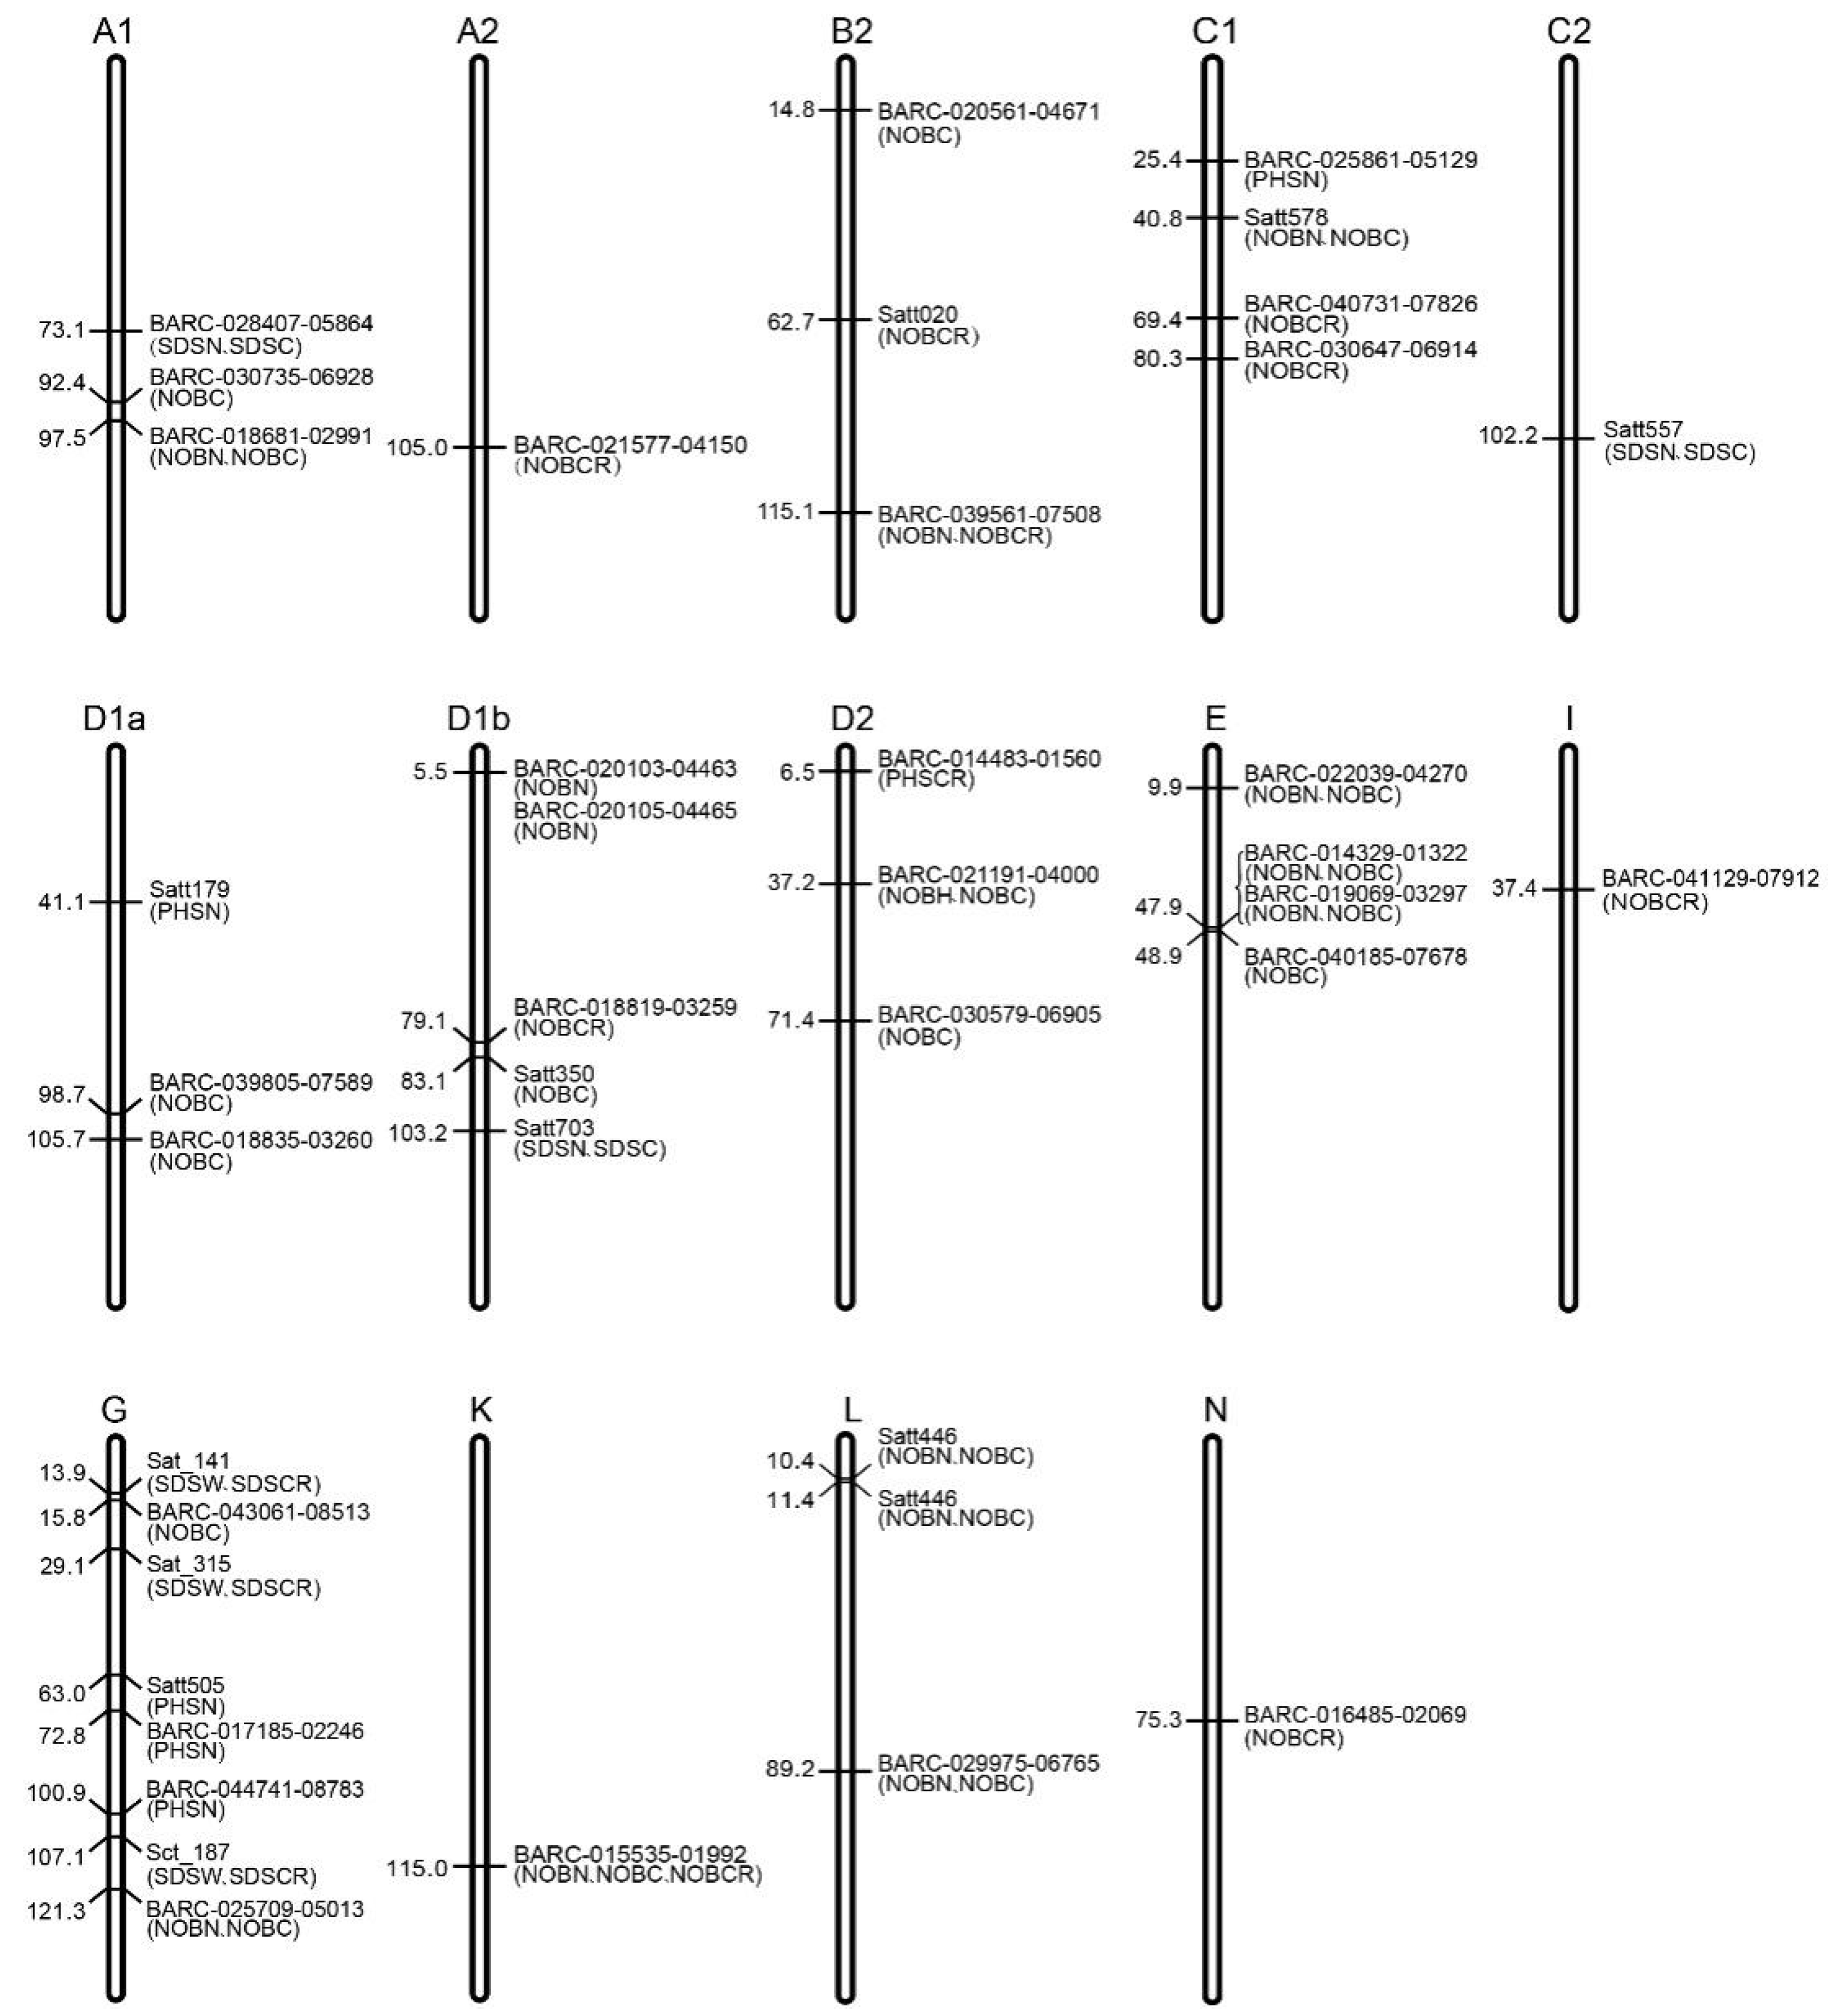
3.5. Distribution of the Markers Related to Low-Light Resistance in Soybean

To determine the distribution of these associated loci, based on the genetic maps of Soybase (https://www.soybase.org/, accessed on 12 July 2021), we mapped the markers related to low-light resistance to the soybean linkage map (Figure 3). These associated markers were distributed on 14 LGs; there were eight associated markers located on LG G (Chromosome Gm18), and the associated traits were SDSL, SDSCR, NOBN, NOBC, and PHSN. Some markers were very close on the linkage map and associated with the same traits, such as BARC-014329-01322, BARC-019069-03297, and BARC-040185-07678, which were all associated with NOBC.

4. Discussion

Light is one of the most important environmental factors for soybean. First, light provides energy for photosynthesis, and soybean is a light-loving crop. It is interesting that soybean significantly overinvests in chlorophyl; despite a >50% chl reduction, there was little negative impact on biomass accumulation or yield [33]. Second, light affects plant morphology; when soybean plants are shaded or grown in a low-light environment for a long time, the plant demonstrates a shade-avoidance response, which is harmful to farmer yield. In a maize–soybean intercropping system, soybean plants will be affected by the wide light fluctuation, which results from the shading by maize plants. Due to the shading of maize, the light is insufficent for soybean in the early morning and late afternoon; the photosynthetic rate of soybean is then lower because of the lower light [34,35]. The cotyledon node height, plant height, stem thickness, and number of bean pods of the crop are sensitive to light changes. Previous research found that, when soybean suffered low-light stress, the effective branching, number of grains per plant, number of pods per plant, and mass of 100 grains decreased [36,37]. Shade at different stages of reproduction had different effects on morphological indicators. Shade at the early stages (VER1 and VER2) had (highly) significant effects on main stem morphological traits such as the main stem length and main stem length/stem thickness ratio, with these parameters being 45.75% and 93.64% higher on average than the control, respectively [38]. However, this does not mean that shade is harmful for soybean.
In this study, we analyzed four quantitative traits of soybean, i.e., the plant height, stem diameter, cotyledon node height, and bean pod number. We found that although soybean stalk development changed significantly under the same shading level, the magnitude of change differed for different accessions, and the low-light-sensitive material changed significantly more than the low-light-resistant material. This is consistent with the results of previous studies [39,40], and may be due to the different levels of negative resistance among different accession materials. It is important to identify low-light-resistant accessions, which can be directly used for low-light-resistant breeding. In this study, we screened low-light-resistant accessions according to the parameters PHCR, SDCR, NOBCR, and so on. These parameters are the change rates of PH, SD, and NOB, which are more accurate than PHC, SDC, NOBC, and so on. Smaller values of PHCR, SDCR, NOBCR, CNHSCR, PHSCR, or SDSCR mean that the accessions undergo smaller changes under low-light stress, so we did not set a strict standard of low-light resistance; instead, accessions with smaller such parameters were considered low-light-resistant.
The group was divided into four major subgroups based on the ecological zone and variety type, and the phenotypic traits of the varieties in each subgroup differed significantly, indicating rich background variation. Higher coefficients of variation for plant height and stem thickness under low-light conditions indicate a higher abundance of phenotypic values for these two traits. Since the population structure can affect the accuracy of association analysis by influencing the LD of loci, including each Q value as a covariate in the regression analysis in this study could correct the pseudo-association caused by subgroup mixing. This method has now been applied in many studies [30,41].
In this study, we scanned the 185 accessions using 639 SNP and 98 SSR markers, combining phenotype and population structure data. We identified 75 marker–trait associations, and the associated markers can be used for soybean breeding. Some markers were associated with more than two sub-traits (Table 3 and Table 4), which may explain the possible genetic correlation between quantitative traits; the interlinkage of traits may be caused by interlocking QTL controlling the trait, or perhaps one QTL/gene can perform two or more functions.
Genome-wide association study (GWAS) has become a powerful approach for elucidating complex agronomic traits and identifying causal variants with modest effects on target traits in crops [42]. Identifying SNPs and SSRs associated with low-light resistance-related traits may enable soybean breeders to combine the causal genes during the breeding of new lines. Furthermore, GWAS is a fast and effective method of QTL/gene mapping, along with the CRISPR/Cas9 technologies applied in soybean [43]; molecular breeding and gene-editing breeding of soybean will soon be developed.

5. Conclusions

The results of this study show that low light leads to abnormal growth of soybean plants, such as increased plant height and decreased stem diameter, which means that the plant easily falls over. Soybean accessions have different expressions under low-light stress. Some accessions show strong resistance to low-light, having very small values of PHCR, SDCR, and so on, smaller values of which mean that the accessions change little under low-light stress. In this study, 11HX-009, 11HX-025, 11HX-029, 11HX-064, 11HX-127, 11HX-182, 11HX-194, etc. were found to be low-light-resistant accessions with outstanding performance in tolerating low-light conditions. SNP and SSR markers related to soybean stem development and the response to low-light were identified by association analysis, among which 11, 8, and 34 markers were related to the plant height, stem diameter, and number of bean pods after low-light treatment, respectively (Table 5). Some markers were associated with two or multiple traits, which may be the genetic reason for the correlation between traits. These low-light-resistant accessions and molecular markers can be used for soybean low-light resistance breeding.

Supplementary Materials

The following are available online at https://www.mdpi.com/article/10.3390/agronomy12071483/s1, Table S1: The 98 SSR and 639 SNP markers, Table S2: Plant height and stem diameter related parameters of the 185 accessions, Table S3: Q value of each accession under K=4.

Author Contributions

Conceptualization and funding, J.H., X.W. and L.Q.; investigation and marker analysis, J.H.; data curation and QTL mapping, S.W.; writing and revision-original draft, J.H.; writing-review and editing, S.W; supervision, J.H., G.S., L.Y., C.W., S.Z., X.W. and L.Q. All authors have read and agreed to the published version of the manuscript.

Funding

The Natural Science Foundation of Anhui Province, China (1608085QC66).

Institutional Review Board Statement

Not applicable.

Informed Consent Statement

Not applicable.

Data Availability Statement

The data are available request.

Conflicts of Interest

The authors declare no conflict of interest.

References

  1. Fan, Y.F.; Chen, J.X.; Wang, Z.L.; Tan, T.T.; Li, S.L.; Li, J.F.; Wang, B.B.; Zhang, J.W.; Cheng, Y.J.; Wu, X.L.; et al. Soybean (Glycine max L. Merr.) seedlings response to shading: Leaf structure, photosynthesis and proteomic analysis. BMC Plant Biol. 2019, 19, 34. [Google Scholar] [CrossRef] [Green Version]
  2. Coltman, R.R.; Wolff, X.Y. Productivity under shade in Hawaii of five crops grown as vegetables in tropics. J. Am. Soci. Hort. Sci. 1990, 115, 175–181. [Google Scholar]
  3. Su, B.Y.; Chen, S.B.; Li, Y.G.; Yang, W.Y. Intercropping enhances the farmland ecosystem services. Acta Ecol. Sin. 2013, 33, 4505–4514. [Google Scholar]
  4. Yao, X.D.; Li, C.H.; Li, S.Y.; Zhu, Q.; Zhang, H.J.; Wang, H.Y.; Yu, C.M.; Martin, S.K.S.; Xie, F. Effect of shade on leaf photosynthetic capacity, light-intercepting, electron transfer and energy distribution of soybeans. Plant Growth Regul. 2017, 83, 409–416. [Google Scholar] [CrossRef]
  5. Liu, W.G.; Zou, J.L.; Zhang, J.; Yang, F.; Wan, Y.; Yang, W.Y. Evaluation of soybean (Glycine max) stem vining in maize-soybean relay strip intercropping system. Plant Prod. Sci. 2015, 18, 69–75. [Google Scholar] [CrossRef] [Green Version]
  6. Yang, W.; Yong, T.; Ren, W.; Fan, G.; Mu, J.; Lu, X. Develop relay-planting soybean, revitalize soybean industry. Soybean Sci. 2008, 27, 1. [Google Scholar]
  7. Umezaki, T.; Yoshida, T. Effect of shading on the internode elongation of late maturing soybean. J. Fac. Agric. Kyushu Univ. 1992, 36, 267–272. [Google Scholar] [CrossRef]
  8. Behairy, T.G. Effect of intercropping patterns on soybean growth and photosynthetic appa-ratus. J. Physiol. Sci. 1994, 18, 168–178. [Google Scholar]
  9. Sharma, K.; Walia, N. Growth and yield of soybean Glycine max (L.) Merrill as influenced by light intensity and cytokinin. Environ. Ecol. 1996, 14, 307–310. [Google Scholar]
  10. Tateno, M.; Taneda, H. Photosynthetically versatile thin shade leaves: A paradox of irradiance-response curves. Photosynthetica 2007, 45, 299–302. [Google Scholar] [CrossRef]
  11. Liu, W.G.; Deng, Y.C.; Hussain, S.; Zou, J.L.; Yuan, J.; Luo, L.; Yang, C.Y.; Yuan, X.Q.; Yang, W.Y. Relationship between cellulose accumulation and lodging resistance in the stem of relay intercropped soybean [Glycine max (L.) Merr.]. Field Crop Res. 2016, 196, 261–267. [Google Scholar] [CrossRef]
  12. Boardman, N.K. Photosynthesis of sun and shading plant. Annu. Rev. Physiol. 1977, 28, 355–371. [Google Scholar] [CrossRef]
  13. Liu, W.G.; Jiang, T.; Zhou, X.R.; Yang, W.Y. Characteristics of expansins in soybean (Glycine max) internodes and responses to shade stress. Asian J. Crop Sci. 2011, 3, 26–34. [Google Scholar] [CrossRef] [Green Version]
  14. Alam, B.; Singh, R.; Newaj, R. Comparative adaptive traits in green gram (Vigna radiata L.) and soybean (Glycine max L.) as influenced by varying regimes of shade. Range Manag. Agrofor. 2012, 33, 142–146. [Google Scholar]
  15. Wu, Y.S.; Gong, W.Z.; Yang, W.Y. Shade inhibits leaf size by controlling cell proliferation and enlargement in soybean. Sci. Rep. 2017, 7, 9259. [Google Scholar] [CrossRef] [PubMed]
  16. Zhang, J.; Smith, D.L.; Liu, W.G.; Chen, X.F.; Yang, W.Y. Effects of shade and drought stress on soybean hormones and yield of main-stem and branch. Afr. J. Biotechnol. 2011, 10, 14392–14398. [Google Scholar]
  17. Jiang, H.K.; Shui, Z.W.; Xu, L.; Yang, Y.H.; Li, Y.; Yuan, X.Q.; Shang, J.; Asghar, M.A.; Wu, X.L.; Yu, L.; et al. Gibberellins modulate shade-induced soybean hypocotyl elongation downstream of the mutual promotion of auxin and brassinosteroids. Plant Physiol. Biochem. 2020, 150, 209–221. [Google Scholar] [CrossRef] [PubMed]
  18. Myles, S.; Peiffer, J.; Brown, P.J.; Ersoz, E.S.; Zhang, Z.W.; Costich, D.E.; Buckler, E.S. Association Mapping: Critical Considerations Shift from Genotyping to Experimental Design. Plant Cell 2009, 21, 2194–2202. [Google Scholar] [CrossRef] [Green Version]
  19. Xu, Y.; Cheng, W.Q.; Xiong, C.Y.; Jiang, X.B.; Wu, K.Y.; Gong, B.C. Genetic Diversity and Association Analysis among Germplasms of Diospyros kaki in Zhejiang Province Based on SSR Markers. Forests 2021, 12, 422. [Google Scholar] [CrossRef]
  20. Cardon, L.R.; Bell, J.I. Association study designs for complex diseases. Nat. Rev. Genet. 2001, 2, 91–99. [Google Scholar] [CrossRef] [PubMed]
  21. Li, Y.H.; Smulders, M.J.M.; Chang, R.Z.; Qiu, L.J. Genetic diversity and association mapping in a collection of selected Chinese soybean accessions based on SSR marker analysis. Conserv. Genet. 2011, 12, 1145–1157. [Google Scholar] [CrossRef]
  22. Korir, P.C.; Zhang, J.; Wu, K.J.; Zhao, T.J.; Gai, J.Y. Association mapping combined with linkage analysis for aluminum tolerance among soybean cultivars released in Yellow and Changjiang River Valleys in China. Theor. Appl. Genet. 2013, 126, 1659–1675. [Google Scholar] [CrossRef] [PubMed]
  23. Breseghello, F.; Sorrells, M.E. Association mapping of kernel size and milling quality in wheat (Triticum aestivum L.) cultivars. Genetics 2006, 172, 1165–1177. [Google Scholar] [CrossRef] [PubMed] [Green Version]
  24. Agrama, H.; Eizenga, G.; Yan, W. Association mapping of yield and its components in rice cultivars. Mol. Breed. 2007, 19, 341–356. [Google Scholar] [CrossRef]
  25. Casa, A.M.; Pressoir, G.; Brown, P.J.; Mitchell, S.E.; Rooney, W.L.; Tuinstra, M.R.; Franks, C.D.; Kresovich, S. Community resources and strategies for association mapping in sorghum. Crop. Sci. 2008, 48, 30–40. [Google Scholar] [CrossRef] [Green Version]
  26. Li, Y.H.; Li, W.; Zhang, C.; Yang, L.A.; Chang, R.Z.; Gaut, B.S.; Qiu, L.J. Genetic diversity in domesticated soybean (Glycinemax) and its wild progenitor (Glycine soja) for simple sequence repeat and single-nucleotide polymorphism loci. New Phytol. 2010, 188, 242–253. [Google Scholar] [CrossRef]
  27. Murray, M.G.; Thompson, W.F. Rapid isolation of high molecular weight plant DNA. Nucleic Acids Res. 1980, 8, 4321–4326. [Google Scholar] [CrossRef] [Green Version]
  28. Song, Q.J.; Marek, L.F.; Shoemaker, R.C.; Lark, K.G.; Concibido, V.C.; Delannay, X.; Specht, J.E.; Cregan, P.B. A new integrated genetic linkage map of the soybean. Theor. Appl. Genet. 2004, 109, 122–128. [Google Scholar] [CrossRef]
  29. Li, Y.H.; Zhao, S.C.; Ma, J.X.; Li, D.; Yan, L.; Li, J.; Qi, X.T.; Guo, X.S.; Zhang, L.; He, W.M.; et al. Molecular footprints of domestication and improvement in soybean revealed by whole genome re-sequencing. BMC Genom. 2013, 14, 579. [Google Scholar] [CrossRef] [Green Version]
  30. Pritchard, J.K.; Stephens, M.; Donnelly, P. Inference of population structure using multilocus genotype data. Genetics 2000, 155, 945–959. [Google Scholar] [CrossRef]
  31. Bradbury, P.J.; Zhang, Z.; Kroon, D.E.; Casstevens, T.M.; Ramdoss, Y.; Buckler, E.S. TASSEL: Software for association mapping of complex traits in diverse samples. Bioinformatics 2007, 23, 2633–2635. [Google Scholar] [CrossRef] [PubMed]
  32. Voorrips, R.E. MapChart: Software for the graphical presentation of linkage maps and QTLs. J. Hered. 2002, 93, 77–78. [Google Scholar] [CrossRef] [PubMed] [Green Version]
  33. Slattery, R.A.; VanLoocke, A.; Bernacchi, C.J.; Zhu, X.G.; Ort, D.R. Photosynthesis, light use efficiency, and yield of reduced-chlorophyll soybean mutants in field conditions. Front. Plant Sci. 2017, 8, 549. [Google Scholar] [CrossRef] [Green Version]
  34. Yang, F.; Huang, S.; Gao, R.C.; Liu, W.G.; Yong, T.W.; Wang, X.C.; Wu, X.L.; Yang, W. Growth of soybean seeeding in relay strip intercropping systems in telation to light quantity and red: Far-red ratio. Field Crop. Res. 2014, 155, 245–253. [Google Scholar] [CrossRef]
  35. Xie, Y.H.; Li, X.H.; Wang, Y.J.; Li, L.; Zhou, H. Influences of different intercropping row-ratios between maize and soybean on agronomic characters and yield of precocious spring soybean. Hunan Agric. Sci. 2011, 5, 26–28. [Google Scholar]
  36. Liu, W.G.; Ren, M.L.; Liu, T.; Du, Y.L.; Zhou, T.; Liu, X.M.; Liu, J.; Hussain, S.; Yang, W.Y. Effect of shade stress on lignin biosynthesis in soybean stems. J. Integr. Agric. 2018, 11, 1594–1604. [Google Scholar] [CrossRef]
  37. Zhang, Z.Y.; Gong, W.Z.; Yang, W.Y.; Ma, Z. Correlation between agronomic characters and yield in relay-planting soybeans. Soybean Sci. 2007, 5, 680–686. [Google Scholar]
  38. Wang, Y.; Yang, W.Y.; Zhang, X.; Yong, T.W.; Liu, W.G.; Su, B.Y. Effects of shading at different growth stages on different traits and yield of soybean. Acta Agron. Sin. 2013, 39, 1871–1879. [Google Scholar] [CrossRef]
  39. He, L.Y.; Yin, C.J.; Huang, S.C.; He, Q.Y.; Shu, Y.J. Correlation, clustering and principal component analysis of primary agronomic traits of vegetable soybean. Acta Agric. Zhejiangensis 2018, 30, 50–57. [Google Scholar]
  40. Fan, Y.F.; Chen, J.X.; Cheng, Y.J.; Raza, M.A.; Wu, X.L.; Wan, Z.L.; Liu, Q.L.; Wang, R.; Wan, X.C.; Yong, T.W.; et al. Effect of shading and light recovery on the growth, leaf structure, and photosynthetic performance of soybean in a maize-soybean relay-strip intercropping system. Field Crop. Res. 2014, 155, 245–253. [Google Scholar] [CrossRef]
  41. Li, J.J.; Zhao, J.H.; Li, Y.H.; Gao, Y.L.; Hua, S.N.; Nadeem, M.; Sun, G.L.; Zhang, W.M.; Hou, J.F.; Wang, X.B.; et al. Identification of a novel seed size associated locus SW9-1 in soybean. Crop J. 2019, 7, 548–559. [Google Scholar] [CrossRef]
  42. Zhou, Q.H.; Han, D.P.; Mason, A.S.; Zhou, C.; Zheng, W.; Li, Y.Z.; Wu, C.J.; Fu, D.H.; Huang, Y.J. Earliness traits in rapeseed (Brassica napus): SNP loci and candidate genes identified by genome-wide association analysis. DNA Res. 2018, 25, 229–244. [Google Scholar] [CrossRef] [PubMed] [Green Version]
  43. Michno, J.M.; Virdi, K.; Stec, A.O.; Liu, J.Q.; Wang, X.B.; Xiong, Y.; Stupar, R.M. Integration, abundance, and transmission of mutations and transgenes in a series of CRISPR/Cas9 soybean lines. BMC Biotechnol. 2020, 20, 10. [Google Scholar] [CrossRef] [PubMed] [Green Version]
Figure 1. Performance of low-light-sensitive and low-light-resistant soybean accessions in low-light conditions. Accession 11HX-097 is a low-light-sensitive material, and the plant height increased significantly under low-light. Accession 11HX-127 is a low-light-resistant material, and plant height did not change significantly under low-light.
Agronomy 12 01483 g001
Figure 2. Four subgroups of 185 materials based on the Structure 2.5 hybrid model. Each rectangular bar represents one copy of the accession, and its probability of being classified into one of the four subpopulations can be determined by the length of the differently colored (red, yellow, green, blue) lines. Y-axes, Q value; X-axes, the ID of each accession (the same characters “11HX-” of each ID was omitted).
Agronomy 12 01483 g002
Figure 3. Soybean genetic linkage map showing the marker positions and estimated map distances (cM; indicated on the left of the vertical bars) based on the linkage map of soybean, A1, A2, B2, C1, C2, D1a, D1b, D2, E, I, G, K, L, N are the name of linkage groups (https://www.soybase.org, accessed on 12 July 2021). Putative markers associated with SDSN, PHSN, SDSC, PHSCR, NOBC, SDSL, NOBN, SDSCR, and NOBCR were labeled according to the associated markers, respectively. As some associated markers have no location information for soybean, they are not present on the above maps.
Agronomy 12 01483 g003
Table 1. Variation of 185 representative accession materials for traits related to stalk development under normal and low-light conditions.
Sub-TraitsMax. 1Min. 2MeanSDCV 3
Plant height PHN (cm)143.67 39.00 82.03 22.10 0.27
PHL (cm)215.67 41.00 102.09 30.05 0.29
PHC (cm)91.67 0.17 22.75 17.92 0.79
PHCR0.99 0.00 0.28 0.21 0.76
Stem diameter SDN (mm)12.43 4.15 7.62 1.47 0.19
SDL (mm)9.18 3.94 6.29 1.18 0.19
SDC (mm)6.07 0.00 1.52 1.18 0.78
SDCR0.49 0.00 0.18 0.11 0.62
Number of bean pods (individual)NOBN242.67 7.33 49.52 27.51 0.56
NOBL116.33 3.67 28.43 17.83 0.63
NOBC186.67 0.67 24.87 21.59 0.87
NOBCR2.75 0.01 0.51 0.34 0.67
Cotyledon height (seedling stage)CNHSN (cm)8.85 0.57 3.62 1.22 0.34
CNHSL (cm)15.50 4.23 8.40 2.01 0.24
CNHSC (cm)12.50 0.13 4.81 2.26 0.47
CNHSCR9.94 0.03 1.62 1.29 0.80
Plant height (seedling stage)PHSN (cm)25.00 1.14 7.03 2.38 0.34
PHSL (cm)32.50 8.03 19.46 3.67 0.19
PHSC (cm)26.17 1.62 12.38 4.09 0.33
PHSCR16.71 0.17 2.11 1.59 0.75
Stem diameter (seedling stage)SDSN (mm)26.60 1.31 2.66 1.90 0.71
SDSL (mm)13.66 1.40 2.43 1.10 0.45
SDSC (mm)26.60 0.01 0.63 2.31 3.66
SDSCR 4.12 0.00 0.18 0.39 2.17
1 Max., maximum value; 2 Min., minimum value; 3 CV, coefficient of variation (CV = SD/Mean).
Table 2. Accessions with a stable phenotype under normal and low-light conditions.
Trait11HX-02011HX-02511HX-02911HX-12411HX-12711HX-16611HX-18311HX-216
PHCR0.010.420.460.050.160.120.040.49
SDCR0.250.010.020.050.020.010.280.05
NOBCR0.080.050.100.140.09--0.040.04
SDSCR--0.330.12--0.070.010.100.03
The values that indicated these accessions as being “low-light-resistant” are shown in bold.
Table 3. Marker loci associated with traits of soybean plant height, stem diameter, and their variation under low-light conditions, along with the explanation rates of different phenotypes.
Marker LociPHSN PHSCR SDSN SDSL SDSC SDSCR
BARC-017185-022460.17
BARC-016069-020540.18
BARC-044741-087830.35
BARC-025861-051290.36
Satt5050.16
Satt1790.18
BARC-019061-03295 0.10
BARC-014483-01560 0.12
BARC-038949-07404 0.13
BARC-021793-04213 0.13
Satt144 0.29
BARC-041903-08129 0.10
BARC-028407-05864 0.19 0.20
Satt557 0.33 0.19
Satt282 0.33 0.11
Satt703 0.34 0.18
Sat_315 0.15 0.12
Sct_187 0.09 0.08
Sat_141 0.28 0.31
The explanation rates of different phenotypes are R2 values of each significant (p < 0.01) marker–trait associations, according to the result of GLM program of TASSEL 2.0 software.
Table 4. Marker loci associated with the number of bean pods and its trait variation in low-light, along with the explanation rates of different phenotypes.
Marker LociNOBNNOBCNOBCR
BARC-014329-013220.130.16
BARC-015535-019920.270.340.26
BARC-016413-025820.10
BARC-018681-029910.130.14
BARC-019069-032970.140.16
BARC-020103-044630.11
BARC-020105-044650.11
BARC-020139-044800.140.160.27
BARC-021191-040000.100.15
BARC-022039-042700.110.12
BARC-025709-050130.290.31
BARC-029975-067650.130.15
BARC-039561-075080.270.33
rhg1-597-6060.120.15
Satt4460.160.20
Satt5780.230.24
BARC-018835-03260 0.11
BARC-020561-04671 0.13
BARC-025791-05069 0.11
BARC-030735-06928 0.11
BARC-039805-07589 0.13
BARC-040185-07678 0.14
BARC-043061-08513 0.15
Satt350 0.19
Satt365 0.26
BARC-016485-02069 0.12
BARC-018013-02496 0.26
BARC-018819-03259 0.16
BARC-021577-04150 0.12
BARC-030579-06905 0.15
BARC-030647-06914 0.26
BARC-040731-07826 0.23
BARC-041129-07912 0.13
Satt020 0.20
The explanation rates of different phenotypes are R2 values of each significant (p < 0.01) marker–trait associations, according to the result of GLM program of TASSEL 2.0 software.
Table 5. Markers related to the plant height, stem diameter, and number of bean pods after low-light treatment.
Traits Marker Loci
Plant height-related traits
(PHSN, PHSCR)
BARC-017185-02246, BAR5 C-016069-02054, BARC-044741-08783, BARC-025861-05129, Satt505, Satt179
Stem diameter-related traits
(SDSN, SDSL, SDSC, SDSCR)
BARC-041903-08129. BARC-028407-05864, Satt557, Satt282, Satt703, Sat_315, Sct_187, Sat_141
Number of bean pod-related traits
(NOBN, NOBC, NOBCR)
BARC-014329-01322, BARC-015535-01992, BARC-016413-02582, BARC-018681-02991, BARC-019069-03297, BARC-020103-04463, BARC-020105-04465, BARC-020139-04480, BARC-021191-04000, BARC-022039-04270, BARC-025709-05013, BARC-029975-06765, BARC-039561-07508, rhg1-597-606, Satt446, Satt578, BARC-018835-03260, BARC-020561-04671, BARC-025791-05069, BARC-030735-06928, BARC-039805-07589, BARC-040185-07678, BARC-043061-08513, Satt350, Satt365, BARC-016485-02069, BARC-018013-02496, BARC-018819-03259, BARC-021577-04150, BARC-030579-06905, BARC-030647-06914, BARC-040731-07826, BARC-041129-07912, Satt020
Publisher’s Note: MDPI stays neutral with regard to jurisdictional claims in published maps and institutional affiliations.

