Article

Plant-Derived Biostimulants Differentially Modulate Primary and Secondary Metabolites and Improve the Yield Potential of Red and Green Lettuce Cultivars

1
Department of Agricultural Sciences, University of Naples Federico II, 80055 Portici, Italy
2
Department of Environmental, Biological and Pharmaceutical Sciences and Technologies, University of Campania “Luigi Vanvitelli”, Via Vivaldi 43, 81100 Caserta, Italy
3
Department of Agriculture and Forest Sciences, University of Tuscia, 01100 Viterbo, Italy
4
Department of Pharmacy, University of Naples Federico II, 80131 Naples, Italy
5
Department of Vegetables Crops, Agricultural Research Institute, 1516 Nicosia, Cyprus
6
Department of Agricultural, Food and Forest Sciences (SAAF), University of Palermo, Viale delle Scienze, Ed. 5, 90128 Palermo, Italy
*
Authors to whom correspondence should be addressed.
Agronomy 2022, 12(6), 1361; https://doi.org/10.3390/agronomy12061361
Submission received: 12 May 2022 / Revised: 30 May 2022 / Accepted: 2 June 2022 / Published: 4 June 2022

Abstract

:
The use of biostimulants in modern agriculture has rapidly expanded in recent years, owing to their beneficial effects on crop yield and product quality, which have come under the scope of intensive research. Accordingly, in the present study we appraised the efficacy of two plant-derived biostimulants, the legume-derived protein hydrolysates Trainer® (PH), and the tropical plant extract Auxym® (TPE) on two lettuce cultivars (green and red salanova®) in terms of morpho-physiological and biochemical traits (primary and secondary metabolites). The two cultivars differed in their acquisition capacity for nitrate and other beneficial ions, their photosynthetic and transpiration rates, and their ability to synthetize and accumulate organic acids and protective metabolites. The biostimulant effect was significant for almost all the parameters examined but it was subjected to significant cultivar × biostimulant interactions, denoting a cultivar-dependent response to biostimulant type. Notwithstanding this interaction, biostimulant application could potentially improve the yield and quality of lettuce by stimulating plant physiological processes, as indicated by the SPAD index (leaf chlorophyll index), ACO2 (assimilation rate), E (transpiration), and WUEi (intrinsic water use efficiency), and by increasing concurrently the plant mineral content (total N, K, Ca, Mg) and the biosynthesis of organic acids (malate, citrate), phenols (caffeic acid, coumaroyl quinic acid isomer 1, dicaffeoylquinic acid isomer 1), and flavonoids (quercetin-3-O-glucuronide, quercetin-3-O-glucoside). Biostimulant action may facilitate the bio-enhancement of certain lettuce cultivars that are otherwise limited by their genetic potential, for the accumulation of specific compounds beneficial to human health.

1. Introduction

Biostimulants are organic and inorganic compounds or microorganisms that when applied to plants can enhance plants’ growth, yield, and tolerance to stress [1]. They have been found to increase plants’ nutrient use efficiency, reduce the supply of fertilizers to the soil, and increase agricultural sustainability [2]. Protein hydrolysates (PHs) are a particular category of plant biostimulants constituted of a complex mixture of amino acids and oligo- and polypeptides, obtained from chemically or enzymatically hydrolyzed proteins, and deriving from animal and vegetable agro-industrial byproducts, such as blood, viscera, seeds, hay, and plant residues [2]. From this point of view, they can contribute to the recycling of agro-food waste and reduce the impact that these byproducts have on human and environmental health [3]. There has been less consensus among the scientific community in regard to animal-derived PHs, produced via alkaline or acid hydrolysis, compared to plant-derived PHs. This is mainly due to the potential adverse effects that can be observed after repeated foliar applications of animal-derived PHs, such as increased leaf NaCl accumulation [4], leaf chlorination, a reduction in the photosynthetic rate, or other phytotoxic effects [5,6]. Moe [7] also attributed the negative effects of animal-derived PHs to their higher content of free amino acids. Rouphael et al. [8] found that proline levels increased after repeated foliar applications of animal-derived PHs in basil, with a consequent inhibitory effect on root elongation, N uptake, plant growth, and yield.
A high content of free amino acids is avoided during the production of plant-based biostimulants by exploiting enzymes that have selective cleavage sites on proteins. In this case, the biostimulant products are mixtures of amino acids and peptides of different lengths [9].
It has been documented that the application of foliar or root PHs improved the absorption of water and macro- and microelements in several horticultural crops [9,10]. These results were attributed mostly to PHs’ effect on root architecture and their ability to increase soil mineral solubility, as well as the activity of key enzymes related to nitrogen metabolism, such as nitrate reductase and glutamine synthetase [11]. PHs have also been found to improve crop quality by increasing the concentration of phytonutrients, such as carotenoids, polyphenols, and flavonoids [12], and the constraint of nitrate content in many species of leafy vegetables, such as rocket, radish, cabbage, pak choi, onion, swiss chard, spinach, lettuce, celery, and parsley [13]. In addition, PHs have been shown to alleviate the adverse effects on crop productivity of certain abiotic stresses, such as salinity, high temperature, and drought [14,15,16]. The latter has been related to an increase in antioxidant molecules and/or enzyme activities able to detoxify the reactive oxygen species (ROS) generated during stress conditions.
Lactuca sativa L. is a vegetable that is widespread all over the world and is a widely cultivated species in Mediterranean areas [17]. Lettuce is classified into seven major groups which differ in their textures, leaves, head shapes, and colors [18]. It has a short development cycle and it is valued for its high content of water, minerals, vitamins, chlorophylls, fibers, and polyphenols [19]. Polyphenols, including flavonoids and phenolic acids, have a well-known antioxidant activity and play an important role in extending plant shelf life, as well as in human nutrition, because they are capable of preventing or reducing the oxidative states typical of many inflammatory states related to neurodegenerative diseases and cancer [20,21].
In this study we aimed to understand the effect of two biostimulants—protein hydrolysates (legume-derived protein hydrolysates Trainer®) and natural plant extracts (namely tropical plant extracts Auxym®)—on the primary and secondary metabolism of two lettuce cultivars, green and red salanova®, grown in a glasshouse. Mineral composition and morpho-physiological and qualitative traits (SPAD index, gas exchanges, concentration of organic acids, phenolic acids, carotenoid flavonoids) were evaluated in relation to yield. This study can improve our knowledge on the ways in which hydrolyzed proteins and plant extract biostimulants affect plants.

2. Materials and Methods

2.1. Plant Material and Growth Conditions

The experiment was conducted in a glasshouse located at the experimental station of the Department of Agricultural Sciences of the University of Naples Federico II, based in Bellizzi (SA), Italy. The duration of the experiment was 35 days during the 2017 spring-summer season. Two butterhead lettuce cultivars (Lactuca sativa L. var. capitata), green and red salanova® (Rijk Zwaan, Der Lier, The Netherlands), were transplanted into pots of 2 L containing an agricultural soil: vermiculite mixture (3/1; v/v), mixed with Nitrophoska Gold (Compo Expert, Cesano Maderno (MB), Italy. The experiment was carried out with a drip irrigation system (2 L h−1 dripper plant−1).

2.2. Experimental Design and Biostimulant Application

The experiment was organized according to a factorial completely randomized design with two factors, biostimulants (two biostimulants and one untreated control), cultivars (red and green), and three replicates. Each replicate comprised six pots arranged in rows spaced 0.30 m apart, with plants spaced 0.33 m apart within rows (10 plants m−2). The commercial biostimulants utilized were a legume-derived protein hydrolysate, Trainer® (PH), and a tropical plant extract, Auxym® (TPE), both produced by Hello Nature®, Rivoli Veronese (VR), Italy, of which a detailed description is reported in Colla et al. [22]. Biostimulant solutions were prepared at a concentration of 4 mL L−1 for PH and 1 mL L−1 for TPE. A week after transplanting, the biostimulant treatments were applied via a foliar spray on a weekly basis, accounting for a total of 4 applications during the entire growth cycle.

2.3. Harvest and Samples Collection

At the end of trial, leaf number (no. plant−1), leaf area (cm2 plant−1), and fresh yield (g plant−1) were determined for each treatment replicate. Lettuce plant leaf area was evaluated using an electronic area meter (LiCor 3100C model, LI-COR Biosciences, Lincoln, NE, USA). Afterwards, plants were oven-dried at 60 °C until reaching a constant weight in order to measure dry biomass (g plant−1) by means of an analytical balance (XT120A; Precisa Gravimetric, Dietikon, Switzerland) and to calculate the dry matter percentage, determined as leaf dry biomass/leaf fresh yield × 100. Subsequently, dry samples were finely ground (IKA, MF 10.1, Staufen, Germany) to be used for analyses of the total nitrogen, nitrate, organic acid, and mineral content.

2.4. SPAD Index and Leaf Gas Exchange

SPAD index and leaf gas exchange were determined on the day of harvest of lettuce plants from 9:00 to 11:00 am. The SPAD index was measured on fully expanded lettuce leaves using a portable SPAD-502 chlorophyll meter (Konica Minolta, Tokyo, Japan). The net carbon dioxide assimilation rate and transpiration were measured using a portable gas exchange analyser, model Li-6400, (BioScientific Ltd., Hoddesdon, UK), equipped with a 6.25 cm2 broadleaf chamber. Intrinsic water use efficiency (WUEi) was calculated as net photosynthetic CO2 rate/transpiration.

2.5. Total Nitrogen, Mineral, and Organic Acid Analysis

Total nitrogen was assayed following the Kjeldahl method [23] by mineralizing 1 g of dry lettuce sample at 400 °C with sulfuric acid (98%), hydrogen peroxide (35%), potassium sulfate, selenium, and copper oxide. After a distillation phase (Volp UDK 140 distiller, Velp scientifica, Usmate Velate, MB, Italy), a titration step allowed us to measure the total nitrogen percentage.
Two hundred and fifty milligrams of each dry sample was extracted in ultrapure water (Milli-Q, Merck Millipore, Darmstadt, Germany), and an aliquot of this extract was used for the ion chromatography (ICS-3000, Dionex, Sunnyvale, CA, USA), coupled to a conductivity detector to quantify anions (nitrate, phosphorus, sulfur), organic acids (malate, tartrate, oxalate, citrate, isocitrate), and cations (potassium, calcium, magnesium). Nitrate content was expressed as mg kg−1 fresh weight (based on each sample’s percentage of dry matter), whereas all the other elements were expressed as mg g−1 dry weight, and organic acids as mg g−1 DW. The protocol details are specified in the work of Formisano et al. [24].

2.6. Polyphenol Analysis via UHPLC-HRMS: Phenolic Acid and Flavonoid Content

Lyophilized samples (100 mg each) were diluted with 5.0 mL of methanol/water (60:40 v/v), sonicated for 30 min at room temperature (MOD LBS1, FALC Instruments, Bergamo, Italy), then centrifuged at 2900× g (relative centrifuge force) for 15 min at 4 °C (MOD SL16R, Thermo Fisher Scientific, Waltham, MA, USA). An aliquot (2 µL) of the filtered extract was injected into an Ultra High-Pressure Liquid Chromatograph (UHPLC, Thermo Fisher Scientific, Waltham, MA, USA). The mass spectrometry analysis was performed by the means of a Q Exactive Orbitrap LC-MS/MS system (Thermo Fisher Scientific, Waltham, MA, USA). The entire protocol is detailed in Kyriacou et al. [25]. All data were expressed in µg g−1 DW.

2.7. Carotenoids Analysis by HPLC-DAD

Carotenoids were assayed according to the method of Kim et al. [26] with a few modifications, stated in detail in Kyriacou et al. [25]. Briefly, lyophilized samples (100 mg) were extracted with 6 mL ethanol containing 0.1% butylated hydroxytoluene. Aliquots (20 µL) of the extracts were analyzed via reverse phase-high performance liquid chromatography (HPLC LC 10 Shimadzu, Osaka, Japan). Carotenoids were quantified by measuring the absorbance of the eluent at 450 nm and creating an external calibration curves in the range of 5–100 μg mL−1. Data were expressed as µg g−1 DW.

2.8. Statistical Analysis

Data were subjected to analysis of variance (ANOVA) and means were compared using the Tukey–Kramer HSD test at the p < 0.05 level using the SPSS 20 software package (IBM Corp., Armonk, NY, USA). Data represent the means of three replicates (n = 3). A heat map was generated in Excel, summarizing the responses of the two lettuce cultivars (green and red salanova) to the two biostimulant treatments (PH and TPE). Results were calculated as the logarithm base 1.2 (Log1.2) ratio of biostimulant treatments (PH or TPE) to control plants, which were not treated with biostimulants. Results were visualized using a false color scale with red indicating an increase and blue a decrease, whereas white squares indicated no differences [27]. PCA was carried out by using Minitab® 18 statistical software [28].

3. Results

3.1. Yield and Biometric Parameters

The number of leaves, dry biomass, and dry matter content in green lettuce were higher than those in red lettuce. On the other hand, the red cultivar produced larger leaves and higher fresh yields than the green one. Significant cultivar × biostimulant interaction was observed for leaf number and leaf area since the two biostimulants did not have the same effect on the two cultivars (Table 1). Specifically, while both biostimulants increased green lettuce’s leaf number, only TPE had an effect on red lettuce leaf number when compared to the control. Similarly, only TPE had an effect on red lettuce leaf area compared to the control but neither of the two biostimulants had an effect on green lettuce’s leaf area. No cultivar × biostimulant interaction was observed for the rest of the biometric parameters. Both biostimulants increased the fresh yield of both cultivars, whereas only TPE increased the dry biomass of the two cultivars when compared with the control. In contrast, both biostimulants decreased the dry matter content of both cultivars. Dry matter was reduced by 3.4% in the presence of PH, and by 6.3% after the treatment with TPE. Conclusively, TPE treatment increased the leaf number, fresh yield, and the dry biomass of both cultivars compared to the control, by an average of 10.9%, 20.0%, and 12.4%, respectively. The PH treatment increased both cultivars’ fresh yields on average by 7.4% but only increased the green cultivar’s number of leaves (10.6%) in comparison with the control.

3.2. Mineral Content

Mineral content differentiation was observed among the two cultivars (Table 2). Red salanova was characterized by a higher total N, NO3, P, Ca, K, Mg, and S content than green salanova. Significant cultivar × biostimulant interaction was observed for the contents of total N, K, Ca, and Mg. Only in green lettuce and depending on biostimulant type, the content of these metals increased by 10.4% to 30.5% when compared to the control. Moreover, although both biostimulants increased total N content of green lettuce, the total N content of the red cultivar was decreased after the foliar application of PH by 10%. Only TPE biostimulant application increased the P content of both cultivars, by 8.9% on average, whereas neither biostimulant had any effect on plants’ NO3 or S contents.

3.3. Organic Acids

Significant differentiation in the organic acid content was observed between the two cultivars, with the exception of malate (Table 3). In fact, green salanova accumulated significantly more tartrate (+81.0%), isocitrate (+38.0%), and citrate (+16.0%) but a lower oxalate (−24.0%) content than the red cultivar. Both biostimulants increased the malate and citrate content of both cultivars but did not have any effect on the biosynthesis of the rest of the acids studied. TPE and PH foliar application increased malate content by 21.4% and 10.3% respectively, when compared to the control. The two biostimulants’ effects were similar in terms of citrate content, which increased by an average of 14.0% compared to the control.

3.4. Physiological Parameters

The SPAD index and WUEi were significantly higher in red lettuce (+33.7% and +20.0%, respectively), whereas red lettuce’s E value was lower (−17%) than that of green lettuce. The ACO2 values of the two cultivars were similar (Table 4).
The SPAD index, ACO2, and WUEi increased by 4.9%, 27.6%, and 53.8%, compared to the control after TPE treatment, and by 2.2%, 16.6%, and 20.0% after PH application. The transpiration rate (E) did not vary, compared to the control, in the presence of PH, whereas it was reduced by 17.8% in the presence of TPE.

3.5. Phenolic Acids

Ten phenolic acids were identified in both lettuce cultivars (Table 5). In addition to the fact that the same acids were identified in each cultivar, their concentrations followed a similar ranking in the two cultivars. However, the total phenolic acid content of the red cultivar control was 4.6-fold higher (2679 μg g−1 DW) than that of the green control (581.6 μg g−1 DW) since almost all of the individual phenolic acid concentrations, except caffeic acid, were higher in the red than in the green cultivar. Chlorogenic acid was the most abundant phenolic acid in both cultivars (with a mean value of 2336 μg g−1 DW and 488.3 μg g−1 DW for the red and green cultivar, respectively), whereas dicaffeoylquinic acid isomer 1 was the second most abundant phenolic acid, with a mean value of 591.8 μg g−1 DW for the red and 168.8 μg g−1 DW for the green lettuce. Other acids that were detected in significant concentrations in both cultivars were coumaroyl quinic acid isomer 1, isomer 2, and dicaffeoylquinic acid isomer 2. Two isomers of feruloyl quinic acid and the chicoric acid isomers 1 and 2 were also detected but in lower concentrations in both cultivars.
Significant cultivar × biostimulant interaction was observed for total phenolic acid content, coumaroyl quinic acid isomer 1, cholorogenic acid, and dicaffeoylquinic acid isomer 1. The reason for this was that the two biostimulants did not have the same effect on both cultivars for those parameters. Specifically, total phenolic acids and coumaroyl quinic acid isomer 1 content were increased only by PH on both cultivars by an average of 33.9% and 45.8%, respectively. Chlorogenic acid content was increased by an average of 26.5% irrespective of the biostimulant treatment, but only in red lettuce. The dicaffeoylquinic acid isomer 1 content was increased by 151.5% only after the PH treatment in the green cultivar and by 75.3% only after the TPE application in the red cultivar. Only the caffeic acid content was increased by an average of 66.4% in both cultivars irrespective of biostimulant type. Biostimulant treatments did not affect the content of the rest of the phenolic acids.

3.6. Flavonoids

The mean total flavonoid content was almost 14-fold higher in the red cultivar (837.8 μg g−1 DW), compared to the green one (60.60 μg g−1 DW) (Table 6). The most abundant flavonoids in the red cultivar were quercetin-3-O-glucuronide (399.6 μg g−1 DW) and quercetin-3-O-glucoside (296.5 μg g−1 DW), followed by quercetin-3-O-galactoside (55.75 μg g−1 DW), luteolin-7-O-malonyl-glucoside (45.26 μg g−1 DW), and luteolin-7-O-glucoside (30.52 μg g−1 DW). Kaempferol-3-O-glucoside had a concentration of 6.75 μg g−1 DW. The lowest values were registered for luteolin-3-O-rutinoside (2.59 μg g−1 DW) and rutin (0.49 μg g−1 DW). The amount of kaempferol-3-O-rutinoside was not statistically different in the two cultivars, with a value of 0.19 μg g−1 DW in the green cultivar and 0.26 μg g−1 DW in the red one. In the green cultivar, the most abundant flavonoid was quercetin-3-O-glucuronide as well, but with a concentration 8.5-fold lower than that in the red one. The second most abundant flavonoid was quercetin-3-O-galactoside, with a concentration of 6.96 μg g−1 DW. All the other flavonoids had concentrations between 2.05 and 0.06 μg g−1 DW.
Biostimulant foliar application had a significant effect only on quercetin-3-O-glucuronide, quercetin-3-O-glucoside, and the total flavonoid content. However, significant cultivar × biostimulant interaction was observed for these three parameters since PH and PTE application affected only one of the two cultivars. Specifically, only the total flavonoids of red lettuce were affected by biostimulants and increased more during TPE (41.4%) than with PH (26.5%) treatment. Similarly, quercetin-3-O-glucoside in red lettuce was increased more with the use of TPE (52.7%) than with PH (15.5%) treatment. Quercetin-3-O-glucuronide content was increased by an average of 33.5%, irrespective of biostimulant type.

3.7. Carotenoids

Neoxanthin, violaxanthinm and β-carotene had higher values in the red cultivar compared to the green one under control conditions (Table 7).
Biostimulant application had a significant effect on lettuce carotenoids when compared to the control. Furthermore, significant cultivar × biostimulant interaction was observed for all the carotenoids identified since the two biostimulants did not affect the two cultivars similarly. Neoxanthin content was reduced (−45.3%) in the green cultivar by both biostimulants, whereas only PH had a significant but negative effect on the red cultivar (−25.9%). Violaxanthin content was decreased by both biostimulant applications in the red cultivar, whereas in the green cultivar it was decreased only after the application of PH (−27.0%) since the application of TPE increased the violaxanthin content by 65.3%. β-carotene content was not affected by biostimulant applications in the green lettuce, whereas only PH had a significant but negative effect on red cultivar (−54.0%).

3.8. Heat Map and Principal Component Analysis (PCA)

We have used an Excel-based heat map to sum up the changes in the data in terms of dependence on the lettuce cultivar (red and green salanova) and biostimulant treatment (PH and TPE) (Figure 1). In green salanova, PH and TPE application significantly increased the leaf number and total N, K, Ca, and Mg compared to respective controls; however, although PH increased the total phenols (including coumaroyl quinic acid isomer 1 and dicaffeoylquinic acid isomer 1) and decreased neoxanthin and violaxanthin, TPE had no effect on phenols, and decreased neoxanthin but increased violaxanthin compared to controls. In red salanova, TPE application significantly increased the leaf number, leaf area and dicaffeoylquinic acid isomer 1 level, but decreased violaxantin, whereas PH significantly decreased total N and carotenoids compared to the respective controls of red salanova. PH and TPE were also both able to enhance the total phenolics (including chlorogenic acid and coumaroyl quinic acid isomer 1) and total flavonoid content (including quercetin-3-O-glucuronide and quercetin-3-O-glucoside) compared to controls in red salanova.
A clear separation among cultivars and biostimulant treatments was observed by applying a principal component analysis (PCA). The first three principal components (PCs) were related with eigenvalues higher than 1 and explained 94.3% of the total variance, with PC1, PC2, and PC3 accounting for 66.6%, 20.4%, and 7.4%, respectively. The two cultivars were separated along PC1, with green salanova concentrated along the negative side of PC1 and red salanova on the positive side of PC1. Untreated plants were on the negative side of PC2, whereas TPE treatments were on the positive side of PC2, irrespective of cultivar type. PH and TPE treatments of green lettuce were grouped in the same positive quadrant of PC2, whereas PH treatments of red lettuce were on the negative side of PC2 (Figure 2). PC1 was positively correlated with phenolics and flavonoids, S, K, oxalate, neoxanthin, leaf area, and total N and SPAD index. PC1 was also negatively correlated with dry matter, tartrate, E, isocitrate, and leaf number. PC2 was positively correlated with isocitrate ACO2, citrate, dry biomass, fresh yield, malate, WUEi, caffeic acid, and Mg (Figure 2).

4. Discussion

The leaf area and number of lettuce leaves are primarily genetically regulated since some cultivars are characterized by a higher number of leaves, whereas others are characterized by fewer but larger leaves [29]. In this work, green salanova had a higher number of leaves, dry biomass, and dry matter, compared to the red cultivar, in the absence of biostimulant application. The latter, on the other hand, produced a greater leaf area and higher fresh yield than the green cultivar. Fresh yield and dry matter (%) differentiation, among lettuce cultivars of the same species has also been reported by Rouphael et al. [18], whereas other studies have shown that green lettuce cultivars had greater plant vegetative growth and productivity than red ones [30]. The latter has also been observed for green cultivars compared to the red ones of other species, as in the case of Perilla frutescens [31].
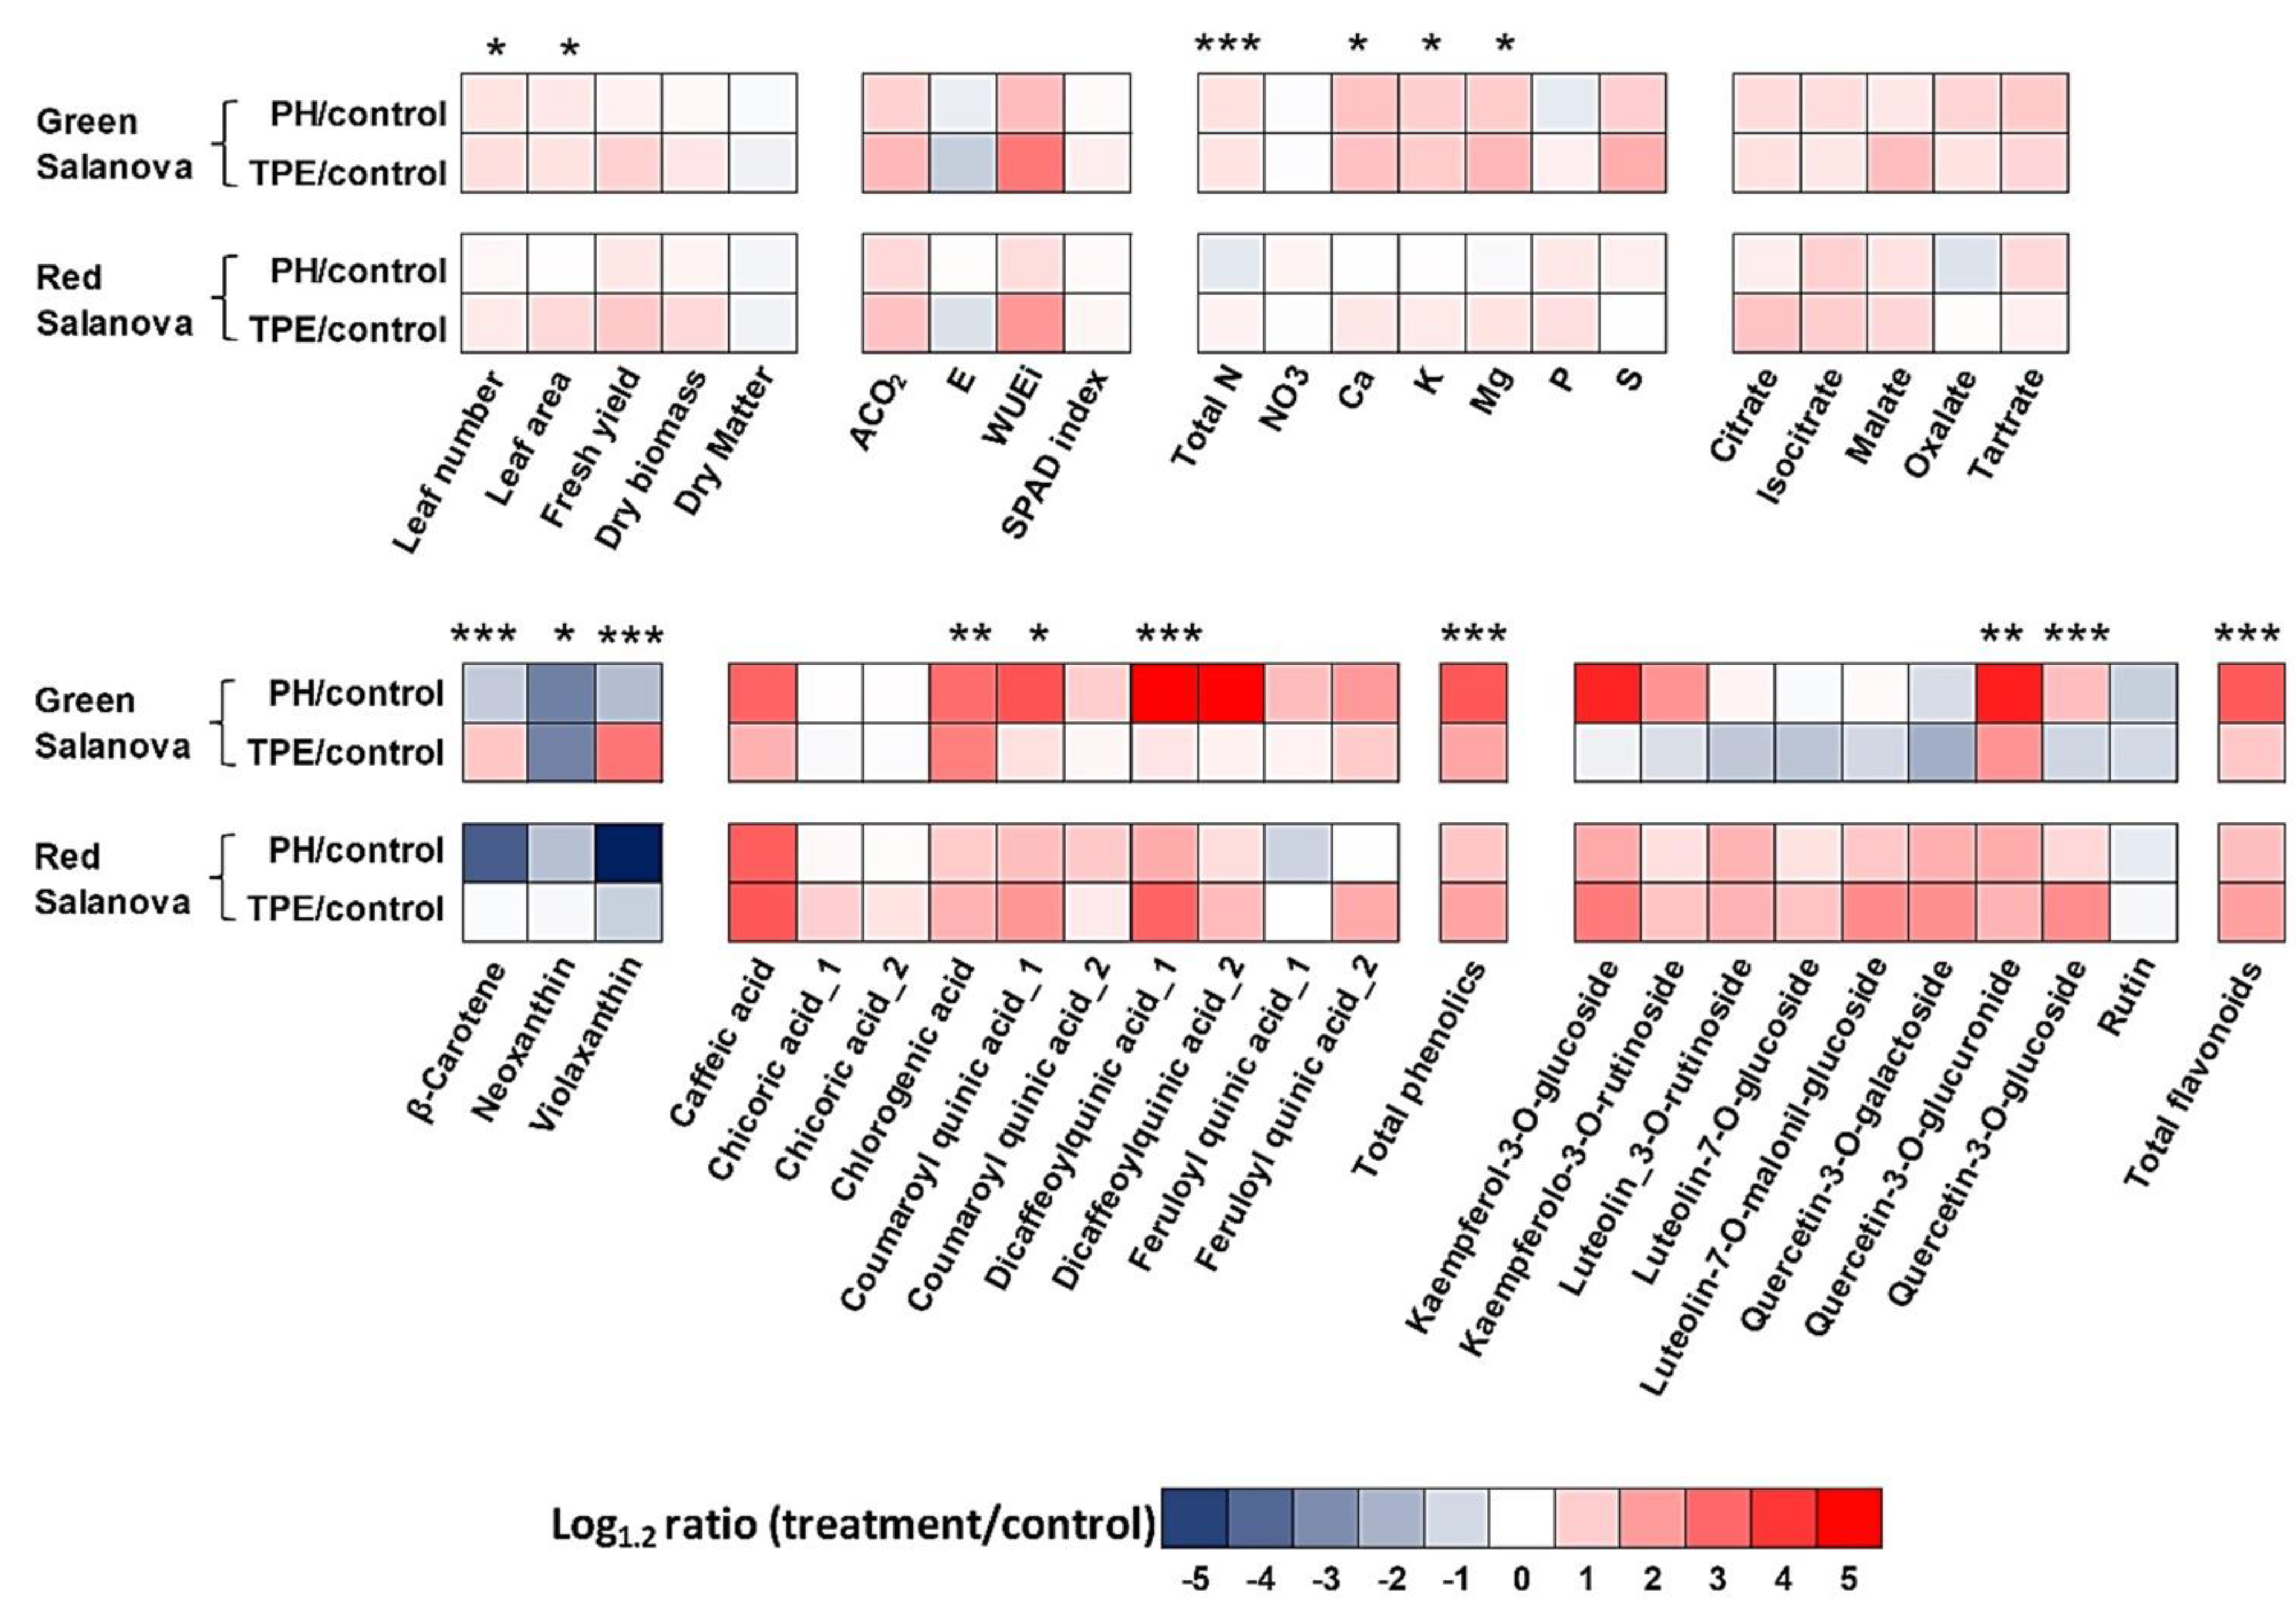
In our work, the effect of biostimulants was significant in all the biometric parameters examined. Both biostimulants favored the fresh yield of lettuce cultivars, whereas the biostimulant effects on the other biometric parameters depended on the type of biostimulant treatment, as well as the cultivar type. Most lettuce biometric parameters were favored more through TPE application, apart from lettuce dry matter content, which was actually decreased by both biostimulant applications.
Increases in yield and biometric parameters after PH biostimulant treatments were documented in the recent literature for various vegetable crops, such as lettuce, spinach, rocket, and baby leaf [32,33,34,35]. An increase in the yield of lettuce plants [36] and in the roots and shoots of tomato plants [4] was observed following a radical application of Trainer®. This latter treatment of lettuce plants grown in greenhouses and under conditions of saline stress improved plants’ performance in terms of their marketable yield, dry biomass, and root dry weight, as shown by Lucini et al. [11]. The authors found a correlation between the better performance of the treated plants with an increase in photosynthetic activity and nitrogen metabolism. The use of Auxym® on four tomato (Solanum lycopersicum L.) landraces [37] showed that it increased the yield of two landraces by 21% and 35%, compared to untreated plants. Ertani et al. [12] examined the response of Capsicum chinensis L. plants to two biostimulants, one obtained from enzymatic hydrolysis of Medicago sativa L. plants (AH), and another one obtained from cool extraction of the red grape skin of Vitis vinifera L (RG). AH differed from RG in terms of having a higher content of total organic carbon, total phenols, and indoleacetic acid. RG had a slightly higher content of sugars and the hormone isopentenyladenosine than AH. The authors showed a strong increase in the fresh weight of leaves and fruits, and in the number of fruits, compared to the control plants, after the application of the two biostimulants. These results are comparable to ours, where the lettuce leaf number and the weight of green and red Salanova increased when both type of biostimulants were used. However, the effect was variant on pepper, based on the biostimulant used and the dose.
In our work, the two cultivars differed statistically in terms of mineral content, with the red cultivar exhibiting the highest total N content, and all the elements examined (Table 2). The nitrate content was also higher in the red cultivar (3487 mg kg−1 FW), compared to the green one, and this value was below the limits established by EU regulations [38]. A significant variation in the mineral content (K, Ca, Mg, Na) in seven cultivars of the same lettuce species was shown by Rouphael et al. [18]. Furthermore, greater retention of K in the cytoplasm and vacuole of red lettuce (Salad Bowl lettuce (Lactuca sativa L. var. Acephal), compared to the green cultivar, was found by Carillo et al. [39]. In this study, biostimulant application had a significant effect on all minerals but NO3 and S. The two biostimulants had a similar effect on the NO3, S, and P contents of both cultivars. However, the biostimulant effect on certain lettuce mineral components proved to be influenced also by cultivar type, as only green lettuce appeared to respond positively to both biostimulants, at least in terms of the K, Ca, and Mg concentrations. Furthermore, using one or both biostimulants, the concentrations of N, K, Ca, and Mg in the green cultivar were enhanced and reached similar levels to those of the red cultivar’s control levels. The latter is crucial because it could enable us to bio-enhance commercial cultivars in which the low concentrations of certain minemals beneficial for human health can be determined genetically and not by other exogenous factors. That was also one of the main reasons that originally led to the examination of biostimulants as a potential tool for the bio-enhancement of edible plant parts (leaves, fruits) with minerals that are considered essential for sustaining human health [37,39].
The enhanced absorption of certain nutrients (N, K, Ca, and Mg) by only the green cultivar could be related with the increase in green salanova’s total N (%) after the application of PH and TPE biostimulants. In contrast, the two biostimulants reduced (PH) or did not have an effect (TPE) on the total N (%) of red lettuce. Several studies have highlighted an increase in the metabolism and assimilation of nitrogen, and the enzymes involved (nitrate reductase, nitrite reductase, glutamine synthetase, glutamate synthase, and aspartate aminotransferase), following the application of protein hydrolysates [10,40,41,42]. Amino acids, absorbed by plants from the environment, are important sources of organic N, used for the synthesis of proteins or other organic molecules. As a mode of action, amino acids and peptides can also act as elicitors by binding to receptors on cell membranes and triggering morphological, physiological, and biochemical changes in the plant. The microorganisms of the rhizosphere secrete enzymes that hydrolyze the peptides into smaller fractions and that can act as signal molecules in the plant to increase the absorption of minerals [9]. A root hair growth-promoting peptide was identified in Trainer® [9,43], which can lead to an improvement in the root system, and greater absorption of nutrients by the treated plants compared to those not treated with the biostimulant. In particular, Trainer® has been found to increase the expression of genes involved in both nitrogen uptake and transport [42,44]. Similarly to Trainer®, Auxym® application is clearly involved in the expression of genes responsible for the absorption of certain nutrients. For example, an increase in Mg and K content has recently been demonstrated for tomato plants treated with Auxym® [37]. The authors emphasized the importance of this result, because the use of Auxym® would reduce the contribution of K as a fertilizer since it is one of the main elements required for tomato cultivation.
The organic acid differentiation (isocitrate, citrate, and tartrate) observed among the two salanova types examined in this study could be related to nitrate or potassium uptake and assimilation and their influence on the uptake and distribution of other ions. When nitrates are supplied to plants, the anion uptake exceeds the cation uptake, which may lead to an increase in the concentration of certain organic acids in order to maintain the required electroneutrality among the plant and the nutrient medium [45]. Thus, the nitrate itself, when accumulated, could upregulate the biosynthesis of organic acids [46]. In our work, the biosynthesis of higher concentrations of organic acids (isocitric, citric, and tartrate acids) in the green cultivar than in the red lettuce cultivar may have been necessary due to the possible regulatory role of organic acids as anti-anions for nitrates. Concerning the red lettuce, the role of the counter-ion was probably exerted more efficiently by K+, which was present at significantly higher concentrations in the red lettuce than in the green lettuce [47]. The higher levels of K+ and Ca2+ found in red lettuce could be responsible for the higher recorded amount of oxalate, as the latter is usually involved in the regulation of Ca2+ levels and the Na to K balance [48]. The two biostimulants used increased the content of malate and citrate, compared to the control. Ertani et al. [10], applying alfalfa PH to corn plant roots, showed an increase in the activity of genes that code for enzymes of the Krebs cycle and glycolysis. Furthermore, the authors recorded an increase in the activity of the enzymes involved in these pathways of primary metabolisms, such as malate dehydrogenase, isocitrate dehydrogenase, and citrate synthase. The citric acid content increased in four tomato (Solanum lycopersicum L.) landraces examined by Rouphael et al. [37] after Auxym® application. As previously illustrated, both PH and TPE modulated the physiological mechanisms of the treated plants.
Red lettuce showed a higher SPAD index than the green one, as expected, since the SPAD index is significantly correlated to the content of chlorophylls and total flavonoids [49]. Total flavonoids can play a role as a sunscreen, protecting leaf tissues from UV-B radiation and filtering out yellow-green light, which is partly responsible for chlorophyll excitation [50]. The lower WUEi and higher transpiration observed in the green lettuce cultivar (Table 4) could be the result of its reduced ability to accumulate K, Ca, and Mg in the leaves when compared to the red cultivar. The lower K, Ca, and Mg concentrations in the green lettuce leaves could have also increased stomatal resistance and decreased photosynthetic activity [39]. K is an indispensable element for stomatal movements. If its concentration is reduced, physiological functions can be compromised [51]. A reduction in Ca levels can also have negative effects on stomatal opening, compromising the assimilation of CO2 [39]. Mg is important for the activation of Rubisco, the essential enzyme for photosynthesis (ribulose 1,5-bisphosphate carboxylase-oxygenase). Magnesium is also involved in the subsequent conversion reaction of 3PGA into 1,3-bisphosphoglycerate acid (BPGA) by means of an enzyme that uses MgATP [45]. A reduction in Mg was also associated with a lower translocation of sucrose from the leaves to the phloem, resulting in an increase in the leaf dry matter [52], as shown in the green cultivar in our work. The biostimulant effect was significant for all the physiological parameters examined (SPAD, ACO2, E, and WUEi) in this study. An increase in the SPAD index, photosynthetic activity, and other physiological parameters after the application of plant-derived PH (Trainer®), was also shown in other studies regarding tomatoes [18] and lettuce [36]. The positive effect of the plant-derived protein hydrolysate (Trainer®) on plant physiological parameters could be attributed to the stimulation of nitrogen uptake and assimilation, which could enhance plant photosynthesis and carbon assimilation [4].
The content of total phenols and phenolic acids is genotype-dependent, as demonstrated for different leafy vegetables [53]. For lettuce in particular, the red pigmentation is associated with the presence of antioxidant molecules, such as phenolic acids, and flavonoids [54]. In our work, the red cultivar had a higher total phenol content than the green one. Chlorogenic acid was the most abundant phenolic acid in lettuce, as already documented in several other papers [18,55]. Depending on the cultivar type, the two biostimulants were proved able to increase the concentration of total phenols and some of the phenolic acids identified in this work (chlorogenic acid, caffeic acid, coumaroyl quinic acid isomer 1, and dicaffeoylquinic acid isomer 1), compared to the control. Similarly, total phenolic acids including caffeic acid were strongly enhanced in pepper leaves after the application of two similar biostimulants [12]. The accumulation of antioxidant molecules, such as phenols, flavonoids, and carotenoids, has been associated with the PH’s biostimulant modification of plant primary and secondary metabolism [9]. TPEs were also documented to improve plants’ metabolism via the accumulation of starch, fructose, glucose, and lycopene [37].
In our work, the red cultivar showed a 14-fold higher content of total flavonoids and single flavonoids than the green one. Similar results were observed by Kim et al. [54]. A higher flavonoid content is considered an advantage, as it allows for more choices among consumers [19,56]. The two biostimulants significantly increased total flavonoids, quercetin-3-O-glucuronide, and quercetin-3-O-glucoside in the red cultivar (CxB, Table 6). According to many authors, plant-derived PHs, as a mode of action, activate secondary metabolism through an increase in the expression of genes encoding phenylalanine (tyrosine), an ammonia-lyase enzyme [57,58]. Cinnamic acid and subsequently coumaric acid originate from phenylalanine, transformed by the PAL enzyme. Starting from coumaric acid, the synthesis of flavonoids begins. The class of flavonoids includes many plant pigments (anthocyanidins with red and blue colors, yellow flavonols, and others), and condensed tannins. An increase in the synthesis of flavonoids in maize plants, treated with alfalfa PH in saline conditions, was found bobservedy Ertani et al. [10]. Similarly, Boselli et al. [59] observed an increase in soluble solids, total phenols, and anthocyanins in grapes following the foliar application of plant-derived PHs.
Carotenoid differentiation among the two lettuce types was expected since the two cultivars had different pigmentation. As expected, all carotenoids exhibited higher values in the red cultivar compared to the green one under control conditions. The effects of biostimulant application on all lettuce carotenoids were subjected to significant interactions with the type of cultivar. More experimentation is required regarding how biostimulants could affect lettuce pigmentation since both biostimulants reduced and/or did not have any effect on the pigmentation of these lettuce plants.
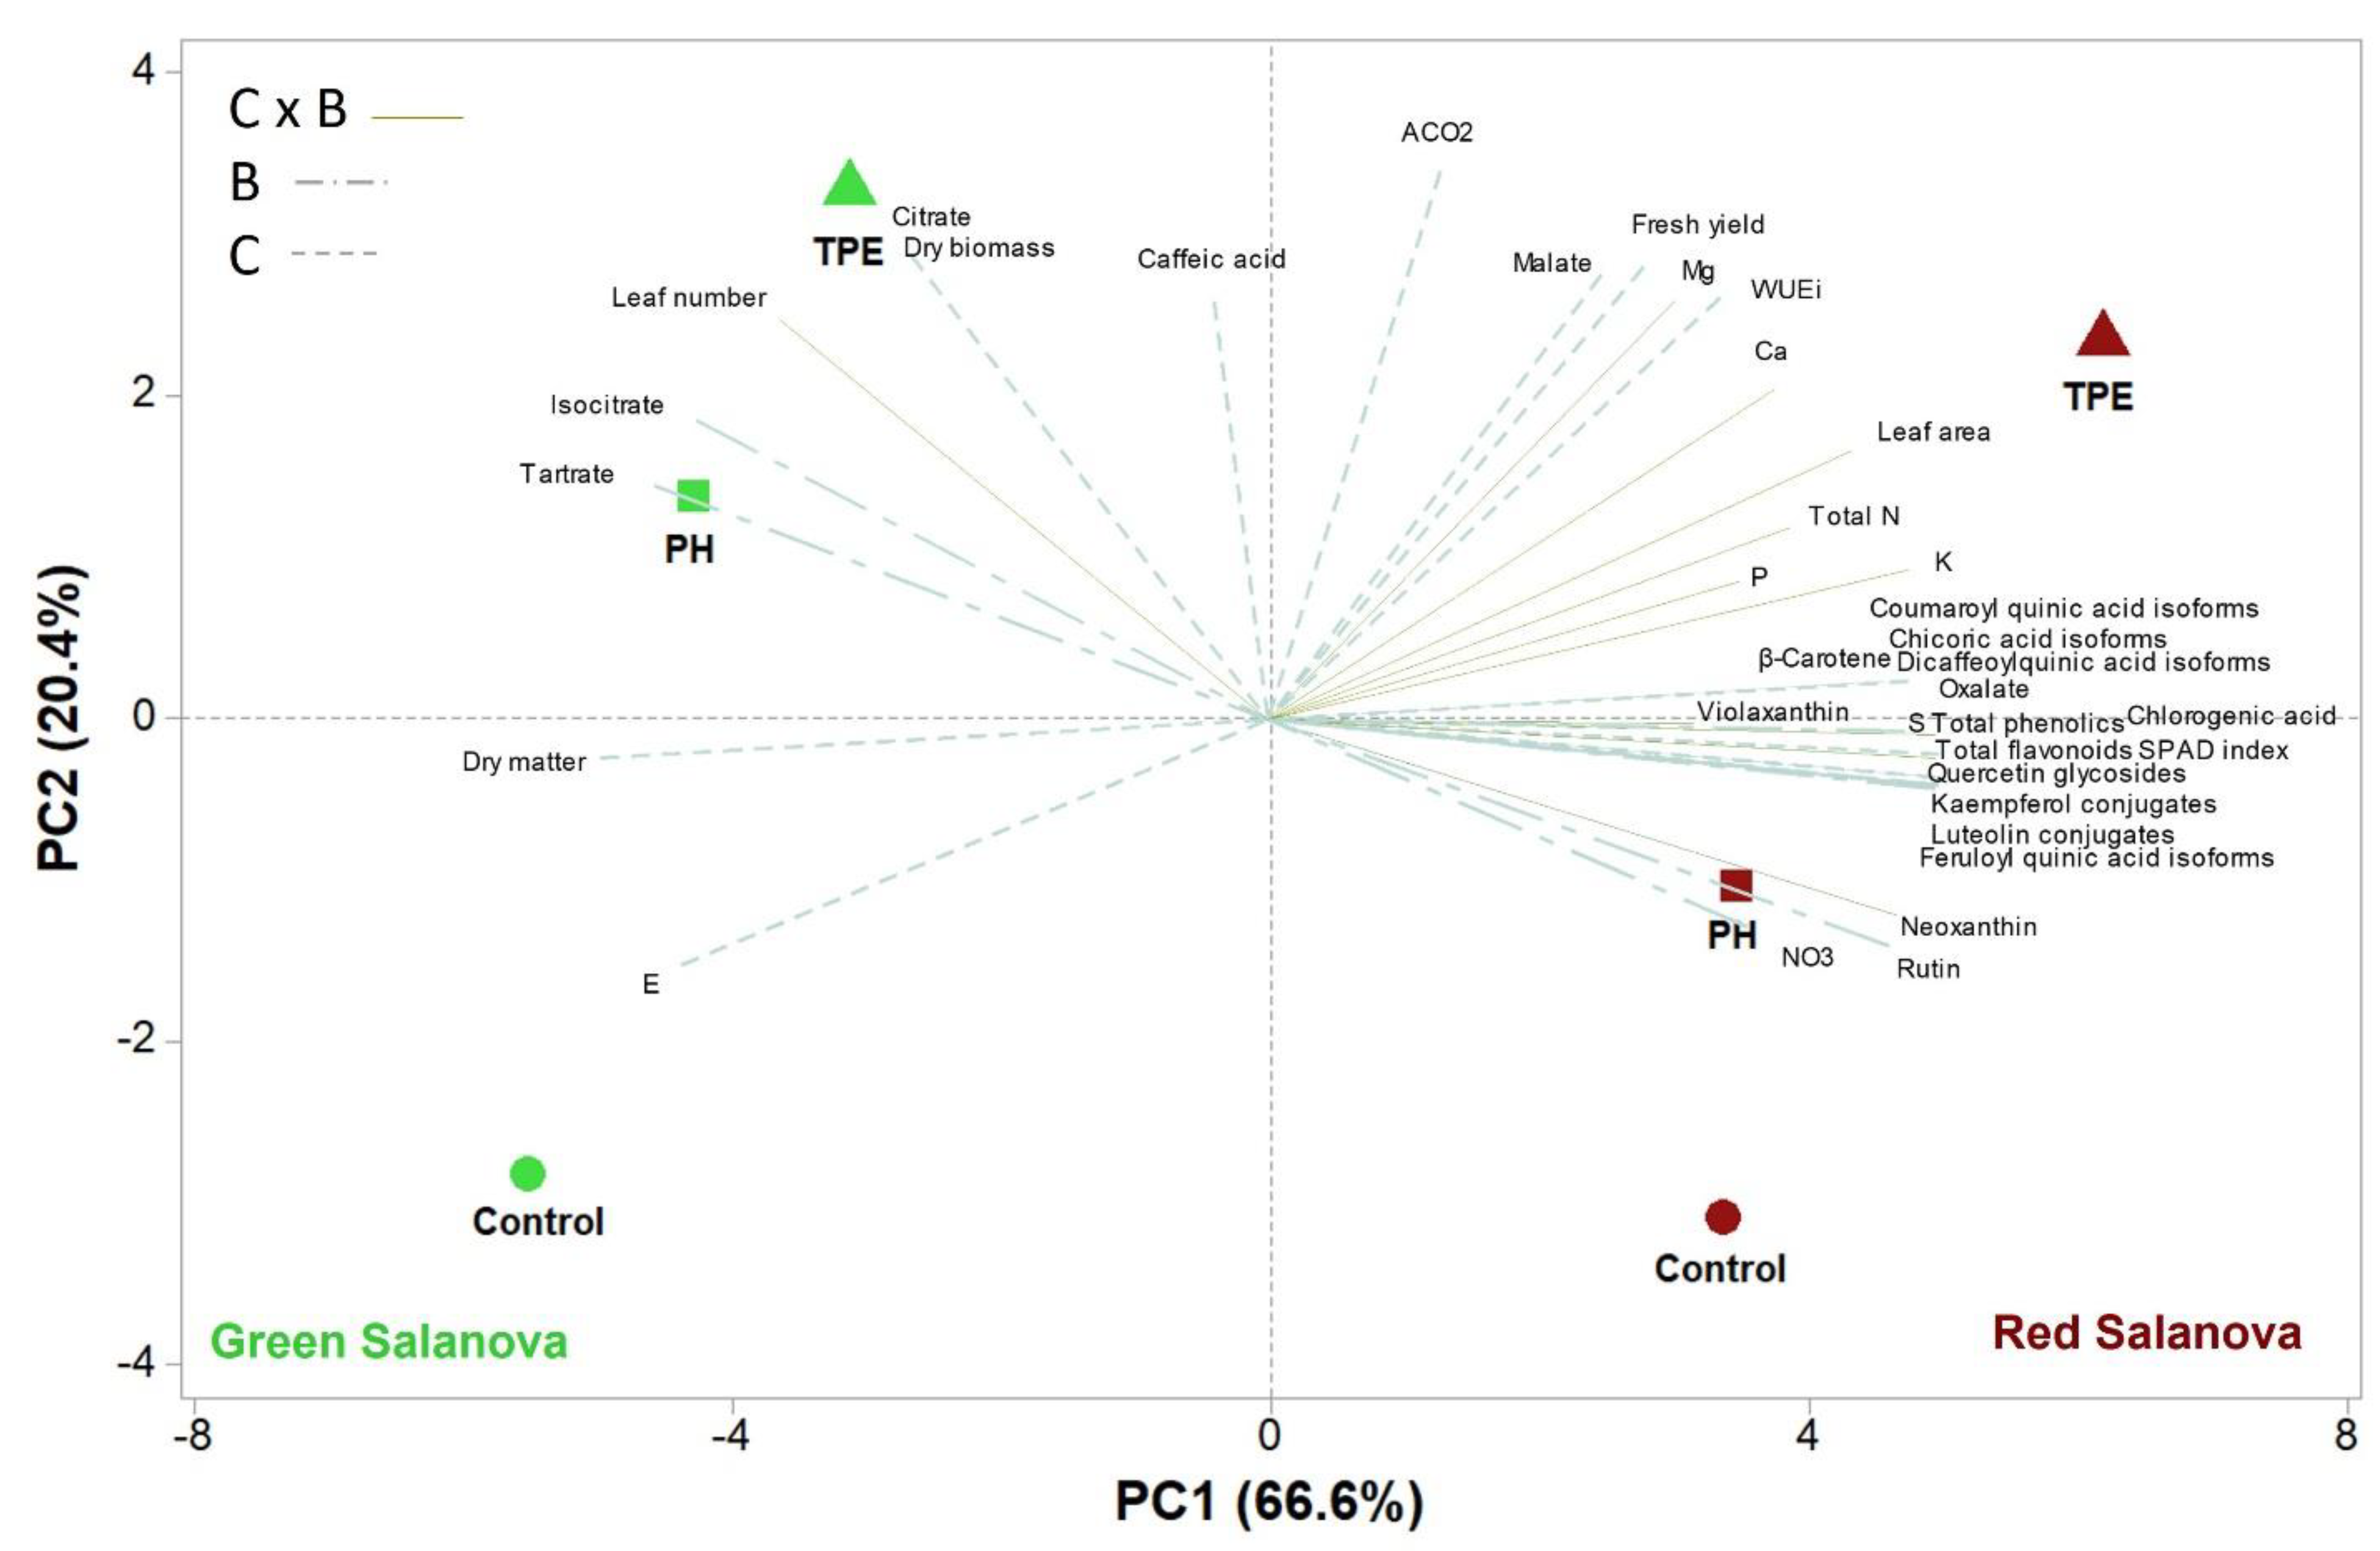
Principal component analysis provided a comprehensive framework for evaluating the two biostimulants’ effects on green and red lettuce cultivar yields and the modulation of primary and secondary metabolism. The two cultivars were clearly separated via the PCA. However, PCA analysis confirmed that several primary and secondary compounds were subjected to cultivar × biostimulant interaction since only green lettuce biostimulant treatments (PH and TPE) were grouped in the same positive quadrant of PC2. The latter verified our previous results indicating that the effects of biostimulant application may differ depending on lettuce cultivar types.

5. Conclusions

Increasing the resource use efficiency and yield, even in sub-optimal conditions, through sustainable agricultural practices is the only way to reduce the environmental and climatic impact on primary production while guaranteeing fair economic returns to farmers. At present, the use of biostimulants appears to be one of the most promising strategies for promoting sustainable agricultural production. This work highlighted that the biostimulant effect was significant in almost all the parameters examined but it was subjected to cultivar × biostimulant interaction. In fact, depending on the cultivar (red versus green pigmented lettuce) and biostimulant type (legume-derived protein hydrolysate versus tropical plant extract), both biostimulants showed significant effects on certain biometric parameters, the mineral profile, organic acids, physiological parameters, and total phenol and flavonoid contents. Biostimulant utilization could allow the bio-enhancement of certain lettuce cultivars with otherwise limited genetic potential for the accumulation of specific compounds that are beneficial for human health.

Author Contributions

Conceptualization, Y.R. and G.C.; methodology, M.G., G.G. and C.E.-N.; software, M.G. and C.E.-N.; validation, M.G., C.E.-N., G.G., I.D.M. and M.M.; formal analysis, M.G., C.E.-N., G.G., I.D.M. and M.M.; investigation, M.G., C.E.-N., P.C., G.G., I.D.M. and M.M.; resources, Y.R.; data curation, M.G. and C.E.-N.; writing—original draft preparation, M.G., C.E.-N., P.C. and Y.R.; writing—review and editing, M.G., C.E.-N., P.C., G.C., G.G., I.D.M., M.M., M.C.K., Y.R., G.A.S. and L.S.; visualization, M.C.K., G.A.S., and Y.R.; supervision, Y.R.; project administration, Y.R.; funding acquisition, G.A.S. and Y.R. All authors have read and agreed to the published version of the manuscript.

Funding

This research received no external funding.

Institutional Review Board Statement

Not applicable.

Informed Consent Statement

Not applicable.

Data Availability Statement

Not applicable.

Acknowledgments

The authors would like to thank Antonio Pannico, Beniamino Ricardo Gentile, and Anna-Maria Palladino for their technical assistance during the experiment. The authors would like thank Luigi Formisano for formatting the manuscript.

Conflicts of Interest

The authors declare no conflict of interest.

References

  1. Sabatino, L.; Iapichino, G.; Consentino, B.B.; D’Anna, F.; Rouphael, Y. Rootstock and arbuscular mycorrhiza combinatorial effects on eggplant crop performance and fruit quality under greenhouse conditions. Agronomy 2020, 10, 693. [Google Scholar] [CrossRef]
  2. Rouphael, Y.; Colla, G. Biostimulants in agriculture. Front. Plant Sci. 2020, 11, 1–7. [Google Scholar] [CrossRef] [PubMed] [Green Version]
  3. Bell, J.; Paula, L.; Dodd, T.; Németh, S.; Nanou, C.; Mega, V.; Campos, P. EU ambition to build the world’s leading bioeconomy—Uncertain times demand innovative and sustainable solutions. New Biotechnol. 2018, 40, 25–30. [Google Scholar] [CrossRef] [PubMed]
  4. Colla, G.; Rouphael, Y.; Canaguier, R.; Svecova, E.; Cardarelli, M. Biostimulant action of a plant-derived protein hydrolysate produced through enzymatic hydrolysis. Front. Plant Sci. 2014, 5, 448. [Google Scholar] [CrossRef] [Green Version]
  5. Cerdán, M.; Sánchez-Sánchez, A.; Oliver, M.; Juárez, M.; Sánchez-Andreu, J. Effect of foliar and root applications of amino acids on iron uptake by tomato plants. In Proceedings of the IV Balkan Symposium on Vegetables and Potatoes, Plovdiv, Bulgaria, 17 June 2009; pp. 481–488. [Google Scholar]
  6. Lisiecka, J.; Knaflewski, M.; Spizewski, T.; Fraszczak, B.; Kaluzewicz, A.; Krzesinski, W. The effect of animal protein hydrolysate on quantity and quality of strawberry daughter plants cv.‘Elsanta’. Acta Sci. Pol. Hortorum Cultus 2011, 10, 31–40. [Google Scholar]
  7. Moe, L.A. Amino acids in the rhizosphere: From plants to microbes. Am. J. Bot. 2013, 100, 1692–1705. [Google Scholar] [CrossRef]
  8. Rouphael, Y.; Carillo, P.; Cristofano, F.; Cardarelli, M.; Colla, G. Effects of vegetal-versus animal-derived protein hydrolysate on sweet basil morpho-physiological and metabolic traits. Sci. Hortic. 2021, 284, 110123. [Google Scholar] [CrossRef]
  9. Colla, G.; Nardi, S.; Cardarelli, M.; Ertani, A.; Lucini, L.; Canaguier, R.; Rouphael, Y. Protein hydrolysates as biostimulants in horticulture. Sci. Hortic. 2015, 196, 28–38. [Google Scholar] [CrossRef]
  10. Ertani, A.; Schiavon, M.; Muscolo, A.; Nardi, S. Alfalfa plant-derived biostimulant stimulate short-term growth of salt stressed Zea mays L. plants. Plant Soil 2013, 364, 145–158. [Google Scholar] [CrossRef]
  11. Lucini, L.; Rouphael, Y.; Cardarelli, M.; Canaguier, R.; Kumar, P.; Colla, G. The effect of a plant-derived biostimulant on metabolic profiling and crop performance of lettuce grown under saline conditions. Sci. Hortic. 2015, 182, 124–133. [Google Scholar] [CrossRef]
  12. Ertani, A.; Pizzeghello, D.; Francioso, O.; Sambo, P.; Sanchez-Cortes, S.; Nardi, S. Capsicum chinensis L. growth and nutraceutical properties are enhanced by biostimulants in a long-term period: Chemical and metabolomic approaches. Front. Plant Sci. 2014, 5, 375. [Google Scholar] [CrossRef] [PubMed] [Green Version]
  13. Liu, X.-Q.; Lee, K.-S. Effect of mixed amino acids on crop growth. Agric. Sci. 2012, 1, 119–158. [Google Scholar] [CrossRef] [Green Version]
  14. Botta, A. Enhancing plant tolerance to temperature stress with amino acids: An approach to their mode of action. In Proceedings of the I World Congress on the Use of Biostimulants in Agriculture 1009, Strasbourg, France, 20 October 2013; pp. 29–35. [Google Scholar]
  15. Cerdán, M.; Sánchez-Sánchez, A.; Jordá, J.D.; Juárez, M.; Sánchez-Andreu, J. Effect of commercial amino acids on iron nutrition of tomato plants grown under lime-induced iron deficiency. J. Plant Nutr. Soil Sci. 2013, 176, 859–866. [Google Scholar] [CrossRef]
  16. Petrozza, A.; Santaniello, A.; Summerer, S.; Di Tommaso, G.; Di Tommaso, D.; Paparelli, E.; Piaggesi, A.; Perata, P.; Cellini, F. Physiological responses to Megafol® treatments in tomato plants under drought stress: A phenomic and molecular approach. Sci. Hortic. 2014, 174, 185–192. [Google Scholar] [CrossRef]
  17. Food and Agriculture Organization of the United Nations Statistical Data (FAOSTAT). Available online: http://www.fao.org/faostat/en/#data/QC (accessed on 2 May 2021).
  18. Rouphael, Y.; Kyriacou, M.C.; Vitaglione, P.; Giordano, M.; Pannico, A.; Colantuono, A.; De Pascale, S. Genotypic variation in nutritional and antioxidant profile among iceberg lettuce cultivars. Acta Sci. Pol. Hortorum Cultus 2017, 16, 37–45. [Google Scholar] [CrossRef]
  19. Kim, M.J.; Moon, Y.; Tou, J.C.; Mou, B.; Waterland, N.L. Nutritional value, bioactive compounds and health benefits of lettuce (Lactuca sativa L.). J. Food Compos. Anal. 2016, 49, 19–34. [Google Scholar] [CrossRef]
  20. Pepe, G.; Sommella, E.; Manfra, M.; De Nisco, M.; Tenore, G.C.; Scopa, A.; Sofo, A.; Marzocco, S.; Adesso, S.; Novellino, T. Evaluation of anti-inflammatory activity and fast UHPLC–DAD–IT-TOF profiling of polyphenolic compounds extracted from green lettuce (Lactuca sativa L.; var. Maravilla de Verano). Food Chem. 2015, 167, 153–161. [Google Scholar] [CrossRef] [Green Version]
  21. Shahidi, F.; Ambigaipalan, P. Phenolics and polyphenolics in foods, beverages and spices: Antioxidant activity and health effects–A review. J. Funct. Foods 2015, 18, 820–897. [Google Scholar] [CrossRef]
  22. Colla, G.; Hoagland, L.; Ruzzi, M.; Cardarelli, M.; Bonini, P.; Canaguier, R.; Rouphael, Y. Biostimulant action of protein hydrolysates: Unraveling their effects on plant physiology and microbiome. Front. Plant Sci. 2017, 8, 2202. [Google Scholar] [CrossRef] [Green Version]
  23. Bremner, J. Total nitrogen. Methods Soil Anal. Part 2 Chem. Microbiol. Prop. 1965, 9, 1149–1178. [Google Scholar]
  24. Formisano, L.; Ciriello, M.; El-Nakhel, C.; De Pascale, S.; Rouphael, Y. Dataset on the effects of anti-insect nets of different porosity on mineral and organic acids profile of Cucurbita pepo L. fruits and leaves. Data 2021, 6, 50. [Google Scholar] [CrossRef]
  25. Kyriacou, M.C.; El-Nakhel, C.; Graziani, G.; Pannico, A.; Soteriou, G.A.; Giordano, M.; Ritieni, A.; De Pascale, S.; Rouphael, Y. Functional quality in novel food sources: Genotypic variation in the nutritive and phytochemical composition of thirteen microgreens species. Food Chem. 2019, 277, 107–118. [Google Scholar] [CrossRef] [PubMed]
  26. Kim, H.-J.; Fonseca, J.M.; Choi, J.-H.; Kubota, C.; Kwon, D.Y. Salt in irrigation water affects the nutritional and visual properties of romaine lettuce (Lactuca sativa L.). J. Agric. Food Chem. 2008, 56, 3772–3776. [Google Scholar] [CrossRef] [PubMed]
  27. Carillo, P.; Kyratzis, A.; Kyriacou, M.C.; Dell’Aversana, E.; Fusco, G.M.; Corrado, G.; Rouphael, Y. Biostimulatory action of arbuscular mycorrhizal fungi enhances productivity, functional and sensory quality in ‘Piennolo del Vesuvio’Cherry tomato landraces. Agronomy 2020, 10, 911. [Google Scholar] [CrossRef]
  28. Ciarmiello, L.F.; Piccirillo, P.; Carillo, P.; De Luca, A.; Woodrow, P. Determination of the genetic relatedness of fig (Ficus carica L.) accessions using RAPD fingerprint and their agro-morphological characterization. S. Afr. J. Bot. 2015, 97, 40–47. [Google Scholar] [CrossRef]
  29. Mampholo, B.M.; Maboko, M.M.; Soundy, P.; Sivakumar, D. Variety-specific responses of lettuce grown in a gravel-film technique closed hydroponic system to N supply on yield, morphology, phytochemicals, mineral content and safety. J. Integr. Agric. 2018, 17, 2447–2457. [Google Scholar] [CrossRef] [Green Version]
  30. El-Nakhel, C.; Giordano, M.; Pannico, A.; Carillo, P.; Fusco, G.M.; De Pascale, S.; Rouphael, Y. Cultivar-specific performance and qualitative descriptors for butterhead Salanova lettuce produced in closed soilless cultivation as a candidate salad crop for human life support in space. Life 2019, 9, 61. [Google Scholar] [CrossRef] [Green Version]
  31. Rouphael, Y.; Kyriacou, M.C.; Carillo, P.; Pizzolongo, F.; Romano, R.; Sifola, M.I. Chemical eustress elicits tailored responses and enhances the functional quality of novel food Perilla frutescens. Molecules 2019, 24, 185. [Google Scholar] [CrossRef] [Green Version]
  32. Caruso, G.; De Pascale, S.; Cozzolino, E.; Giordano, M.; El-Nakhel, C.; Cuciniello, A.; Cenvinzo, V.; Colla, G.; Rouphael, Y. Protein hydrolysate or plant extract-based biostimulants enhanced yield and quality performances of greenhouse perennial wall rocket grown in different seasons. Plants 2019, 8, 208. [Google Scholar] [CrossRef] [Green Version]
  33. Di Mola, I.; Cozzolino, E.; Ottaiano, L.; Giordano, M.; Rouphael, Y.; Colla, G.; Mori, M. Effect of vegetal-and seaweed extract-based biostimulants on agronomical and leaf quality traits of plastic tunnel-grown baby lettuce under four regimes of nitrogen fertilization. Agronomy 2019, 9, 571. [Google Scholar] [CrossRef] [Green Version]
  34. Rouphael, Y.; Giordano, M.; Cardarelli, M.; Cozzolino, E.; Mori, M.; Kyriacou, M.C.; Bonini, P.; Colla, G. Plant-and seaweed-based extracts increase yield but differentially modulate nutritional quality of greenhouse spinach through biostimulant action. Agronomy 2018, 8, 126. [Google Scholar] [CrossRef] [Green Version]
  35. Xu, C.; Mou, B. Drench application of fish-derived protein hydrolysates affects lettuce growth, chlorophyll content, and gas exchange. Horttechnology 2017, 27, 539–543. [Google Scholar] [CrossRef]
  36. Planques, B.; Colla, G.; Svecová, E.; Cardarelli, M.; Rouphael, Y.; Reynaud, H.; Canaguier, R. Effectiveness of a plant-derived protein hydrolysate to improve crop performances under different growing conditions. In Proceedings of the I World Congress on the Use of Biostimulants in Agriculture 1009, Strasbourg, France, 20 October 2013; pp. 175–179. [Google Scholar]
  37. Rouphael, Y.; Corrado, G.; Colla, G.; De Pascale, S.; Dell’Aversana, E.; D’Amelia, L.I.; Fusco, G.M.; Carillo, P. Biostimulation as a means for optimizing fruit phytochemical content and functional quality of tomato landraces of the San Marzano area. Foods 2021, 10, 926. [Google Scholar] [CrossRef] [PubMed]
  38. European Commission. Regulation No 1882/2006 of 19 December 2006 laying down methods of samplig and analysis for the official control of the levels of nitrates in certain foodstuffs. Off. J. Eur. Union 2006, 364, 25–31. [Google Scholar]
  39. Carillo, P.; Giordano, M.; Raimondi, G.; Napolitano, F.; Di Stasio, E.; Kyriacou, M.C.; Sifola, M.I.; Rouphael, Y. Physiological and nutraceutical quality of green and red pigmented lettuce in response to NaCl concentration in two successive harvests. Agronomy 2020, 10, 1358. [Google Scholar] [CrossRef]
  40. Baglieri, A.; Cadili, V.; Monterumici, C.M.; Gennari, M.; Tabasso, S.; Montoneri, E.; Nardi, S.; Negre, M. Fertilization of bean plants with tomato plants hydrolysates. Effect on biomass production, chlorophyll content and N assimilation. Sci. Hortic. 2014, 176, 194–199. [Google Scholar] [CrossRef]
  41. Calvo, P.; Nelson, L.; Kloepper, J.W. Agricultural uses of plant biostimulants. Plant Soil 2014, 383, 3–41. [Google Scholar] [CrossRef] [Green Version]
  42. Ertani, A.; Cavani, L.; Pizzeghello, D.; Brandellero, E.; Altissimo, A.; Ciavatta, C.; Nardi, S. Biostimulant activity of two protein hydrolyzates in the growth and nitrogen metabolism of maize seedlings. J. Plant Nutr. Soil Sci. 2009, 172, 237–244. [Google Scholar] [CrossRef]
  43. Matsumiya, Y.; Kubo, M. Soybean peptide: Novel plant growth promoting peptide from soybean. Soybean Nutr. 2011, 215–230. [Google Scholar] [CrossRef] [Green Version]
  44. Ertani, A.; Schiavon, M.; Nardi, S. Transcriptome-wide identification of differentially expressed genes in Solanum lycopersicon L. in response to an alfalfa-protein hydrolysate using microarrays. Front. Plant Sci. 2017, 8, 1159. [Google Scholar] [CrossRef] [Green Version]
  45. Loss, S.; Robson, A.; Ritchie, G. Nutrient uptake and organic acid anion metabolism in lupins and peas supplied with nitrate. Ann. Bot. 1994, 74, 69–74. [Google Scholar] [CrossRef] [PubMed]
  46. Ciriello, M.; Formisano, L.; Pannico, A.; El-Nakhel, C.; Fascella, G.; Duri, L.G.; Cristofano, F.; Gentile, B.R.; Giordano, M.; Rouphael, Y. Nutrient Solution Deprivation as a Tool to Improve Hydroponics Sustainability: Yield, Physiological, and Qualitative Response of Lettuce. Agronomy 2021, 11, 1469. [Google Scholar] [CrossRef]
  47. Raddatz, N.; Morales de los Ríos, L.; Lindahl, M.; Quintero, F.J.; Pardo, J.M. Coordinated transport of nitrate, potassium, and sodium. Front. Plant Sci. 2020, 11, 247. [Google Scholar] [CrossRef] [PubMed] [Green Version]
  48. Xu, H.-W.; Ji, X.-M.; He, Z.-H.; Shi, W.-P.; Zhu, G.-H.; Niu, J.-K.; Li, B.-S.; Peng, X.-X. Oxalate accumulation and regulation is independent of glycolate oxidase in rice leaves. J. Exp. Bot. 2006, 57, 1899–1908. [Google Scholar] [CrossRef] [Green Version]
  49. Rouphael, Y.; Carillo, P.; Colla, G.; Fiorentino, N.; Sabatino, L.; El-Nakhel, C.; Giordano, M.; Pannico, A.; Cirillo, V.; Shabani, E. Appraisal of combined applications of Trichoderma virens and a biopolymer-based biostimulant on lettuce agronomical, physiological, and qualitative properties under variable N regimes. Agronomy 2020, 10, 196. [Google Scholar] [CrossRef] [Green Version]
  50. Gould, K.S. Nature’s Swiss army knife: The diverse protective roles of anthocyanins in leaves. J. Biomed. Biotechnol. 2004, 2004, 314. [Google Scholar] [CrossRef] [Green Version]
  51. Tränkner, M.; Tavakol, E.; Jákli, B. Functioning of potassium and magnesium in photosynthesis, photosynthate translocation and photoprotection. Physiol. Plant. 2018, 163, 414–431. [Google Scholar] [CrossRef] [Green Version]
  52. Cakmak, I.; Kirkby, E.A. Role of magnesium in carbon partitioning and alleviating photooxidative damage. Physiol. Plant. 2008, 133, 692–704. [Google Scholar] [CrossRef]
  53. Rouphael, Y.; Cardarelli, M.; Lucini, L.; Rea, E.; Colla, G. Nutrient solution concentration affects growth, mineral composition, phenolic acids, and flavonoids in leaves of artichoke and cardoon. HortScience 2012, 47, 1424–1429. [Google Scholar] [CrossRef] [Green Version]
  54. Kim, D.-E.; Shang, X.; Assefa, A.D.; Keum, Y.-S.; Saini, R.K. Metabolite profiling of green, green/red, and red lettuce cultivars: Variation in health beneficial compounds and antioxidant potential. Food Res. Int. 2018, 105, 361–370. [Google Scholar] [CrossRef]
  55. Llorach, R.; Martínez-Sánchez, A.; Tomás-Barberán, F.A.; Gil, M.I.; Ferreres, F. Characterisation of polyphenols and antioxidant properties of five lettuce varieties and escarole. Food Chem. 2008, 108, 1028–1038. [Google Scholar] [CrossRef] [PubMed]
  56. Alvino, A.; Barbieri, B. Vegetables of Temperate Climates: Leafy Vegetables. In Encyclopedia Food Health; Elsevier: Amsterdam, The Netherlands, 2015; pp. 393–400. [Google Scholar] [CrossRef]
  57. Ertani, A.; Schiavon, M.; Altissimo, A.; Franceschi, C.; Nardi, S. Phenol-containing organic substances stimulate phenylpropanoid metabolism in Zea mays. J. Plant Nutr. Soil Sci. 2011, 174, 496–503. [Google Scholar] [CrossRef]
  58. Schiavon, M.; Pizzeghello, D.; Muscolo, A.; Vaccaro, S.; Francioso, O.; Nardi, S. High molecular size humic substances enhance phenylpropanoid metabolism in maize (Zea mays L.). J. Chem. Ecol. 2010, 36, 662–669. [Google Scholar] [CrossRef] [PubMed]
  59. Boselli, M.; Bahouaoui, M.; Lachhab, N.; Sanzani, S.; Ippolito, A. Vite: Idrolizzati proteici contro lo stress idrico. L’Informatore Agrar. 2015, 22, 39–43. [Google Scholar]
Figure 1. Heat map analysis summing up the responses of the two lettuce cultivars (green and red salanova) to the two biostimulant treatments (PH and TPE). Results were calculated as logarithm base 1.2 (Log1.2) ratio of biostimulant treatments (PH or TPE) to control plants that were not treated with biostimulants. Results are visualized using a false color scale with red indicating an increase and blue a decrease, whereas white squares indicate no differences. *, **, and *** indicate results significant at p < 0.05, 0.01, and 0.001, respectively. PH: Trainer®, TPE: Auxym®.
Agronomy 12 01361 g001
Figure 2. Principal component loading plot and scores of principal component analysis (PCA) of morphological parameters, mineral nutrients, gas exchange data, SPAD index, organic acids, carotenoids, phenolic acids, and flavonoids of the two lettuce cultivars (green and red salanova) treated with PH and TPE biostimulants. Scaled loading vectors are drawn as a yellow-green continuous line for variables that were significantly affected by both the cultivar and the biostimulant treatments (C × B), blue-green dashed large lines and dots for those significantly affected by the biostimulants (B), and blue-green dashed small lines for those significantly affected by the cultivar (only one occurrence). PH: Trainer®, TPE: Auxym®.
Agronomy 12 01361 g002
Table 1. Yield and biometric parameters of red and green salanova lettuce and influence of biostimulant treatments.
Source of VarianceLeaf NumberLeaf AreaFresh YieldDry BiomassDry Matter
(no. Plant−1)(cm2 Plant−1)(g Plant−1)(g Plant−1)(%)
Cultivar (C)
Green Salanova78.26 ± 1.49 2021 ± 41.2 85.65 ± 2.39 6.41 ± 0.11 7.51 ± 0.08
Red Salanova67.07 ± 0.97 2261 ± 55.3 90.39 ± 2.71 5.78 ± 0.13 6.41 ± 0.07
*************
Biostimulant (B)
Control68.56 ± 1.92 2023 ± 61.8 80.65 ± 1.27 c5.79 ± 0.17 b7.19 ± 0.26 a
PH73.39 ± 3.09 2114 ± 38.1 86.64 ± 1.45 b6.00 ± 0.15 b6.95 ± 0.27 b
TPE76.06 ± 2.70 2286 ± 87.1 96.77 ± 2.11 a6.51 ± 0.15 a6.74 ± 0.22 c
***************
C × B
Green Salanova × Control72.56 ± 1.13 b1897 ± 45.9 c79.38 ± 2.46 6.15 ± 0.12 7.75 ± 0.08
Green Salanova × PH80.22 ± 0.11 a2063 ± 64.0 bc83.80 ± 1.01 6.32 ± 0.06 7.54 ± 0.03
Green Salanova × TPE82.00 ± 0.33 a2105 ± 45.5 bc93.77 ± 2.70 6.77 ± 0.17 7.23 ± 0.04
Red Salanova × Control64.56 ± 1.11 d2150 ± 31.4 b81.92 ± 0.67 5.43 ± 0.06 6.63 ± 0.09
Red Salanova × PH66.56 ± 1.06 cd2165 ± 23.9 b89.48 ± 1.16 5.68 ± 0.04 6.35 ± 0.13
Red Salanova × TPE70.11 ± 0.95 b2467 ± 54.9 a99.77 ± 2.46 6.24 ± 0.13 6.25 ± 0.03
**nsnsns
Nonsignificant (ns). * and *** indicate significance at p < 0.05 and 0.001, respectively. Lettuce cultivars means were compared via Student’s t-test. Different letters within each column indicate significant differences according to Tukey’s HSD test (p = 0.05). PH: Trainer®, TPE: Auxym®. All data are expressed as mean ± standard error, n = 3.
Table 2. Mineral content of red and green salanova lettuce and the influence of biostimulant treatments.
Source of VarianceTotal NNO3PKCaMgS
(%)(mg kg−1 FW)(mg g−1 DW)(mg g−1 DW)(mg g−1 DW)(mg g−1 DW)(mg g−1 DW)
Cultivar (C)
Green Salanova3.29 ± 0.06 3323 ± 43.2 1.22 ± 0.03 61.48 ± 1.88 10.66 ± 0.44 3.07 ± 0.13 0.51 ± 0.03
Red Salanova3.63 ± 0.09 3487 ± 48.8 1.32 ± 0.03 75.18 ± 1.37 11.89 ± 0.25 3.30 ± 0.07 0.97 ± 0.02
**************
Biostimulant (B)
Control3.38 ± 0.14 3394 ± 48.0 1.23 ± 0.02 b63.60 ± 4.45 10.35 ± 0.64 2.92 ± 0.16 0.69 ± 0.12
PH3.37 ± 0.04 3453 ± 83.4 1.23 ± 0.06 b69.10 ± 2.13 11.44 ± 0.19 3.15 ± 0.05 0.76 ± 0.11
TPE3.64 ± 0.12 3369 ± 65.2 1.34 ± 0.03 a72.30 ± 3.01 12.04 ± 0.33 3.48 ± 0.04 0.77 ± 0.08
***ns*********ns
C × B
Green Salanova × Control3.07 ± 0.02 d3343 ± 90.4 1.23 ± 0.03 54.24 ± 1.35 d9.15 ± 0.64 b2.62 ± 0.17 b0.43 ± 0.06
Green Salanova × PH3.43 ± 0.02 bc3303 ± 67.2 1.12 ± 0.05 64.54 ± 0.50 c11.38 ± 0.33 a3.17 ± 0.06 a0.52 ± 0.01
Green Salanova × TPE3.39 ± 0.06 c3322 ± 96.2 1.30 ± 0.01 65.66 ± 0.80 bc11.45 ± 0.36 a3.42 ± 0.05 a0.58 ± 0.01
Red Salanova × Control3.68 ± 0.10 ab3445 ± 28.1 1.23 ± 0.04 72.95 ± 3.09 ab11.55 ± 0.44 a3.22 ± 0.07 a0.95 ± 0.02
Red Salanova × PH3.31 ± 0.06 cd3602 ± 88.9 1.34 ± 0.03 73.66 ± 1.33 a11.50 ± 0.25 a3.14 ± 0.08 a1.01 ± 0.03
Red Salanova × TPE3.89 ± 0.07 a3416 ± 99.1 1.39 ± 0.05 78.94 ± 0.80 a12.63 ± 0.27 a3.55 ± 0.04 a0.95 ± 0.03
***nsns***ns
Nonsignificant (ns). *, **, and *** indicate significance at p < 0.05 and 0.001, and 0.001, respectively. Lettuce cultivars’ means were compared via Student’s t-test. Different letters within each column indicate significant differences according to Tukey’s HSD test (p = 0.05). PH: Trainer®, TPE: Auxym®. All data are expressed as mean ± standard error, n = 3.
Table 3. Organic acids of red and green salanova lettuce and the influence of biostimulant treatments.
Source of VarianceMalateTartrateOxalateCitrateIsocitrate
(mg g−1 DW)(mg g−1 DW)(mg g−1 DW)(mg g−1 DW)(mg g−1 DW)
Cultivar (C)
Green Salanova41.72 ± 1.60 6.94 ± 0.26 2.51 ± 0.08 14.68 ± 0.36 0.54 ± 0.02
Red Salanova43.98 ± 1.19 3.83 ± 0.22 3.31 ± 0.13 12.64 ± 0.49 0.39 ± 0.02
ns************
Biostimulant (B)
Control38.76 ± 1.38 c4.87 ± 0.60 2.87 ± 0.28 12.49 ± 0.58 b0.42 ± 0.04
PH42.76 ± 1.17 b5.79 ± 0.80 2.84 ± 0.12 13.82 ± 0.77 a0.49 ± 0.04
TPE47.04 ± 0.45 a5.48 ± 0.80 3.02 ± 0.23 14.66 ± 0.31 a0.48 ± 0.03
***nsns**ns
C × B
Green Salanova × Control37.20 ± 1.58 6.15 ± 0.18 2.30 ± 0.16 13.55 ± 0.29 0.50 ± 0.04
Green Salanova × PH40.58 ± 1.05 7.48 ± 0.23 2.69 ± 0.05 15.38 ± 0.50 0.57 ± 0.03
Green Salanova × TPE47.39 ± 0.38 7.17 ± 0.48 2.55 ± 0.07 15.10 ± 0.49 0.55 ± 0.03
Red Salanova × Control40.33 ± 2.13 3.59 ± 0.31 3.44 ± 0.20 11.44 ± 0.70 0.34 ± 0.02
Red Salanova × PH44.94 ± 1.00 4.10 ± 0.57 2.99 ± 0.21 12.25 ± 0.52 0.41 ± 0.03
Red Salanova × TPE46.69 ± 0.86 3.79 ± 0.35 3.48 ± 0.19 14.22 ± 0.23 0.41 ± 0.01
nsnsnsnsns
Nonsignificant (ns). ** and *** indicate significance at p < 0.01 and 0.001, respectively. Lettuce cultivars means were compared via Student’s t-test. Different letters within each column indicate significant differences according to Tukey’s HSD test (p = 0.05). PH: Trainer®, TPE: Auxym®. All data are expressed as mean ± standard error, n = 3.
Table 4. Physiological parameters of red and green salanova lettuce and the influence of biostimulant treatments.
Source of VarianceSPAD IndexACO2EWUEi
(μmol CO2 m−2 s−1)(mol H2O m−2 s−1)(μmol CO2 mol−1 H2O)
Cultivar (C)
Green Salanova36.43 ± 0.40 10.09 ± 0.42 5.69 ± 0.21 1.81 ± 0.13
Red Salanova48.72 ± 0.24 10.15 ± 0.35 4.72 ± 0.14 2.18 ± 0.14
***ns******
Biostimulant (B)
Control41.60 ± 2.81 c8.82 ± 0.13 c5.61 ± 0.32 a1.60 ± 0.10 c
PH42.50 ± 2.84 b10.29 ± 0.18 b5.40 ± 0.19 a1.92 ± 0.08 b
TPE43.63 ± 2.61 a11.25 ± 0.26 a4.61 ± 0.20 b2.46 ± 0.12 a
************
C × B
Green Salanova × Control35.33 ± 0.23 8.70 ± 0.24 6.30 ± 0.18 1.38 ± 0.06
Green Salanova × PH36.17 ± 0.43 10.29 ± 0.26 5.80 ± 0.10 1.77 ± 0.05
Green Salanova × TPE37.80 ± 0.31 11.29 ± 0.52 4.97 ± 0.14 2.27 ± 0.06
Red Salanova × Control47.87 ± 0.19 8.94 ± 0.13 4.93 ± 0.07 1.82 ± 0.05
Red Salanova × PH48.83 ± 0.07 10.29 ± 0.31 5.00 ± 0.06 2.06 ± 0.09
Red Salanova × TPE49.47 ± 0.09 11.20 ± 0.26 4.25 ± 0.23 2.65 ± 0.16
nsnsnsns
Nonsignificant (ns). *** indicates significance at p < 0.001. Lettuce cultivars means were compared via Student’s t-test. Different letters within each column indicate significant differences according to Tukey’s HSD test (p = 0.05). PH: Trainer®, TPE: Auxym®. All data are expressed as mean ± standard error, n = 3. ACO2: assimilation rate, E: transpiration, and WUEi: intrinsic water use efficiency.
Table 5. Phenolic acid contents of red and green salanova lettuce and the influence of biostimulant treatments.
Source of VarianceChicoric Acid Isomer 1Chicoric Acid Isomer 2Chlorogenic AcidCaffeic AcidCoumaroylquinic Acid Isomer 1Coumaroylquinic Acid Isomer 2Feruloylquinic Acid Isomer 1Feruloylquinic Acid Isomer 2Dicaffeoylquinic Acid Isomer 1Dicaffeoylquinic Acid Isomer 2Total Phenolic Acids
(µg g−1 DW)(µg g−1 DW)(µg g−1 DW)(µg g−1 DW)(µg g−1 DW)(µg g−1 DW)(µg g−1 DW)(µg g−1 DW)(µg g−1 DW)(µg g−1 DW)(µg g−1 DW)
Cultivar (C)
Green Salanova0.59 ± 0.01 0.52 ± 0.01 488.3 ± 41.7 9.75 ± 0.92 84.87 ± 9.26 55.64 ± 3.11 1.87 ± 0.11 1.19 ± 0.09 168.8 ± 27.9 6.72 ± 1.34 818.3 ± 73.4
Red Salanova0.95 ± 0.05 0.65 ± 0.02 2336 ± 101 8.77 ± 0.89 166.3 ± 11.3 81.13 ± 4.55 5.49 ± 0.34 3.36 ± 0.24 591.8 ± 51.8 43.47 ± 3.72 3238 ± 157
*********ns*********************
Biostimulant (B)
Control0.74 ± 0.07 0.58 ± 0.02 1163 ± 370 6.42 ± 0.67 b98.87 ± 18.5 62.65 ± 5.80 3.78 ± 0.97 1.99 ± 0.48 b270.8 ± 76.3 21.29 ± 8.33 1630 ± 470
PH0.75 ± 0.09 0.58 ± 0.03 1486 ± 407 11.38 ± 0.83 a144.3 ± 12.2 75.87 ± 7.69 3.45 ± 0.62 2.20 ± 0.38 ab431.3 ± 70.8 27.15 ± 7.76 2183 ± 501
TPE0.82 ± 0.11 0.61 ± 0.04 1587 ± 468 9.99 ± 0.56 a133.6 ± 28.1 66.62 ± 7.68 3.82 ± 0.95 2.63 ± 0.67 a438.9 ± 144 26.83 ± 10.3 2271 ± 656
nsns********nsnsns***ns***
C × B
Green Salanova × Control0.59 ± 0.04 0.53 ± 0.02 341.1 ± 39.1 c7.15 ± 0.94 63.77 ± 9.39 d51.59 ± 4.08 1.69 ± 0.21 0.98 ± 0.11 109.7 ± 8.11 e4.42 ± 1.55 581.6 ± 46.5 e
Green Salanova × PH0.59 ± 0.03 0.53 ± 0.01 581.3 ± 44.2 c12.58 ± 1.01 119.5 ± 0.32 bc61.97 ± 4.09 2.16 ± 0.15 1.42 ± 0.13 275.9 ± 25.7 cd11.07 ± 2.19 1067 ± 43.4 d
Green Salanova × TPE0.58 ± 0.02 0.52 ± 0.01 542.5 ± 27.8 c9.53 ± 0.90 71.31 ± 5.05 cd53.35 ± 7.18 1.78 ± 0.15 1.18 ± 0.17 120.8 ± 3.10 de4.66 ± 0.44 806.1 ± 39.1 de
Red Salanova × Control0.89 ± 0.04 0.63 ± 0.01 1985 ± 86.4 b5.68 ± 0.92 134.0 ± 19.9 b73.71 ± 5.43 5.86 ± 0.58 3.00 ± 0.34 431.8 ± 55.9 bc38.16 ± 7.74 2679 ± 40.3 c
Red Salanova × PH0.91 ± 0.12 0.64 ± 0.04 2392 ± 72.8 a10.19 ± 1.00 169.0 ± 11.4 a89.77 ± 9.27 4.73 ± 0.51 2.99 ± 0.32 586.7 ± 17.0 b43.24 ± 6.14 3300 ± 96.0 b
Red Salanova × TPE1.06 ± 0.01 0.69 ± 0.01 2632 ± 46.8 a10.45 ± 0.76 195.9 ± 7.31 a79.89 ± 8.20 5.87 ± 0.58 4.08 ± 0.32 757.1 ± 48.2 a49.00 ± 6.28 3736 ± 59.0 a
nsns**ns*nsnsns***ns***
Nonsignificant (ns). *, **, and *** indicate significance at p < 0.05, 0.01, and 0.001, respectively. Lettuce cultivars means were compared via Student’s t-test. Different letters within each column indicate significant differences according to Tukey’s HSD test (p = 0.05). PH: Trainer®, TPE: Auxym®. All data are expressed as mean ± standard error, n = 3.
Table 6. Flavonoid contents of red and green salanova lettuce and the influence of biostimulant treatments.
Source of VarianceQuercetin-3-O-GalactosideQuercetin-3-O-GlucuronideQuercetin-3-O-GlucosideLuteolin-3-O-RutinosideLuteolin-7-O-GlucosideLuteolin-7-O-Malonyl-GlucosideKaempferol-3-O-GlucosideKaempferol-3-O-RutinosideRutinTotal Flavonoids
(µg g−1 DW)(µg g−1 DW)(µg g−1 DW)(µg g−1 DW)(µg g−1 DW)(µg g−1 DW)(µg g−1 DW)(µg g−1 DW)(µg g−1 DW)(µg g−1 DW)
Cultivar (C)
Green Salanova6.96 ± 1.11 47.10 ± 5.71 1.72 ± 0.16 0.27 ± 0.02 1.97 ± 0.16 2.05 ± 0.13 0.06 ± 0.01 0.19 ± 0.02 0.29 ± 0.02 60.60 ± 5.85
Red Salanova55.75 ± 4.79 399.6 ± 20.1 296.5 ± 19.4 2.59 ± 0.18 30.52 ± 1.36 45.26 ± 3.76 6.75 ± 0.64 0.26 ± 0.03 0.49 ± 0.02 837.8 ± 43.2
*********************ns******
Biostimulant (B)
Control25.87 ± 8.80 178.2 ± 66.4 121.6 ± 53.8 1.21 ± 0.45 14.74 ± 5.66 19.13 ± 8.21 2.57 ± 1.20 b0.20 ± 0.02 0.42 ± 0.04 364.0 ± 143
PH32.61 ± 11.8 254.5 ± 84.2 140.6 ± 61.9 1.55 ± 0.57 16.18 ± 6.31 23.27 ± 9.44 3.51 ± 1.54 ab0.25 ± 0.04 0.37 ± 0.05 472.8 ± 175
TPE35.58 ± 13.8 237.4 ± 86.9 185.1 ± 82.3 1.52 ± 0.59 17.81 ± 7.35 28.55 ± 12.19 4.14 ± 1.91 a0.21 ± 0.04 0.39 ± 0.05 510.7 ± 204
ns******nsnsnsnsnsns***
C × B
Green Salanova × Control8.26 ± 2.03 29.83 ± 3.45 c1.67 ± 0.15 d0.28 ± 0.03 2.16 ± 0.37 2.16 ± 0.24 0.04 ± 0.01 0.17 ± 0.01 0.34 ± 0.02 44.91 ± 0.70 d
Green Salanova × PH7.01 ± 2.22 67.35 ± 4.35 c2.13 ± 0.33 d0.30 ± 0.01 2.11 ± 0.08 2.21 ± 0.18 0.09 ± 0.01 0.25 ± 0.03 0.27 ± 0.02 81.71 ± 6.76 d
Green Salanova × TPE5.60 ± 1.97 44.11 ± 1.35 c1.37 ± 0.12 d0.22 ± 0.03 1.63 ± 0.29 1.79 ± 0.27 0.04 ± 0.01 0.14 ± 0.01 0.28 ± 0.04 55.17 ± 1.83 d
Red Salanova × Control43.47 ± 8.55 326.6 ± 5.88 b241.6 ± 9.74 c2.13 ± 0.38 27.32 ± 1.33 36.11 ± 6.96 5.09 ± 0.93 0.23 ± 0.02 0.51 ± 0.04 683.1 ± 32.5 c
Red Salanova × PH58.21 ± 5.55 441.6 ± 19.7 a279.1 ± 3.18 b2.80 ± 0.22 30.24 ± 1.21 44.34 ± 1.21 6.93 ± 0.38 0.26 ± 0.09 0.46 ± 0.04 864.0 ± 16.4 b
Red Salanova × TPE65.56 ± 6.75 430.6 ± 19.6 a368.9 ± 10.8 a2.82 ± 0.25 34.00 ± 2.81 55.32 ± 5.16 8.24 ± 1.22 0.29 ± 0.04 0.49 ± 0.04 966.2 ± 23.1 a
ns*****nsnsnsnsnsns***
Nonsignificant (ns). ** and *** indicate significance at p < 0.01 and 0.001, respectively. Lettuce cultivars means were compared via Student’s t-test. Different letters within each column indicate significant differences according to Tukey’s HSD test (p = 0.05). PH: Trainer®, TPE: Auxym®. All data are expressed as mean ± standard error, n = 3.
Table 7. Carotenoid content of red and green salanova lettuce and the influence of biostimulant treatments.
Source of VarianceNeoxanthinViolaxanthinβ-Carotene
(µg g−1 DW)(µg g−1 DW)(µg g−1 DW)
Cultivar (C)
Green Salanova17.16 ± 1.98 151.8 ± 18.5 337.9 ± 23.1
Red Salanova61.78 ± 3.11 223.4 ± 30.7 489.9 ± 55.2
*********
Biostimulant (B)
Control46.50 ± 9.91 223.9 ± 40.0 469.4 ± 60.0
PH32.02 ± 8.43 102.5 ± 4.34 269.5 ± 21.1
TPE39.89 ± 11.9 236.4 ± 6.91 502.8 ± 40.4
*********
C × B
Green Salanova × Control24.59 ± 1.87 c134.6 ± 3.21 d336.8 ± 5.10 bc
Green Salanova × PH13.39 ± 1.35 d98.28 ± 1.38 e262.0 ± 22.0 c
Green Salanova × TPE13.51 ± 0.57 d222.5 ± 6.13 c414.9 ± 5.25 b
Red Salanova × Control68.41 ± 2.72 a313.2 ± 3.28 a602.1 ± 19.0 a
Red Salanova × PH50.66 ± 2.47 b106.8 ± 8.60 e277.0 ± 41.1 c
Red Salanova × TPE66.27 ± 2.93 a250.2 ± 2.94 b590.7 ± 20.4 a
*******
* and *** indicate significance at p < 0.05 and 0.001, respectively. Lettuce cultivars means were compared via Student’s t-test. Different letters within each column indicate significant differences according to Tukey’s HSD test (p = 0.05). PH: Trainer®, TPE: Auxym®. All data are expressed as mean ± standard error, n = 3.
Publisher’s Note: MDPI stays neutral with regard to jurisdictional claims in published maps and institutional affiliations.

