
Spatiotemporal Changes in the Geographic Imbalances between Crop Production and Farmland-Water Resources in China


1
Key Laboratory of Land Surface Pattern and Simulation, Institute of Geographic Sciences and Natural Resources Research, Chinese Academy of Sciences, Beijing 100101, China
2
University of Chinese Academy of Sciences, Beijing 100049, China
*
Author to whom correspondence should be addressed.
Agronomy 2022, 12(5), 1111; https://doi.org/10.3390/agronomy12051111
Submission received: 26 March 2022
/
Revised: 28 April 2022
/
Accepted: 29 April 2022
/
Published: 3 May 2022
(This article belongs to the Special Issue Social-Ecologically More Sustainable Agricultural Production)
Abstract
:Agricultural production is constrained by farmland and water resources, especially in China with limited per capita resources. Understanding of the geographic changes between national crop production and resource availability with the spatial shift of crop production has been limited in recent decades. To solve this issue, we quantified the changes in geographic relationships between crop production and farmland-water resources in China from 1990 to 2015 by a spatial imbalance measurement model. Results found a clear spatial concentration trend of crop production in China, which increased the pressure on the limited farmland and water resources in the main production areas. The geographic imbalances between the total production of crops and farmland resources (∑SMI_PF) alleviated slightly, whereas that of water resources (∑SMI_PW) increased by 9.12%. The rice production moved toward the north of the country with less water but abundant farmland resources, which led to a decrease of 1.34% in ∑SMI_PF and an increase of 14.20% in ∑SMI_PW. The shift of wheat production to the south was conducive to alleviating the pressure on water resources, but the production concentration still increased the demand for farmland and water resources, resulting in an increase in ∑SMI_PF and ∑SMI_PW by 39.96% and 10.01%, respectively. Of the five crops, adjustments to the spatial distribution of corn production had the most significant effect on reducing pressure on farmland and water resources and ∑SMI_PF and ∑SMI_PW decreased by 11.23% and 1.43%, respectively. Our results provided a reference for adjustments in crop production distribution and for policy formulation to sustainably utilize farmland and water resources.
1. Introduction
Crops are a product of the intensive utilization of farmland and water resources [1,2,3]. Nowadays, land degradation and water shortages have directly threatened food security and ecosystem health in many countries around the world [4,5,6]. For example, the water resources in some countries, such as Kuwait, Saudi Arabia, and the United Arab Emirates, have been insufficient to meet the needs of agricultural production [7]. In order to mitigate the threat of farmland-water resources to agricultural production, the United Nations (UN) put forward the 2030 Agenda for Sustainable Development in 2015. Specifically, goal 2.4 proposes to improve land and soil quality, goal 6 proposes to ensure availability and sustainable management of water, and goal 12 proposes to ensure sustainable production patterns [8]. In China, cereal production accounts for 21% of total world production, but China controls only 9% of the world’s farmland and 6% of the world’s fresh water [9,10,11]. The contradiction between crop production and farmland-water resources is thus very obvious [12,13]. In addition, the spatial distribution of farmland and water resources in China is unbalanced [14]. Northern China accounts for 60% of the nation’s farmland but only 19% of its water resources [15,16]. The geographic imbalances between farmland and water resources thus greatly limit China’s agricultural development [17]. In recent years, crop production has increased and regional imbalances have become increasingly obvious [18,19,20]. This has gradually intensified the pressures on farmland and water resources in the main crop-producing areas, which now directly threatens China’s food security [21]. Therefore, it is critical to clarify to what extent crop production matches available farmland and water resources, as well as their spatiotemporal variations, in order to formulate food production policies and the sustainable utilization of limited resources.
Between 1960 and 2018, global cereal production increased by a factor of 2.38 due to the increased use of “green revolution” technologies and investment in farmland, water, and other natural resources [9,22]. However, most of the countries with a high demand for crop production are also countries with a shortage of farmland and water resources [23], which leads to the overexploitation of groundwater. In order to meet the demand for agricultural irrigation, some countries had to resort to alternative sources such as desalinated seawater [24]. The demand for increased crop production comes mainly from lower- and middle-income countries, whereas the per capita farmland (usually of low quality) available for crop production is less than half of that in high-income countries [23]. The geographic imbalances between food production and farmland-water resources thus pose a great challenge to global food security and the sustainable development of economies and society in general [25]. In China, with the rapid development and expansion of urbanization and industrialization, the area available for farming is continually decreasing [26,27], whereas crop production is increasing each year [19], which increases pressure on farmland, thereby endangering the stable production of crops [28]. As a consequence, the spatiotemporal changes in crop production further change the degree of geographic imbalances between crop production and available farmland [29]. China’s main crop production area is located in the north of the country where water resources are scarce and cannot support crop production in some areas for extended periods of time [30,31] even requiring cross-regional water diversion to meet increasing demand [32]. For example, groundwater depletion in some areas of the Huang-Huai-Hai Plain in northern China has reached 20–100 mm/a [33]. In addition, with an increasing population and further urban expansion in the years ahead, the demand for farmland and water resources will continue to increase, and crop production will face even greater challenges. If China maintains its current level of food consumption, the increase in population will lead to increases of 6.5% and 7.1% in the demand for farmland and irrigation water by 2032, respectively [34].
Previous studies of the relationship between crop production and farmland-water resources have focused more on the efficiency of the utilization of those resources [35,36,37], the impact of the changes in those resources on food production [38,39], and on resource demand by crop production through the concepts of virtual water and virtual land [40,41,42]. In contrast, these studies cannot quantify the degree of geographic imbalance between crop production evolution and farmland-water resources. Li et al. [29] and Chai et al. [43] analyzed the geographic imbalances of grain production and farmland resources but that of water resources has not been clarified. The spatial heterogeneity of water resources is obvious in China and ignoring the matching degree between crop production and water resources will cause environmental problems. In addition, most previous studies have examined crop production as a whole [44], whereas studies of how different types of crops are matched with available farmland and water resources are still rare. Different crops have different growing habits [45,46,47] and their spatial distributions in the main production areas are, therefore, also quite different leading to different geographic imbalances with farmland and water resources. These differences are often ignored in the overall study of total crop production, which means that the results of those studies cannot provide a sound basis for effective decision making in relation to crop production. Therefore, it would be of great theoretical and practical significance to identify the geographic imbalances between the production of different types of crops and farmland-water resources in order to reveal the possible prospects for crop production and promote the sustainable development of agriculture.
As a large and populous country, China’s crop production is very important to the world’s food security and economic development. With this in mind, this study selected the Chinese mainland as the study area and carried out the following analyses: (1) the spatiotemporal changes in five kinds of crop production at the county scale between 1990 and 2015 were identified; and (2) the geographic imbalances between those five kinds of crop production and farmland-water resources were analyzed. Our study aimed to provide a reference for adjustments in food production and distribution and for the formulation of policies for protecting farmland and water resources.
2. Materials and Methods
2.1. Study Area
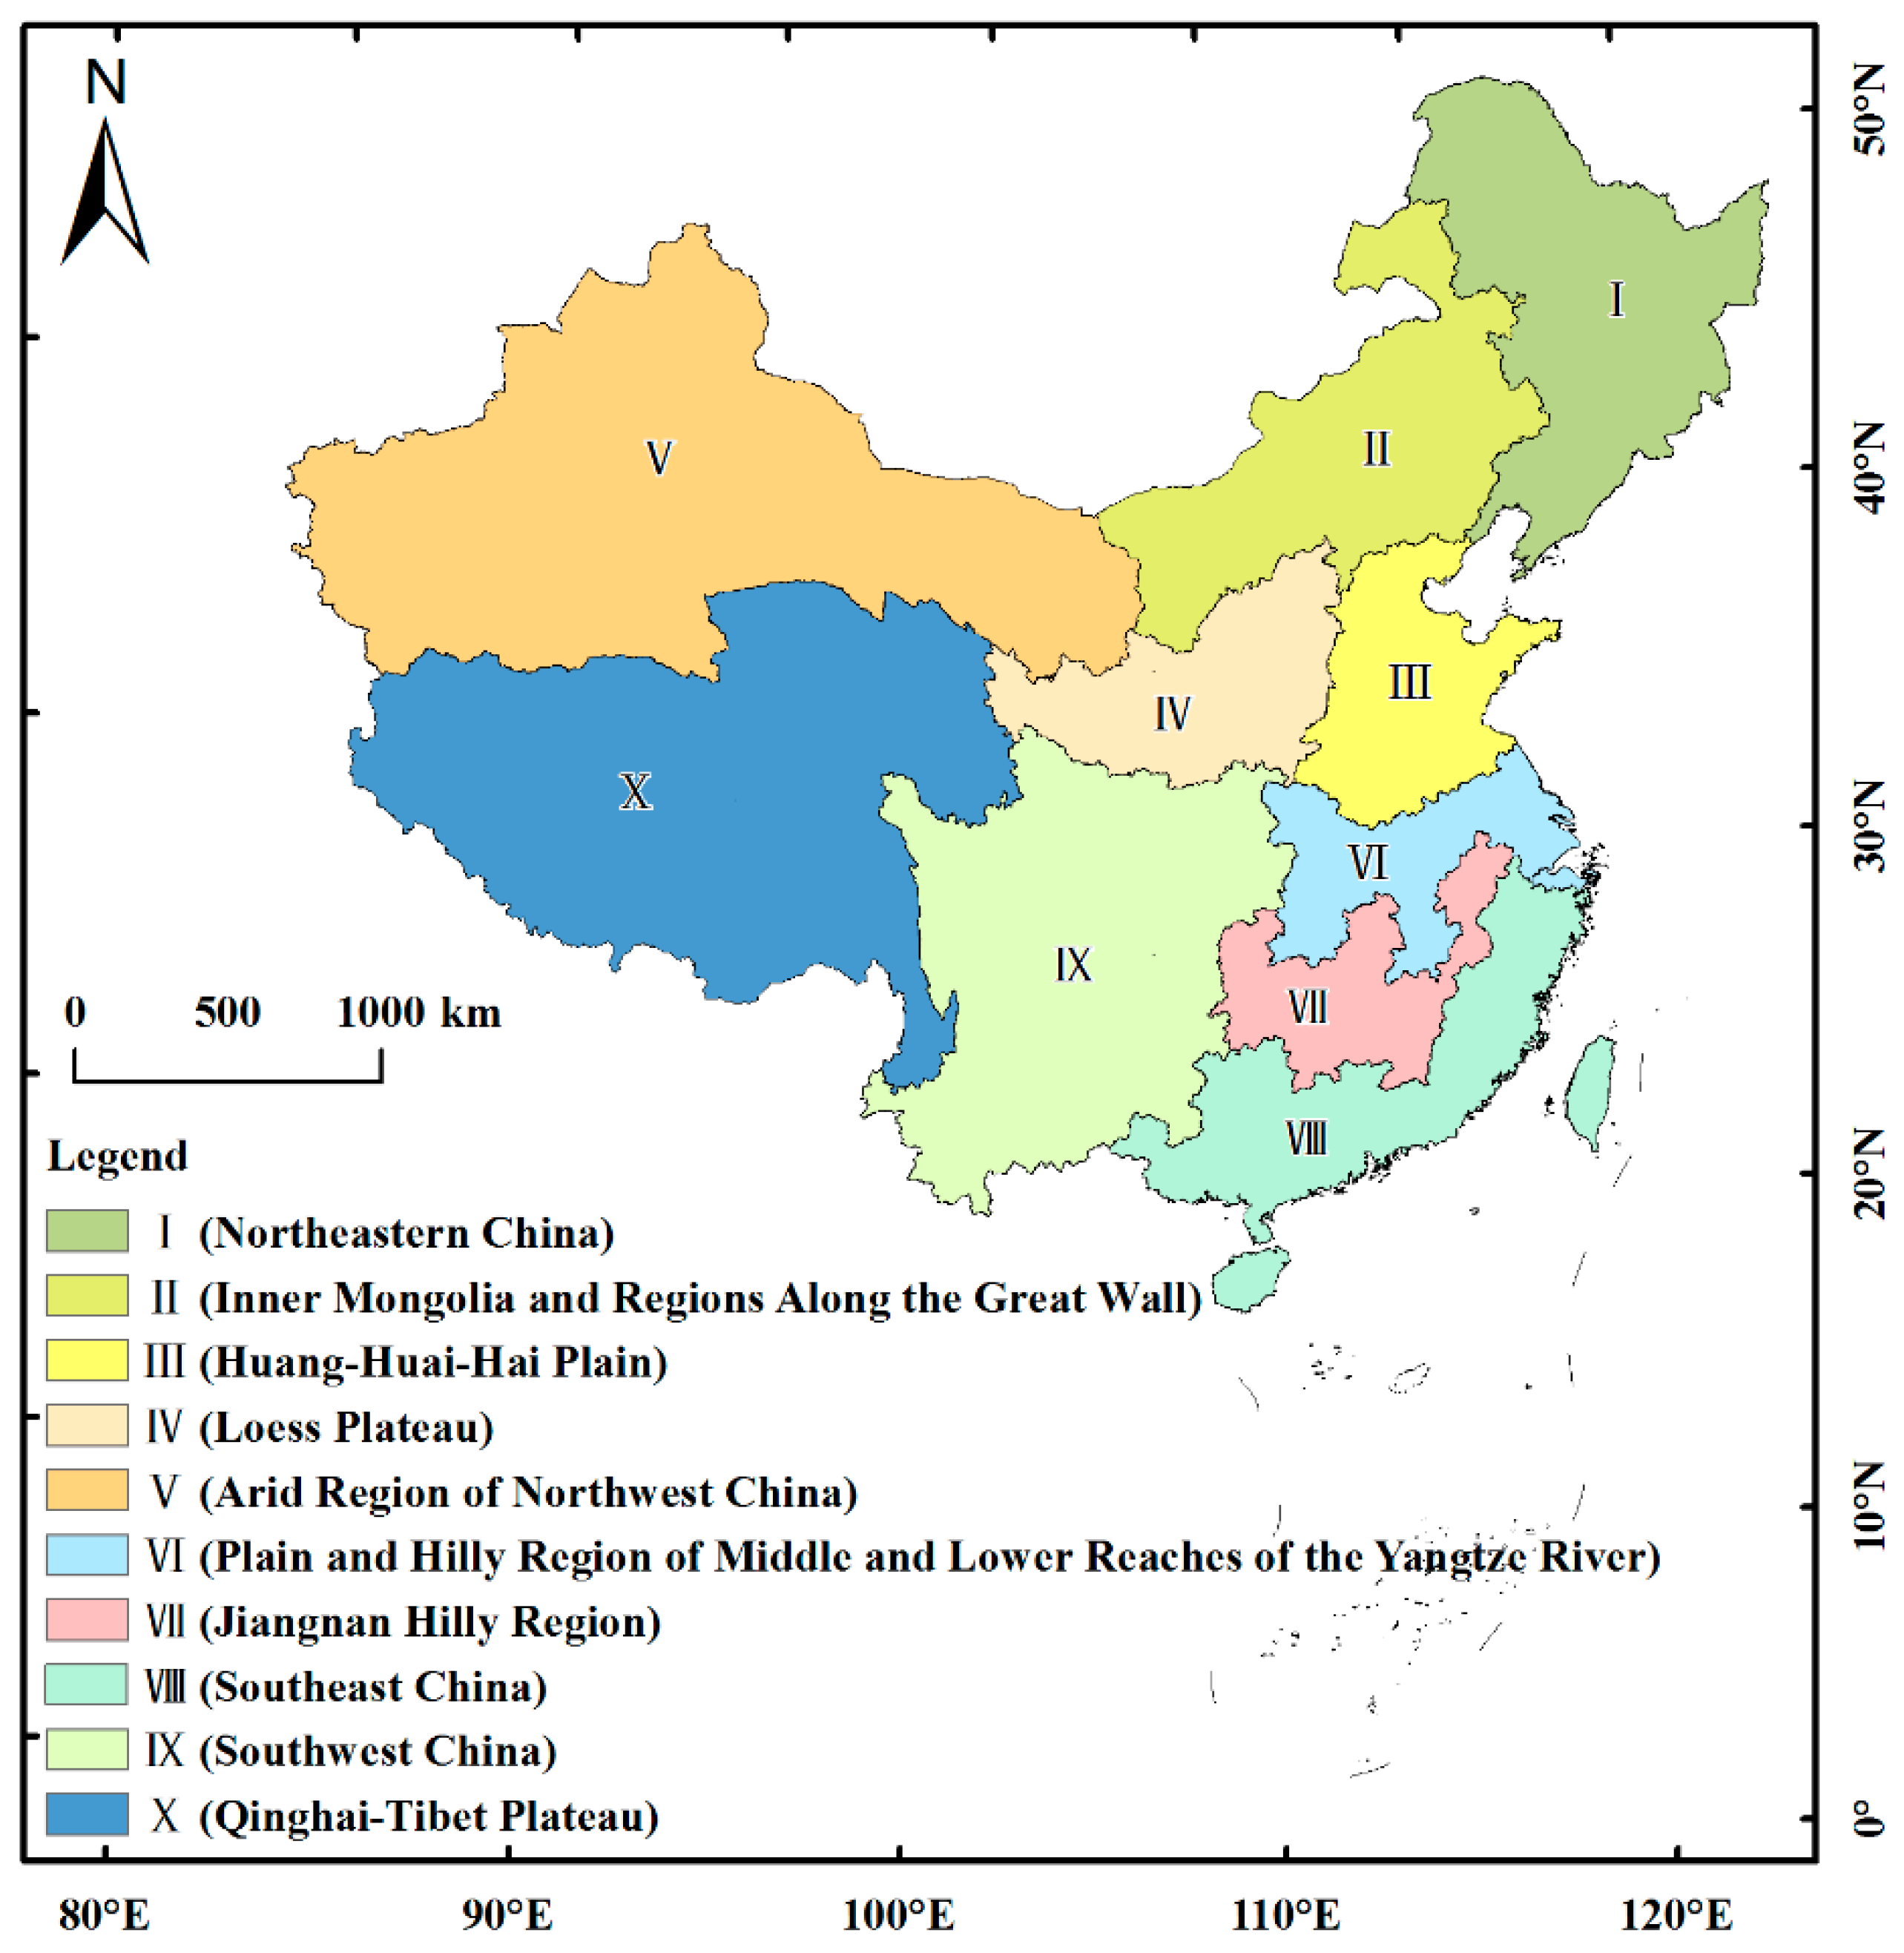
The study area chosen was the Chinese mainland. Rice, wheat, corn, soybean, and tubers are the main crops. Most regions of China experience rainfall in the hot season, which provides good conditions for growth. The annual total hours of sunshine increase from southeast to northwest across the country and both the frost-free period and the average temperature of ≥10 °C increase from north to south. The spatial distribution of precipitation is therefore very different in different regions of the country. Specifically, southern China, where the climate is humid and water is abundant, produces mainly rice with a high demand for water; northern China, where the rainy season is short and concentrated mainly in summer, produces corn, wheat, soybeans, etc. Referring to a previous study [48], combined with multisource information such as geographical location, natural resource endowment, agricultural production conditions, ecological environment safety, etc., the study area was divided into ten subregions, as shown in Figure 1.
2.2. Data Collection and Processing
For this study, statistical data at the county scale for the period 1990–2015 were used. Data for the yields of rice, wheat, corn, soybean, tubers, and for the areas of available farmland were obtained from the Ministry of Agriculture and Rural Affairs of the People’s Republic of China. Data for water resources were taken from the China Statistical Yearbook and the Water Resources Bulletin for each of China’s provinces and for parts of cities. The amount of water resources at the county scale was calculated from the county-scale population and the per capita water resources of the city where it is located. The amount of water resources here refers to the total amount of surface and underground water produced by local precipitation, representing the stock of available water resources, which is used to reflect the abundance of regional water resources. To eliminate the effects of administrative division adjustments on the results, based on the county administrative divisions of China in 2015, the data for 1990 were revised. In addition, we merged some municipal districts, to give, finally, 2367 county-level units.
2.3. Research Methods
2.3.1. Concentration Ratio of Crop Production (CRCP)
CRCP is the ratio of the crop production of each county to the total crop production of the whole country. It is given by Equation (1).
where is the CRCP of crop j and is the yield of crop j in the ith county.
2.3.2. Spatial Gravity Center Model
The spatial gravity center model originated from the field of physics and has been widely used in studies of crop production [16]. Since the CRCP of different crops experienced significant changes between 1990 and 2015, the gravity center model was used to analyze the direction and distance of the gravity center deviation of those crops. The method of calculation is as follows.
where (xj, yj) are the barycentric coordinates of crop j and (xi, yi) are the coordinates of the geological center of county i.
where is the distance of the gravity center deviation of crop j, and (xt1, yt1) and (xt2, yt2) are the barycenter coordinates in 1990 and 2015, respectively.
2.3.3. Geographic Imbalances Analysis
Referring to previous studies [25], the spatial mismatch index (SMI) was used to analyze the geographic imbalances between farmland and water resources, between crop production and farmland, and between crop production and water resources. The various SMIs can be obtained from the following formulas.
where is the geographic imbalance between the farmland and water resources of county i; is the area of farmland in county i; and is the total volume of water resources of county i. The larger the absolute value of , the higher the degree of geographic imbalance.
where is the geographic imbalance between crop j’s production and the area of farmland in county i; is the geographic imbalance between crop j’s production and the volume of water resources in county i; has the same meaning as in Equation (1); and have the same meanings as in Equation (5); and () is the degree of total geographic imbalance between crop production and farmland area (water resources) of crop j in China or a subregion. The larger the values of () and (), the higher the degree of geographic imbalance. In addition, Jenks Natural Breaks Classification was used to judge whether crop production and farmland (water resources) were balanced.
3. Results
3.1. Spatial Distribution of and Spatiotemporal Changes in Crop Production
3.1.1. Spatial Distribution of Crop Production
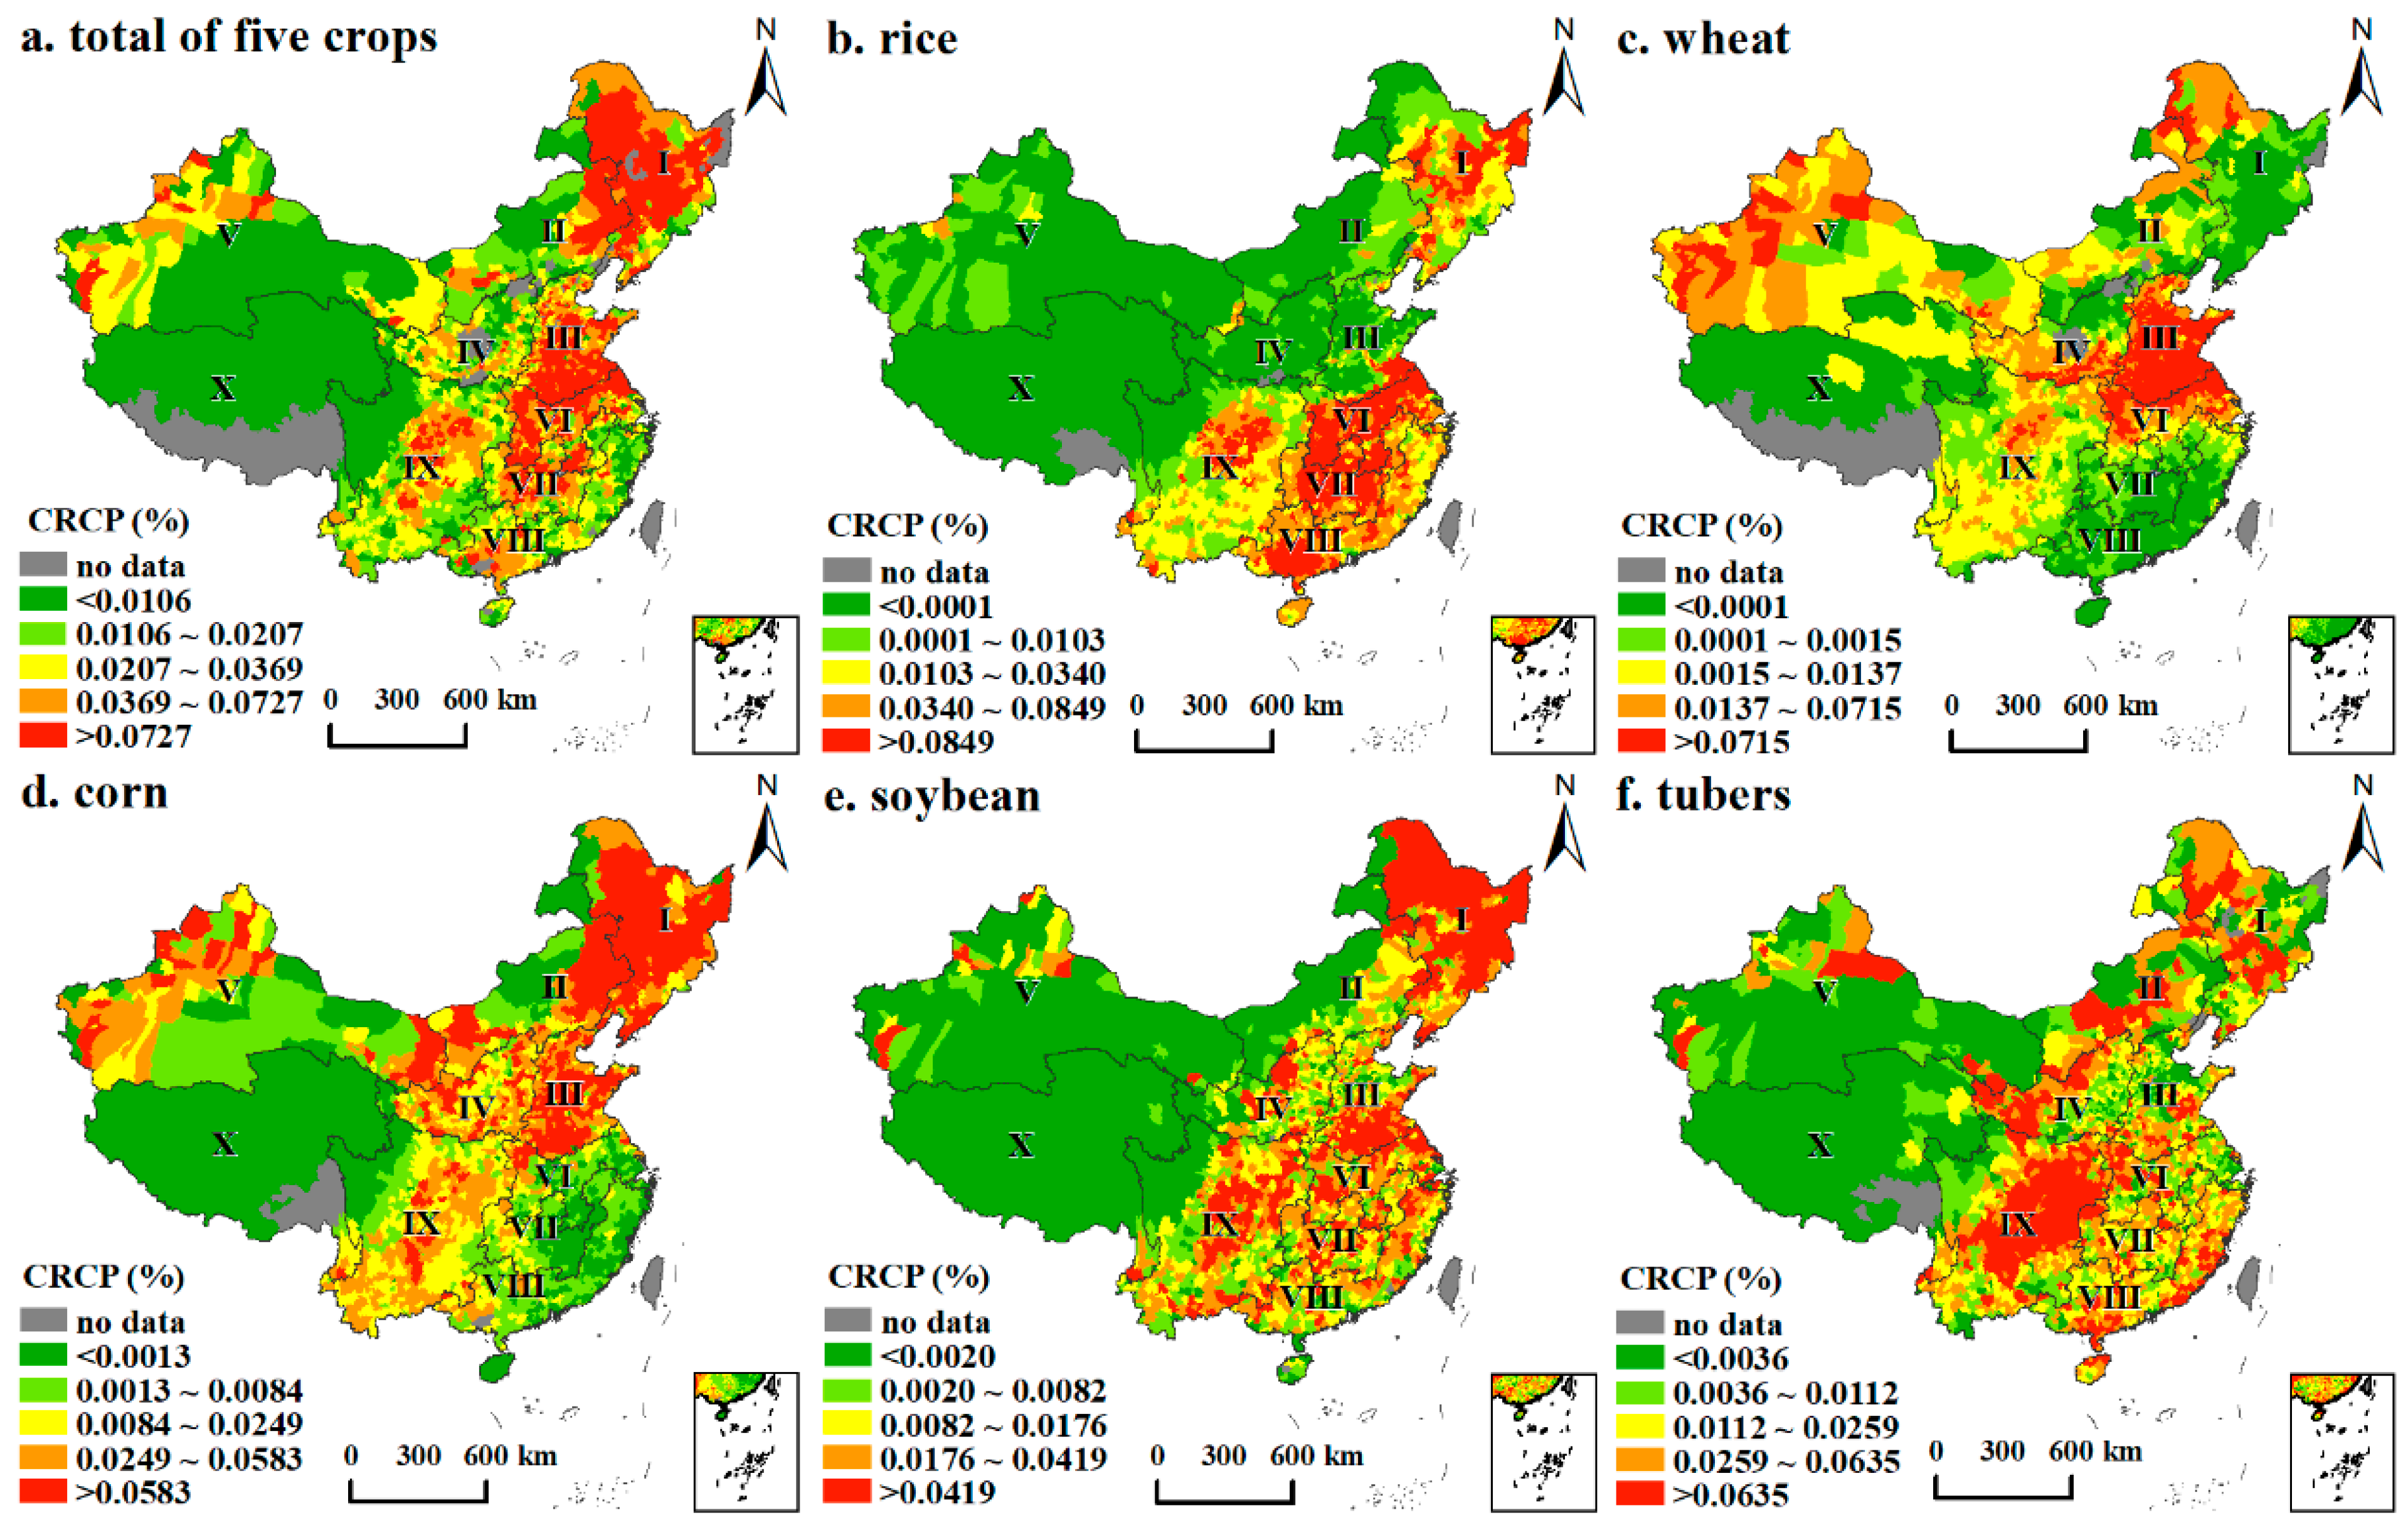
In 2015, the CRCP of the total of the five crops showed obvious spatial heterogeneities between the different counties (Figure 2a). The counties with high CRCPs were concentrated in zones I, III, VI, and IX. These areas have flat terrain, fertile soil, and good growing conditions, accounting for 72.89% of the total yields of the five crops and were the areas with the highest crop production in China. The areas of low crop production are concentrated in zone X, central to and east of zone V, and northwest of zone IX, and some counties did not produce any crops.
The ratios of corn, rice, wheat, tubers, and soybean yields to the total yield of the five crops were 38.22%, 32.59%, 21.41%, 5.86%, and 1.92%, respectively. The main production areas of different crops showed obvious differences (Figure 2b–f). The main corn production areas were located in zones I and III of northern China, accounting for 35.92% and 25.84% of total corn production, respectively. This is consistent with the growth requirements of corn, which include short periods of sunshine and resistance to moderate, but not high, temperatures. The areas of high rice production were concentrated in zones VI, VII, and VIII of southeastern China, which accounted for 65.91% of the total. Rice production was also relatively high in zone I and the northern part of zone IX. China’s wheat production was relatively concentrated: 63.35% of the total production was located in zone III, and another 15.69% was located in the northern part of zone VI. A proportion of 40.33% of soybean was distributed in zone I, and counties with high CRCPs were scattered in eastern China. In addition, the areas of high tuber production were located in zone IX, which accounted for 41.77% of total tuber production in China.
3.1.2. Spatiotemporal Changes in Crop Production in the Period 1990–2015
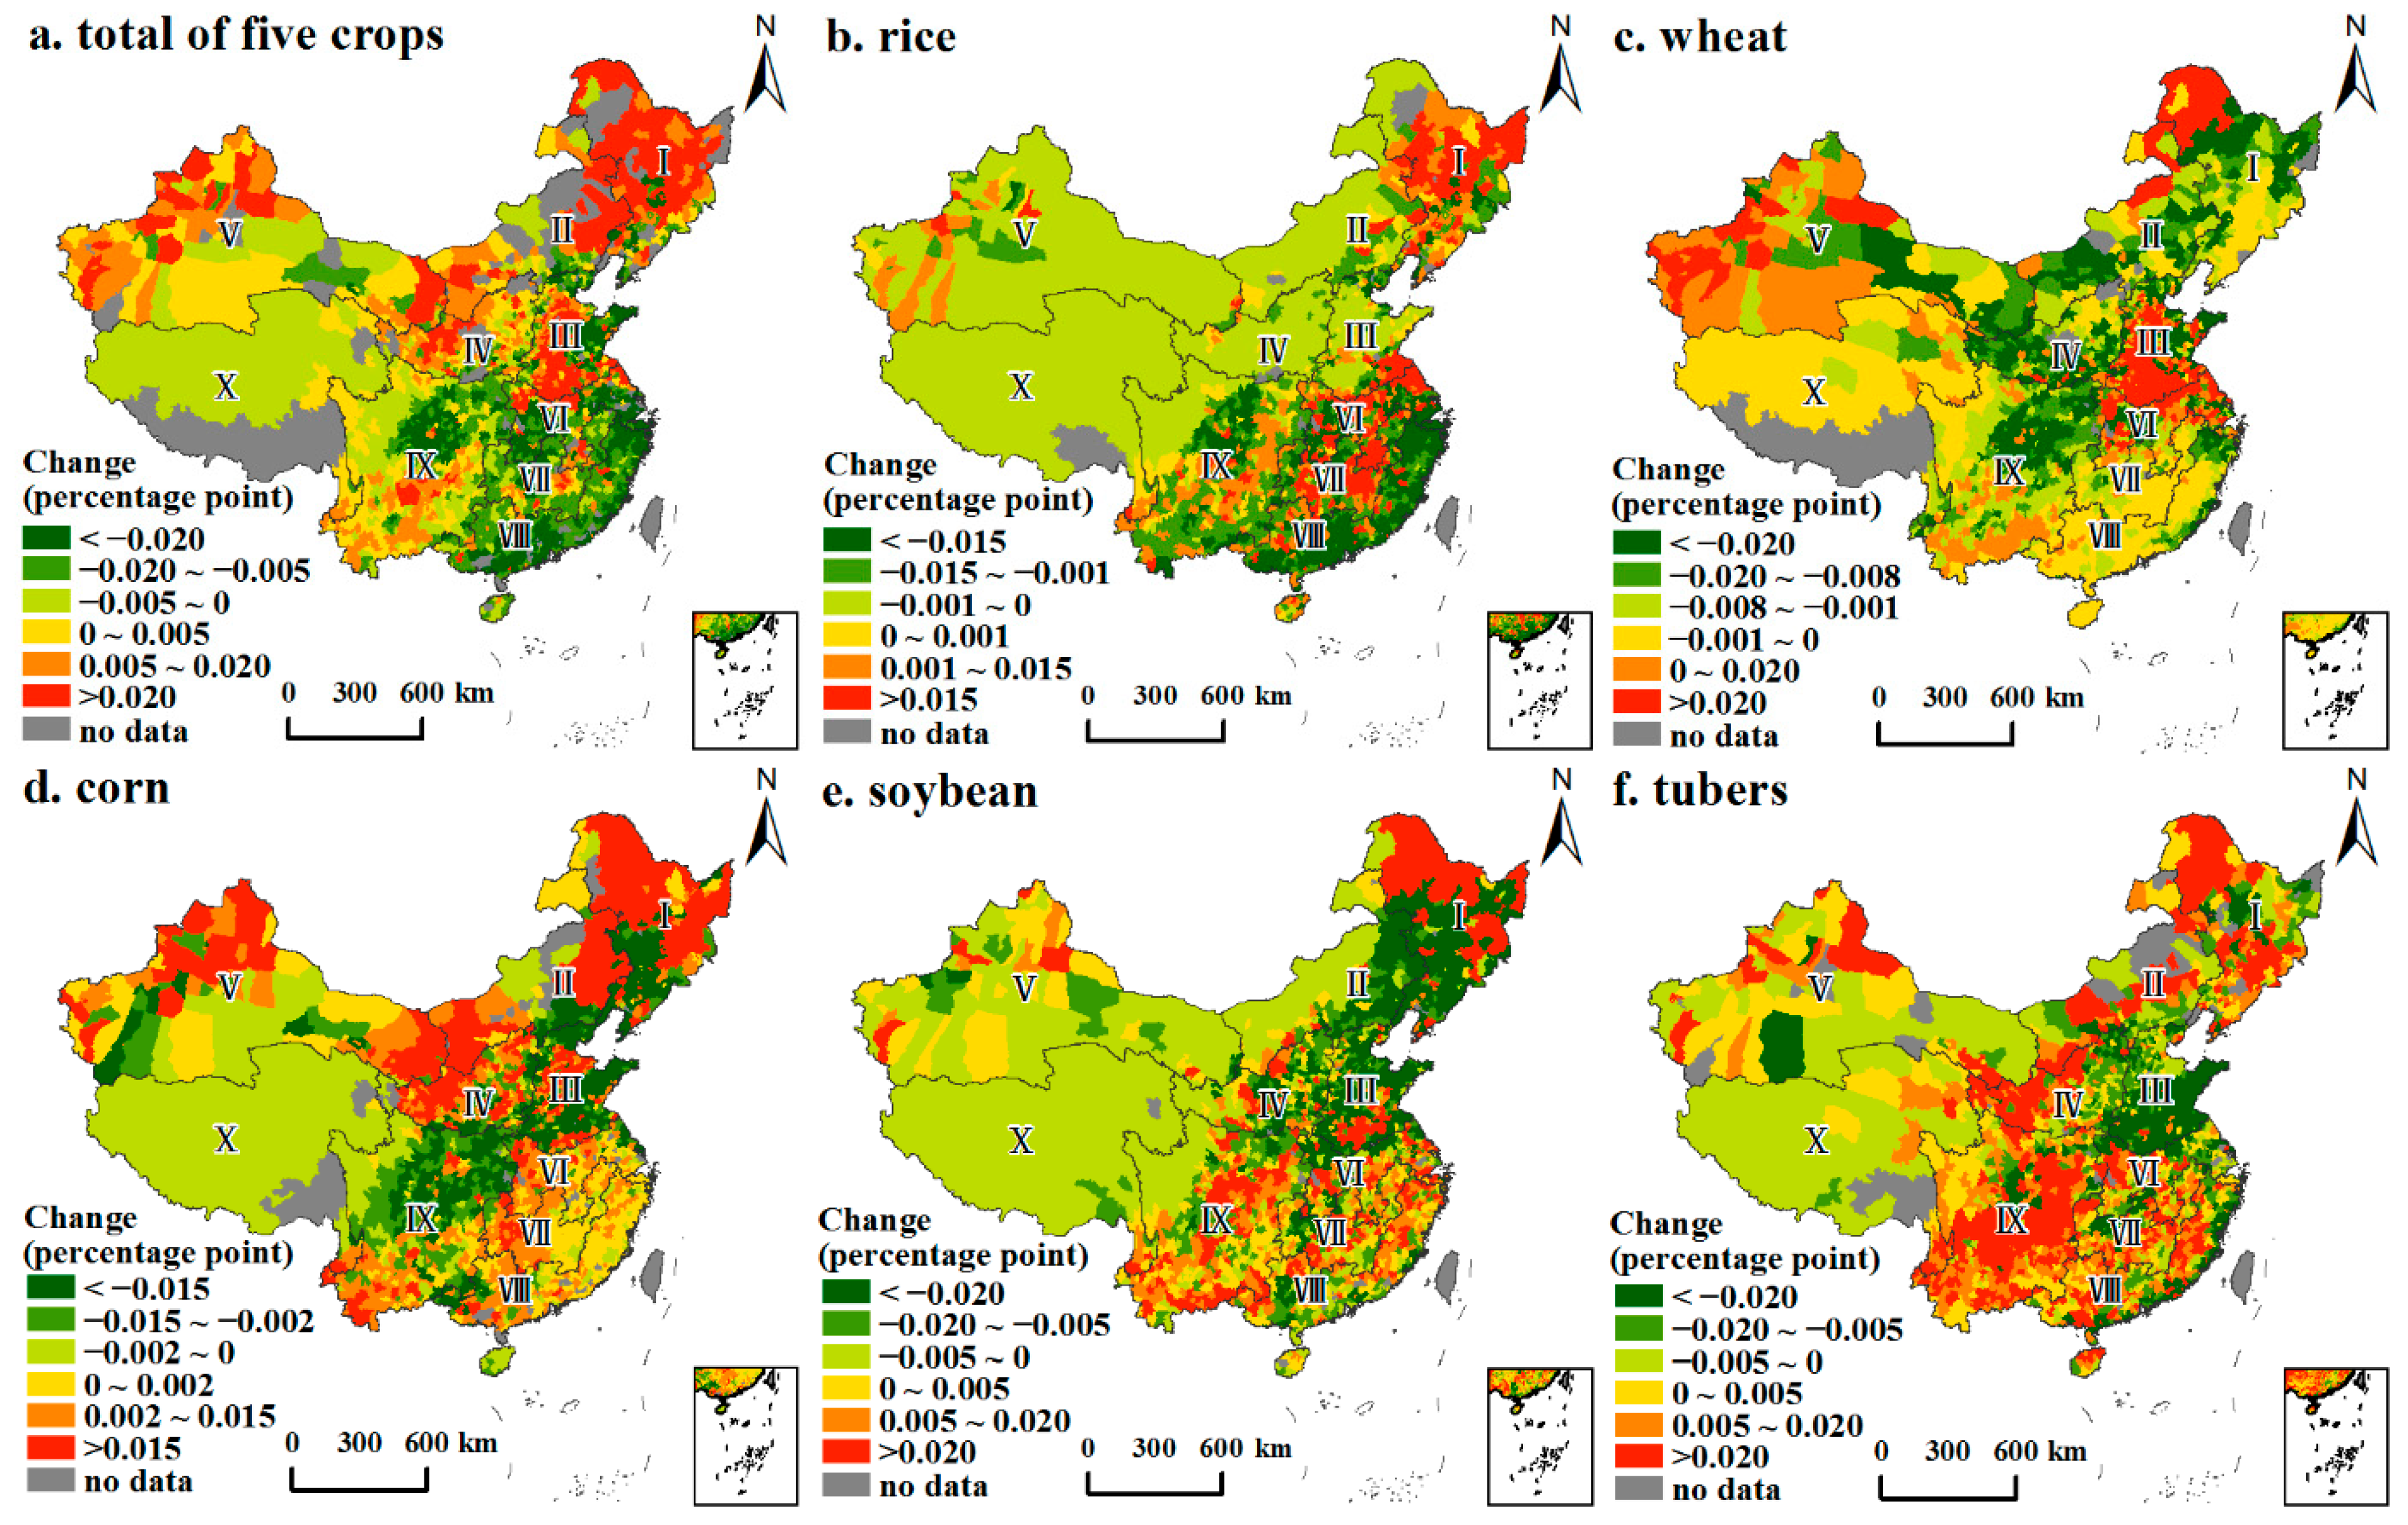
From the total of the five crops (Figure 3a), the counties where CRCP increased by more than 0.02 percentage points (pp) were located mainly in zones I and III. In those 25 years, the CRCPs in these two zones increased by 6.14 pp and 2.73 pp, respectively, which was significantly higher than the national average. These two regions have been greatly favored by the government’s crop policy, coupled with improvements to farmland providing low or medium levels of production, which has led to a general increase in CRCP. The counties where CRCP decreased by more than 0.02 pp were located mainly in zones VIII, VI, and northeast of zone IX, with reduced production levels of 5.19 pp, 3.20 pp, and 3.10 pp, respectively, due mainly to urban expansion and adjustments to the industrial structure in southern China. In addition, the changes in CRCP in areas of low crop production were relatively stable, including in zones IV and X.
In terms of the different crops (Figure 3b–f), the dominant rice-producing areas were still located in southern China, but the CRCP in zone VIII decreased by 6.84 pp in the period 1990–2015. At the same time, the CRCP of rice increased by 7.15 pp in zone I, where the soil was fertile and irrigation water was pure. In contrast, the regional trend of wheat production was more obvious. In terms of the wheat, the counties with more than a 0.02 pp increase in CRCP were located mainly in zones III and the north of zone VI, and the CRCP of wheat in these two regions increased by 13.44 pp and 2.25 pp, respectively. Zones I and III in northern China have been areas of high corn production, but the CRCP in the south of zone III has been greatly reduced, resulting in a 7.01 pp decrease in zone III. On the other hand, the proportion of corn grown in northern China has increased. Counties with a CRCP increase of more than 0.015 pp were distributed mainly in the center and north of zone I, the southwest and northeast of zone II, the north and east of zone V, and the west of zone IV. With respect to soybean, counties with a CRCP decrease of more than 0.02 pp were located mainly in the center and north of zone III and the south of zone I. The CRCP of soybean decreased by 7.20 pp in zone III, which was due mainly to adjustments to the structure of the crop in exchange for a rapid increase in wheat production. The quantity of soybean grown in the north of zones I and IX increased rapidly, and the CRCP in zone IX increased by 6.24 pp. With respect to tubers, the counties with a significant increase or decrease in CRCP were located mainly in zone IX (increased by 14.88 pp) and zone III (decreased by 25.84 pp), respectively.
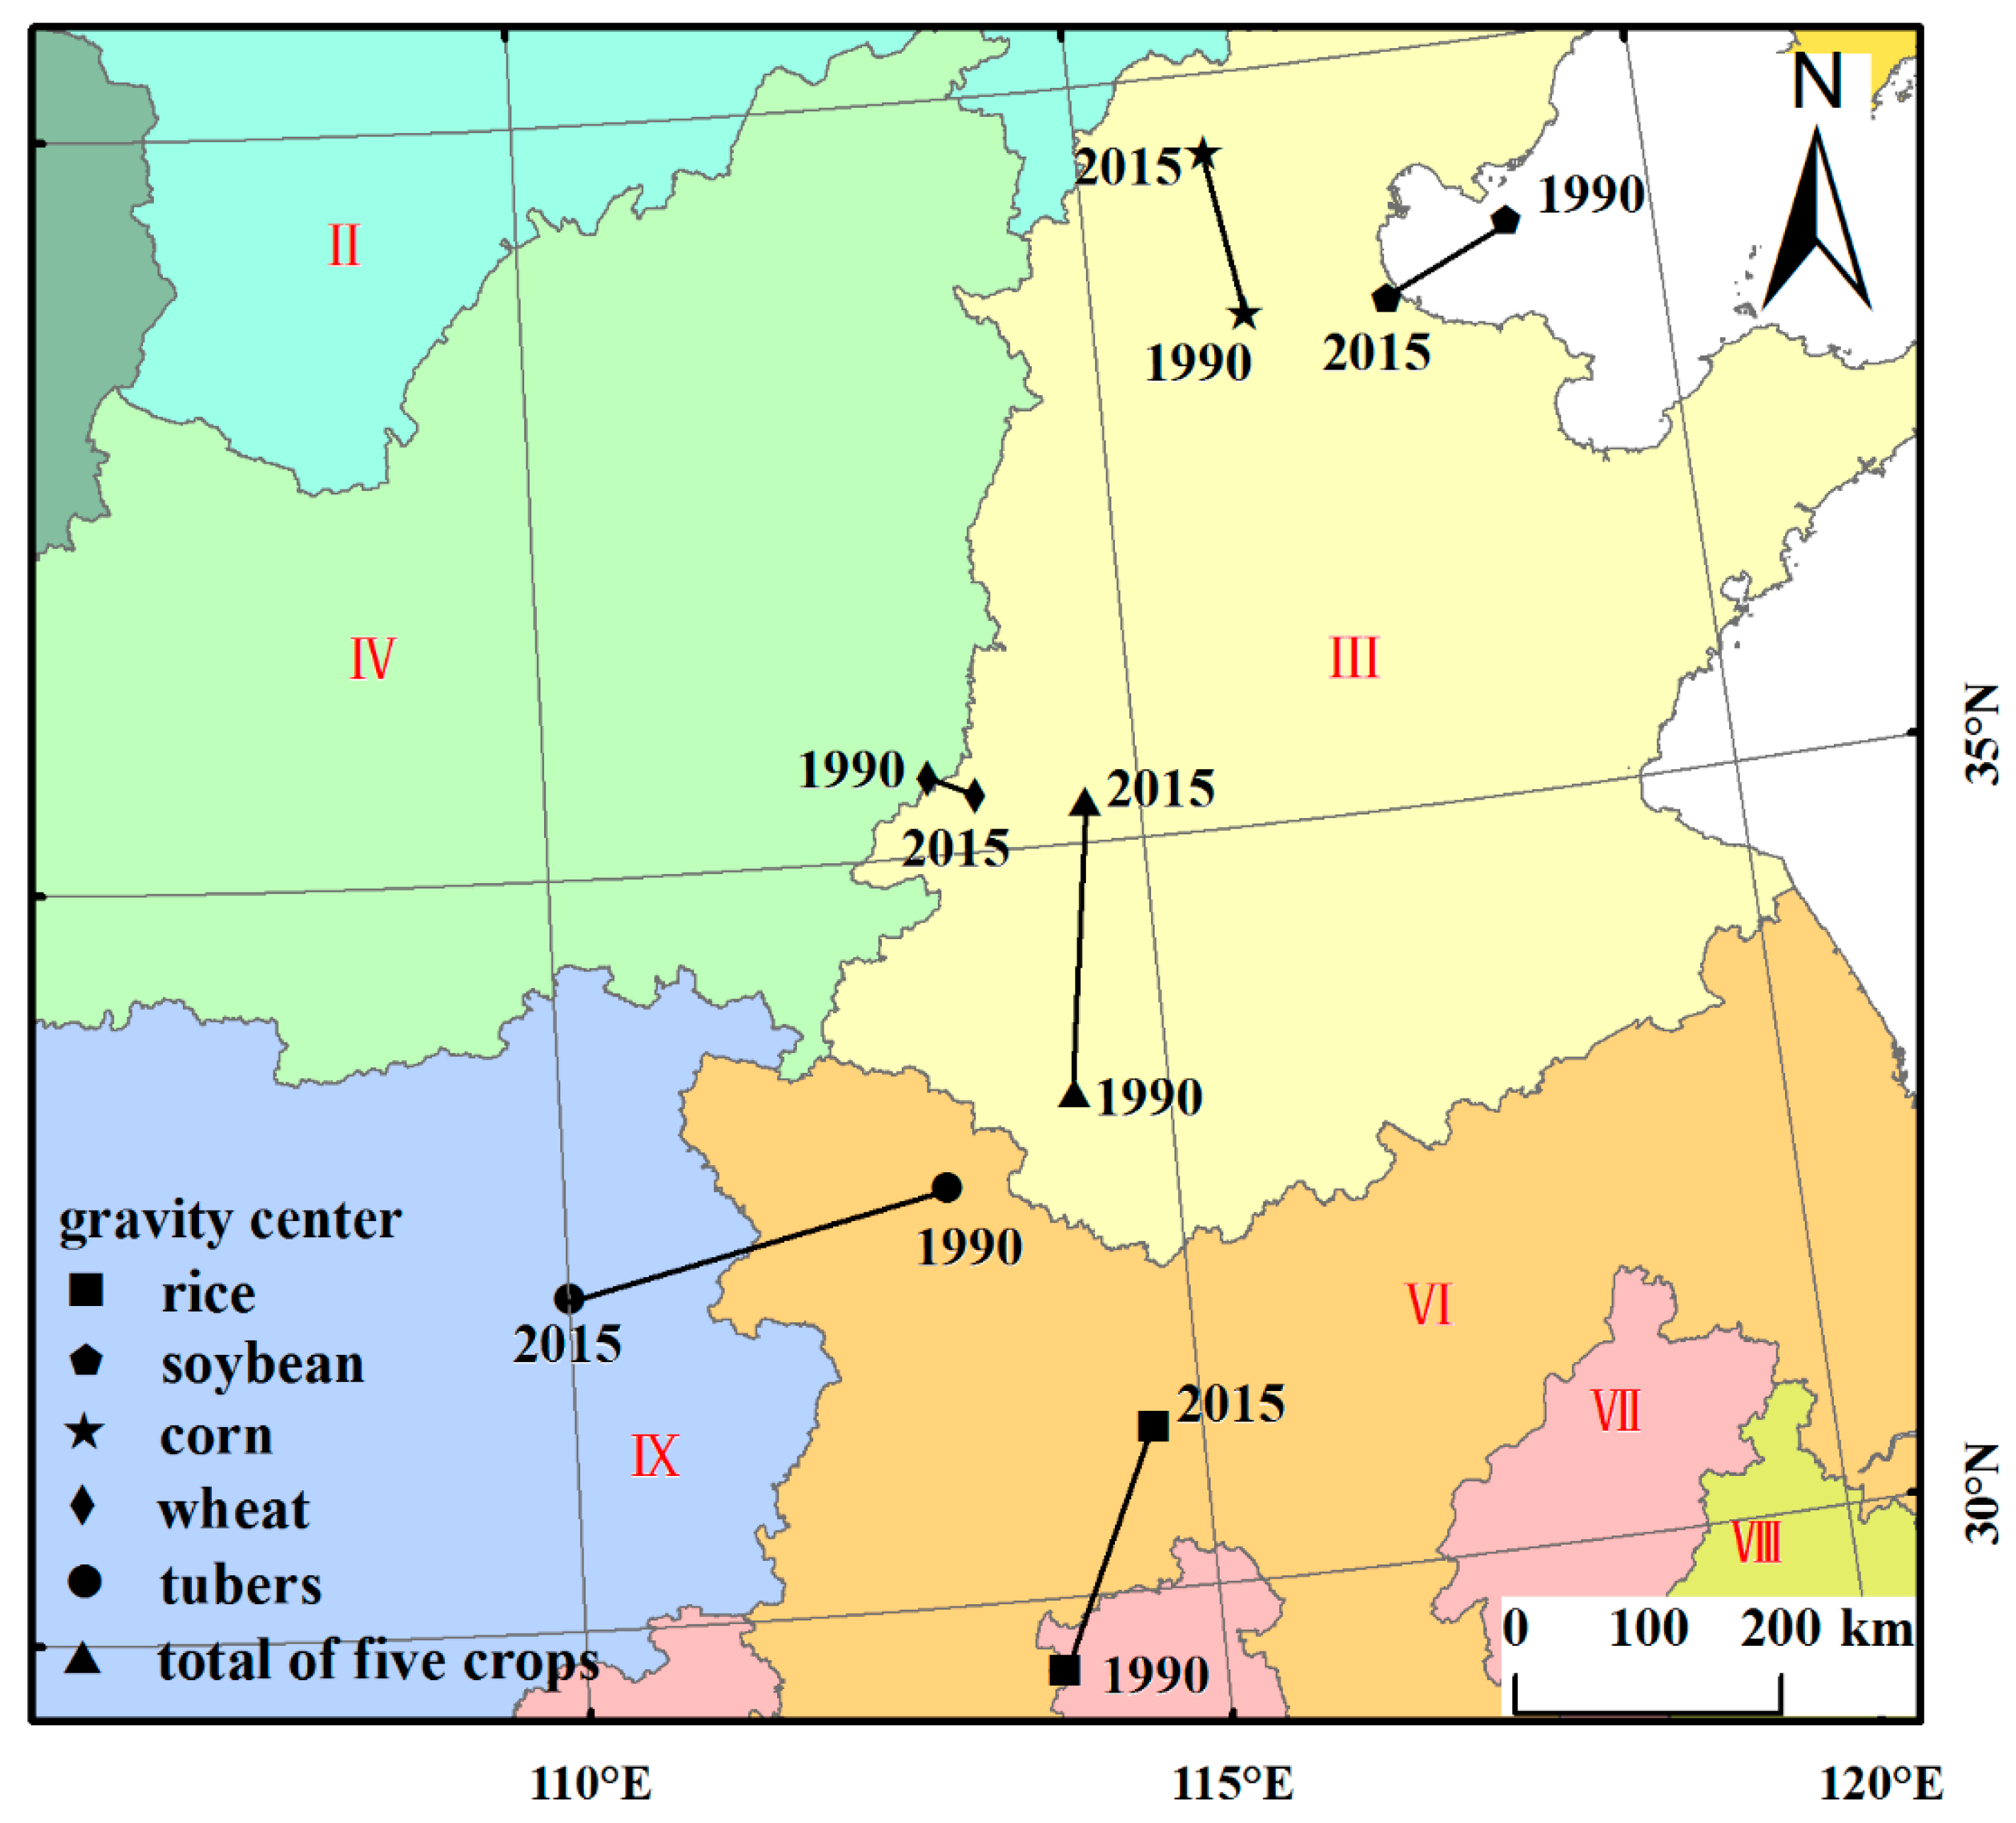
3.2. Trajectory of the Gravity Center of Crop Production and the Geographic Imbalances between Farmland and Water Resources
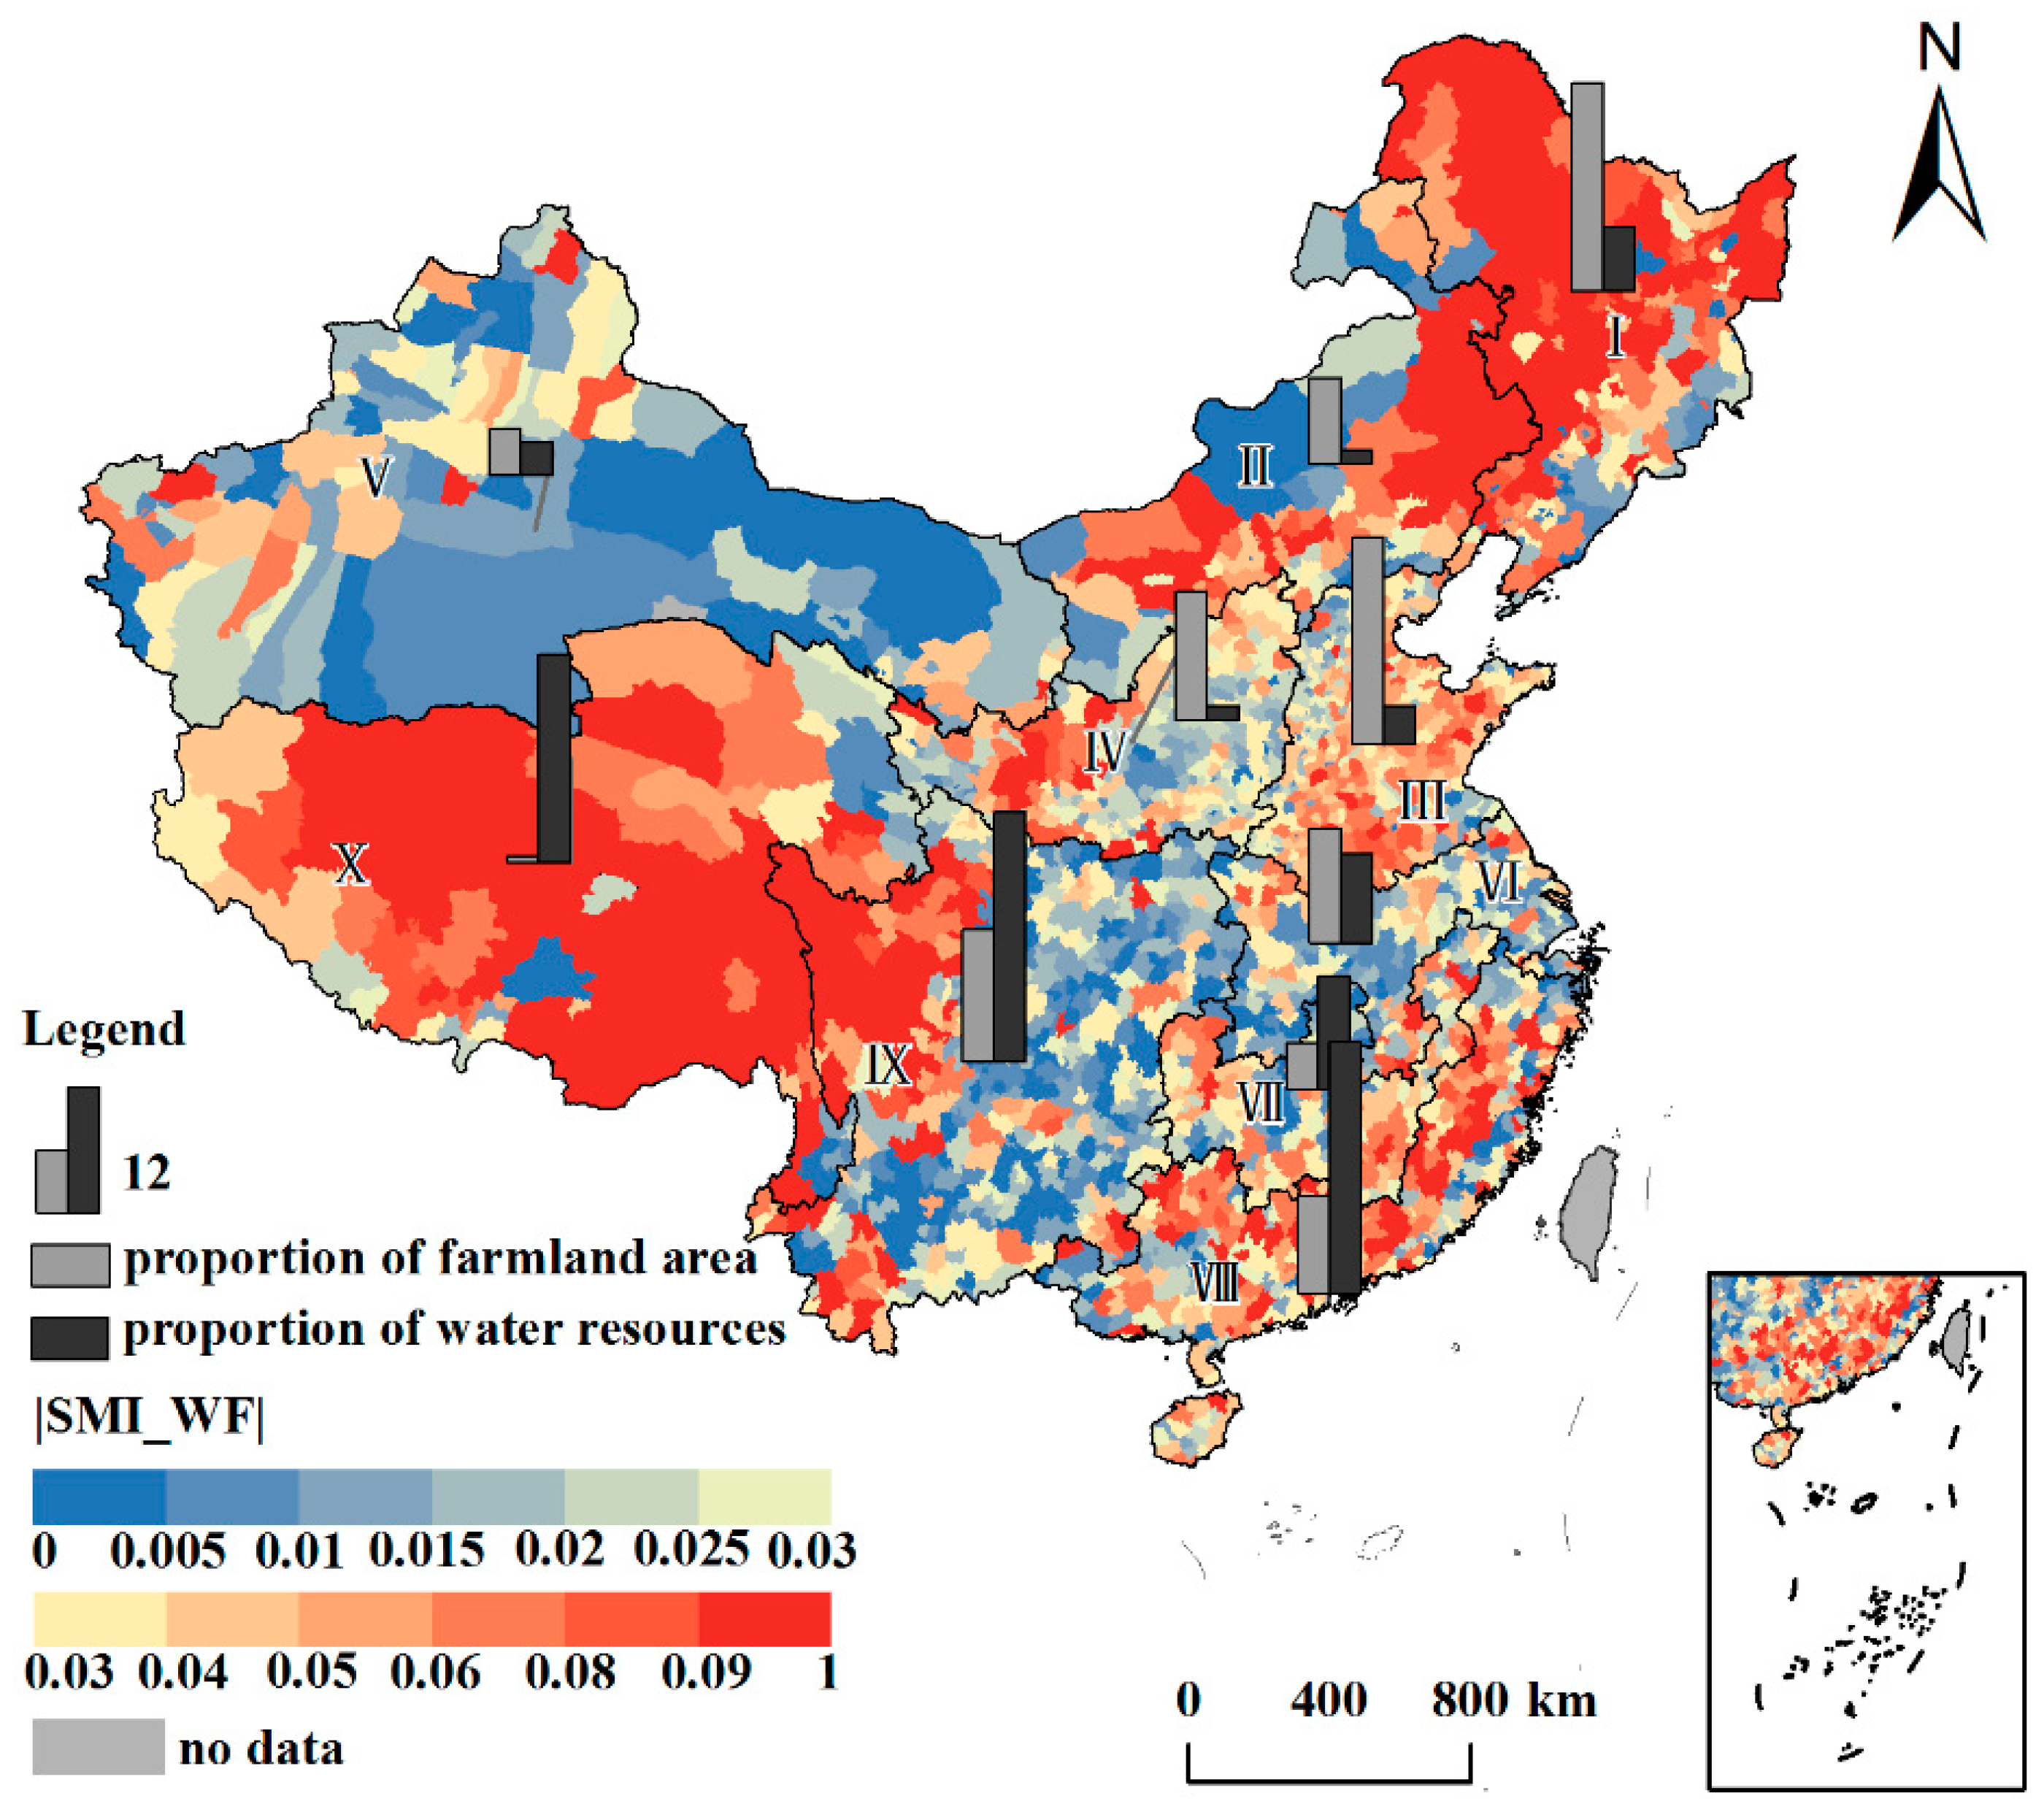
In 2015, the northern region of China was rich in farmland and short of water resources, whereas the southern region experienced the opposite (Figure 4). The spatial matching of farmland and water resources was unbalanced, which greatly limited crop production. Between 1990 and 2015, the gravity center of the total production of the five crops moved north (Figure 5), with a moving distance of 219.47 km in the direction of abundant farmland, fewer water resources, and increasing |SMI_WF|. This result shows that the focus of crop production in China has gradually shifted northward from the southern rice-based growing area, with its relatively abundant water resources and developed economy, to the northern wheat- and corn-based growing area, with its relatively poor water resources and underdeveloped economy.
With respect to the different crops, the distance that the gravity center moved was ranked as follows: tubers > rice > corn > soybean > wheat. The gravity centers of tuber and soybean production moved toward the southwest by 295.14 and 106.78 km, respectively, moving in the direction of abundant water resources, less farmland, and reducing |SMI_WF|. These changes were attributed mainly to the significant increase in the CRCPs of tubers and soybean in zone IX. The gravity center of rice and corn production moved toward the north, in the direction of fewer water resources, abundant farmland, and increasing |SMI_WF|. The moving distance of the rice and corn gravity centers were 197.74 and 124.77 km, respectively. Compared with other crops, the moving distance of the gravity center of wheat was the smallest, by only 37.60 km to the southeast, which was due mainly to the significant increase in the CRCP of wheat in the north of zone VI. On the whole, wheat production gradually moved in the direction of abundant water resources, less farmland, and decreasing |SMI_WF|.
3.3. Geographic Imbalances between Crop Production and Farmland-Water Resources
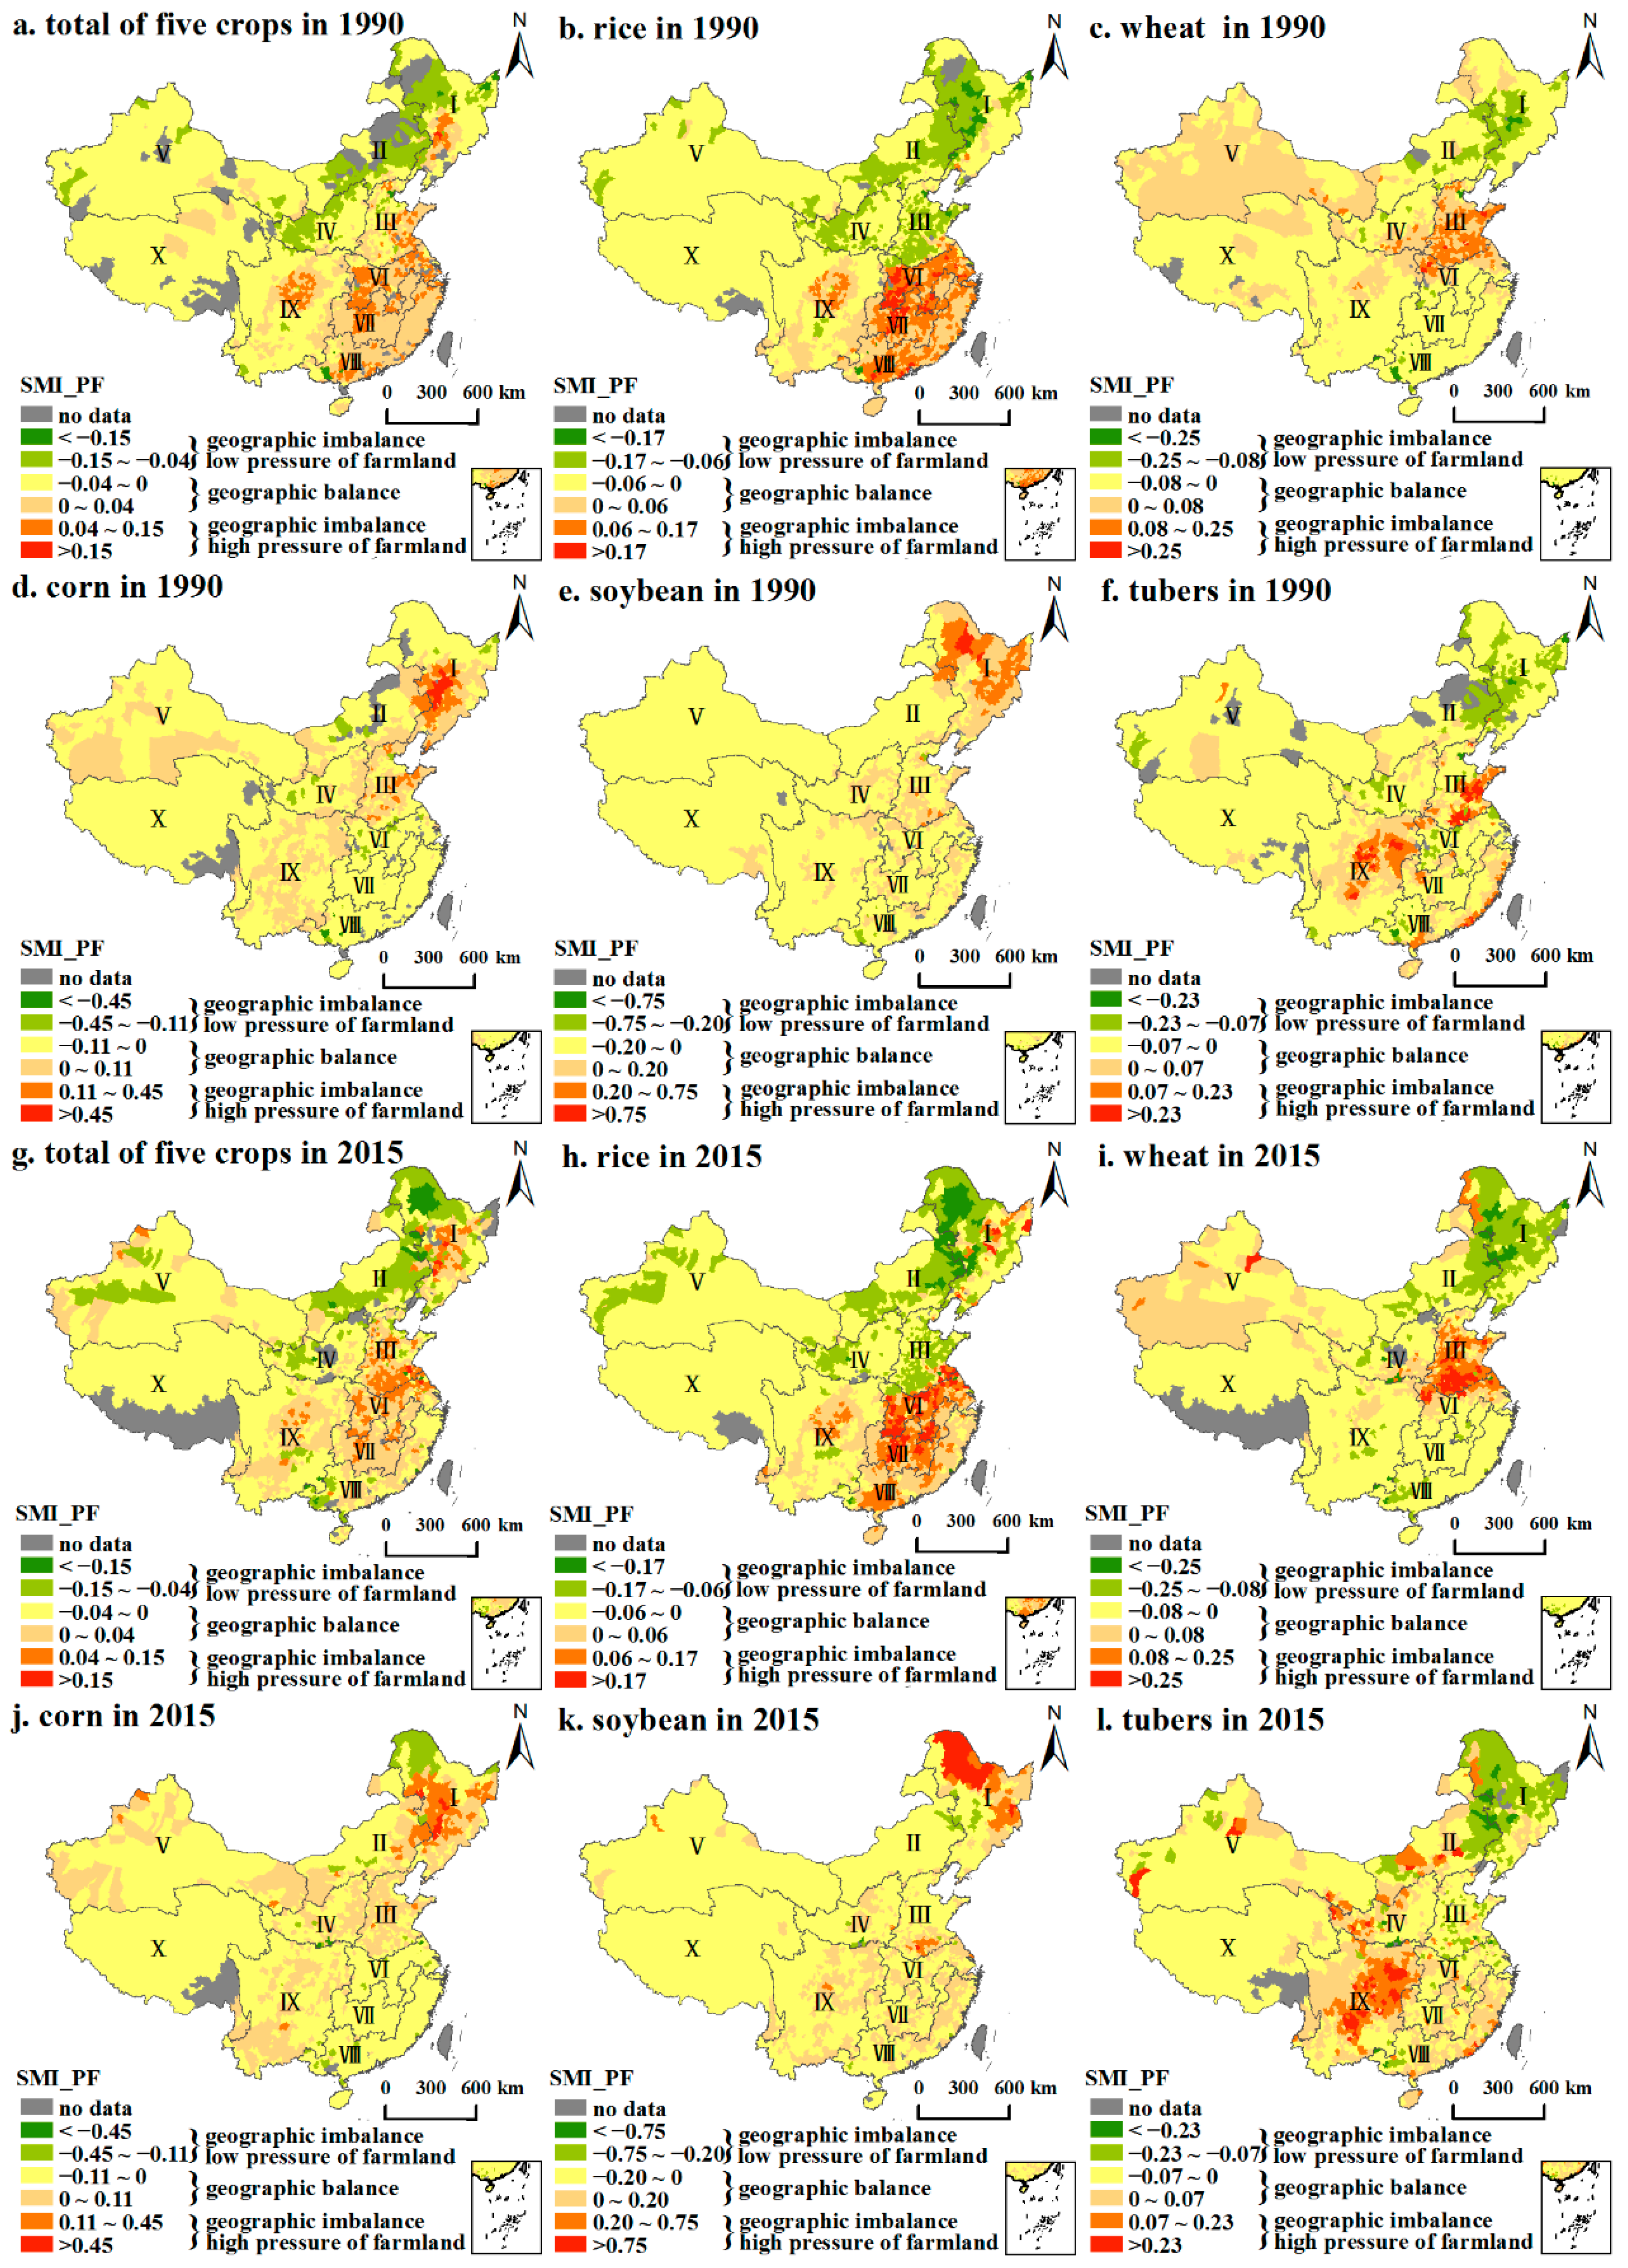
3.3.1. Geographic Imbalances between Crop Production and Available Farmland
Based on the Jenks Natural Breaks Classification, the geographic imbalances between crop production and available farmland are shown in Figure 6. In the period 1990–2015, ∑SMI_PF decreased slightly from 46.94 in 1990 to 45.26 in 2015. The gravity center of the total production of the five crops moved toward the north with abundant farmland, which ensured that ∑SMI_PF decreased slightly against the background of increasing crop production.
From the perspective of the different crops, in the period 1990–2015 the ∑SMI_PF from high to low was: rice > tubers > wheat > corn > soybean and wheat > rice > tubers > soybean > corn, respectively. In the period 1990–2015, the ∑SMI_PF of wheat, soybean, and tubers increased. The ∑SMI_PF of wheat increased by 39.96%, which was due mainly to the large increase in wheat production during that period and its concentration in zone III, resulting in a significantly increased pressure on farmland in zone III. The ∑SMI_PF of soybean increased by 27.16%. Although the gravity center of soybean production moved toward the southwest, its main area of production was still in zone I. The CRCP of soybean in the southern zone I increased significantly, which increased the ∑SMI_PF of soybean significantly. The ∑SMI_PF of tubers increased by 12.22%, which was due mainly to the large increase in the CRCP of tubers in zone IX, which had a relative shortage of farmland. The geographic imbalance in corn production was thereby improved and the ∑SMI_PF decreased by 11.23%, which was due mainly to the shift of the gravity center of production to the north, which had rich available farmland. Except for the center and west of zone I, the degree of balance of corn production with available farmland was relatively good in almost all regions. The ∑SMI_PF of rice in 2015 was basically the same as that in 1990 and only decreased by 1.34%. The counties with a decrease in farmland pressure on rice production were distributed in zone VIII and the counties with an increase in farmland pressure were distributed in the center of zone I.
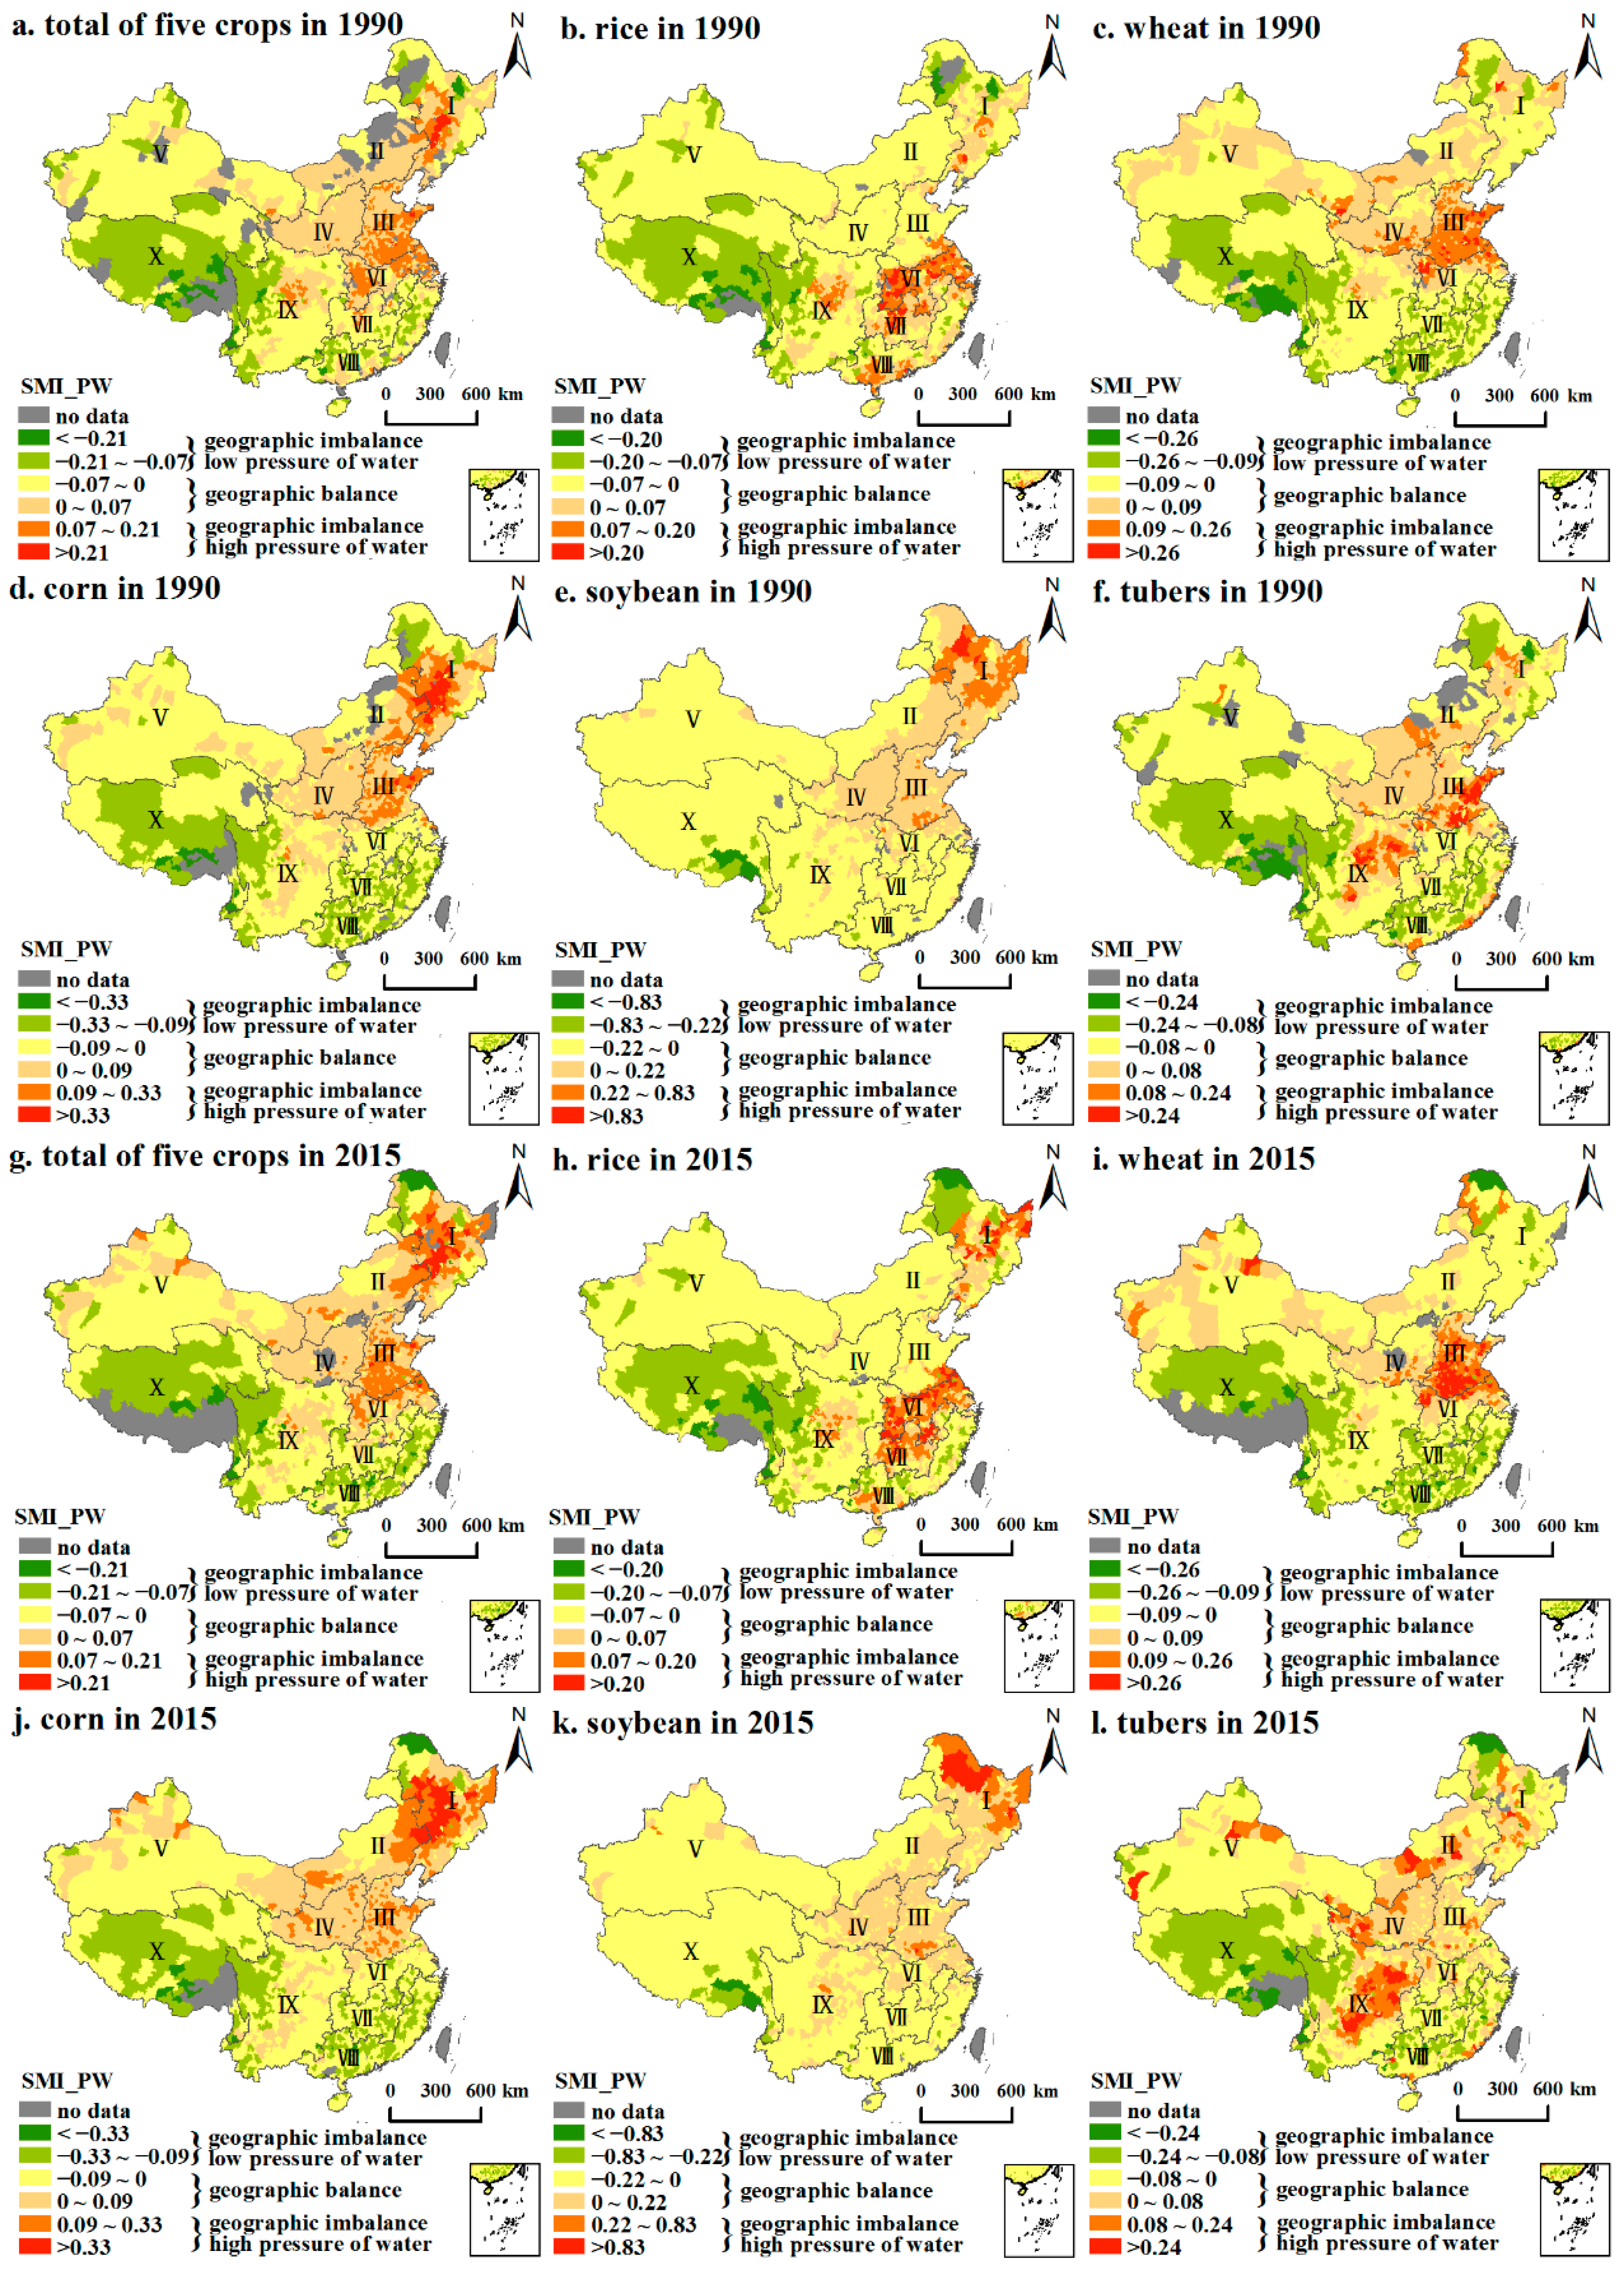
3.3.2. Geographic Imbalances between Crop Production and Water Resources
Between 1990 and 2015 (Figure 7), ∑SMI_PW changed faster than ∑SMI_PF. The value of ∑SMI_PW increased from 100.47 in 1990 to 109.63 in 2015, an increase of 9.12%. The shift of the gravity center of the total production of the five crops to the north increased the pressure on water resources and the values of ∑SMI_PW in zones I and III increased by 38.29% and 13.50%, respectively.
For the different crops, the rankings of ∑SMI_PW in 1990 and 2015 were basically the same, namely, corn > wheat > soybean > tubers > rice and wheat > corn > soybean > tubers > rice, respectively. Although the shift of the wheat gravity center to the south was beneficial for reducing the ∑SMI_PW, the ∑SMI_PW finally increased by 10.01% due to the large increase in wheat production in China and the increasing concentration of wheat growing in zone III with relatively few water resources. With respect to the rice, the ∑SMI_PW increased by 14.20%. This change was due mainly to the large increase in the CRCP of rice in the center of zone I because of water shortages, which increased the pressure on water resources there. At the same time, the northward shift of the rice gravity center increased the ∑SMI_PW. The ∑SMI_PW of tubers and soybean decreased by 9.54% and 4.71%, respectively, which was related to the shift of the gravity center of these two crops to the water-rich south. In addition, the ∑SMI_PW of corn changed little, only reducing by 1.43%. The main reason for this was that the adjustment to the spatial distribution of corn occurred mainly in northern China, and there was no large cross-regional adjustment between the north and the south.
4. Discussion
4.1. Changes in Crop Production and Its Relationship to Farmland and Water Resources
4.1.1. Total Production of the Five Crops
Between 1990 and 2015, the spatial distribution of crop production in China changed considerably. Our results showed that the gravity center of the total production of the five crops moved northward from 1990 to 2015, which was consistent with previous research results [19,49]. We further counted the crop production at the provincial scale from 2015 to 2020 and found that the CRCP of Heilongjiang, Inner Mongolia, Shandong, Henan, Liaoning, and Hebei provinces in northern China increased by 1.11 pp, 0.75 pp, 0.55 pp, 0.43 pp, 0.30 pp, and 0.26 pp, respectively, indicating that the northward shift of the gravity center of crop production has not changed from 2015 to 2020. The spatial centralization of crop production increased the consumption of farmland and water resources in the main producing areas. The spatial pattern of crop production changed from “crop transportation from south to north” to “crop transportation from north to south” [50], which further changed the geographic relationships between crop production and farmland-water resources. In terms of farmland resources, the geographic imbalances have been alleviated by the crop production barycenter’s shift to northern China, which is the difference between our results and Li et al. [29]. The rich farmland resources in northern China make it possible for crop transfer and it is also conducive to the efficient use of farmland resources. Moreover, as a result of support from specific policies in northern China, such as the “market-oriented acquisition + subsidy” policy for corn, crop production in northern China increased. In terms of water resources, the overall pattern of water resources has not changed in China. The increase in precipitation in the north and northwest alleviated the demands of agricultural production for water resources to a certain extent. However, the large-scale expansion of farmland in the north increased the demand for water resources. In our paper, the geographic imbalances between the total production of the five crops and water resources aggravated, which has often been ignored in previous studies and should be paid attention to [43].
The southern plain is the best area for matching the degree of farmland with water resources in China. However, with the rapid economic development in the south, a large area of farmland became construction land [51,52], which weakened the status of crop production and did not give full play to the advantages of a region possessing rich water resources. In fact, the shift of the gravity center of crop production to the farmland-rich north further aggravated the contradiction between the supply and demand for water resources in northern China. In 2015, 44.93% of China’s total production of five crops was produced in zones I and III but only 9.57% of the nation’s water resources were to be found there, which led to serious groundwater overexploitation [53]. For example, Cao et al. [54] showed that the rate of depletion of recoverable groundwater in zone III averaged 4 km3/a (30 mm/a) between 1970 and 2008. In the long run, if there is a drought, food security in northern China will decline and the transportation of crops from north to south will become unsustainable, which will directly threaten China’s food security [55].
4.1.2. Different Types of Crops
At the same time, the spatiotemporal changes in total crop production are also accompanied by changes in the distribution of crops in different regions [45]. Our study shows that, of the five crops, adjustments to the spatial distribution of corn production had the most significant effect on reducing the pressure on farmland and water resources. Between 1990 and 2015, the ∑SMI_PF and ∑SMI_PW of corn decreased by 11.23% and 1.43%, respectively, which was due mainly to the increase in the CRCP of corn in zones I, II, IV, and V. It should be noted that the ecological environment of these areas was fragile: once farmland and water resources were damaged, it was difficult to restore them, thus implying that we should pay particular attention to the appropriate development of these valuable and vulnerable resources. The northward shift of the gravity center of rice production was due mainly to the increase in the CRCP in zone I, which has been confirmed by previous studies [56]. The water demand for rice is about 2–3 times that of wheat or corn [57]. This characteristic of rice not only increased the pressure on water resources in the north, but it also did not take advantage of the more plentiful water resources in the south, which increased the ∑SMI_PW by 9.86%.
For wheat, restricted by water resources, the CRCP increased significantly in the north of zone VI, which helped reduce the pressure on water resources in zone III. However, between 1990 and 2015, China’s wheat production increased from 94.78 million tons to 135.74 million tons, and the CRCP of wheat in zone III, even with its water shortages, increased from 49.97% to 63.41%, resulting in an increase in both ∑SMI_PF and ∑SMI_PW. The pressure of wheat production in China on farmland and water resources was still great during this period. The gravity centers of soybean and tuber production moved toward the southwest mainly because the CRCPs of soybean and tubers increased by 6.24 pp and 14.88 pp, respectively, in zone IX, whereas they decreased by 7.20 pp and 25.84 pp, respectively, in zone III. It should be pointed out that the degree of balance between farmland and water resources in zone IX was better than that in zone III (Figure 4). Therefore, the changes in the spatial distributions of soybean and potato were beneficial to the production of these two crops.
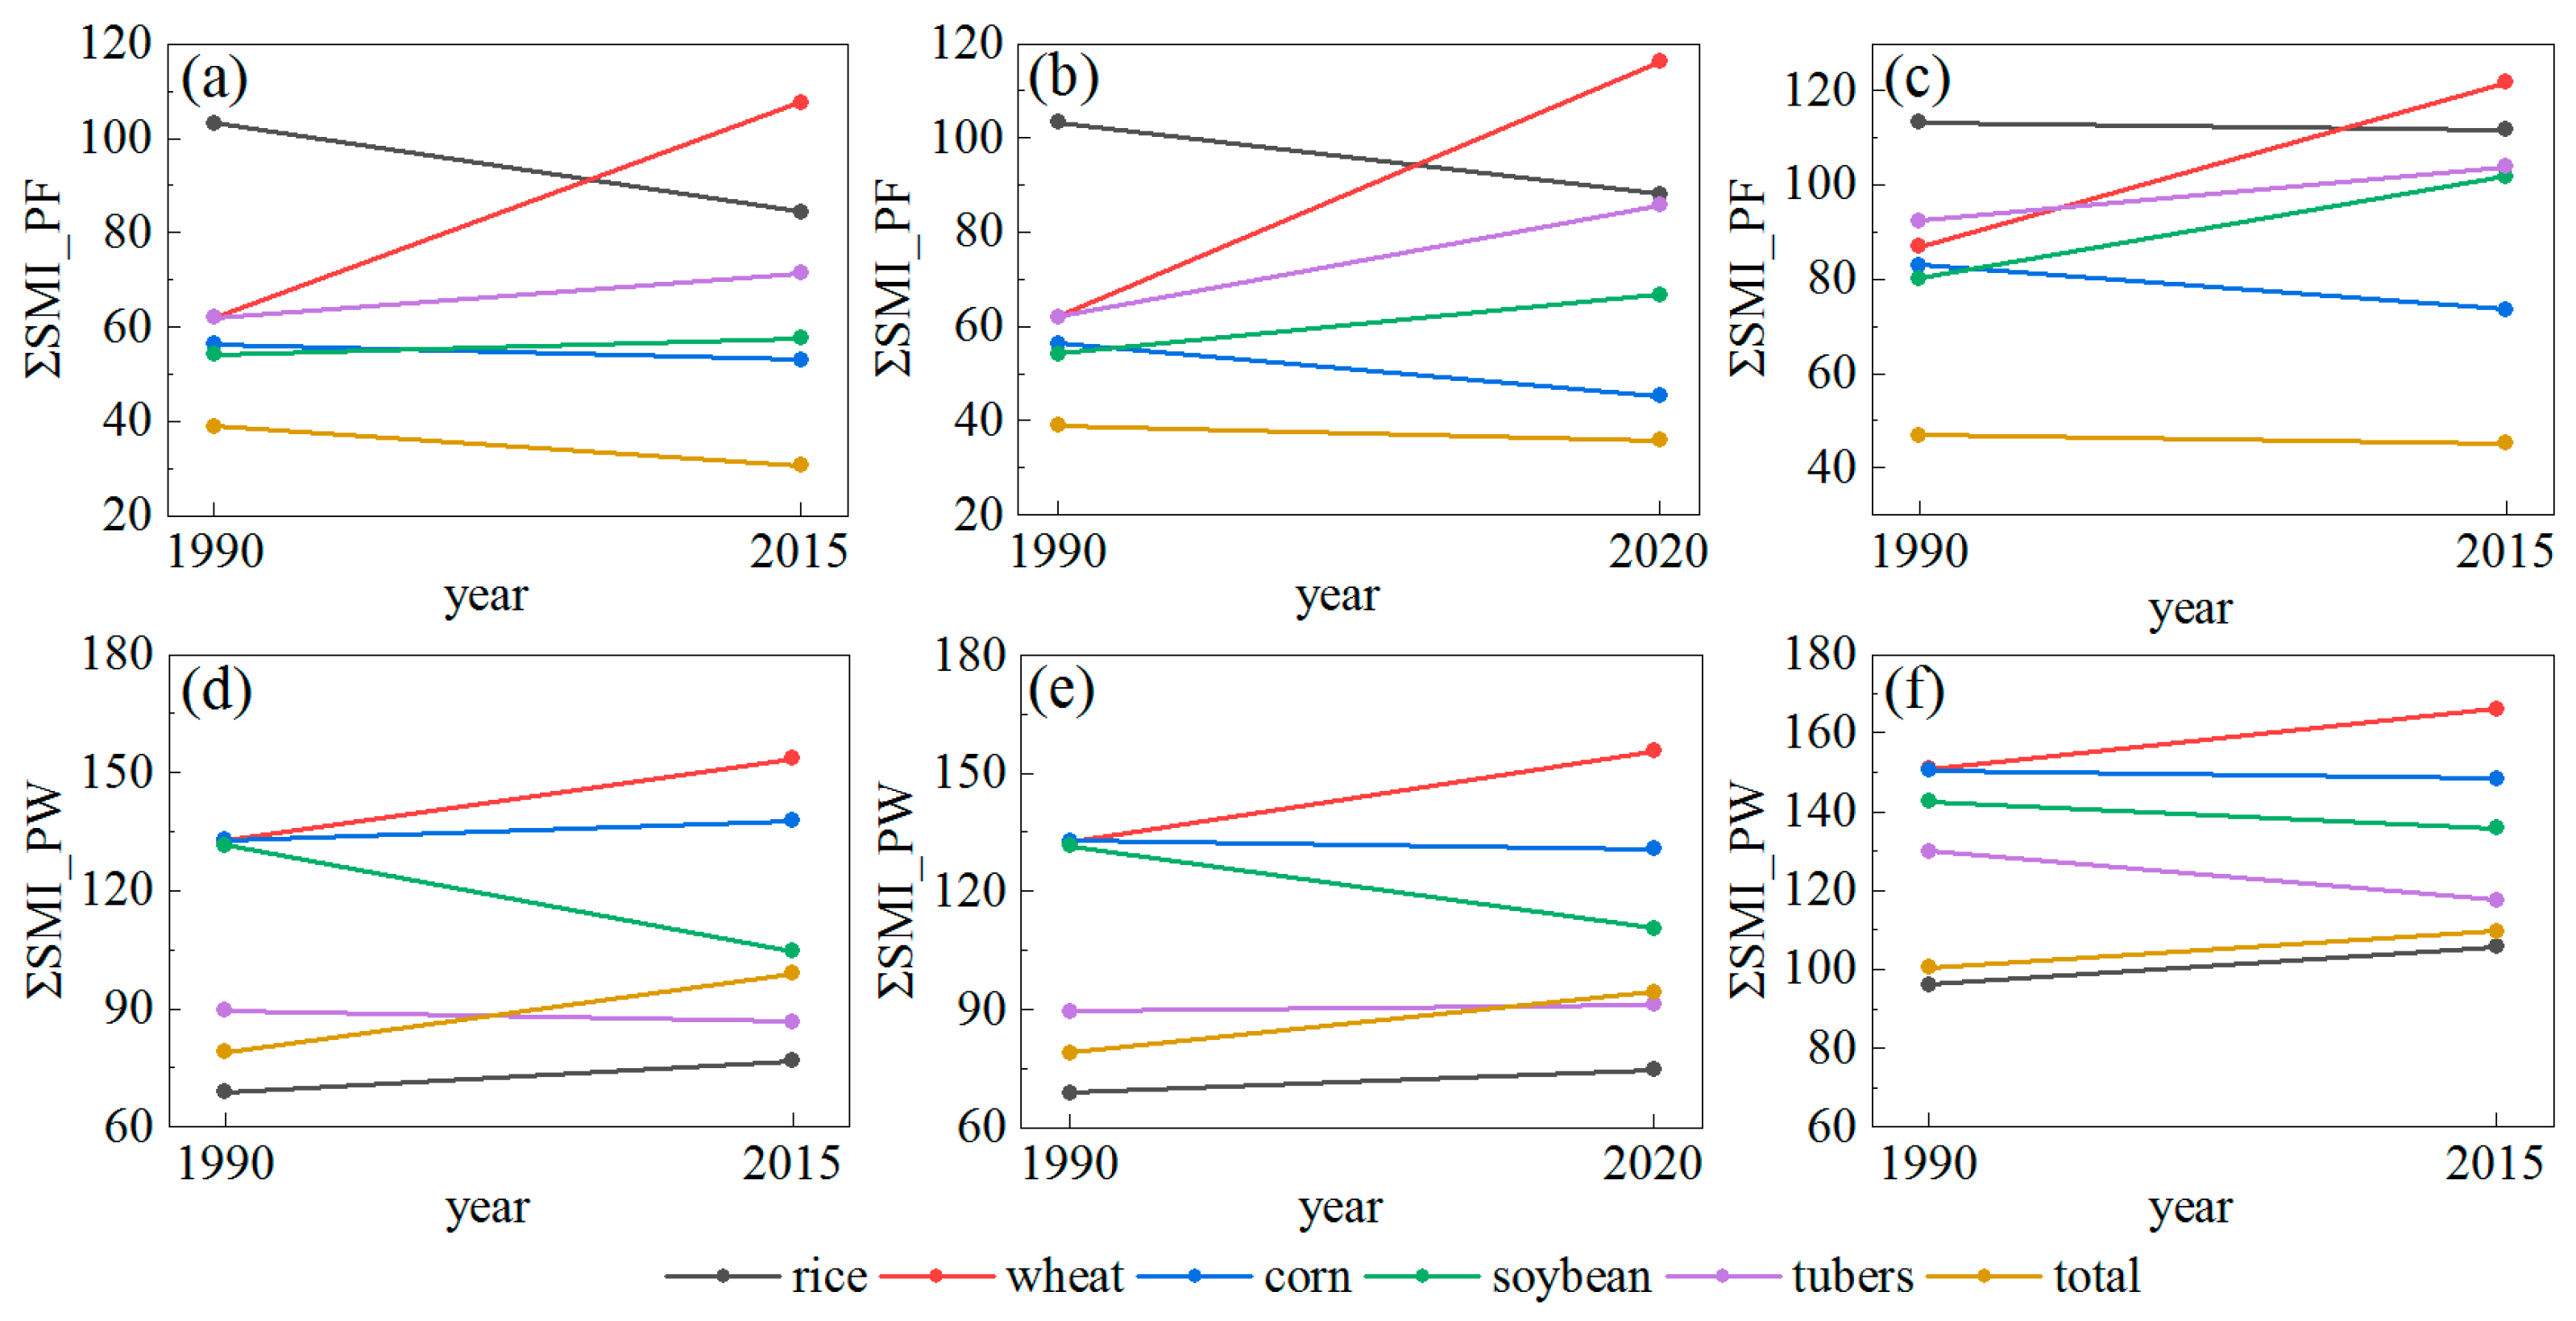
We further calculated the changes in the geographical imbalances on the provincial scale in the periods 1990–2015 and 1990–2020 and compared them with the results of the county scale from 1990 to 2015. It was found that the change trends of the three results were similar. With respect to the ∑SMI_PF (Figure 8a–c), the change trends of the three results were completely consistent. With respect to the ∑SMI_PW (Figure 8d–f), comparing the differences between the two periods on the provincial scale, it was found that the change trends of rice, wheat, soybean, and total yield were the same, except for corn and tubers. However, the changes in corn and tubers were small, which can be regarded as relatively stable. A comparison of the differences between the county and provincial scales from 1990 to 2015, showed that the change trends in rice, wheat, soybean, tubers, and total yield were the same, except for corn. From 1990 to 2015, the ∑SMI_PW of corn increased by 4.90 on the provincial scale and decreased by 2.16 on the county scale. The changes in the two spatial scales were small and can be regarded as relatively stable. Given all of this, our results on the county scale from 1990 to 2015 reflect the changes in the geographic imbalances between crop production and farmland-water resources in China over a long time.
4.2. Geographic Imbalances between Crop Production and Farmland-Water Resources in Different Subregions: Policy Suggestions
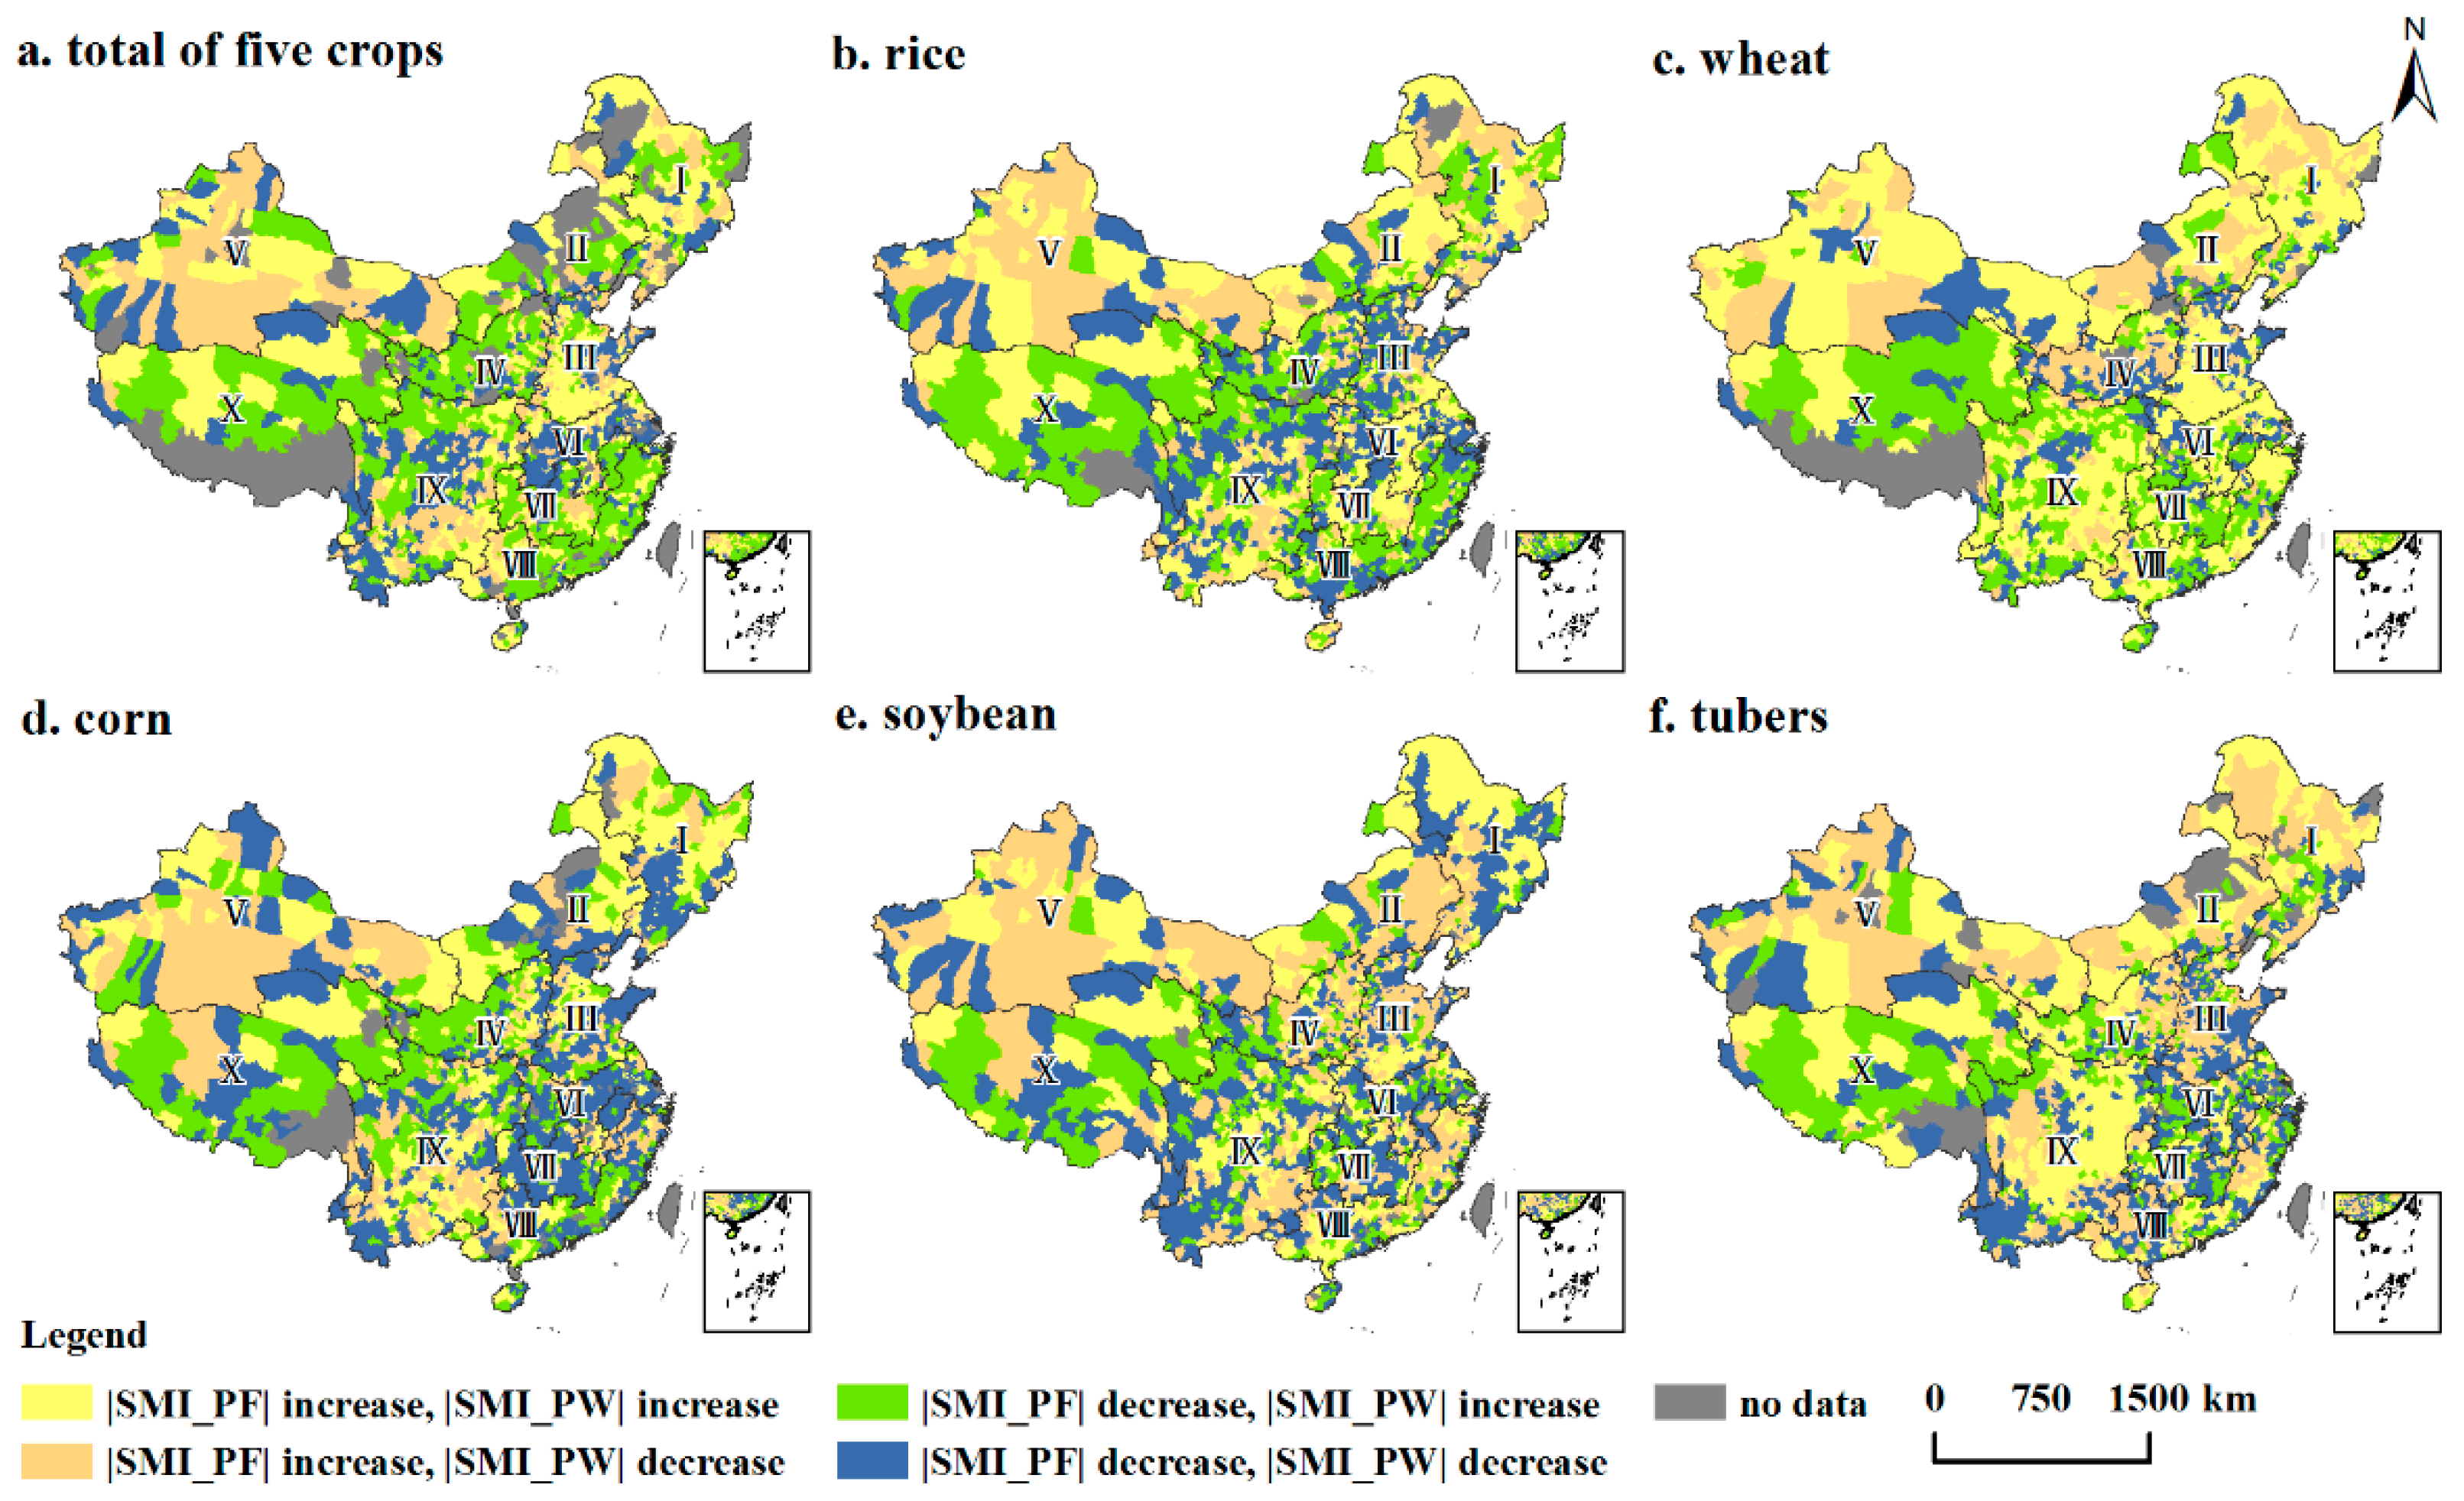
The changes in |SMI_PF| and |SMI_PW| for the different crops show a clear spatial heterogeneity (Figure 9). With respect to crop production, we divided ten subregions into three categories and put forward the below policy suggestions for the sustainable utilization of farmland and water resources. Zones I and III are rich in farmland resources and are the main crop-producing areas in China. Zones VI, VII, VIII, and IX are rich in water resources and are the main areas for growing rice and tubers. The ecological environments of zones II, IV, V, and X are fragile, and crop production is low.
Zones I and III are the main crop-production areas in China and play an important role in ensuring China’s food security. Between 1990 and 2015, the CRCP of the total production of the five crops in zones I and III increased by 6.14 pp and 2.73 pp, respectively, but this growth was at the cost of a significant expansion in the use of farmland, water, and other natural resources for agricultural purposes. In zone I, which is the main production area for soybean and corn, the |SMI_PF| and |SMI_PW| of soybean and corn increased in the north and decreased in the south. During the same period, the reserve farmland in zone I has gradually reduced, and the method of increasing crop production by increasing the area of farmland has become unsustainable [58,59]. It has become inevitable to improve farmland by low or medium levels of production and thus increase crop production per unit area. At the same time, the structure of crop production in zone I changed significantly and the CRCP of rice increased, which increased the pressure on water resources. In 2015, the proportion of agricultural water consumption in Heilongjiang reached 87.95%. The concentration of crop production further threatened the security of water resources. Therefore, the planting scale of rice with a large water consumption per unit area should be carefully controlled and irrigation control measures should be adopted in zone I. With respect to zone III, as the main area of wheat production, both |SMI_PF| and |SMI_PW| increased during the period 1990–2015. Particularly, the proportion of agricultural water consumption in Hebei and Shandong provinces located in zone III was 72.28% and 67.34%, respectively. The shortage of water resources and the high proportion of agricultural water consumption has led to the overexploitation of groundwater. In zone III, we should strictly protect high-yielding farmland, comprehensively promote high-efficiency water-saving technology, and appropriately reduce the area of wheat planting in those areas with serious groundwater overexploitation. Given all of this, in order to alleviate the pressure on water resources in zones I and III, the northward shift of the gravity center of crop production can be appropriately reversed in terms of regional agricultural function positioning. By ensuring that zone I and zone III are the main crop-production areas, the exploration of agricultural production potential in areas with abundant water resources should be strengthened.
Zones VI, VII, and VIII are the main rice-producing areas in China. These zones have abundant precipitation and high temperatures, which are conducive to the large-scale planting of rice. Between 1990 and 2015, the CRCP of rice decreased in zone VIII, which did not give full play to the advantages of rich water resources, resulting in the inefficient use of water resources. Zones VI, VII, and VIII have a high level of economic development; thus, we should strictly control the unbridled expansion of construction land and appropriately increase the area set aside for rice planting. Due to the long rainy season and the threat of floods in these zones, we should strengthen water conservation and improve flood resistance capacity. In zone IX, water resources and climatic conditions are relatively good, which makes it suitable for growing crops. In 2015, the CRCPs of rice, corn, soybean, and tubers were 14.93%, 10.16%, 13.49%, and 41.77%, respectively. However, the crop yield per unit area and the multiple cropping index of this area were low, which is inconsistent with the superior natural conditions. In contrast, the CRCP, ∑SMI_PF, and ∑SMI_PW of tubers increased significantly in zone IX. Due to the lack of flat terrain, the possibilities for expanding farmland are limited. Therefore, the principal means of increasing crop production in zone IX is to carry out intensive management and improve the crop yield per unit area and the multiple cropping index. In addition, as zone IX is mostly a hilly plateau [60], improving water conservation measures is also a key to increased crop production.
Zones II, IV, V, and X are located in the northwest of China and are much affected by sandstorms. The limited development potential of farmland and water resources in these zones is not conducive to the growth of crops. In 2015, the CRCPs of the total production of the five crops in zones II, IV, V, and X were 4.36%, 5.21%, 3.48%, and 0.30%, respectively, which were low-yielding areas of crops. These four zones possess fragile ecological environments and their ability to self-regulate is weak. Overexploitation is leading to the unsustainable utilization of farmland and water resources and will thus increase the risk of deterioration of the ecological environment. Therefore, it is very important to ensure sustainable crop production that does not lead to environmental degradation. Specifically, the proportion of agricultural water consumption in Xinjiang province located in Zone V was as high as 94.66%. Zone V has a dry climate, large evaporation, and a high proportion of agricultural water consumption, which makes it suitable for planting crops with low water consumption such as tubers. For zone IV, which experiences serious soil erosion [61], the areas with sloping farmland need to be strictly controlled. The CRCP of corn in zone II increased by 3.29 pp, and, as a consequence, the contradiction between the demand for and the supply of limited water resources became much more apparent. The authorities responsible for Zone II need to pay more attention to developing a sustainable system of water-saving agriculture. With respect to zone X, the yield of five crops and farmland accounts for 0.30% and 0.55% of the national totals, respectively, and here, self-sufficient crop production needs to be developed.
4.3. Limitations and Prospects
Although our paper has identified the geographic imbalances between crop production and farmland-water resources, there are still the following limitations. First, data for the yields of rice, wheat, corn, soybean, and tubers were obtained at the county scale. There is a large amount of data within the county unit from the national scale and the update of the statistical yearbook of county scale data is lagging. Thus, the time horizon of our paper is somewhat outdated. However, our paper focuses on the geographic imbalances between crop production and farmland-water resources for an extended period, i.e., from 1990 onward and the results could meet research needs. Second, the spatiotemporal changes in the geographic imbalances have been identified but the driving factors have not been discussed. Finally, considering the availability of data, we have selected the total volume of water resources to reflect the abundance of regional water resources. In fact, irrigation, climate, crop types, and other factors will also affect water resources usage for crop growth, which is not analyzed in detail in our paper. Even so, our paper is still a good contribution to the study of farmland-water resources and agricultural production capacity in China.
5. Conclusions
In China, crop production plays a central role in ensuring the welfare of 1.4 billion people. The distribution of farmland-water resources is uneven in China and current understanding does not allow for a clear assessment of the geographic imbalances between the production of different types of crops and natural resources. In our paper, the spatial distribution of crop production and the geographic imbalances between crop production and farmland-water resources were examined using the spatial gravity center model and spatial mismatch index. From 1990 to 2015, the gravity center of the total production of crops moved to the north with abundant farmland resources. This change slightly alleviated the geographical imbalances between the total production of crops and farmland resources but exacerbated that of water resources. The geographical imbalances of different crops showed different change trends. In ∑SMI_PF, wheat, soybean, and tuber increased by 39.96%, 27.16%, and 12.22%, respectively, and corn and rice decreased by 10.31% and 1.34%, respectively. In ∑SMI_PW, wheat and rice increased by 10.01% and 9.86%, respectively, and tuber, soybean, and corn decreased by 9.54%, 4.71%, and 1.43%, respectively. Northeastern China and Huang-Huai-Hai Plain were the main crop production areas in China and the growth in production was at the cost of a significant expansion in the use of farmland, water, and other natural resources for agricultural purposes. The concentration of crop production increased the ∑SMI_PW of the two regions and water resources became the key factor in crop production. Our results reflect a good representation of the agricultural problems in China and provide operable recommendations for the efficient use of farmland-water resources and maintaining food security. In future studies, we intend to analyze the driving factors of the geographic imbalances in order to provide a scientific reference point for the sustainable development of agriculture in China.
Author Contributions
Conceptualization, methodology, D.L. and E.X.; validation, formal analysis, D.L.; resources, H.Z.; writing—original draft preparation, review, and editing, D.L.; supervision, project administration, funding acquisition, H.Z. and E.X. All authors have read and agreed to the published version of the manuscript.
Funding
This research was jointly supported by the Second Tibetan Plateau Scientific Expedition and Research Program (STEP) (2019QZKK0603), National Natural Science Foundations of China (41601095), and Youth Innovation Promotion Association CAS (2021052).
Institutional Review Board Statement
Not applicable.
Informed Consent Statement
Not applicable.
Data Availability Statement
The data presented in this study are available on request from the corresponding author.
Acknowledgments
We are thankful to the Second Tibetan Plateau Scientific Expedition and Research Program, the National Natural Science Foundations of China, and the Youth Innovation Promotion Association CAS for their financial support of the present study.
Conflicts of Interest
The authors declare no conflict of interest.
References
- Dong, F.; Yan, Q.; Wu, L.; Yang, F.; Wang, J.; Zhang, J.; Yan, S. Soil water storage and maize (Zea mays L.) yield under straw return and tillage practices. Crop Sci. 2022, 62, 382–396. [Google Scholar] [CrossRef]
- Porkka, M.; Gerten, D.; Schaphoff, S.; Siebert, S.; Kummu, M. Causes and trends of water scarcity in food production. Environ. Res. Lett. 2016, 11, 015001. [Google Scholar] [CrossRef] [Green Version]
- Wang, Y.; Cao, Y.; Feng, G.; Li, X.; Zhu, L.; Liu, S.; Coulter, J.A.; Gao, Q. Integrated Soil-Crop System Management with Organic Fertilizer Achieves Sustainable High Maize Yield and Nitrogen Use Efficiency in Northeast China Based on an 11-Year Field Study. Agronomy 2020, 10, 1078. [Google Scholar] [CrossRef]
- He, G.; Wang, Z.; Ma, X.; He, H.; Cao, H.; Wang, S.; Dai, J.; Luo, L.; Huang, M.; Malhi, S. Wheat Yield Affected by Soil Temperature and Water under Mulching in Dryland. Agron. J. 2017, 109, 2998–3006. [Google Scholar] [CrossRef]
- Mgolozeli, S.; Nciizah, A.D.; Wakindiki, I.I.C.; Mudau, F.N. Innovative Pro-Smallholder Farmers’ Permanent Mulch for Better Soil Quality and Food Security Under Conservation Agriculture. Agronomy 2020, 10, 605. [Google Scholar] [CrossRef] [Green Version]
- Smith, P.; Calvin, K.; Nkem, J.; Campbell, D.; Cherubini, F.; Grassi, G.; Korotkov, V.; Anh Le, H.; Lwasa, S.; McElwee, P.; et al. Which practices co-deliver food security, climate change mitigation and adaptation, and combat land degradation and desertification? Glob. Chang. Biol. 2020, 26, 1532–1575. [Google Scholar] [CrossRef] [Green Version]
- Kummu, M.; de Moel, H.; Porkka, M.; Siebert, S.; Varis, O.; Ward, P.J. Lost food, wasted resources: Global food supply chain losses and their impacts on freshwater, cropland, and fertiliser use. Sci. Total Environ. 2012, 438, 477–489. [Google Scholar] [CrossRef]
- UN. Transforming our World: The 2030 Agenda for Sustainable Development. 2015. Available online: https://sustainabledevelopment.un.org/post2015/transformingourworld/publication (accessed on 25 April 2022).
- FAO. FAO Database: Agriculture Production. Food and Agriculture Organization of the United Nations, Rome. 2020. Available online: www.fao.org/faostat/en/#data/QC (accessed on 26 April 2020).
- He, J.; Liu, Y.; Yu, Y.; Tang, W.; Xiang, W.; Liu, D. A counterfactual scenario simulation approach for assessing the impact of farmland preservation policies on urban sprawl and food security in a major grain-producing area of China. Appl. Geogr. 2013, 37, 127–138. [Google Scholar] [CrossRef]
- Xu, Y.; Li, J.; Wan, J. Agriculture and crop science in China: Innovation and sustainability. Crop J. 2017, 5, 95–99. [Google Scholar] [CrossRef]
- Guo, L.; Liu, M.; Tao, Y.; Zhang, Y.; Li, G.; Lin, S.; Dittert, K. Innovative water-saving ground cover rice production system increases yield with slight reduction in grain quality. Agric. Syst. 2020, 180, 102795. [Google Scholar] [CrossRef]
- Shi, W.; Tao, F.; Liu, J. Changes in quantity and quality of cropland and the implications for grain production in the Huang-Huai-Hai Plain of China. Food Secur. 2013, 5, 69–82. [Google Scholar] [CrossRef]
- Piao, S.; Ciais, P.; Huang, Y.; Shen, Z.; Peng, S.; Li, J.; Zhou, L.; Liu, H.; Ma, Y.; Ding, Y.; et al. The impacts of climate change on water resources and agriculture in China. Nature 2010, 467, 43–51. [Google Scholar] [CrossRef] [PubMed]
- Kang, S.; Hao, X.; Du, T.; Tong, L.; Su, X.; Lu, H.; Li, X.; Huo, Z.; Li, S.; Ding, R. Improving agricultural water productivity to ensure food security in China under changing environment: From research to practice. Agric. Water Manag. 2017, 179, 5–17. [Google Scholar] [CrossRef]
- Sun, S.; Wu, P.; Wang, Y.; Zhao, X. The virtual water content of major grain crops and virtual water flows between regions in China. J. Sci. Food Agric. 2013, 93, 1427–1437. [Google Scholar] [CrossRef]
- Dalin, C.; Qiu, H.; Hanasaki, N.; Mauzerall, D.L.; Rodriguez-Iturbe, I. Balancing water resource conservation and food security in China. Proc. Natl. Acad. Sci. USA 2015, 112, 4588–4593. [Google Scholar] [CrossRef] [Green Version]
- Deng, A.; Chen, C.; Feng, J.; Chen, J.; Zhang, W. Cropping system innovation for coping with climatic warming in China. Crop. J. 2017, 5, 136–150. [Google Scholar] [CrossRef] [Green Version]
- Wang, J.; Zhang, Z.; Liu, Y. Spatial shifts in grain production increases in China and implications for food security. Land Use Policy 2018, 74, 204–213. [Google Scholar] [CrossRef]
- Wei, X.; Zhang, Z.; Wang, P.; Tao, F. Recent patterns of production for the main cereal grains: Implications for food security in China. Reg. Environ. Change 2017, 17, 105–116. [Google Scholar] [CrossRef]
- Yan, H.; Liu, F.; Qin, Y.; Niu, Z.; Doughty, R.; Xiao, X. Tracking the spatio-temporal change of cropping intensity in China during 2000–2015. Environ. Res. Lett. 2019, 14, 035008. [Google Scholar] [CrossRef]
- FAO. The Future of Food and Agriculture—Trends and Challenges. Rome. 2017. Available online: https://www.fao.org/3/i6583e/i6583e.pdf (accessed on 2 May 2022).
- FAO. The State of the World’s Land and Water Resources for Food and Agriculture (SOLAW)—Managing Systems at Risk. Food and Agriculture Organization of the United Nations, Rome and Earthscan, London. 2011. Available online: https://www.fao.org/3/i1688e/i1688e00.htm (accessed on 2 May 2022).
- Aznar-Sanchez, J.A.; Belmonte-Urena, L.J.; Velasco-Munoz, J.F.; Valera, D.L. Aquifer Sustainability and the Use of Desalinated Seawater for Greenhouse Irrigation in the Campo de Níjar, Southeast Spain. Int. J. Environ. Res. Public Health 2019, 16, 898. [Google Scholar] [CrossRef] [Green Version]
- Fader, M.; Gerten, D.; Krause, M.; Lucht, W.; Cramer, W. Spatial decoupling of agricultural production and consumption: Quantifying dependences of countries on food imports due to domestic land and water constraints. Environ. Res. Lett. 2013, 8, 014046. [Google Scholar] [CrossRef]
- Deng, X.; Huang, J.; Rozelle, S.; Zhang, J.; Li, Z. Impact of urbanization on cultivated land changes in China. Land Use Policy 2015, 45, 1–7. [Google Scholar] [CrossRef]
- Jiang, Y.; Yin, X.; Wang, X.; Zhang, L.; Lu, Z.; Lei, Y.; Chu, Q.; Chen, F. Impacts of global warming on the cropping systems of China under technical improvements from 1961 to 2016. Agron. J. 2021, 113, 187–199. [Google Scholar] [CrossRef]
- Long, H.; Ge, D.; Zhang, Y.; Tu, S.; Qu, Y.; Ma, L. Changing man-land interrelations in China’s farming area under urbanization and its implications for food security. J. Environ. Manag. 2018, 209, 440–451. [Google Scholar] [CrossRef]
- Li, T.; Long, H.; Zhang, Y.; Tu, S.; Ge, D.; Li, Y.; Hu, B. Analysis of the spatial mismatch of grain production and farmland resources in China based on the potential crop rotation system. Land Use Policy 2017, 60, 26–36. [Google Scholar] [CrossRef]
- Chen, H.; Wang, J.; Huang, J. Policy support, social capital, and farmers’ adaptation to drought in China. Glob. Environ. Chang. 2014, 24, 193–202. [Google Scholar] [CrossRef]
- Wang, J.; Li, Y.; Huang, J.; Yan, T.; Sun, T. Growing water scarcity, food security and government responses in China. Glob. Food Secur. Agric. 2017, 14, 9–17. [Google Scholar] [CrossRef]
- Wang, S.; Hu, Y.; Yuan, R.; Feng, W.; Pan, Y.; Yang, Y. Ensuring water security, food security, and clean water in the North China Plain-Conflicting strategies. Curr. Opin. Environ. Sust. 2019, 40, 63–71. [Google Scholar] [CrossRef]
- Wada, Y.; van Beek, L.P.H.; van Kempen, C.M.; Reckman, J.W.T.M.; Vasak, S.; Bierkens, M.F.P. Global depletion of groundwater resources. Geophys. Res. Lett. 2010, 37, L20402. [Google Scholar] [CrossRef] [Green Version]
- He, G.; Zhao, Y.; Wang, L.; Jiang, S.; Zhu, Y. China’s food security challenge: Effects of food habit changes on requirements for arable land and water. J. Clean. Prod. 2019, 229, 739–750. [Google Scholar] [CrossRef]
- Cao, X.; Wang, Y.; Wu, P.; Zhao, X.; Wang, J. An evaluation of the water utilization and grain production of irrigated and rain-fed croplands in China. Sci. Total Environ. 2015, 529, 10–20. [Google Scholar] [CrossRef] [PubMed]
- Kan, Z.; Liu, Q.; He, C.; Jing, Z.; Virk, A.L.; Qi, J.; Zhao, X.; Zhang, H. Responses of grain yield and water use efficiency of winter wheat to tillage in the North China Plain. Field Crops Res. 2020, 249, 107760. [Google Scholar] [CrossRef]
- Li, J.; Zhang, Z.; Liu, Y.; Yao, C.; Song, W.; Xu, X.; Zhang, M.; Zhou, X.; Gao, Y.; Wang, Z.; et al. Effects of micro-sprinkling with different irrigation amount on grain yield and water use efficiency of winter wheat in the North China Plain. Agric. Water Manag. 2019, 224, 105736. [Google Scholar] [CrossRef]
- Chen, H.; Yu, C.; Li, C.; Xin, Q.; Huang, X.; Zhang, J.; Yue, Y.; Huang, G.; Li, X.; Wang, W. Modeling the impacts of water and fertilizer management on the ecosystem service of rice rotated cropping systems in China. Agric. Ecosyst. Environ. 2016, 219, 49–57. [Google Scholar] [CrossRef]
- Liu, G.; Zhang, L.; Zhang, Q.; Musyimi, Z. The response of grain production to changes in quantity and quality of cropland in Yangtze River Delta, China. J. Sci. Food Agric. 2015, 95, 480–489. [Google Scholar] [CrossRef]
- Meier, T.; Christen, O.; Semler, E.; Jahreis, G.; Voget-Kleschin, L.; Schrode, A.; Artmann, M. Balancing virtual land imports by a shift in the diet. Using a land balance approach to assess the sustainability of food consumption. Germany as an example. Appetite 2014, 74, 20–34. [Google Scholar] [CrossRef]
- Sun, S.; Wang, Y.; Engel, B.A.; Wu, P. Effects of virtual water flow on regional water resources stress: A case study of grain in China. Sci. Total Environ. 2016, 550, 871–879. [Google Scholar] [CrossRef]
- Wu, S.; Ben, P.; Chen, D.; Chen, J.; Tong, G.; Yuan, Y.; Xu, B. Virtual land, water, and carbon flow in the inter-province trade of staple crops in China. Resour. Conserv. Recycl. 2018, 136, 179–186. [Google Scholar] [CrossRef]
- Chai, J.; Wang, Z.; Yang, J.; Zhang, L. Analysis for spatial-temporal changes of grain production and farmland resource: Evidence from Hubei Province, central China. J. Clean. Prod. 2019, 207, 474–482. [Google Scholar] [CrossRef]
- Li, Y.; Li, X.; Tan, M.; Wang, X.; Xin, L. The impact of cultivated land spatial shift on food crop production in China, 1990–2010. Land Degrad. Dev. 2018, 29, 1652–1659. [Google Scholar] [CrossRef]
- Chu, Y.; Shen, Y.; Yuan, Z. Water footprint of crop production for different crop structures in the Hebei southern plain, North China. Hydrol. Earth Syst. Sci. 2017, 21, 3061–3069. [Google Scholar] [CrossRef] [Green Version]
- Ha, N.; Feike, T.; Angenendt, E.; Xiao, H.; Bahrs, E. Impact of farm management diversity on the environmental and economic performance of the wheat-maize cropping system in the North China Plain. Int. J. Agric. Sustain. 2015, 13, 350–366. [Google Scholar] [CrossRef]
- Zhuang, J.; Xu, S.; Li, G.; Zhang, Y.; Wu, J.; Liu, J. The Influence of Meteorological Factors on Wheat and Rice Yields in China. Crop Sci. 2018, 58, 837–852. [Google Scholar] [CrossRef] [Green Version]
- Xu, E. Zoning of Agricultural Resource and Environment in China. Strateg. Study Chin. Acad. Eng. 2018, 20, 57–62. [Google Scholar] [CrossRef]
- Zhong, H.; Liu, Z.; Wang, J. Understanding impacts of cropland pattern dynamics on grain production in China: A integrated analysis by fusing statistical data and satellite-observed data. J. Environ. Manag. 2022, 313, 114988. [Google Scholar] [CrossRef] [PubMed]
- Pan, J.; Chen, Y.; Zhang, Y.; Chen, M.; Fennell, S.; Luan, B.; Wang, F.; Meng, D.; Liu, Y.; Jiao, L.; et al. Spatial-temporal dynamics of grain yield and the potential driving factors at the county level in China. J. Clean. Prod. 2020, 255, 120312. [Google Scholar] [CrossRef]
- Li, J.; Li, Z. Physical limitations and challenges to Grain Security in China. Food Secur. 2014, 6, 159–167. [Google Scholar] [CrossRef]
- Lu, W.; Chen, N.; Qian, W. Modeling the effects of urbanization on grain production and consumption in China. J. Integr. Agric. 2017, 16, 1393–1405. [Google Scholar] [CrossRef] [Green Version]
- Jiao, L. Water Shortages Loom as Northern China’s Aquifers Are Sucked Dry. Science 2010, 328, 1462–1463. [Google Scholar] [CrossRef]
- Cao, G.; Zheng, C.; Scanlon, B.R.; Liu, J.; Li, W. Use of flow modeling to assess sustainability of groundwater resources in the North China Plain. Water Resour. Res. 2013, 49, 159–175. [Google Scholar] [CrossRef]
- Zhang, Q.; Yu, H.; Sun, P.; Singh, V.P.; Shi, P. Multisource data based agricultural drought monitoring and agricultural loss in China. Glob. Planet. Chang. 2019, 172, 298–306. [Google Scholar] [CrossRef]
- Xin, F.; Xiao, X.; Dong, J.; Zhang, G.; Zhang, Y.; Wu, X.; Li, X.; Zou, Z.; Ma, J.; Du, G.; et al. Large increases of paddy rice area, gross primary production, and grain production in Northeast China during 2000–2017. Sci. Total Environ. 2020, 711, 135183. [Google Scholar] [CrossRef] [PubMed]
- Bouman, B.A.M.; Humphreys, E.; Tuong, T.P.; Barker, R. Rice and water. Adv. Agron. 2007, 92, 187–237. [Google Scholar] [CrossRef]
- Jin, X.; Zhang, Z.; Wu, X.; Xiang, X.; Sun, W.; Bai, Q.; Zhou, Y. Co-ordination of land exploitation, exploitable farmland reserves and national planning in China. Land Use Policy 2016, 57, 682–693. [Google Scholar] [CrossRef]
- Li, W.; Wang, D.; Liu, S.; Zhu, Y.; Yan, Z. Reclamation of Cultivated Land Reserves in Northeast China: Indigenous Ecological Insecurity Underlying National Food Security. Int. J. Environ. Res. Public Health 2020, 17, 1211. [Google Scholar] [CrossRef] [PubMed] [Green Version]
- Xu, H.; Zhang, J.; Wei, Y.; Dai, J.; Wang, Y. Bedrock erosion due to hoeing as tillage technique in a hilly agricultural landscape, southwest China. Earth Surf. Proc. Land 2020, 45, 1418–1429. [Google Scholar] [CrossRef]
- Liang, Y.; Jiao, J.; Tang, B.; Cao, B.; Li, H. Response of runoff and soil erosion to erosive rainstorm events and vegetation restoration on abandoned slope farmland in the Loess Plateau region, China. J. Hydrol. 2020, 584, 124694. [Google Scholar] [CrossRef]
Figure 1.
Location of the study area (Chinese mainland).

Figure 2.
Spatial distribution of crop production in 2015 (CRCP represents the concentration ratio of crop production).
Figure 2.
Spatial distribution of crop production in 2015 (CRCP represents the concentration ratio of crop production).

Figure 3.
Spatial distribution of crop production changes in the period 1990–2015.

Figure 4.
Geographic imbalances between farmland and water resources in 2015.

Figure 5.
Trajectory of the gravity center of crop production in the period 1990–2015.

Figure 6.
Geographic imbalances between crop production and farmland resources in the period 1990–2015.
Figure 6.
Geographic imbalances between crop production and farmland resources in the period 1990–2015.

Figure 7.
Geographic imbalances between crop production and water resources in the period 1990–2015.
Figure 7.
Geographic imbalances between crop production and water resources in the period 1990–2015.

Figure 8.
Changes in geographical imbalance. (a) Changes of ∑SMI_PF on a provincial scale from 1990 to 2015; (b) Changes of ∑SMI_PF on a provincial scale from 1990 to 2020; (c) Changes of ∑SMI_PF on a county scale from 1990 to 2015; (d) Changes of ∑SMI_PW on a provincial scale from 1990 to 2015; (e) Changes of ∑SMI_PW on a provincial scale from 1990 to 2020; (f) Changes of ∑SMI_PW on a county scale from 1990 to 2015. (∑SMI_PF: Geographic imbalances between crop production and farmland resources; ∑SMI_PW: Geographic imbalances between crop production and water resources).

Figure 9.
Changes in the degree of geographic imbalance between crop production and farmland and water resources in the period 1990–2015.
Figure 9.
Changes in the degree of geographic imbalance between crop production and farmland and water resources in the period 1990–2015.

Publisher’s Note: MDPI stays neutral with regard to jurisdictional claims in published maps and institutional affiliations. |
© 2022 by the authors. Licensee MDPI, Basel, Switzerland. This article is an open access article distributed under the terms and conditions of the Creative Commons Attribution (CC BY) license (https://creativecommons.org/licenses/by/4.0/).
Share and Cite
MDPI and ACS Style
Li, D.; Zhang, H.; Xu, E. Spatiotemporal Changes in the Geographic Imbalances between Crop Production and Farmland-Water Resources in China. Agronomy 2022, 12, 1111. https://doi.org/10.3390/agronomy12051111
AMA Style
Li D, Zhang H, Xu E. Spatiotemporal Changes in the Geographic Imbalances between Crop Production and Farmland-Water Resources in China. Agronomy. 2022; 12(5):1111. https://doi.org/10.3390/agronomy12051111
Chicago/Turabian StyleLi, Dajing, Hongqi Zhang, and Erqi Xu. 2022. "Spatiotemporal Changes in the Geographic Imbalances between Crop Production and Farmland-Water Resources in China" Agronomy 12, no. 5: 1111. https://doi.org/10.3390/agronomy12051111
Note that from the first issue of 2016, this journal uses article numbers instead of page numbers. See further details here.