Article

Phenotypic Variation of Sorghum Accessions for Grain Yield and Quality Traits

1
Agricultural Research Council—Grain Crops, Private Bag X1251, Potchefstroom 2520, South Africa
2
Department of Life and Consumer Sciences, University of South Africa, Private Bag X6, Florida 1710, South Africa
3
Department of Agriculture and Animal Health, University of South Africa, Private Bag X6, Florida 1710, South Africa
4
Agricultural Research Council—Small Grain, Private Bag X29, Bethlehem 9700, South Africa
*
Author to whom correspondence should be addressed.
Agronomy 2022, 12(12), 3089; https://doi.org/10.3390/agronomy12123089
Submission received: 1 November 2022 / Revised: 24 November 2022 / Accepted: 1 December 2022 / Published: 6 December 2022
(This article belongs to the Topic Plant Metabolism under Stress)

Abstract

:
Millions of people depend on sorghum (Sorghum bicolor (L.) Moench) as a staple food crop. Due to the ever-changing climate, more focus should be placed on sorghum as it can grow in environments that are marginal for maize (Zea mays L.) and other grain crops. Identification of unique accessions with desirable phenotypic variations allow plant breeders to use the accessions as parental material in a breeding program. The objectives of this study were to determine the extent of diversity in sorghum accessions based on grain yield and quality traits, as well as to identify accessions with high grain yield. One hundred sorghum accessions were evaluated at Potchefstroom (South Africa) in two consecutive growing seasons. The experiment was laid out in a 20 × 5 alpha lattice design with three replications. ANOVA showed highly significant (p = 0.01) variation among the accessions for all traits. There was a positive correlation (r = 0.209) between starch and grain yield. Seven high-yielding accessions with high protein and seven accessions with high starch were identified. These accessions could be used for improving yield, protein and starch in the grain. Tannin content ranged from zero to 24.40 mgCE/100 mg; 75 accessions were characterized as type I. Seven accessions were characterized as type II, and 18 accessions were characterized as type III. The 100 sorghum accessions were grouped into five distinct clusters that offer a wide range of phenotypic variation for the traits studied.

1. Introduction

In developing countries, especially Africa, millions of people depend on sorghum as an important food crop. Sorghum has a high nutritional value and is one of the main sources of carbohydrates, proteins, minerals, fiber and vitamins. It is traditionally used in various food products [1,2,3]. In South Africa, sorghum meal is often eaten as a stiff porridge which is referred to as Mabele, and also known as brown porridge [4,5,6]. Sorghum is adapted to a wide range of environmental and climatic conditions and is known to be drought tolerant. Due to the ever-changing climatic conditions around the world, and also for soils that are marginal for maize and other grain crops, sorghum offers better adaptive opportunities.
Increased levels of malnutrition have been reported in some areas in sub-Saharan Africa where the cultivation of crops with good nutritional value can form part of the solution [7,8,9]. To close the gap between the demand and supply of food with good nutrition, crops with potential adaptation need to be screened and evaluated for traits of interest before the intensive cultivation of genotypes with high yielding potential. Sorghum is one such crop, ranking fifth worldwide, and has the ability to serve as a staple food not only to millions of people, but also to those with gluten allergens and people with diabetes [10,11,12]. Sorghum has high protein content, starch and minerals. However, the levels of these nutritional quality traits vary with genotypes. Hence, there is a need to screen and evaluate accessions kept in the national gene banks to identify the best candidates for future use in breeding and crop improvement programs.
The nutritional quality traits that are commonly assessed on various sorghum genotypes include protein, starch, moisture and tannin contents. Sorghum has approximately 70% starch content, making it a good energy source [1]. Sorghum starch does not contain gluten, making it an alternative grain for gluten-sensitive people. Protein content in sorghum grain generally ranges from 6–18%, which is slightly higher than that of maize (8–11%). However, these percentages vary depending on the variety and growing conditions [13]. Sorghum genotypes are classified into three types, depending on the level of grain tannin content, namely Type I, Type II and Type III. The presence of a high level of tannin content in sorghum grain makes sorghum starch and protein have poor digestibility [14], as they increase precipitation when tannins bind to proteins and various other organic compounds including amino acids and alkaloids [15,16]. Although higher levels of tannins might have disadvantages, they also have advantages in protecting the grain from grain mold and bird damage. Sorghum tannins have also been used in many traditional products, which include porridges and alcoholic beverages [17,18].
Understanding the extent of nutritional quality variation present in the South African National Sorghum Germplasm Bank forms the pre-requisite for successful breeding to improve nutritional quality and fully exploit the genetic variation for grain yield and component related traits such as grain moisture, grain protein, starch and tannin contents. Knowledge of nutritional diversity information could also be useful in increasing the types and levels of nutritional composition in commercial sorghum cultivars through breeding. Therefore, the main objective of the current study was to determine (1) the extent of phenotypic diversity in sorghum accessions based on grain yield and quality traits, as well as (2) to identify accessions with high grain yield.

2. Materials and Methods

2.1. Plant Material and Experimental Site

One hundred sorghum accessions used for morpho-agronomic diversity analysis [19] were used to assess the levels of grain quality traits and how they relate with grain yield. These accessions were randomly selected from over 4000 sorghum accessions maintained at the National Sorghum Germplasm Bank at Agricultural Research Council—Grain Crops, Potchefstroom [19]. The field trials were conducted over two consecutive growing seasons, 2016/17 and 2017/18 at the Agricultural Research Council Experimental Farm, Potchefstroom (26°43′00″ S latitude and 27°06′00″ E longitude, 1335 m above sea level). The area receives an annual average rainfall of 615 mm with an average temperature of 16.9 °C (ranging from 9.61 °C to 25.48 °C). In each season, the experiment was laid out in a 20 × 5 alpha lattice design with three replications. Seeds of each accession were planted in single 5 m long rows, with 0.75 m inter-row spacing. Fertilizer application and trial management were performed according to the recommendations for the area.

2.2. Yield Determination

Before heading, five plants per accession in each replication were tagged for data collection. Because the studied accessions have different physiological maturity, they were left to dry in the field and harvested when uniformly dry. Soon after field harvest, the panicles were further dried in a drier for 24 h. Grain yield per panicle (g) was measured by taking the average grain weight of five representative panicles of the main plants in the plot, then the average yield of each plot in the three replicates was obtained.

2.3. Moisture, Protein, and Starch Content Determination

The bulk grain samples from five randomly selected plants in each accession (used for grain yield) were used for the determination of moisture, starch and protein. Moisture, starch and protein contents were analyzed using the seed phenotyping instrument NIR DA 7250 Perten (PerkinElmer, Waltham, MA, USA). The grains from each accession were placed in a sample plate and the whole grain was analyzed for moisture, starch and crude protein contents. Each accession was analyzed in triplicate.
The instrument exploits the absorbance of light from the near-infrared region (700–2500 nm) by various chemical bonds to estimate sample concentration for a given chemical constituent of interest. The light beam of near-infrared wavelengths, which differ in width between instruments of different manufacturers, is emitted through a sample and is differentially absorbed based on the sample’s distinct chemical composition. The wavelengths that are not absorbed by the sample are reflected back to a detector on the NIR instrument, resulting in a unique fingerprint for each sample. These spectral fingerprints are then modelled against predetermined reference chemistry values of the same samples to develop algorithms, called calibrations, that are capable of predicting sample concentration in minutes or seconds. The calibrations used in this study were developed and updated by the manufacturer for protein and starch, having R-squared (R2) values of 0.96 for protein and 0.89 for starch on 390 diverse sorghum grain accessions.

2.4. Tannin Content Determination

Tannin content was determined by the Modified Vanillin HCl method. The grain sample for each accession was milled using a Cyclotec milling machine (FOSS, Hillerød, Sweden) for tannin extraction and determination [20]. Tannins were extracted in duplicate, in which 0.5 g flour sample was weighed into 50 mL centrifuge tubes, and 25 mL of 1% concentrated HCl in methanol was added. The extraction was conducted for 20 min at room temperature. After extraction, the samples were centrifuged for 10 min at 1200× g to obtain the supernatant. Extract determination was performed in triplicate for both sample and standard, in which 1 mL of extract and/or catechin standard was transferred to test tubes containing 5 mL mixed A and B Vanillin—HCl reagent [21]. The samples were vortexed and incubated at room temperature for 20 min. Color blank was also determined in triplicate for both sample and standard. One milliliter of extract and catechin standard was transferred to test tubes containing 5 mL of 4% HCl in methanol and incubated at room temperature for 20 min. The spectrophotometer was then blanked with a reagent blank (mixed Vanillin HCl reagent) and the absorbance of the samples, catechin standard and the color blank was read at 500 nm.

2.5. Data Analysis

Analysis of variance was performed on the measured traits with GenStat 18th edition [22] for both growing seasons, except for tannin content which was analyzed for the 2017/18 season. This was followed by the multiple comparison or posthoc test (Bonferroni). The percentage contribution of each trait to the total genetic variation was also performed through principal component analysis (PCA) using GenStat software. Pearson’s correlation test was carried out to examine the degree of association between grain yield, moisture, crude protein, total starch and tannin contents using IBM SPSS Statistics 24 software [23]. The genetic relationships among sorghum accessions based on Euclidean distances as similarity measures and the unweighted pair-group method with arithmetic averages (UPGMA) was analyzed using GenStat 18th edition software [22]. The average linkage method overcomes the limitations presented by both single and complete linkage methods where the chaining effect result from the analysis of both methods (single and complete), which negatively impacts the overall result of the cluster analysis if there exists some noise in the dataset. Therefore, the average linkage takes the average of the distance between various data point pairs as the distance between the clusters. This makes average linkage the method of choice in the current study. Variance components for genotype and genotype-environment were used to obtain estimates of the broad sense heritability (h2B) as follows: h2B = σ2g/[σ2g + (σ2ge/e) + (σ2e/re)] or 1-[MSge/MSg], where MSg and MSge represent the genotype and genotype-environment interaction mean squares, respectively, σ2g is the genotypic variance = (MSgenotype − MSge)/re, σ2ge is the G x E interaction variance = (MSge − MSe)/r, σ2e is the error variance = MSe, r is number of replications and e is the number of environments [24].

3. Results

3.1. Protein, Starch, Moisture and Grain Yield under First and Second Growing Seasons

For the first growing season, the accessions had a high mean protein content of 14.09%, in which SA0597 recorded the highest protein content (16.75%), while SA0390 recorded the lowest protein content (10.28%). In the second growing season, accessions recorded lower mean protein content of 13.82%. Accession SA1278 recorded the highest protein content (17.84%), while SA0109 had the lowest protein content (9.90%). It was noted that SA0390 was among the accessions with lowest protein content in both seasons. Furthermore, starch content ranged from 44.89% to 71.62%, with a mean of 61.80% for the first season. The highest starch content was recorded for accession SA0109 (71.62%), while accession SA0560 recorded the lowest (44.89%). Like protein in the second season, the accessions recorded lower means for starch content of 61.00%. Accession SA2721 recorded the highest starch content of 67.61%. On the other hand, accession SA0560 recorded the lowest starch content of 48.90%. It was also interesting to note that SA0560 recorded the lowest starch content in both seasons (data not shown).
In the first growing season, accession SA2097 recorded the highest grain yield (109 g) per panicle. At the same time, SA1278 had the lowest (31.2 g/panicle), with an overall mean of 58.8 g/panicle. In the second growing season, accession SA0954 recorded the highest grain yield (128.46 g/panicle), while SA0347 was the lowest yielder with 22.53 g/panicle and the average mean yield was 71.76 g/panicle. Moreover, the accessions had an average moisture content of 10.50% in the first growing season. Accession SA0020 recorded the highest moisture of 11.47%, while SA0597 recorded the lowest moisture content of 9.13%. For grain moisture content in the second planting season, accession Mmamolokwane recorded the highest (11.50%), while SA1732 recorded the lowest moisture content of 9.23%. Unlike protein and starch, the grain yield and moisture content in the second planting season was higher than the values obtained in the first growing season (data only shown for combined data).

3.2. Analysis of Variance

Analysis of variance across the two seasons showed highly significant (p < 0.01) variations among the 100 sorghum accessions for grain yield, moisture, starch and protein content (Table 1). Season showed highly significant differences for protein, starch, grain yield and moisture content. Genotype showed highly significant differences for protein, tannin and starch contents, grain yield, and moisture. The genotype by season interaction revealed highly significant differences for protein, starch, grain yield and moisture content. Replication showed non-significant differences for protein, starch, tannin and moisture, except for grain yield which was highly significant. The trait with the highest heritability was the grain yield h2B = 70.00%, whilst protein and starch showed moderate heritability estimates (40.00% < h2B < 60.00%).
Grain yield ranged from 36.7 g/panicle in accession SA0530 to 114.9 g/panicle in SA2097, with an average of 64.03 g/panicle. Protein content ranged from 10.41% to 16.59% with an average of 13.95%. The accessions that recorded the highest protein content were SA1278 (16.59%), SA0615 (16.52%), SA0671 (16.22%) and SA1092 (16.20%). Moreover, starch content had an average mean of 61.0%, with a range of 48.90% to 67.61%. Accessions SA2721, SA0213, SA2748 and SA0109 recorded the highest starch content of 67.61%, 67.43%, 66.97% and 66.58%, respectively. Furthermore, tannin content had an average mean of 2.24 mg CE/100 mg with the range of zero in 34 accessions to 24.40 mg CE/100 mg in SA0223. Moisture content ranged from 9.36% in SA1278 to 11.28% in SA0037 and SA0213, with an average of 10.37% (Table 2).

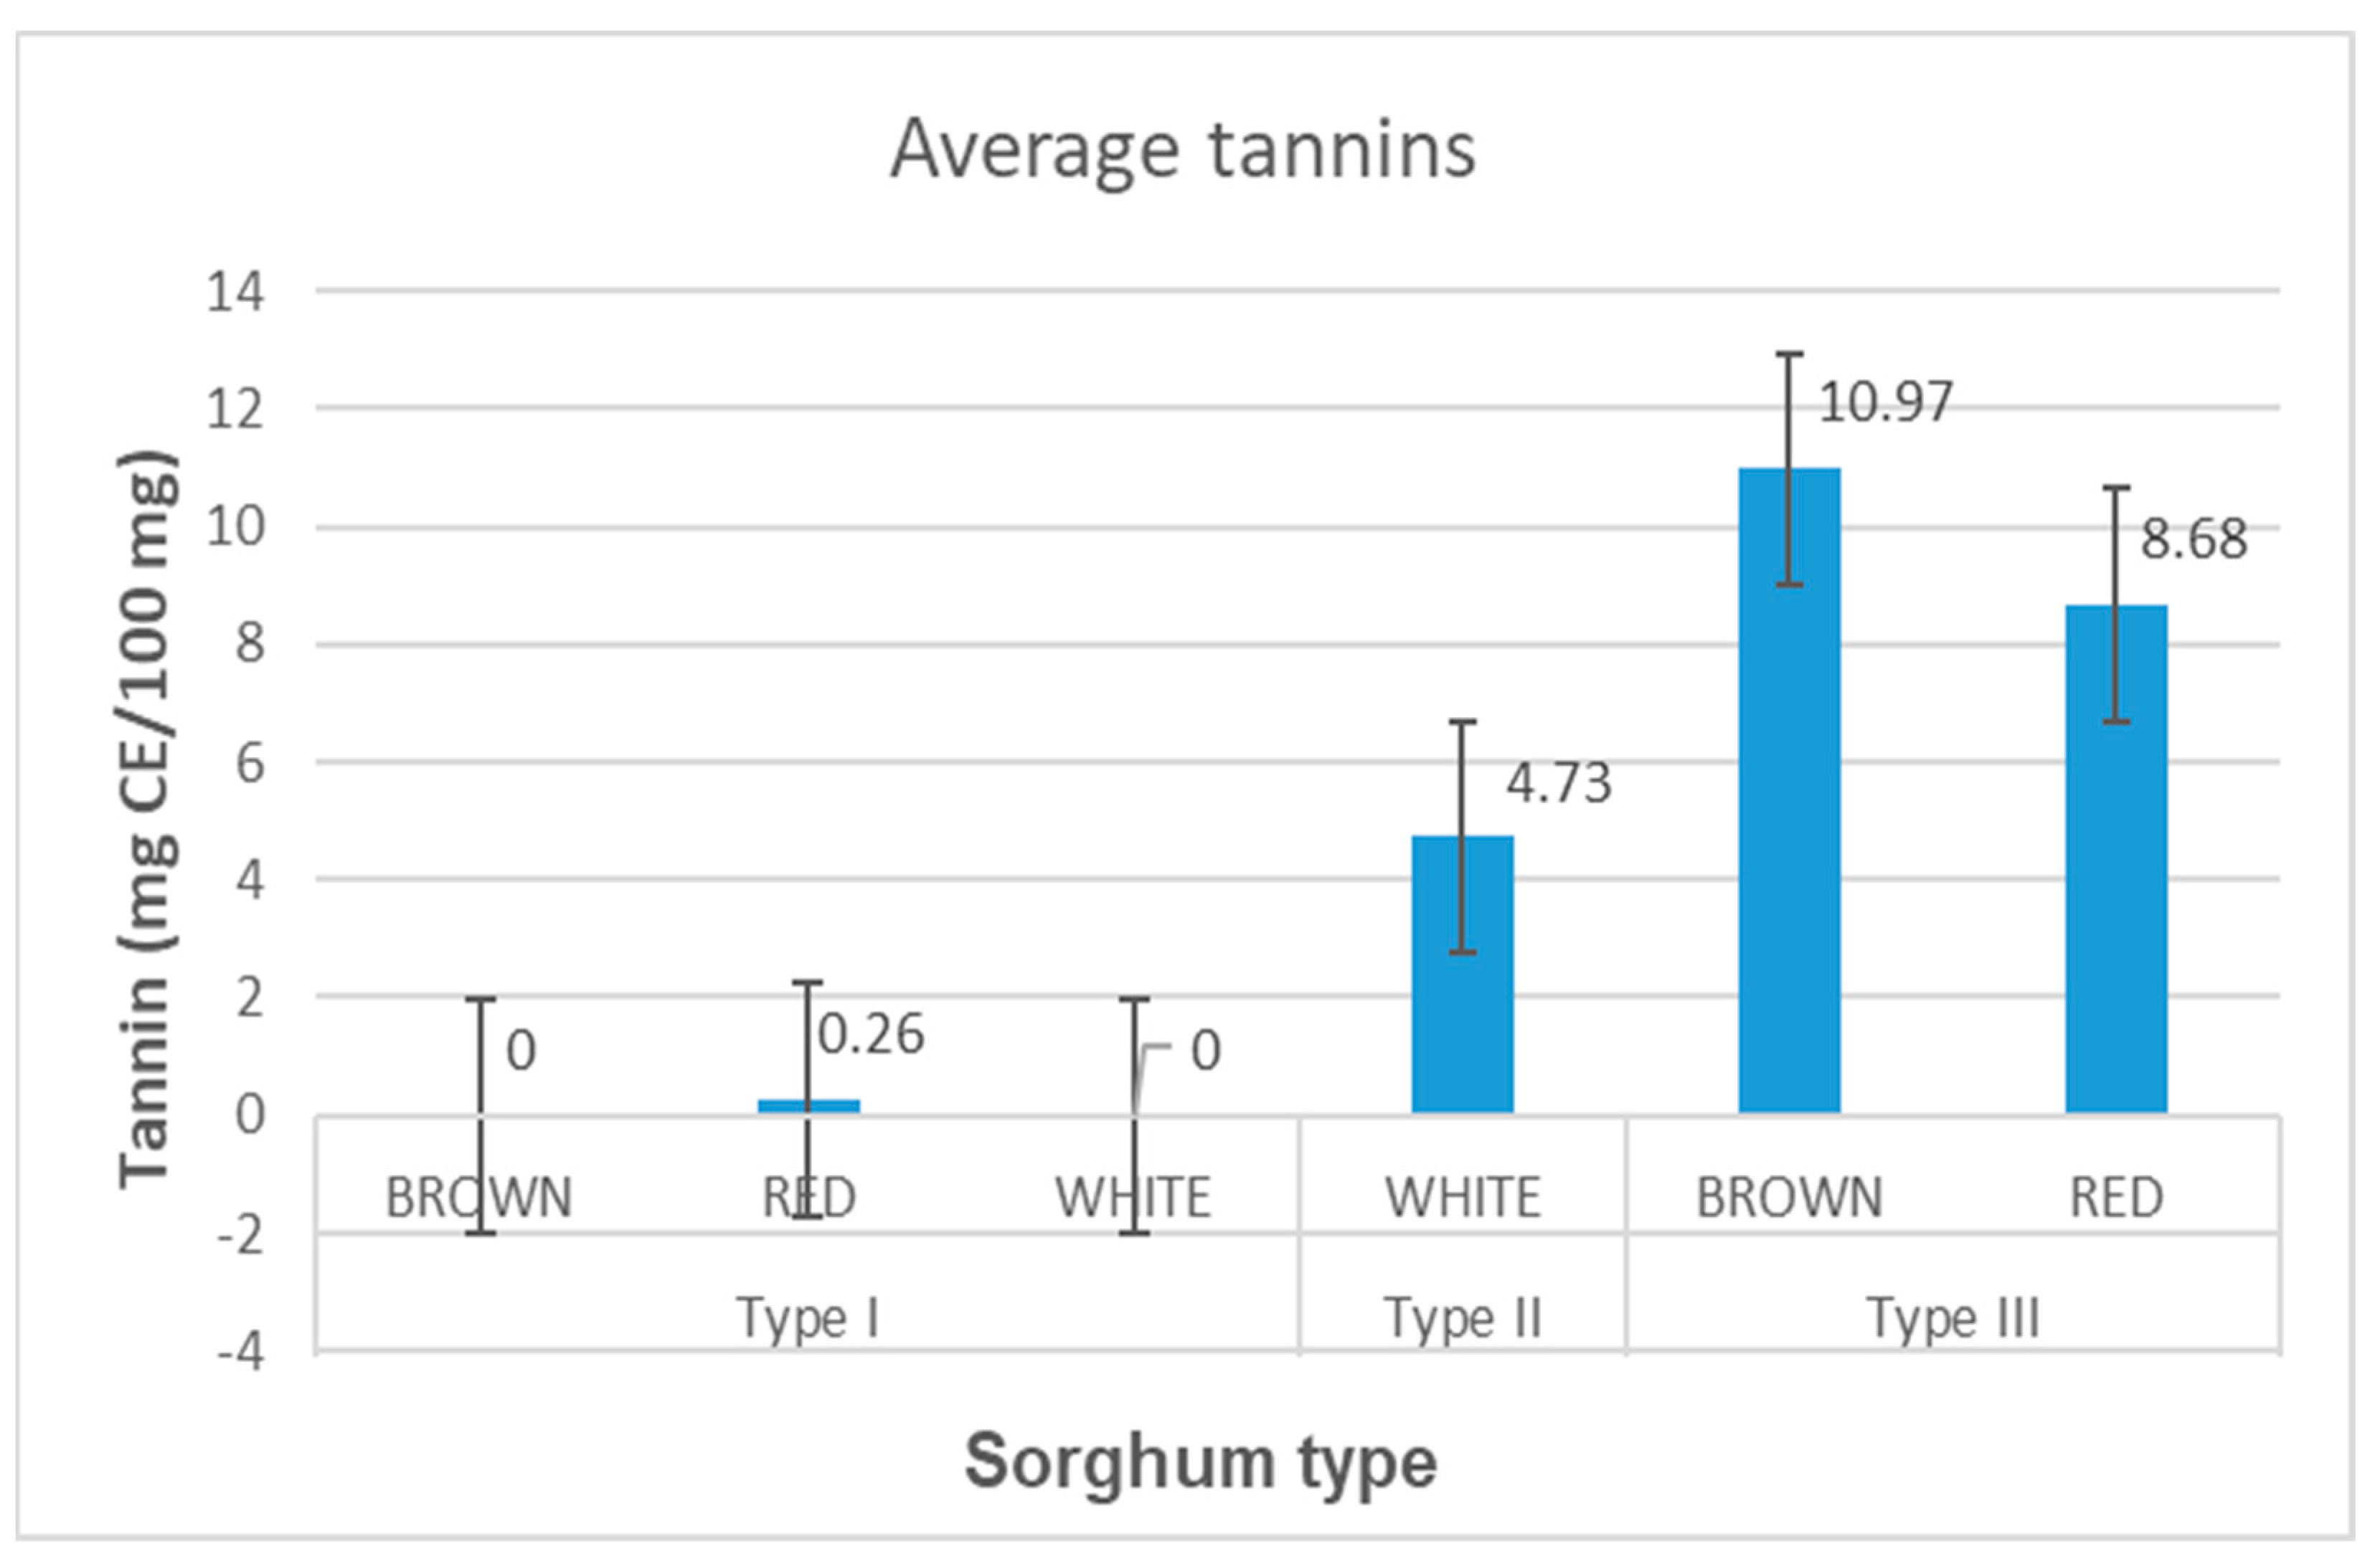
3.3. Tannin Content, Grain Color and Sorghum Type Characterization

Tannin content ranged from zero to 24.40 mg CE/100 mg. Most accessions (75) were characterized as type I sorghums in which 39 had white grain color, 28 had brown grain color and only five had red grains. Tannin contents in this group ranged from zero to 0.90 mg CE/100 mg. Notably, 34 accessions in type I sorghums recorded zero or no tannin content. Only seven accessions were characterized as type II sorghums and consisted of only white grains. Tannin contents in this group ranged from 1.04 mg CE/100 mg to 11.32 mg CE/100 mg. Furthermore, 18 accessions were characterized as type III sorghums which consisted of colored grains (17 brown and one red). Tannin content in this group ranged from 1.01 mg CE/100 mg to as high as 24.40 mg CE/100 mg (Table 2). The list of all accessions is shown in Supplementary Table S1.
The average tannin contents per sorghum type and grain color are presented in Figure 1. Brown and white grains recorded zero tannins while red grains recorded 0.26 mg CE/100 mg in type I sorghums. Type I sorghums do not have tannins or at least contain slight tannins, below 1 mg CE/100 mg. White grains in type II sorghum recorded average tannins of 4.73 mg CE/100 mg. In type III sorghum, brown grain recorded the highest tannin content of 10.97 mg CE/100 mg, followed by red grains (8.68 mg CE/100 mg).

3.4. Correlation Coefficients

The correlation among the five traits evaluated is presented in Table 3. Positive and highly significant correlations (p < 0.01) were recorded for starch and moisture contents, and significant correlation was observed between starch and grain yield. Negative and highly significant correlations were observed between protein and grain yield, starch, tannin and moisture contents. Negative and highly significant correlation was also observed for starch and tannin. The highest negative and significant correlation was observed between protein and moisture contents (r = −0.609), while the lowest negative and significant correlation was observed between starch and tannin content (r = −0.265). Furthermore, the highest positive and significant correlation was observed between grain yield and moisture (0.440).

3.5. Potential Accessions Selected for Future Breeding

From 100 sorghum accessions evaluated in the current study, 17 high yielding accessions were identified as potential value for future sorghum breeding (Table 4). The accessions were selected based on their varied end usage and/or quality trait (starch, protein and tannin). Seven accessions were selected for starch content and had over 64% starch, with SA0213 recording the highest starch content of 67.43%. For crude protein, seven accessions were selected and had over 14% protein content, with SA0572 recording the highest protein content of 16.02%. It was interesting to note that the 14 accessions selected for both starch and protein contents had no tannins or very little tannins (<1 mg CE/100 mg). Only three accessions were selected for tannin content and had over 9 mg CE/100 mg of tannin content, with SA3710 recording the highest tannin content of 11.32 mg CE/100 mg.

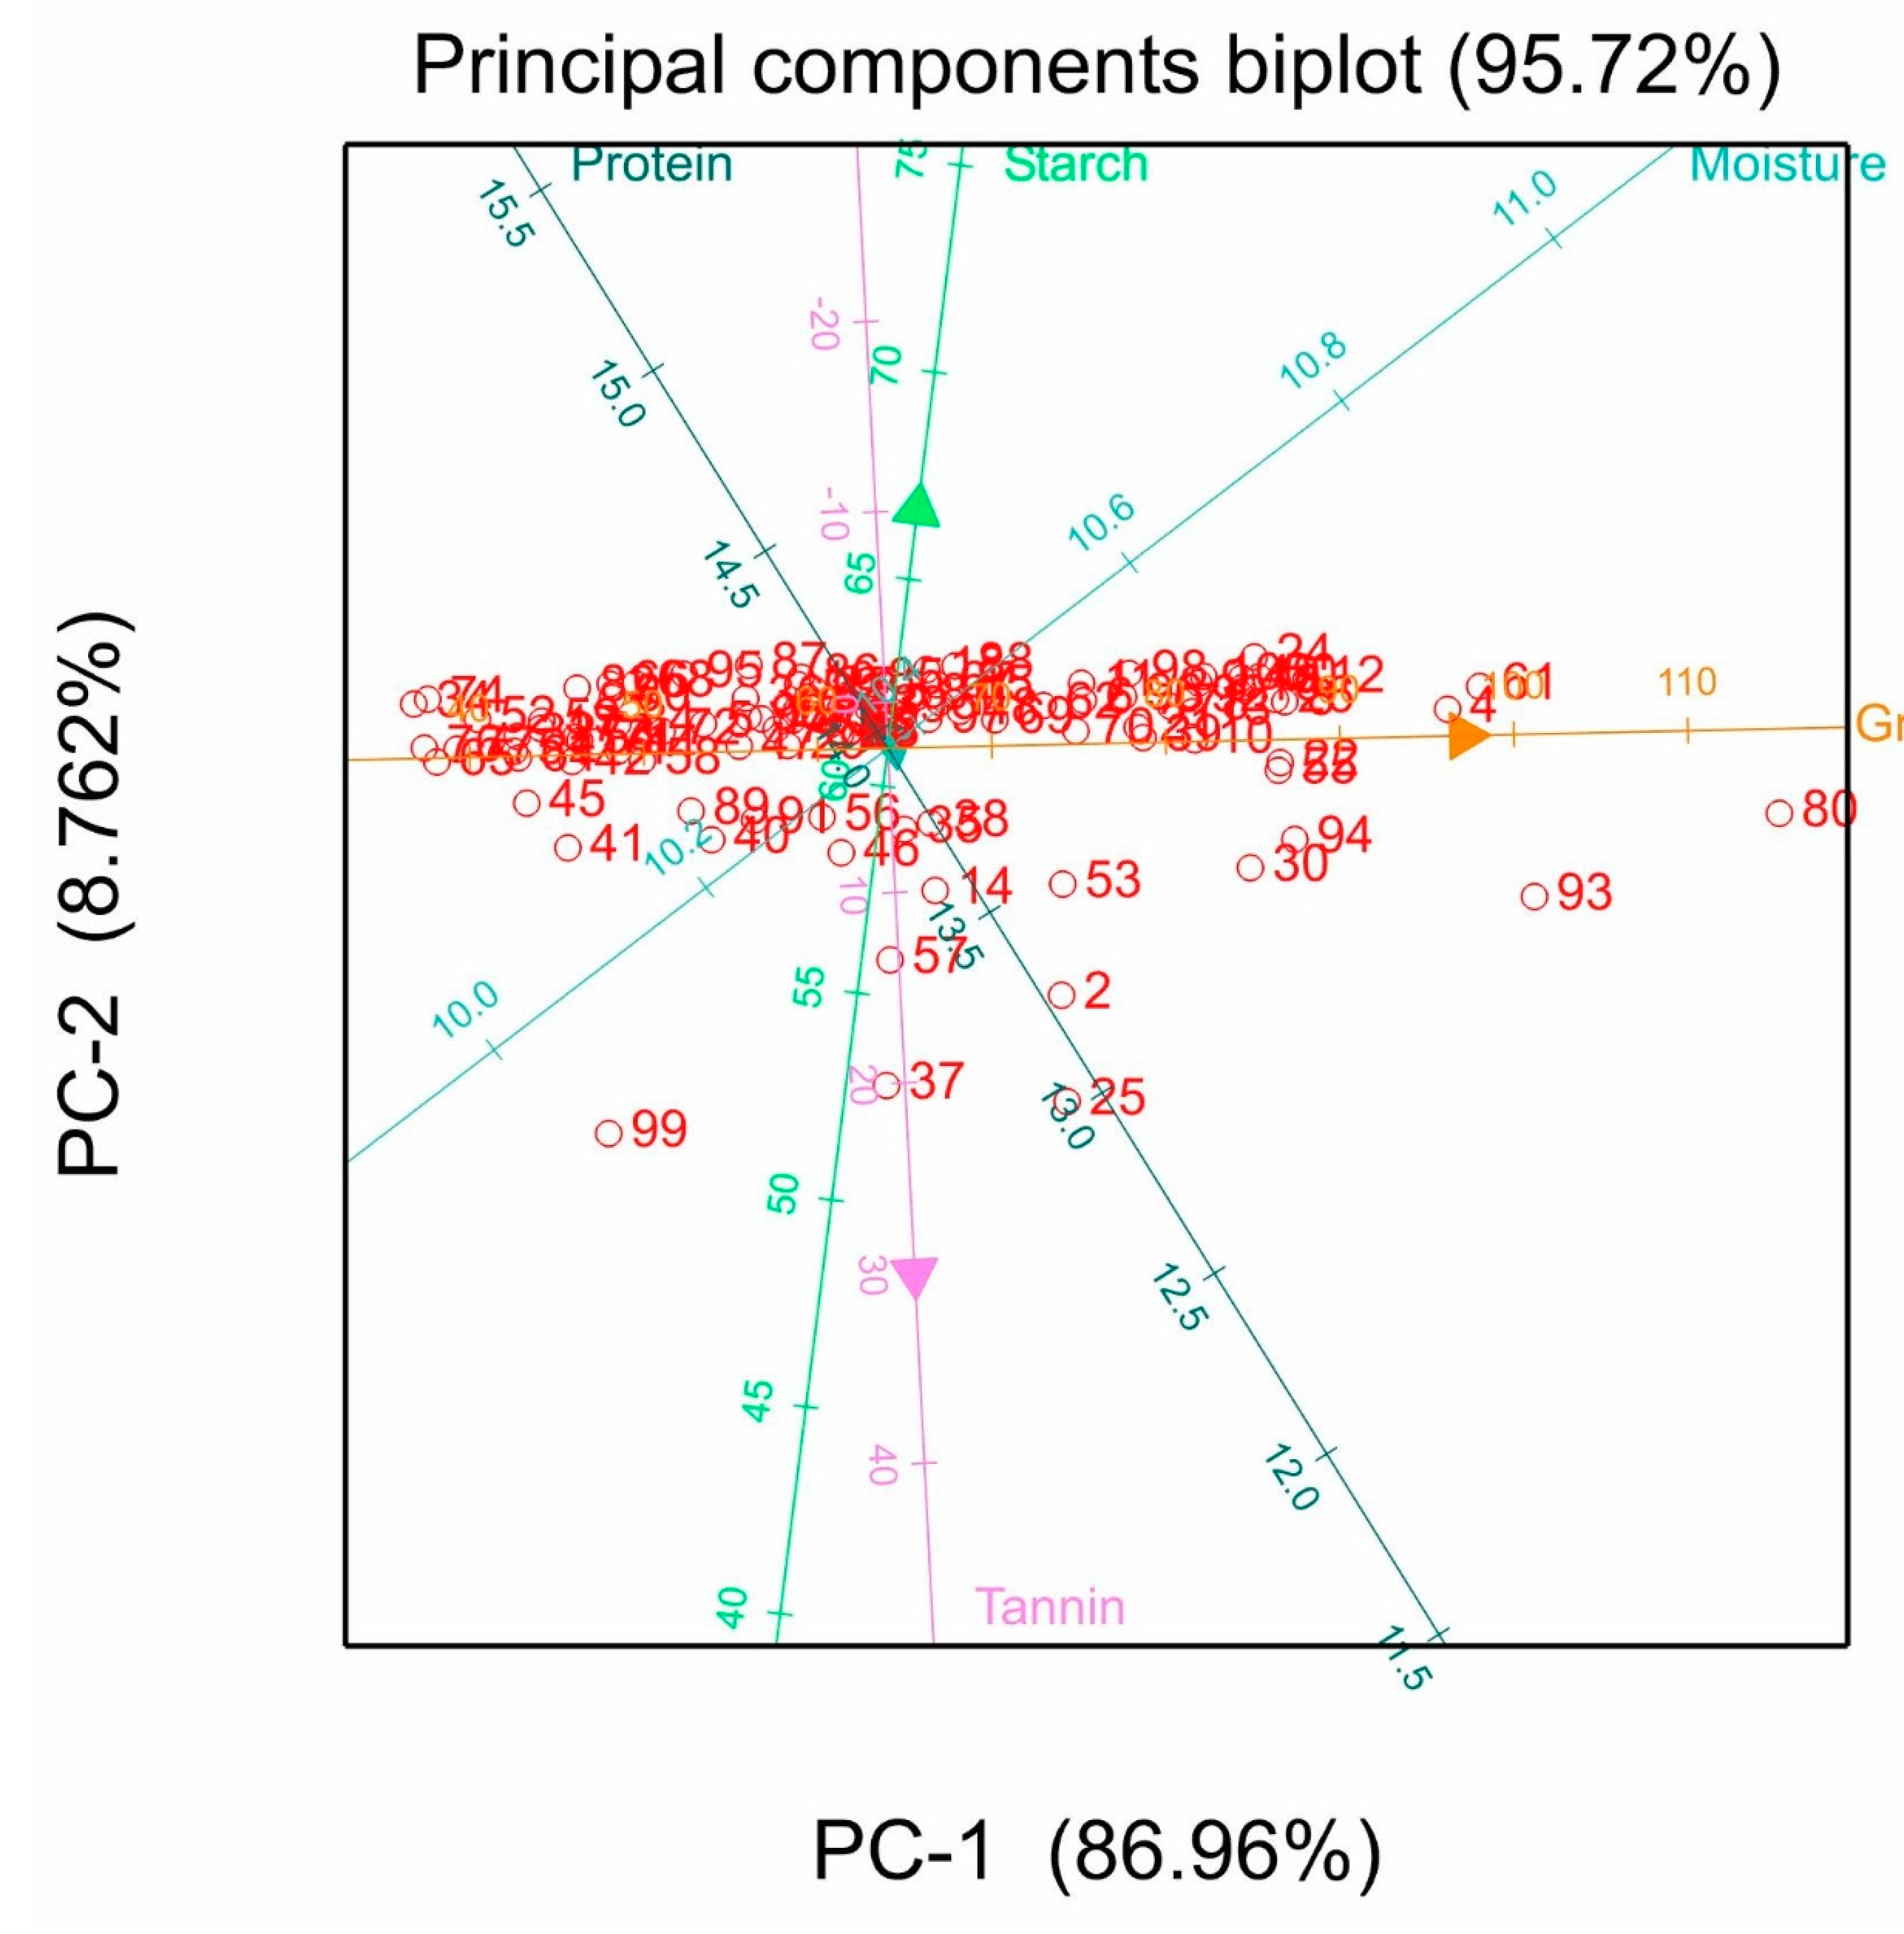
3.6. Principal Component Analysis

The first two principal components (PC) had eigenvalues greater than 1 and cumulatively explained about 95.72% of the total variation within the sorghum accessions (Supplementary Table S2). The first PC accounted for the largest total variation (86.96%) with the highest eigenvalue of 2.20. The variation in the first PC was due to protein (54.00%). The second PC had an eigenvalue of 1.27 and accounted for 8.76% of the total variation due to tannin (81.00%) and starch (54.00%).
The bi-plot analysis shows the positioning of accessions in the first two principal components (Figure 2). Most accessions were plotted in the left quadrants and close to each other, which included SA2453 (82) and SA2692 (85), and also SA0671 (48) and SA2690 (84). This indicates that the accessions that are very close to each other share common ancestry. There were also accessions plotted far apart from one another, including SA0223 (25) and SA0221 (99). This indicates that the accessions are not closely related as they have different ancestry. The bi-plot analysis also shows the contribution of the five traits in the first two PCs. These traits were plotted in three different quadrants, reflecting their negative correlation toward each other. However, a positive correlation was observed between tannin and grain yield and between moisture and starch, plotted in the same quadrants. Moisture content explained the most variation in PC1, while tannin explained the most variation in PC2. The traits close to one in the biplot explain most of the variation in each PC, like protein content in PC1 and tannin content in PC2.

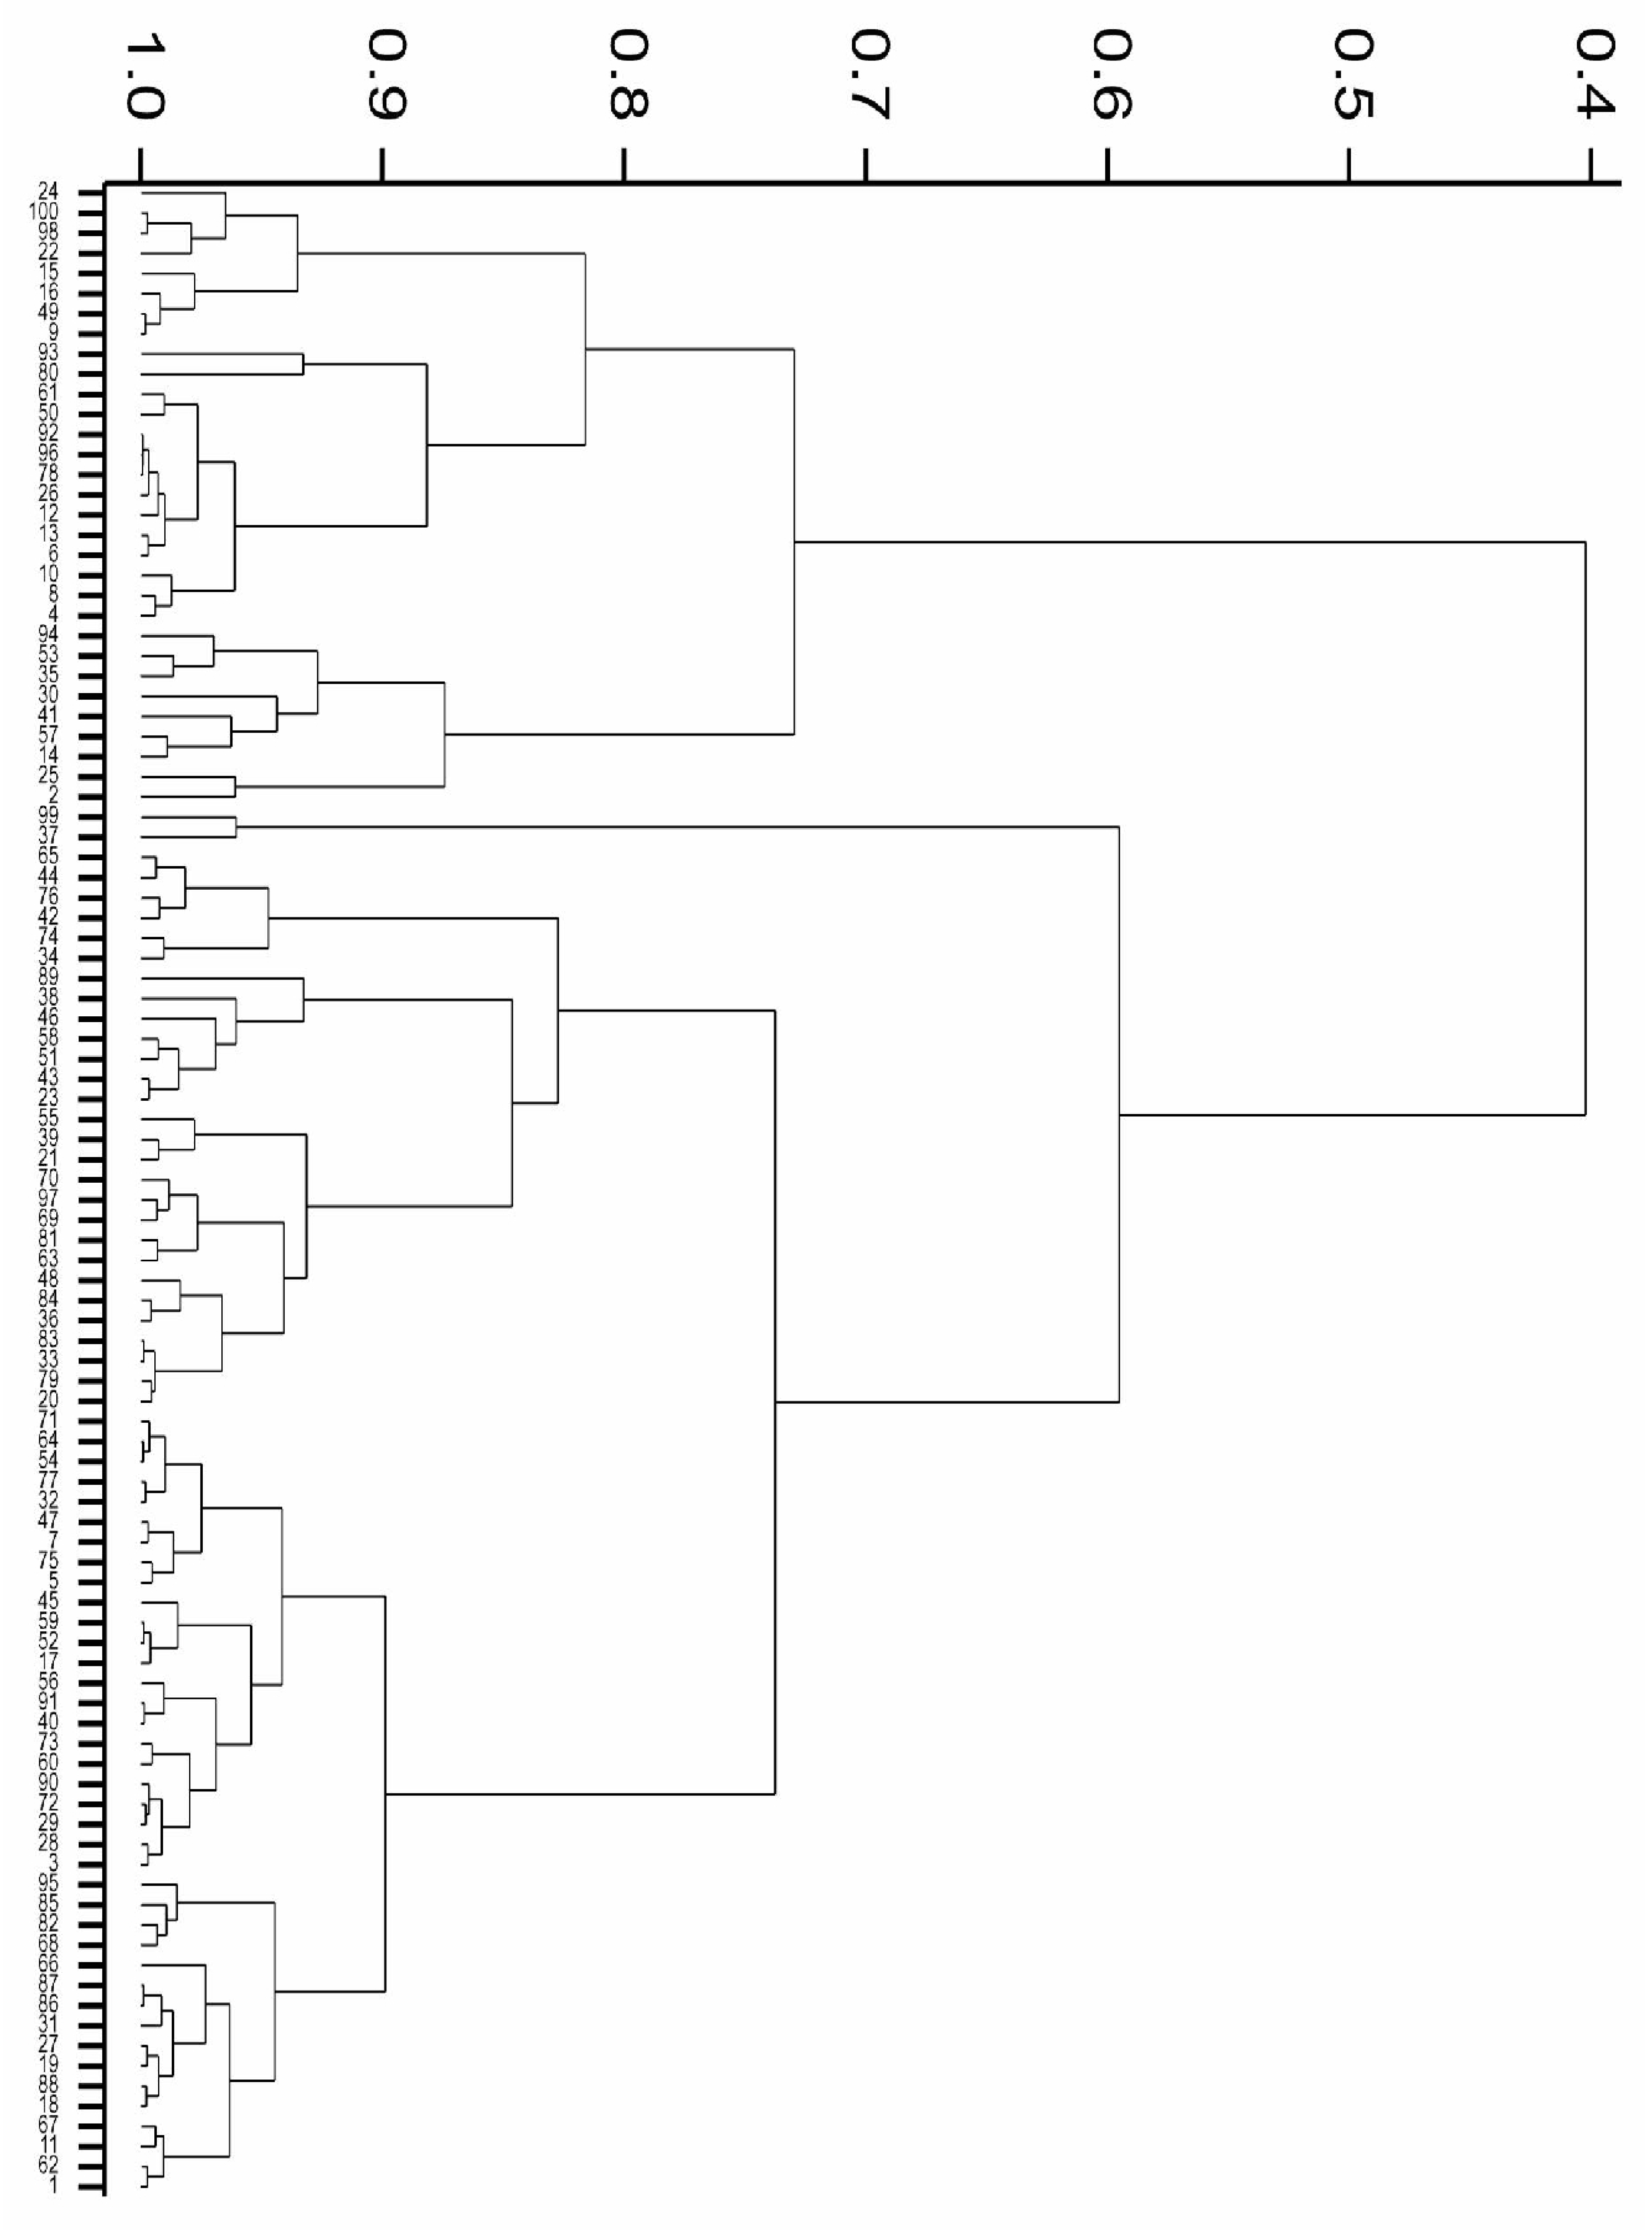
3.7. Cluster Analysis

Analysis of grain yield and grain quality contents clearly separated the 100 accessions into five different clusters (Figure 3). Cluster I was the largest, consisting of 39 accessions, of which 17 accessions were from South Africa (SA) and 16 were from United States (US). The inclusions in the cluster were three accessions from Botswana followed by three accessions each from Australia, Kenya and Lesotho. Cluster II was the second largest group of 28 accessions. This cluster was dominated by 19 accessions from the US, seven accessions from SA, and the two inclusions from Botswana. The third cluster (III) was the smallest, with only two accessions, SA0221 (99) and SA0560 (37), from Eswatini and the US, respectively. Nine accessions clustered together in cluster IV, in which five accessions were from SA while four were from US. The last cluster (V) comprised 22 accessions, which was dominated by 14 accessions from SA and four accessions from US. The other three accessions were from the Southern African Development Community (SADC) region, each from Botswana, Lesotho and Zimbabwe, respectively. Only one accession was from East Africa (Kenya).
Accessions in cluster I recorded high average starch content of 62.02% and the lowest grain yield of 54.64 g/panicle, while those in cluster II recorded the highest average protein and lowest tannin contents of 15.15% and 0.67 mg CE/100 mg, respectively. Moreover, accessions in cluster III recorded the highest average tannin content of 20.36 mg CE/100 mg and the lowest moisture content of 9.75%, while cluster IV recorded high average moisture and the lowest protein contents of 10.66% and 12.09%, respectively. It was also interesting to note that the accessions in the last cluster (V) recorded the highest average grain yield of 85.74 g/panicle, starch of 62.74% and moisture content of 10.66% (Supplementary Table S3).

4. Discussion

4.1. Variation in Grain Yield, Protein and Starch Contents

Analysis of variance showed highly significant differences for protein, starch, grain yield and moisture content among the sorghum accessions across the two growing seasons (G × S). A highly significant interaction between planting seasons and genotypes was observed for protein, starch, grain yield and moisture content. This indicated that genotypes (accessions) reacted differently to different planting seasons. Protein and starch contents had slightly lower means in the second planting season as compared to the first planting season. Unlike protein and starch, grain yield and moisture content in the second planting season were higher than in the first planting season. This could be attributed to the relatively high rainfall in the second growing season (2017/18). This phenomenon is brought by the fact that sorghum grain quality is affected by several factors, including environmental climate, soil type, genotype and fertilization across different growing seasons. This can then affect the nutritional composition of grain sorghum.
In the current study, the best yielders were SA2097 (114.9 g/panicle), SA3710 (101.1 g/panicle), SA0954 (98.3 g/panicle), Lenthate (96.5 g/panicle) and Maseka a swere (88.1 g/panicle) across seasons (as reported by Sejake et al. [19]). These accessions could be included as parents in crossing programs to improve the yield with desirable traits like protein and/or starch contents. Protein content showed a highly significant difference across two seasons. For combined analysis, protein content ranged from 10.41% (SA0390) to 16.59% (SA1278) with an average mean of 13.95%. Hamaker and Bugusu [13] reported that protein content in sorghum grain ranges from 8 to 16%, which is similar to the findings of the current study. This is also similar to the study reported by Mofokeng et al. [25], who reported crude protein content of South African genotypes varying from 7.69 to 16.18% compared to a mean of 13.07%. Ng’uni et al. [26] and Shegro et al. [27] also reported crude protein content ranging from 9.7% to 16.3% and 8.08% to 15.26%, respectively. The current study selected seven good yielding accessions based on their protein content as the potential for future breeding. These accessions had very little tannins (<1 mg CE/100 mg) and could be used in animal feed where protein is needed.
Highly significant differences were observed in starch content over both seasons among sorghum accessions. Perez-Maldonado and Rodriguez [28] reported that starch content in sorghum grain ranges from 63 to 74%, which is higher than the current finding. In the present study, total starch ranged from 48.90% in SA0560 to 67.61% in SA2721 compared to the average mean of 61.0%. Seven good yielding accessions were selected as potential for future improvement of starch through breeding. These accessions also had no tannins (or at least had less than 1 mg CE/100 mg) and can be used in nutrition where starch is vital. Differences in starch content were also reported by Shegro et al. [27], who reported starch content ranging from 32.11 to 57.09%, which was lower than the range in the current study. Shegro et al. [2] also reported results similar to the current study, in which the starch content ranged from 44.39 to 68.08%. Sorghum starch is very important in various food and industrial products. The resistance of sorghum starch (slowly digestible) makes it ideal for feeding people with obesity and diabetes [29]. Sorghum starch does not contain gluten, making it a possible grain for gluten-sensitive people. Sorghum starch is also beneficial in bio-ethanol production. Therefore, due to their high starch content, the seven accessions selected for starch could also be used in bio-ethanol production.
The wide genotypic variability based on grain yield, crude protein and starch content is essential to sorghum breeders as it provides them with nutritional information for parental selection in crop improvement. Different sorghums have different end-use products, and it is therefore vital to understand the market’s needs in order to develop new and high yielding varieties with good nutritional quality traits like protein and starch. Furthermore, the 14 accessions selected for both protein and starch were high yielders and did not have tannins (if any, very little) because tannin is undesirable in nutrition. In the current study, grain yield was positively correlated with starch content, which would be beneficial in simultaneously improving both traits through breeding.

4.2. Tannin Content

There were highly significant differences in tannin content, indicating a wide genetic variation among the sorghum accessions. The tannin content had an average mean of 2.24 mg CE/100 mg with a range of zero in 34 accessions to as high as 24.40 mg CE/100 mg in SA 0223. Identification of tannin content in sorghum was also determined by Reichert et al. [30] who reported a wide variation among 1768 sorghum lines with tannin content ranging from 0 to 11%, which is lower than the current study. Cheng et al. [18] also conducted a similar study on 24 sorghum varieties using the vanillin-HCl method and reported tannin contents ranging from 0 to 12.8%.
In the current study, 75 sorghum accessions were classified as type I sorghums, including white, brown and red colored grains. The tannin content in this group ranged from zero to 0.90 mg CE/100 mg. Type I sorghums are characterized by non-tannins (or those less than 1 mg CE/100 mg) and lack a pigmented testa. Seven accessions (white grain) were characterized as type II sorghums and recorded tannin contents ranging from 1.04 to 11.32 mg CE/100 mg. Type II sorghums have a pigmented testa with condensed tannins which can only be extracted by acidified methanol, and they do not have the spreader gene. Furthermore, 18 accessions (17 brown and 1 red) were characterized as type III sorghums with tannin contents ranging from 1.01 to 24.40 mg CE/100 mg. Sorghums in type III contain tannins in the testa and pericarp, and they have the spreader gene. Type I sorghums had an average mean of 0.01 mg CE/100 mg, type II had 4.73 mg CE/100 mg and type III had a mean of 9.83 mg CE/100 mg. Similar results were reported by Dykes and Rooney [31] who recorded tannin contents of 0.28 g/kg (in type I), 4.48 g/kg (in type II) and 11.95 g/kg (in type III). Cheng et al. [18] reported results that were lower than the current study, in which type I had 0.08%, type II had 1.9%, and type III had 5.3% tannin contents.
The presence of tannins in sorghum grains affect the protein digestibility by binding to the proteins, making them indigestible. Generally, tannins are not desirable in nutritive value, especially as food for humans or animal feed [14]. From the current study, accessions in type I without tannins, which included SA0213, SA0572, Maseka a sware and Mammopane, could be used in nutrition. However, sorghums with moderate tannin (0.1 to 0.6 mg CE/100 mg) can also be used as forage to provide better animal growth [18]. Lu and Sun [32] reported that many areas in China use sorghums with moderate tannins for high quality liquors. Apart from disadvantages, tannins protect sorghum grains from insect pests, grain mold and bird damage [18], especially in humid areas (disease fest) like Cedara in KwaZulu-Natal and also in Potchefstroom (North West) where bird damage is severe. Therefore, accessions with high tannins could be suitable for these areas. Tannins are also desirable in the leather tanning industries [30]. Therefore, accessions SA3710, SA0390 and SA2097 selected for tannin, which had high tannin contents, will be suitable in the leather tanning industry.

4.3. Heritability Estimates

Broad sense heritability plays a key role in selection of the genotypes in crop improvement because it indicates ability of a trait of interest to be transferred from one generation to the next [24]. The moderate h2B recorded for protein and starch suggests that the impact of the genes and the environment is equally expressed in the phenotype. Therefore, selection of these traits can be performed with average levels of efficiency. On the other hand, h2B for grain yield was unexpectedly high, probably due to the fact that only grain yield per panicle (g) was measured in this study. Grain yield is a product of different yield components and agronomic traits, with a larger proportion of the phenotypic variability due to the environment. It will therefore be interesting to explore and quantify the magnitude of genetic variation and heritability for all the different grain yield components and agronomic traits in the studied sorghum panel in different environments. The magnitude of variance components will be important in understanding the level of trait expression and mode of gene action controlling important traits, hence better adoption of efficient selection.

4.4. Correlations

Positive and highly significant correlations were observed between starch and grain yield. This phenomenon suggests that there is significant starch content in high grain yielders, indicating the possibility of simultaneous improvement of these traits. This study showed strong negative and highly significant correlations between starch and protein traits. Ng’uni et al. [26] also reported negative correlations between these traits. Although Ng’uni et al. [26] reported a negative correlation between protein and starch, the traits were non-significant, disagreeing with a highly significant correlation between the two traits in the current study. Shegro et al. [27] also reported non-significant correlation between protein and starch, also disagreeing with the findings in the current study. This negative correlation between starch and protein implies that improving starch content will have a negative effect on protein content, and this phenomenon is beneficial in breeding and selecting sorghum cultivars for bioethanol production where high starch content is desired. Furthermore, observing the negative correlation of tannin content with both protein and starch contents was of interest. This negative correlation means that the presence of tannins affects protein and starch digestibility by binding to and precipitating proteins and starch components, making them poorly digestible [16]. The relationship between traits helps breeders in simultaneous selection of traits of interest.

4.5. Principal Component Analysis

The five traits (starch, protein and tannins, moisture and grain yield) were analyzed using multivariate analysis to investigate the contribution of each trait to total variation among accessions. Eigenvalues greater than one are significant, while the component loadings greater than 0.3 are regarded as informative [33,34]. Therefore, the first two PCs with eigenvalues greater than 1 cumulatively explained about 95.72% of the total variation within the sorghum accessions. Similar results were also reported by Felix et al. [35], showing the first two PCs with eigenvalues greater than 1 and explained 69.6% of the total variation among the sorghum accessions. Shegro et al. [2] reported on the first three PCs with eigenvalues greater than one and cumulatively explained about 99.62% of the total variation among sorghum accessions.
In the current study, the first PC accounted for most of the variation (86.96%) which was due to crude protein content. The second PC accounted for 8.76% of the variation, which was due to starch and tannins. It was interesting to note that in both PC1 and PC2 the starch content had large negative loadings. This is similar to the study reported by Shegro et al. [2], in which starch content also had large negative loadings. These negative loadings indicate the inverse relation between factor and variable. The accessions were scattered across all four quadrants on the first and second PCs, indicating a wide genetic diversity among sorghum accessions based on grain yield and quality traits. Felix et al. [35] suggested that close accessions on the scatter plot share common traits, whereas those that are far apart are extremely different. Although most of the accessions were positioned near the origin, SA0223 (25), SA0560 (37) and SA0221 (99) were extreme accessions which could be used in breeding for extreme traits that are uncommon in other accessions. These accessions recorded the highest tannin contents of 24.40, 18.33 and 22.38 mg CE/100 mg, respectively. Although these accessions recorded relatively higher protein contents of 12.02%, 14.14% and 15.59% respectively, their use in breeding is, however, channeled towards improvement for leather tannin since they have the highest tannin contents.
Accessions on the top left quadrant had similar protein contents, the bottom left had similar starch and moisture contents, and the bottom right had similar grain yield and tannin contents. These multivariate analyses help plant breeders to identify traits that contribute highly to genetic variability among accessions. Therefore, they can then easily select parents for crop improvement.

4.6. Cluster Analysis

Understanding the genetic basis and nutritional composition of sorghum germplasm is of great importance to plant breeding and food security. In the current study, the 100 sorghum accessions were grouped into five distinct clusters. The largest cluster (I) comprised 39 accessions characterized by high starch content and the lowest grain yield. In this cluster accessions from the SADC region grouped together while the ones from USA grouped together. Cluster II had 28 accessions characterized by highest protein and lowest tannin contents. This cluster was dominated by accessions from USA, which were grouped together, but with exceptions of accessions from the SADC region. The two accessions in cluster III had the highest tannin contents and the lowest moisture content. Cluster IV had nine accessions characterized by high moisture and lowest protein contents. In this cluster, accessions from SA were grouped together while the other accessions from USA grouped together. Cluster V had 22 accessions characterized by the highest grain yield, starch and moisture contents. Accessions from SA dominated the cluster and they were grouped together with a few exceptions.
Similar accessions clustered together while dissimilar accessions clustered differently or in different clusters. The differences in the accessions is due to their genetic makeup and nutritive composition. Clustering of sorghum accessions based on biochemical traits was also reported by Shegro et al. [2], who grouped 22 sorghum accessions into three major clusters. Felix et al. [35] also used biochemical traits to cluster 30 sorghum accessions into four distinct clusters. In the current study, there was a wide genetic variability among the studied sorghum accessions, which could be helpful to the breeding program in parental selection for crop improvement with traits of interest. Genetic diversity serves as a foundation to plant breeding, and it is therefore important to understand the genetic basis of sorghum germplasm for crop improvement.

5. Conclusions

The sorghum accessions assessed were significantly diverse in yield and nutritional traits, as revealed by crude protein, starch, moisture and tannin contents in this study. Combined ANOVA showed highly significant (p = 0.01) variations among 100 sorghum accessions for grain yield, moisture, starch, protein and tannin contents. Grain quality contents (protein and starch) had slightly lower mean values in the second growing season as compared to the first growing season, which is attributed to the relatively high rainfall in the second growing season. Seven high yielding accessions SA0213, SA0139, SA0672, SA0673, Mmanolokwane, Mapinkana and Wahi were identified as potential for future sorghum starch improvement through breeding. This includes the potential to feed people with obesity and diabetes and also in bio-ethanol production. Another seven high yielding accessions SA0572, SA1564, SA0126, SA0954, SA0260, SA3125 and SA2080 were identified for high grain protein. The presence of tannins in sorghum grains affects protein digestibility, so sorghum with tannins is not desirable in nutritional value. However, tannins have other industrial benefits, like leather tanning. As such, the current study recommended accessions with high protein but very low in tannin content for human consumption and those with high tannins for industrial use (e.g., leather tannin). The variability observed in grain yield and quality traits among the sorghum accessions maintained at ARC justify their continuous safeguarding for future use through regeneration and maintenance. Seeds of these studied accessions are part of the National Sorghum Germplasm Bank in South Africa and can be made available upon request for the purpose of research and or breeding.

Supplementary Materials

The following supporting information can be downloaded at: https://www.mdpi.com/article/10.3390/agronomy12123089/s1, Table S1: Mean values of grain protein, starch, tannin, moisture, grain yield and sorghum types based on tannin content; Table S2: Principal component analysis of biochemical traits among sorghum accessions showing eigenvectors, eigenvalues, individual and cumulative percentage of variation explained by the first two principal components (PC) axes; Table S3: Cluster-wise mean values for all the accessions.

Author Contributions

Conceptualization, T.S., N.S. and T.J.T.; methodology, T.S., N.S. and T.J.T.; validation, T.S., N.S. and T.J.T.; formal analysis, T.S.; investigation, T.S.; resources, T.S., N.S. and T.J.T.; writing—original draft preparation, T.S.; writing—review and editing, T.S., N.S., T.J.T., S.F. and A.M.; supervision, N.S. and T.J.T.; funding acquisition, N.S. and T.J.T. All authors have read and agreed to the published version of the manuscript.

Funding

This work was supported by the Research and Technology Fund of the National Research Foundation of South Africa, grant number RTF150422117506, 2016.

Institutional Review Board Statement

Not applicable.

Informed Consent Statement

Not applicable.

Data Availability Statement

Not applicable.

Conflicts of Interest

The authors declare no conflict of interest.

References

  1. United States Grains Council. Sorghum. 2006. Available online: www.grains.org/page.ww?section=Barley%2C+Corn+%26+Sorghum&name=Sorghum (accessed on 29 September 2020).
  2. Shegro, A.G.; Labuschagne, M.T.; Van Biljon, A.; Shargie, N.G. Genetic variability among sorghum accessions for seed starch and stalk total sugar content. Sci. Agric. 2014, 71, 472–479. [Google Scholar]
  3. Tripathi, A.D.; Mishra, R.; Maurya, K.K.; Singh, R.B.; Wilson, D.W. Estimates for world population and global food availability for global health. In The Role of Functional Food Security in Global Health; Singh, R.B., Watson, R.R., Takahashi, T., Eds.; Academic Press: Cambridge, MA, USA, 2019; pp. 3–24. [Google Scholar]
  4. Carter, P.R.; Hicks, D.R.; Oplinger, E.S.; Doll, J.D.; Bundy, L.G.; Schuler, R.T.; Holmes, B.J. “Grain Sorghum (Milo)”. Alternative Field Crops Manual. 1989. Available online: www.hort.purdue.edu/newcrop/afcm/sorghum.html (accessed on 29 September 2020).
  5. Crop Plant Resources Sorghum. Sorghum Bicolor. 2000. Available online: http://darwin.nmsu.edu/~molbio/plant/sorghum.html (accessed on 30 September 2020).
  6. Department of Agriculture, Forestry and Fisheries (DAFF). Sorghum Production Guideline; DAFF: Pretoria, South Africa, 2017; p. 20.
  7. Food and Agricultural Organization (FAO). International Crops Research Institute for the Semi-Arid Tropics (ICRISAT), The World Sorghum and Millet Economies. Facts, Trends and Outlook. 1996. Available online: http://www.fao.org/ (accessed on 31 September 2020).
  8. Olack, B.; Burke, H.; Cosmas, L.; Bamrah, S.; Dooling, K.; Feikin, D.R.; Breiman, R.F. Nutritional status of under-five children living in an informal urban settlement in Nairobi, Kenya. J. Health Popul. Nutr. 2011, 29, 357. [Google Scholar] [CrossRef] [PubMed] [Green Version]
  9. De Valença, A.W.; Bake, A.; Brouwer, I.D.; Giller, K.E. Agronomic biofortification of crops to fight hidden hunger in sub-Saharan Africa. Glob. Food Secur. 2017, 12, 8–14. [Google Scholar] [CrossRef]
  10. Food and Agriculture Organization Corporate Statistical Database (FAOSTAT) Data Production Yearbook; FAO: Rome, Italy, 2008; p. 49.
  11. Kim, J.S.; Hyun, T.K.; Kim, M.J. The inhibitory effects of ethanol extracts from sorghum, foxtail millet and proso millet on α-glucosidase and α-amylase activities. Food Chem. 2011, 124, 1647–1651. [Google Scholar] [CrossRef]
  12. Oh, K.K.; Adnan, M.; Cho, D.H. Network pharmacology of bioactives from Sorghum bicolor with targets related to diabetes mellitus. PLoS ONE 2020, 15, e0240873. [Google Scholar] [CrossRef] [PubMed]
  13. Hamaker, B.R.; Bugusu, B.A. Overview: Sorghum proteins and food quality. In Proceedings of the Workshop on the Proteins of Sorghum and Millets: Enhancing Nutritional and Functional Properties for Africa, Pretoria, South Africa, 2–4 April 2003. [Google Scholar]
  14. Zhao, Z. The Africa Biofortified Sorghum Project Applying Biotechnology to Develop Nutritionally Improved Sorghum for Africa. In Biotechnology and Sustainable Agriculture 2006 and Beyond; Springer: Dordrecht, The Netherlands, 2007; pp. 273–277. [Google Scholar]
  15. Selle, P.H.; Cadoganb, D.J.; Li, X.; Bryden, W.L. Implications of sorghum in broiler chicken nutrition. Anim. Feed. Sci. Technol. 2010, 156, 57–74. [Google Scholar] [CrossRef]
  16. Mahmood, S.; Ali, H.; Ahmad, F.; Iqbal, Z. Estimation of tannins in different sorghum varieties and their effects on nutrient digestibility and absorption of some minerals in caged White Leghorn layers. Int. J. Agric. Biol. 2014, 16, 217–221. [Google Scholar]
  17. Awika, J.M.; Rooney, L.W. Sorghum phytochemicals and their potential impact on human health. Phytochemistry 2004, 65, 1199–1221. [Google Scholar] [CrossRef] [PubMed]
  18. Cheng, S.; Sun, Y.; Halgreen, L. The relationships of sorghum kernel pericarp and testa characteristics with tannin content. Asian J. Crop Sci. 2009, 1, 1–5. [Google Scholar] [CrossRef] [Green Version]
  19. Sejake, T.; Shargie, N.; Christian, R.; Tsilo, T. Assessment of genetic diversity in sorghum germplasm using agro-morphological traits. S. Afr. J. Plant Soil 2020, 37, 376–388. [Google Scholar] [CrossRef]
  20. Maxson, E.D.; Rooney, L.W. Evaluation of methods of tannin analysis in sorghum grain. Cereal Chem. 1972, 49, 719–729. [Google Scholar]
  21. Price, M.L.; Van Scoyoc, S.; Butler, L.G. A critical evaluation of the vanillin reaction as an assay for tannin in sorghum grain. J. Agric. Food Chem. 1978, 26, 1214–1218. [Google Scholar] [CrossRef]
  22. VSN International. GenStat for Windows, 18th ed.; VSN International: Hemel Hempstead, UK, 2015. [Google Scholar]
  23. SPSS. Institute Statistical Package for Social Sciences-Users Guide; SPSS: Chicago, IL, USA, 2006. [Google Scholar]
  24. Tsilo, T.J.; Kolmer, J.A.; Anderson, J.A. Molecular mapping and improvement of leaf rust resistance in wheat breeding lines. Phytopathology 2014, 104, 865–870. [Google Scholar] [CrossRef] [PubMed]
  25. Mofokeng, M.A.; Shimelis, H.; Tongoona, P.; Laing, M.D. Protein content and amino acid composition among selected South African sorghum genotypes. J. Agric. Food Chem. 2018, 3, 27–34. [Google Scholar] [CrossRef] [Green Version]
  26. Ng’uni, D.; Geleta, M.; Hofvander, P.; Fatih, M.; Bryngelsson, T. Comparative genetic diversity and nutritional quality variation among some important Southern African sorghum accessions (Sorghum bicolor L. Moench). Afr. Crop Sci. J. 2012, 6, 56–64. [Google Scholar]
  27. Shegro, A.; Shargie, N.G.; Van Biljon, A.; Labuschagne, M.T. Diversity in starch, protein and mineral composition of sorghum landrace accessions from Ethiopia. J. Crop Sci. Biotechnol. 2012, 15, 275–280. [Google Scholar] [CrossRef]
  28. Perez-Maldonado, R.A.; Rodriguez, H.D. Nutritional Characteristics of 26 Sorghums in Queensland and New South Wale for Chicken Meat Production; (RIRDC Publication 7); RIRDC: Barton, Australia, 2007. [Google Scholar]
  29. Dicko, M.H.; Gruppen, H.; Traore, A.S.; Alphons, G.J.; Voragen, A.J.; Van Berkel, W.J. Sorghum grain as human food in Africa: Relevance of content of starch and amylase activities. Afr. J. Biotechnol. 2006, 5, 384–395. [Google Scholar]
  30. Reichert, R.D.; Mwasaru, M.A.; Mukuru, S.Z. Characterization of coloured-grain sorghum lines and identification of high tannin lines with good dehulling characteristics. Cereal Chem. 1988, 65, 156–170. [Google Scholar]
  31. Dykes, L.; Rooney, L.W. Sorghum and millet phenols and antioxidants. J. Cereal Sci. 2006, 44, 236–251. [Google Scholar] [CrossRef]
  32. Lu, Q.; Sun, Y. Genetic Improvement of Hybrid Sorghum; China Agricultural Science and Technology Publisher: Beijing, China, 2005. [Google Scholar]
  33. Chatfield, C.; Collin, A.J. Introduction to Multivariate Analysis; Chapman and Hall in Association with Methuen: New York, NY, USA, 1980. [Google Scholar]
  34. Hair, J.F.; Anderson, R.E.; Tatham, R.L.; Black, W.C. Multivariate Data Analysis, 5th ed.; Prentice Hall: Hoboken, NJ, USA, 1998; Available online: https://www.amazon.com/Multivariate-Data-Analysis-Joseph-Hair/dp/0138948585 (accessed on 31 October 2022).
  35. Felix, K.; Cheruiyot, E.; Mwendia, C.M.; Francis, W.N.; Kimani, P. Genetic variation of biochemical characteristics of selected sorghum varieties from East Africa. Afr. J. Food Sci. 2015, 9, 314–321. [Google Scholar]
Figure 1. Mean tannin content for different grain colors and sorghum types.
Agronomy 12 03089 g001
Figure 2. The principal component analysis biplot showing positioning of sorghum accessions and factor analysis on the first and second principal components based on biochemical traits.
Agronomy 12 03089 g002
Figure 3. Dendrogram of sorghum accessions based on average linkage of five biochemical traits.
Agronomy 12 03089 g003
Table 1. Mean squares from the analysis of variance of 100 sorghum accessions evaluated for grain yield, protein, starch, moisture and tannin contents.
Source of Varianced.f.Grain Yield and Quality Traits
ProteinStarchTanninGrain YieldMoisture
Season111.27 **431.51 **-20,769.63 **9.79 **
Replication20.19 ns4.75 ns0.24 ns1507.50 **0.02 ns
Genotype999.38 **80.43 **78.17 **1330.36 **0.87 **
Genotype × Season994.83 **44.49 **-395.30 **0.57 **
Residual2981.0311.670.8050.030.03
h2B 4945-7034
SE 1.013.420.807.070.17
CV (%) 7.265.601.811.041.61
** = highly significant at p < 0.01; ns = non-significant; d.f. = degrees of freedom; SE = standard error; CV = coefficient of variance; h2B = broad sense heritability estimate.
Table 2. Mean values of grain protein, starch, tannin, moisture and yield, and sorghum types based on tannin content.
No.AccessionProtein (%)Starch (%)Tannin (mg CE/100 mg)
4Lenthate14.81 ± 0.4122 hijklmnopqrstu62.33 ± 1.404 cdefghijklmnopqr0.00 ± 0.4552 a
6Mabele a sesotho13.92 ± 0.4122 cdefghijklmnopqrst62.40 ± 1.404 cdefghijklmnopqr0.34 ± 0.4552 ab
8Mammopane13.89 ± 0.4130 cdefghijklmnopqrst65.37 ± 1.407 jklmnopqr0.48 ± 0.4552 ab
10Manthate13.87 ± 0.4122 cdefghijklmnopqrs57.74 ± 1.404 bcdefghijklmno0.87 ± 0.4552 ab
11Mapimkana13.09 ± 0.4122 bcdefghijklmno59.92 ± 1.404 bcdefghijklmnopqr0.25 ± 0.4552 a
12Maseka a swere14.54 ± 0.4122 fghijklmnopqrstu65.12 ± 1.404 ijklmnopqr0.35 ± 0.4552 a
13SA 000913.65 ± 0.4132 bcdefghijklmnopqrs60.88 ± 1.407 cdefghijklmnopqr0.00 ± 0.4552 bcde
16SA 006213.91 ± 0.4130 cdefghijklmnopqrst60.51 ± 1.407 bcdefghijklmnopqr0.34 ± 0.4552 a
22SA 013311.77 ± 0.4122 abcde61.98 ± 1.404 cdefghijklmnopqr4.27 ± 0.4552 cde
24SA 021314.40 ± 0.4130 fghijklmnopqrstu62.94 ± 1.407 cdefghijklmnopqr0.00 ± 0.4552 a
25SA 022312.02 ± 0.4122 abcdef59.72 ± 1.404 bcdefghijklmnopqr24.40 ± 0.4552 k
26SA 026014.53 ± 0.4122 fghijklmnopqrstu61.47 ± 1.404 cdefghijklmnopqr0.13 ± 0.4552 a
30SA 039010.41 ± 0.4130 a61.05 ± 1.406 cdefghijklmnopqr10.4 ± 0.45521 ghi
38SA 056715.53 ± 0.4122 nopqrstu54.83 ± 1.404 abcd4.52 ± 0.4552 de
49SA 067213.75 ± 0.4130 bcdefghijklmnopqrs63.94 ± 1.406 efghijklmnopqr0.00 ± 0.4552 ab
50SA 067311.23 ± 0.4130 ab67.43 ± 1.406 qr0.00 ± 0.4552 a
53SA 069611.98 ± 0.4122 abcdef65.05 ± 1.404 ijklmnopqr13.05 ± 0.4552 i
55SA 071814.20 ± 0.4122 efghijklmnopqrstu57.04 ± 1.404 abcdefghijkl2.61 ± 0.4552 abcd
61SA 095412.59 ± 0.4130 abcdefghijk64.78 ± 1.406 hijklmnopqr0.00 ± 0.4552 a
73SA 173013.44 ± 0.4122 bcdefghijklmnopq61.78 ± 1.404 cdefghijklmnopqr1.67 ± 0.4552 abcd
80SA 209712.00 ± 0.4122 abcdef65.33 ± 1.404 jklmnopqr9.69 ± 0.4552 gh
91SA 291313.87 ± 0.4130 cdefghijklmnopqrs62.68 ± 1.406 cdefghijklmnopqr7.58 ± 0.4552 fg
93SA 371014.48 ± 0.4122 fghijklmnopqrstu57.82 ± 1.404 bcdefghijklmno11.32 ± 0.4552 hi
94SA 371112.39 ± 0.4130 abcdefghi60.90 ± 1.407 cdefghijklmnopqr8.68 ± 0.4552 fgh
100Wahi12.96 ± 0.4130 abcdefghijklm64.79 ± 1.407 hijklmnopqr0.29 ± 0.4552 a
Mean13.9560.912.24
Ranges10.41–16.5948.90–67.610–24.40
No.AccessionGrain yield (g/panicle)Moisture (%)Grain ColorSorghum Type
4Lenthate96.50 ± 6.065 nop10.60 ± 0.1607 fghijklmBrownI
6Mabele a sesotho75.34 ± 6.065 bcdefghijklmno10.48 ± 0.1607 bcdefghijklmRedI
8Mammopane84.30 ± 6.066 ghijklmnop10.82 ± 0.1611 hijklmBrownI
10Manthate81.98 ± 6.054 fghijklmnop10.81 ± 0.1607 hijklmRedI
11Mapimkana96.48 ± 6.065 mnop10.75 ± 0.1607 hijklmRedI
12Maseka a swere88.10 ± 6.065 hijklmnop10.55 ± 0.1607 cdefghijklmWhiteI
13SA 000987.05 ± 6.072 jklmnop10.88 ± 0.1611 ijklmWhiteI
16SA 006281.73 ± 6.065 efghijklmnop10.48 ± 0.1611 bcdefghijklmBrownI
22SA 013386.49 ± 6.065 jklmnop10.98 ± 0.1607 klmBrownIII
24SA 021384.51 ± 6.072 ghijklmnop11.08 ± 0.1611 lmRedI
25SA 022373.38 ± 6.065 abcdefghijklmno10.50 ± 0.1607 bcdefghijklmBrownIII
26SA 026086.50 ± 6.065 ijklmnop10.26 ± 0.1607 abcdefghijklWhiteI
30SA 039084.50 ± 6.072 ghijklmnop10.88 ± 0.1610 ijklmBrownIII
38SA 056766.76 ± 6.065 abcdefghijklmno9.55 ± 0.1607 abcdWhiteII
49SA 067288.13 ± 6.072 lmnop10.26 ± 0.1610 abcdefghijklBrownI
50SA 067384.89 ± 6.065 hijklmnop11.28 ± 0.1610 mBrownI
53SA 069673.38 ± 6.066 abcdefghijklmno10.61 ± 0.1607 ghijklmBrownIII
55SA 071886.78 ± 6.065 ijklmnop10.19 ± 0.1607 abcdefghijklWhiteII
61SA 095489.30 ± 6.074 ghijklmnop10.65 ± 0.1610 ghijklmWhiteI
73SA 173045.96 ± 6.066 abcdefg10.85 ± 0.1607 ijklmWhiteII
80SA 2097114.90 ± 6.065 p10.59 ± 0.1607 efghijklmBrownIII
91SA 291356.00 ± 6.065 abcdefghijkl10.58 ± 0.1610 efghijklmWhiteII
93SA 3710101.12 ± 6.066 op10.52 ± 0.1607 bcdefghijklmWhiteII
94SA 371187.20 ± 6.072 klmnop10.48 ± 0.1611 bcdefghijklmRedIII
100Wahi75.09 ± 6.074 abcdefghijklmno10.50 ± 0.1611 bcdefghijklmWhiteI
Mean64.0310.37
Ranges36.7–114.99.36–11.28
Data represent mean ± standard error (SE). Different letters indicate significant differences (p < 0.05; Bonferroni test).
Table 3. Pearson’s correlation among crude protein, total starch and tannin contents in 100 sorghum accessions.
Crude ProteinStarchTanninGrain Yield
Starch−0.356 **
Tannin−0.300 **−0.265 **
Grain yield−0.273 **0.209 *0.142
Moisture−0.609 **0.428 **0.0560.440 **
*, ** Significant at the 0.05, 0.01 probability level, respectively.
Table 4. Potential accessions selected for breeding.
No.AccessionProtein (%)Starch (%)Tannin (mg CE/100 mg)Grain Yield (g/Panicle)Moisture (%)
Selected accessions for starch content
24SA 021311.2367.430.0084.8911.28
98SA013912.1366.100.3077.7510.71
49SA 067213.8965.370.4884.3010.82
50SA 067314.5465.120.3585.3410.55
9Mamolokwane13.8964.800.4881.8610.99
11Mapimkana12.9664.790.2975.0910.50
100Wahi12.5964.780.0082.1510.65
Selected accessions for crude protein content
39SA 057216.0256.100.0079.1710.13
70SA 156415.6557.260.0075.2210.56
21SA 012614.9457.640.0078.7310.16
61SA 095414.8162.330.0098.2610.60
26SA 026014.5361.470.1386.5010.26
92SA 312514.4961.780.0981.4810.16
78SA 208014.2161.540.4680.4310.22
Selected accessions for tannin content
93SA 371014.4857.8211.32101.1210.52
30SA 039010.4161.0510.4184.5010.88
80SA 209712.0065.339.69114.9010.59
Publisher’s Note: MDPI stays neutral with regard to jurisdictional claims in published maps and institutional affiliations.

