Article

An Organic Fertilizer ‘Doped’ with a Bacillus Strain Improves Melon and Pepper Yield, Modifying the Rhizosphere Microbiome with Negligible Changes in the Bulk Soil Microbiome

by
Noemí Ortiz-Liébana
1,
Maurizio Zotti
2,
Marcia Barquero
1 and
Fernando González-Andrés
1,*
1
Research Group IQUIMAB, Institute of Environment, Natural Resources and Biodiversity, University of León, 24009 León, Spain
2
Department of Agricultural Sciences, University of Naples Federico II, 80055 Portici, Italy
*
Author to whom correspondence should be addressed.
Agronomy 2022, 12(11), 2620; https://doi.org/10.3390/agronomy12112620
Submission received: 18 July 2022 / Revised: 29 September 2022 / Accepted: 12 October 2022 / Published: 25 October 2022
(This article belongs to the Topic Biostimulants in Agriculture)

Abstract

:
Doped compost consists of compost inoculated with Bacillus siamensis SCFB3-1 that is formulated in biochar and then mixed with the compost. The study objective was to analyze, at field scale, the effect of doped compost on the melon and pepper yield and on the soil microbiome, hypothesizing that the synergy between the components of doped compost confers additional benefits to the crop. Two doses of compost (2 and 5 t/ha) and two doses of the inoculant (biochar+SCFB3-1) with respect to the compost (3% and 6% w:w) were tested. The highest yield was observed for a reduced dose of mineral fertilization (NPK -20%) with a compost dose of 2 t/ha with 6% of the inoculant. Specifically, the yield increase compared with the control, which only received NPK, was a 47% increase in melon and 28% in pepper. The microbiome of the bulk soil was not modified by the doped compost, but the composition of the rhizosphere microbiome changed, increasing in the abundance of Bacillus (the inoculated strain), but also changing the relative abundance of other genera in the bacterial community. Future works will be focused on unravelling the possible effects of phytohormones on the observed results.

1. Introduction

Nowadays, new strategies for sustainable food production are essential [1] to meet the needs of the continuously growing global population [2]. In order to address this demand for food, agricultural productivity must increase [3]. Mineral fertilizers greatly increase crop yields but, at the same time, have led to perturbations in natural environments, where nutrient over-enrichment leads to a loss of habitats, as well as species richness and functionality, which in turn alters the goods and services provided by ecosystems [4,5]. Hence, maintaining crop yield improvements whilst adhering to sustainability criteria is considered necessary to reduce the levels of chemical inputs that could potentially harm natural ecosystems [6]. Introducing the principles of the circular economy in agriculture [7] and combining fertilizer-based techniques with microbiological-based ones [4] have represented, in recent years, a promising compromise to solve the problem of resource depletion and excess chemical inputs. At the same time, the adequate combination of these factors can provide sufficient yields [8].
As part of such biological inputs, several microbial species are acknowledged to have a beneficial effect on plant growth. Among the bacteria, those that colonize plant roots and promote their growth are named plant growth-promoting rhizobacteria (PGPR) or, more broadly, plant-growth promoting bacteria (PGPB). Mutualistic fungi, mainly mycorrhizae, also promote plant growth [9,10]. Both beneficial bacteria and fungi improve plant yields in a number of different ways [11,12] and reduce the proliferation of plant pathogens [13]. According to European regulations [14], the so-called microbial plant biostimulants (MPBs) comprise a PGPB or consortia of PGPBs that act as fertilizer products independently of the nutrient content of the product, stimulating plant nutrition processes and enhancing one or more of the following: (a) nutrient use efficiency; (b) abiotic stress tolerance; (c) quality traits; and (d) the availability of nutrients confined in the soil or rhizosphere. Biocontrol of the induction of plant resistance to biotic stresses is excluded from the MPB group.
Member species of the genus Bacillus are acknowledged as PGPBs because they comprise a relevant number of strains used in biocontrol in agriculture; moreover, their role as MPBs is being increasingly addressed [10], and thus Bacillus is currently considered an important and promising tool for sustainable agriculture [15]. Scientific studies about Bacillus strains as MPBs have focused more on cereals than on horticultural crops; Bacillus subtilis, Bacillus amyloliquefaciens, Bacillus cereus and Bacillus pumilus are the leading species [10]. To the best of our knowledge, in contrast with other Bacillus species, there are very few works about the use of Bacillus siamensis strains as an MPB [16].
Bio-residues from agriculture or forestry pruning cause problems in the soil when they are not properly managed. Some of these bio-residues are applied to soils as crop supplements. However, predicting plant-available N from decomposing crop residues is highly challenging because of the multiple factors involved in its decomposition [17]. These factors include residue chemistry, residue placement, environmental conditions and soil characteristics [18,19,20]. For example, the application of bio-residues can produce the opposite results in crops as many are allelopathic, and organic matter accumulation has been demonstrated to exert an autotoxic effect on reiterated crops [21,22]. The circular economy approach involves the conditioning of bio-residues intended for use as agricultural inputs [23]. Two outstanding conditioning technologies are composting and pyrolysis; the latter is used to obtain biochar. Compost is a high-quality organic fertilizer for crops [24]. Biochar is widely used in agriculture as a soil supplement because of the benefits it confers on the soil [25,26,27] and the environment, e.g., sequestration of atmospheric C in soil [28,29,30], as well as its capacity to reduce mineral N leaching and N2O emissions [31,32]; thus, it can be considered a mitigator of climate change. Apart from soil supplementation, biochar has also been used in combination with other agricultural inputs, e.g., through co-composting, it can increase the retention and supply of plant-available nutrients, improving the crop yield [33,34]; it has also been used as a carrier for rhizobia inoculants in legume crops [35,36].
Among the horticultural crops, Spain stands out for the production of melons and peppers. Specifically, Spain is the leading European producer of melons, as well as being the leading exporter and the eighth largest producer worldwide [37]. Spain is also a leading European producer of peppers and the fifth largest in the world [37].
To contribute to the global search for technologically improved organic fertilizers for sustainable agriculture within a circular economy approach, the objective of this work was to assess the agronomic and environmental effects of an innovative organic fertilizer based on compost inoculated with spores of B. siamensis formulated with biochar as a carrier (which we have called ‘doped compost’), combined with a 20% reduction in the dose of mineral fertilizer in melon and pepper crops. We hypothesized that synergies between the compost, the biochar and the PGPR strain would confer additional benefits in terms of crop yield and fruit and ecological parameters. Such parameters were assessed in a field trial, analyzing the crop response and the effect of the treatment on the microbiome composition using a next-generation sequencing approach.

2. Materials and Methods

2.1. Doped Compost Production and Component Description

The ‘doped compost’ consisted of two components, i.e., compost and an inoculant consisting of the bacterial strain SCFB3-1 from B. siamensis formulated with biochar as a carrier. The strain SCFB3-1 was isolated from the rhizosphere of a sweet pepper crop in San Cristobal de Entreviñas (Zamora, Spain) and it belongs to the IQUIMAB microbial strain collection (University of León, León, Spain); it was stored at −80 °C in tryptic soy broth (TSB) medium with 30% glycerol [16,38]. It was selected out of a collection of 186 isolates because it showed relevant growth-promoting activities in vitro, in concrete IAA production and ACC deaminase activity [38]. Moreover, in a field trial, a sweet pepper crop inoculated with a liquid formulation of SCFB3-1 in pure culture and fertilized with a reduced dose of mineral nitrogen (80%) produced a nearly 30% yield increase compared to the uninoculated control with a full N dose [16]. To prepare the inoculum, the frozen strain was first grown in tryptic soy agar (TSA) (Millipore reference number 22091) at 28 °C for 3 d. To produce a sufficient quantity of the inoculum at a concentration of 1.5 × 10⁹ cfu mL−1, a pilot fermenter (BIOSTAT Bplus-MO, Sartorius, Germany; 5 L in total capacity) was used; the growth medium was TSB, and the temperature 28 °C, under continuous stirring and aeration; the fermentation took 36 h. The resulting bacterial suspension was combined with two cell protectors, one polysaccharide and one disaccharide, at 0.5% (weight:volume) each. The biochar was obtained from the wood of vine shoots (Table S2) by slow pyrolysis in a pilot pyrolizer with an electrically heated reactor and a semi-continuous feeding system. The system for biochar production and the characteristics of the pyrolyzer are described in [39]. The compost used was a mixture of de-alcoholized grape pomace combined with vinasses of lees and crushed plant biomass (Table S1).

2.2. Field Trial Design

The crops used for the trial were the melon cultivar ‘Piel de sapo’ and the pepper cultivar ‘Medrano’. The trials were conducted in Rambla Salada (37°2′0.11″ N, 2°16′27.095″ W; Mazarrón) for melon and El Moaire (37°2′0.11″ N, 2°16′27.095″ W; Blanca) for pepper in 2018, while trials in 2019 were conducted in Los Lorentes (37°2′0.11″ N, 2°16′27.095″ W; Mazarrón) for melon and Rambla Salada (37°2′0.11″ N, 2°16′27.095″ W; Mazarrón) for pepper. At each location, the experimental design was a randomized complete block with three blocks. For the melon trial, the elementary plot was 35 m2, with one row 17.5 m in length, 2 m row spacing and a space between plants of 0.8 m, for a total plantation density (plants/ha) of 6250. For the pepper trial, the elementary plot was 20 m2, with one row 20 m in length, 1 m row spacing and a space between plants of 0.4 m, for a total plantation density (plants/ha) of 25,000. The whole set of treatments and the corresponding controls are described in Table 1.
The organic fertilizers (Table 1) were applied by hand immediately before transplantation, and the corresponding dose was spread on each row at a distance of 25 cm at each site of the drip line and incorporated into the soil with a motorized hoe. Subsequently, the plants were transplanted. The mineral N fertilizer was applied in the form of ammonium nitrate (27% N) at the dose per treatment indicated in Table 1. The schedule of application consisted of ten different applications along the crop cycle, each one corresponding to one tenth of the full dose; the schedule of application was intended to emulate fertirrigation, in which the fertilizer is distributed along the crop cycle. Mineral P and K fertilizers were applied at the same dose for all the treatments by fertirrigation in the following doses: P2 O5 at 38 kg ha−1 in melon 2018, 126 kg ha−1 in pepper 2018, 100 kg ha−1 in melon 2019 and 42 kg ha−1 in pepper (2019); K2O at 216 kg ha−1 in melon (2019) and 0 kg ha−1 in the rest. The calculation of P and K needs was based on the methodology indicated by [40], which considers, for dose calculations, the soil characteristics (Table S3) and the expected yield of 31,000 kg ha−1 for the melon crop and 42,000 kg ha−1 for the pepper crop. Transplantation was conducted on April 25th for melons and May 18th for peppers in 2018, and May 21st for melons and June 19th for peppers in 2019. The crop was drip-irrigated, keeping the soil moisture between 80% and 100% of the field capacity. The climatic conditions at each site and plot are summarized in Table S4.

2.3. Sampling, Variables Measured and Data Analysis

For both crops, the dependent variables of the trial were yield and its components, fresh and dry aerial vegetative biomass, chlorophyll content (measured in 25 leaves per treatment and plot with a portable chlorophyll meter: CCM-200, ADC BioScientific Ltd., Hoddesdon, U.K.), fruit contour (expressed in centimeters for the melon fruit and in millimeters for the pepper fruit) and conductivity (measured with a conductivity meter: PCE-CM 41, PCE instruments, Albacete, Spain) and solute concentration (measured with a portable digital meter) in the fruit juice. Twenty-five fruits were analyzed per treatment and plot. Moreover, the fruit penetrometry (with a penetrometer: PCE-PTR 200N, PCE Holding GmbH & Co, Hamburg, Germany) and flowering time were also measured in melons. The flowering time was measured by counting the number of plants in phenological stage 61, and the result was expressed as the percentage of the plant that had reached that stage. Melons were harvested at crop phenological stage 74 on the BBCH scale and ended at stage 78, and in pepper, harvesting started at stage 71 and ended at stage 75 on the BBCH scale [41].
The mean values of the dependent variables for the combined treatments (compost dose and inoculant dose) were compared with the Dunnett test, using the control 80 treatment as a reference for comparison (Figure 1, Figure 2, Figure 3 and Figure 4). Moreover, ANOVA was carried out with the location, year and plot as random factors, whilst the treatments (the compost dose on the one hand and the inoculant dose on the other) were fixed factors. The effects of the compost dose, the inoculant dose and the interaction between the two were analyzed, and the Tukey test was used for post hoc mean comparisons (Table 2, Table 3, Table 4 and Table 5 and Tables S5–S8), using IBM-SPSS v.26.0., IBM Corporation, Armonk-NY, USA.

2.4. DNA Extraction, Sequencing and Data Analysis

Rhizospheric and bulk soil from the melon crop were sampled to isolate total soil DNA during 2019, in the following treatments: control 0, control 80, compost 5 and compost 5+bb6. Rhizospheric soil samples were obtained from two plants per treatment belonging to the central block. In detail, plants were extracted from the soil five days after the flowering measurement, and the rhizospheric soil in contact with the root was collected using previously sterilized brushes to avoid cross-contamination, sieved (2 mm), homogenized and stored as three different samples in Falcon tubes at −80 °C for subsequent DNA extraction. Bulk soil was also collected from each treatment, sieved, homogenized and stored as three samples under the same conditions.
Three samples each of rhizospheric and bulk soil were collected per treatment, each one consisting of 300 mg of soil, and used for total microbial DNA extraction using the DNeasy Power Soil kit (Qiagen, Hilden, Germany), following the manufacturer’s instructions. The composition of soil microbial communities was analyzed by sequencing paired-end amplicons of the 16S rRNA gene and the ITS region of fungal ribosomal DNA using the Illumina MiSeq high-throughput sequencing platform at Molecular Research DNA (MR DNA) (www.mrdnalab.com Shallowater, TX, USA) (accessed on 5 April 2022).Each sample was sequenced as a paired-end set of reads. The primer set used was 515F (5′-GTGCCAGCMGCCGCGGTAA-3′) and 806R (5′-GGACTACHVGGGTWTCTAAT-3′), which are specific to the V4 region of 16S rRNA, and ITS1F (5′-CTTGGTCATTTAGAGGAAGTAA-3′) and ITS2R (5′-GCTGCGTTCTTCATCGATGC-3′) for the ITS region.
Sequence data were processed using the MR DNA pipeline (MR DNA, Shallowater, TX, USA), which involves the removal of primers, short sequences <150 bp and sequences with doubtful base calls. Sequences were quality-filtered at Q25 quality prior to processing using a maximum error threshold of 1.0, and subsequently dereplicated and denoised. A removal procedure was carried out to remove sequences with PCR point errors, singletons and chimeric sequences to obtain denoised sequences or amplicon sequence variants (ASV). Taxonomy was then assigned using BLASTn against a database derived from the Ribosomal Database Project II (RDPII, http://rdp.cme.msu.edu, accessed on 6 April 2022) and the National Centre for Biotechnology Information (NCBI, www.ncbi.nlm.nih.gov, accessed on 6 April 2022). The raw data obtained from this analysis were deposited in the Sequence Read Archive (SRA) of the NCBI under nucleotide sequence accession number PRJNA860271.
Microbial community analysis and plots were obtained using the Primer v7 and PERMANOVA+ software [42]. Diversity metrics such as the ASV number, the Shannon diversity index and the number of reads of the soil microbial communities for the four treatments (control 0, control 80, compost 5 and compost 5+bb6) were calculated and boxplots used to show the distribution of diversity indices. Factorial analysis of variance (ANOVA) was run to verify the effect of soil position (rhizospheric or bulk) and treatment (control 0, control 80, compost 5 and compost 5+bb6) on the species richness, number of reads and Shannon index of the obtained ASV. Specific changes among experimental conditions were then calculated using post-hoc Tukey’s HSD test. Statistical significance of treatments was assumed for p-values below 0.05. Analysis of variance and post hoc tests were carried out using IBM-SPSS v.26.0. IBM Corporation, Armonk-NY, USA.
Relative abundances of microbial taxa at the phylum level were shown by the use of stacked bar charts, while the detailed organization of both bacterial and fungal communities was presented as heat plots at the ASV level. Heat plots were organized according to hierarchical clustering based on Bray–Curtis distances among samples, while the 50 most frequent species were plotted according to hierarchical clustering based on the index of association. Non-metric multidimensional scaling (nMDS) of the Bray–Curtis dissimilarity matrix was used to assess the variation in the composition of the bacterial and fungal communities after applying the different treatments for rhizosphere and bulk soil. The significance of pairwise differences between the responses to the treatment within each type of soil for each microbial community was tested with permutational multivariate analysis of variance (PERMANOVA) for 999 permutations; dissimilarity was based on Bray–Curtis using treatment and soil as fixed factors.

3. Results

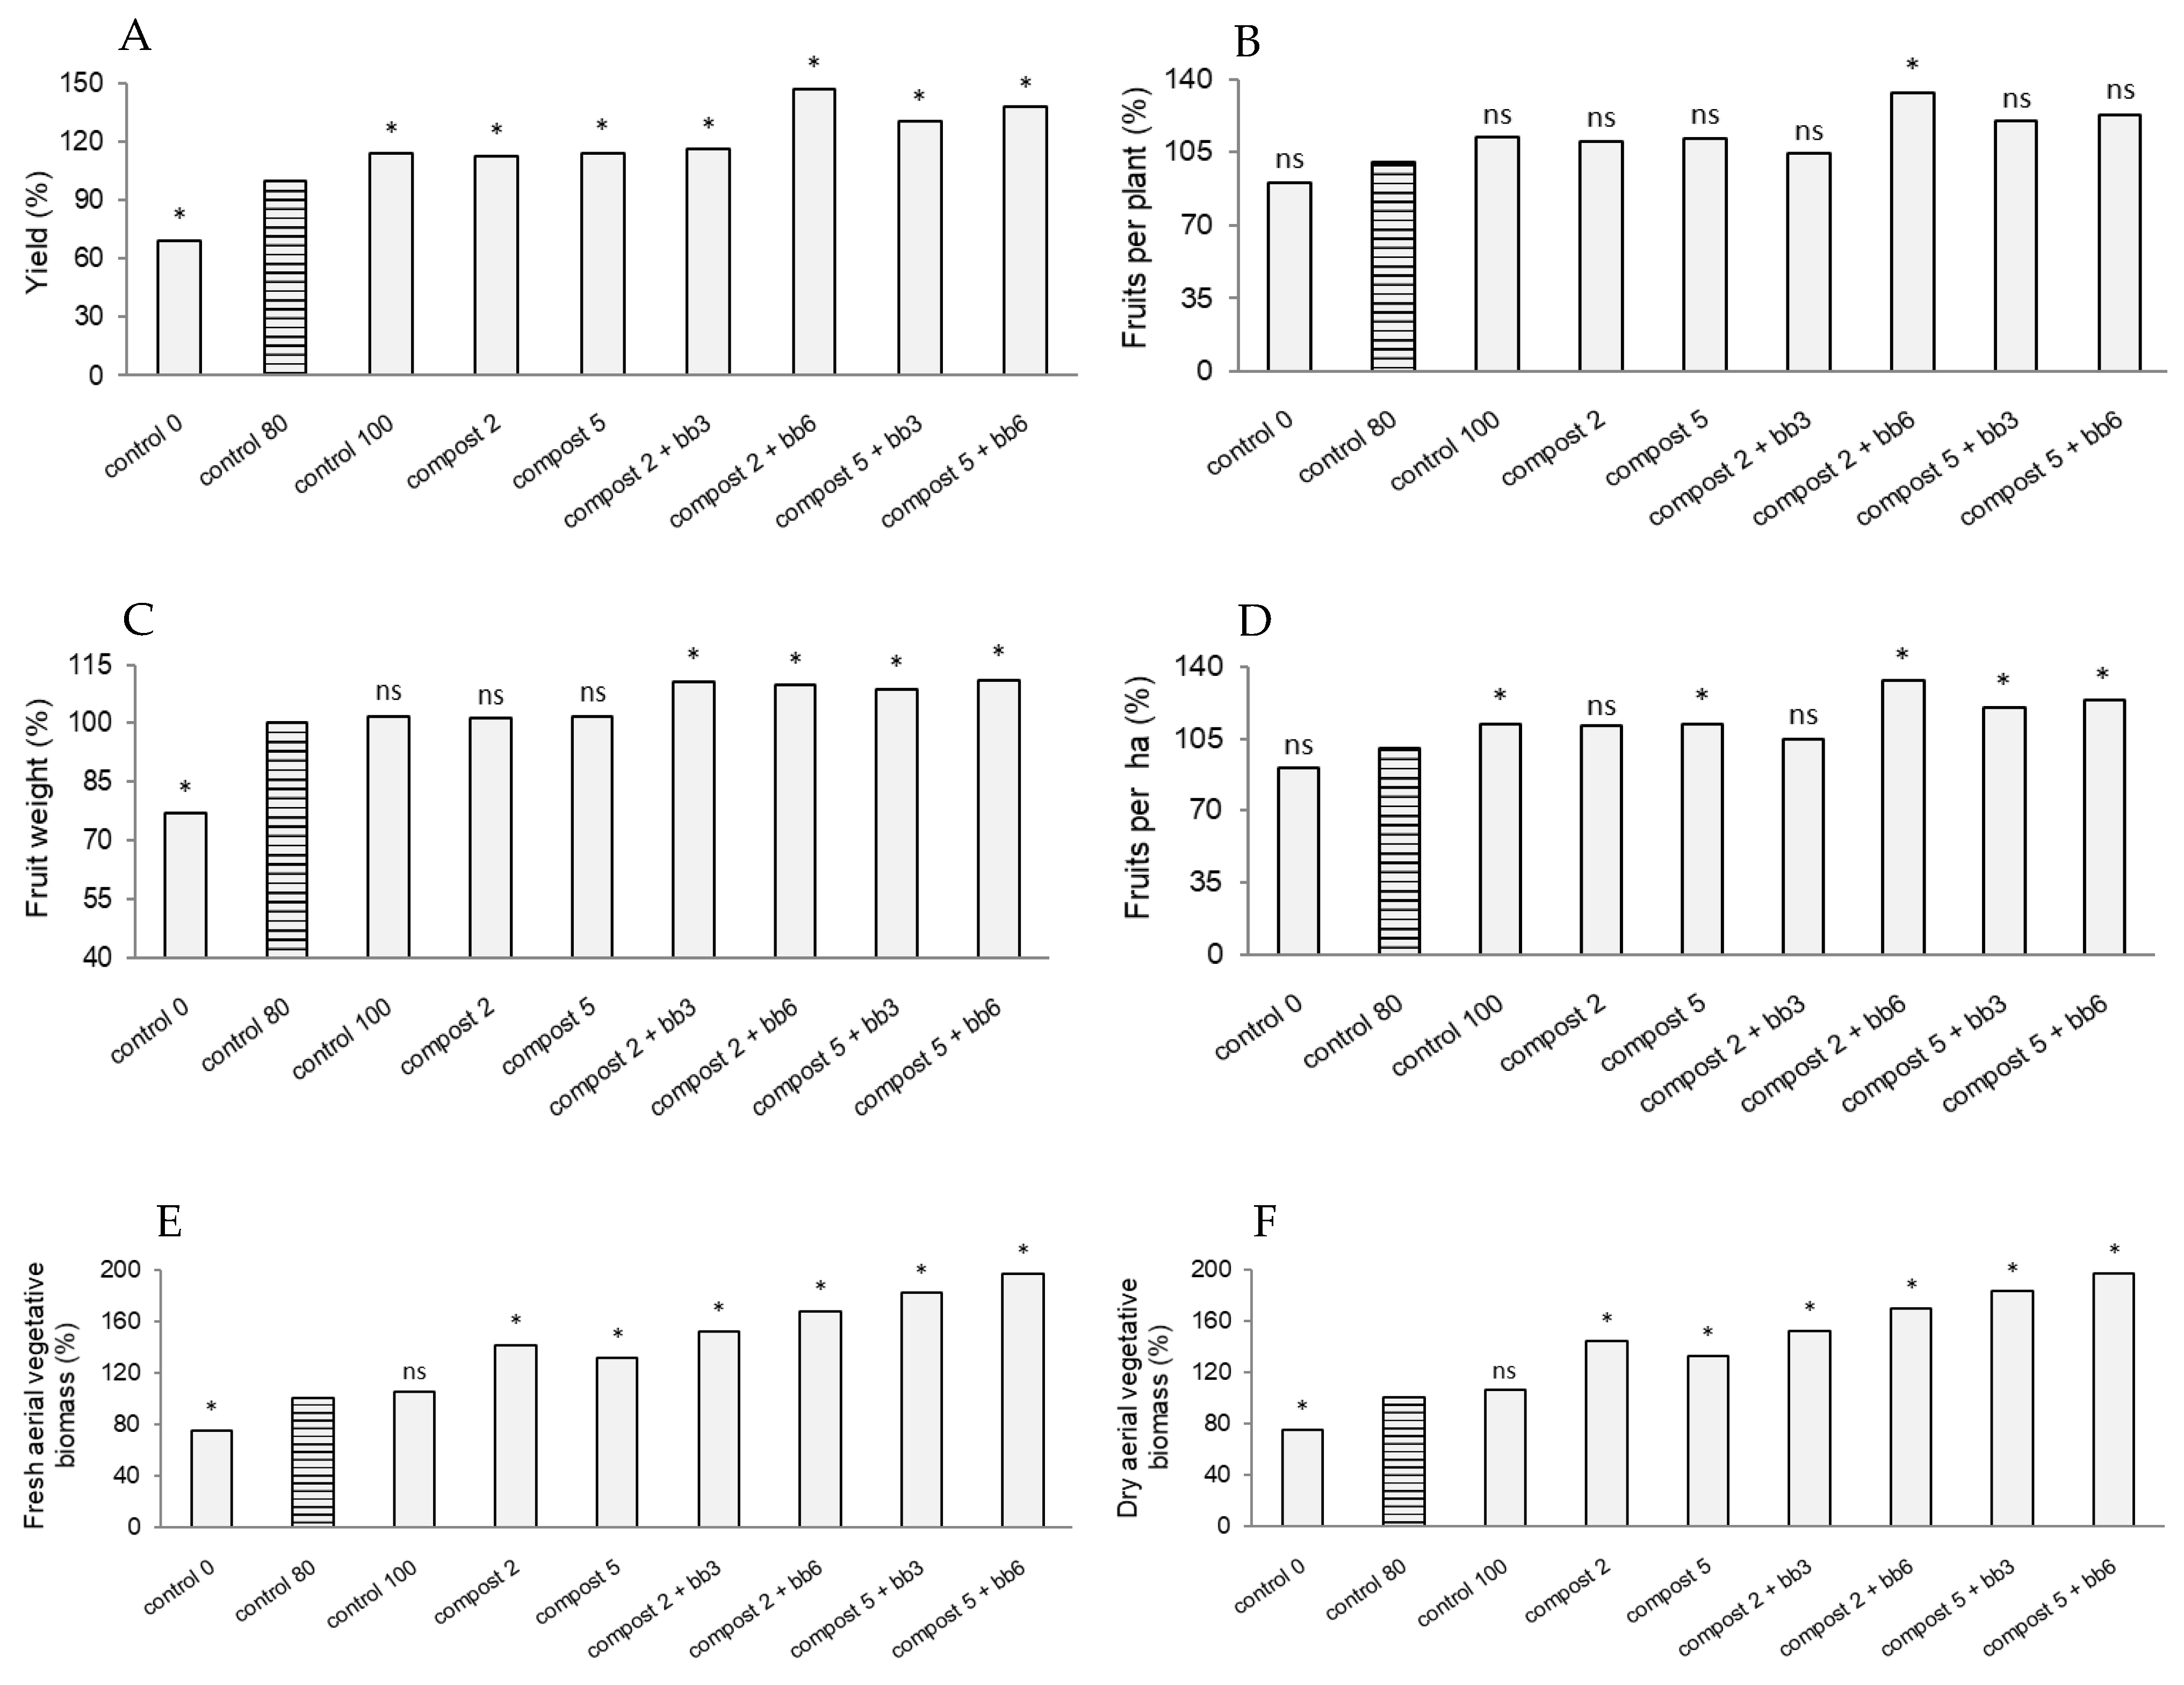
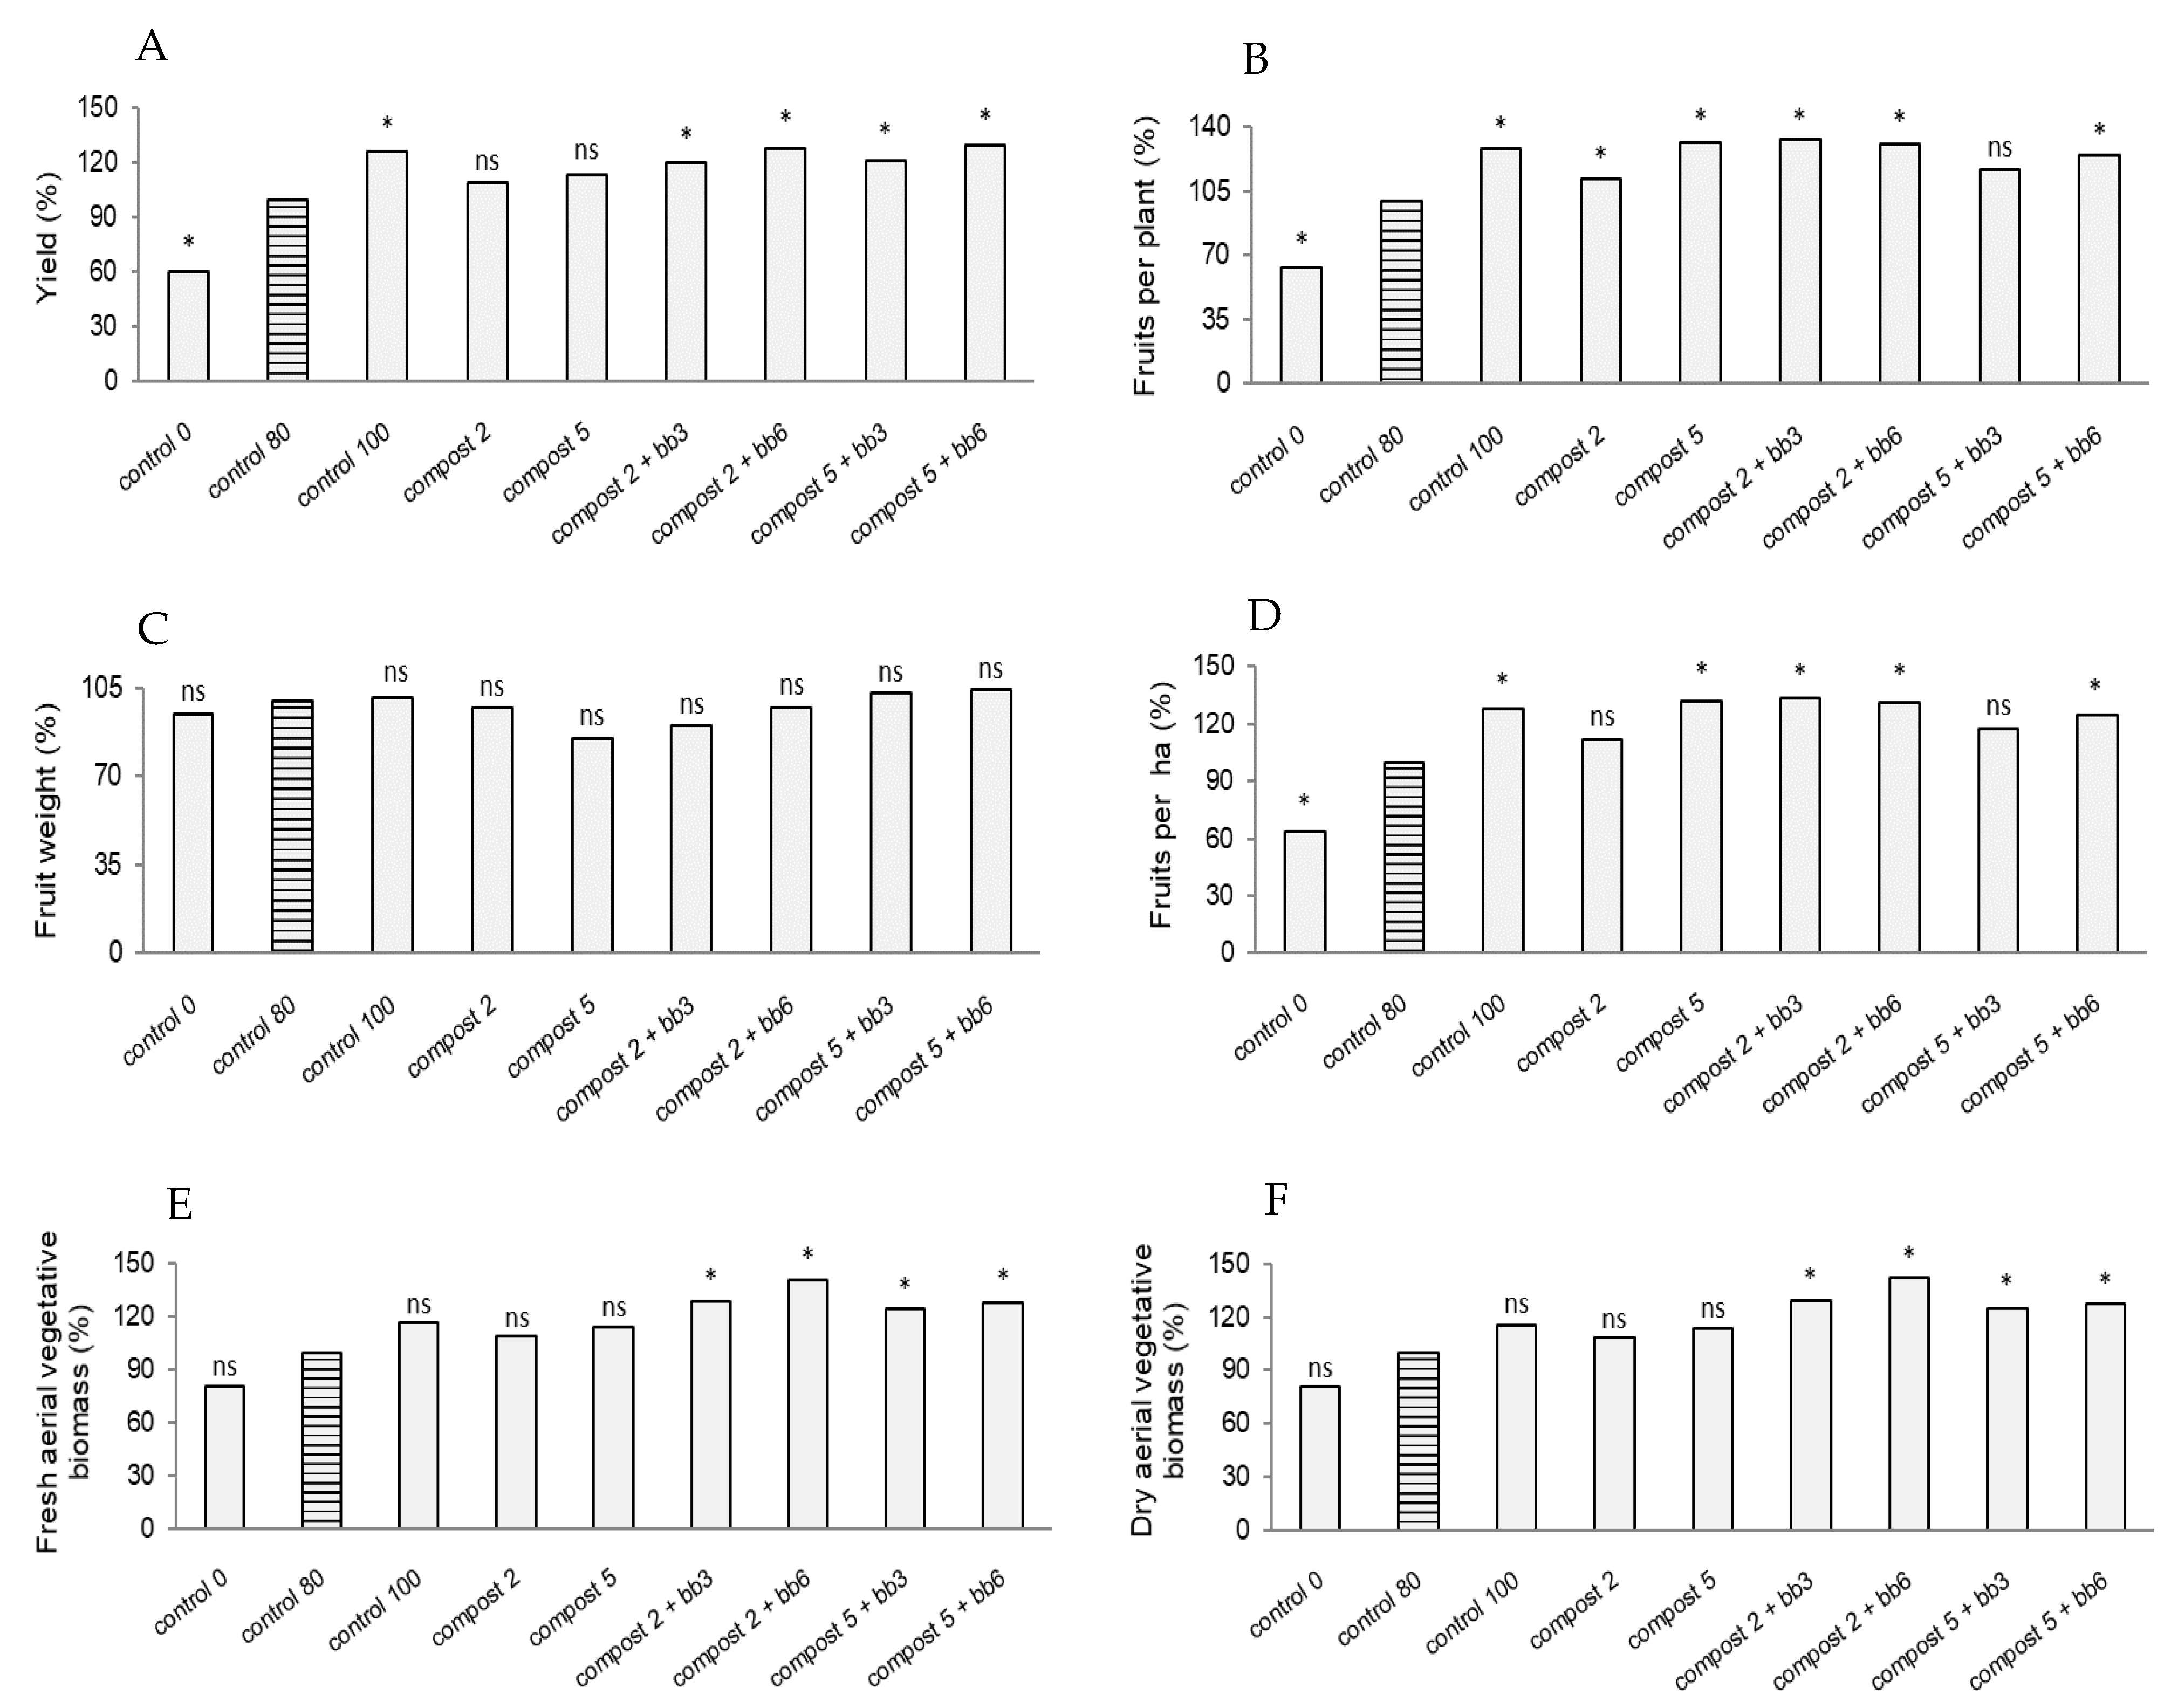
3.1. Yield, Yield Components and Biomass Production

In the melon crop (Figure 1), all the treatments showed significantly higher yields and vegetative biomass than control 80. The best yield and the highest aerial biomass were achieved by the doped compost, with yields of 16%, 31%, 38% and 47% above control 80 depending on the combination between the compost dose and inoculant dose (Figure 1A); the highest yield corresponded to the compost 2+bb6 treatment, whilst the highest vegetative biomass was for compost 5+bb6 (Figure 1E,F). Regarding the number of fruits per plant, only the treatment compost 2+bb6 produced significantly higher values than control 80, with a 33% increase (Figure 1B). For fruit weight, the treatments with doped compost showed significantly higher values than control 80 (Figure 1C), and for the fruits per ha, the compost at the higher dose, irrespective of supplementation, and the compost (at 2 t/ha) at the lower dose of inoculant produced significantly higher values than control 80 (Figure 1D). In summary, the best-performing treatments were compost 2+bb6 for yield and its components and compost 5+bb6 for fresh and dry aerial vegetative biomass.
The results of ANOVA for the factors of compost dose and inoculant dose in the melon crop are presented in Table 2. The two factors produced significant differences in most of the dependent variables, and the interaction between the compost and inoculant doses was also significant; the exceptions were for the number of fruits per plant and the fruit weight, in which only the inoculant dose produced significant differences. For the compost dose 2t/ha, the inoculant dose of 6% produced significantly higher values than other inoculant doses (0% and 3%) for all the dependent variables except the fruit weight, in which there were no differences between 3% and 6%, but a difference between the inoculated and non-inoculated compost was observed (Table S5). For the compost dose 5t/ha, the two inoculant doses (3% and 6%) produced similar responses for all the dependent variables, and the obtained values were significantly higher than those in the non-inoculated compost, except for the number of fruits per plant, which was not affected by the inoculant, and the number of fruits per ha, in which only the dose of 6% produced a significant increase (Table S5).
In the pepper crop (Figure 2), the yield was significantly improved by all the treatments with doped compost; compared to control 80, the increase ranged between 21% and 30%, the highest corresponding to the treatment compost 5+bb6 (Figure 2A). Conversely, for fruit weight, there were no significant differences between the treatments and the control. For the number of fruits per plant and fruits per ha, the treatments with doped compost and the non-inoculated compost at 5 t/ha showed significantly higher values than control 80, but the highest ones were for the treatments with doped compost, reaching the maximum for compost 2+bb3. In the case of aerial vegetative biomass (fresh and dry), only the treatments with doped compost showed significant differences with respect to control 80, the highest value corresponding to compost 2+bb6 (on average 41% higher than control 80).
The ANOVA results for compost dosing and inoculant dosing in the pepper crop are presented in Table 3. Both factors produced a significant effect on crop yield, but, interestingly, compost dosing produced a significant effect on one of the yield components (the number of fruits) and an inoculant dose effect on the other one (the fruit weight). For the vegetative aerial biomass, only the inoculant dose produced a significant effect. The interaction of both doses was significant for the yield components, but neither for the yield nor for the fresh aerial biomass. For either compost dose, 2 t/ha or 5 t/ha, only the highest dose of inoculant (6%) produced a significantly higher yield compared to the non-inoculated compost, but, interestingly, both inoculant doses produced a significantly higher number of fruits for the compost dose 2 t/ha and significantly higher fruit weight for the compost dose 5 t/ha (Table S6). Regarding vegetative aerial biomass, both inoculant doses produced significantly higher biomass (Table S6).

3.2. Chlorophyll Content, Flowering and Fruit Parameters

In general terms, the treatments with doped compost produced significantly higher values than control 80, and the best results for fruit contour, conductivity and solute concentration were shown by the treatment with compost 5+bb6 (Figure 3D–F); exceptions to this general rule were found for the chlorophyll content and flowering, of which the highest values were observed for control 100, as well as the treatment with compost 5+bb3 (respectively, 61% and 346% higher with respect to control 80).
The ANOVA results for melon parameters are presented in Table 4. The compost dose produced significant differences for all the parameters except for the penetrometry, whilst the inoculant dose only produced significant differences for the penetrometry, conductivity and solute concentration. Moreover, the interaction between the two parameters was only significant for the penetrometry. For the compost dose 2t/ha, the inoculant in a dose of 3% produced significantly higher values than the non-inoculated compost, for three parameters (fruit contour, conductivity and solute concentration), whilst the dose of 6% produced higher values for all the parameters except the penetrometry (Table S7). For the compost dose 5t/ha, the inoculant in a dose of 3% produced significantly higher values than the non-inoculated compost for the chlorophyll content and the penetrometry, as did the dose of 6% for all parameters except flowering and fruit contour (Table S7).
In the case of peppers, the response to the treatment varied depending on the treatment, and it was not possible to identify a generalized trend (Figure 4). Table 5 shows the ANOVA results for pepper fruit parameters. The compost dose produced significant differences in three out of the four parameters (the exception being the fruit contour), as did the inoculant dose in two (conductivity and solute concentration). No interaction was detected between compost and inoculant doses for any of the parameters analyzed. Interestingly, for both compost doses (2 and 5 t/ha), both doses of the inoculant (2% and 6%) significantly reduced the solute concentration (Table S8).

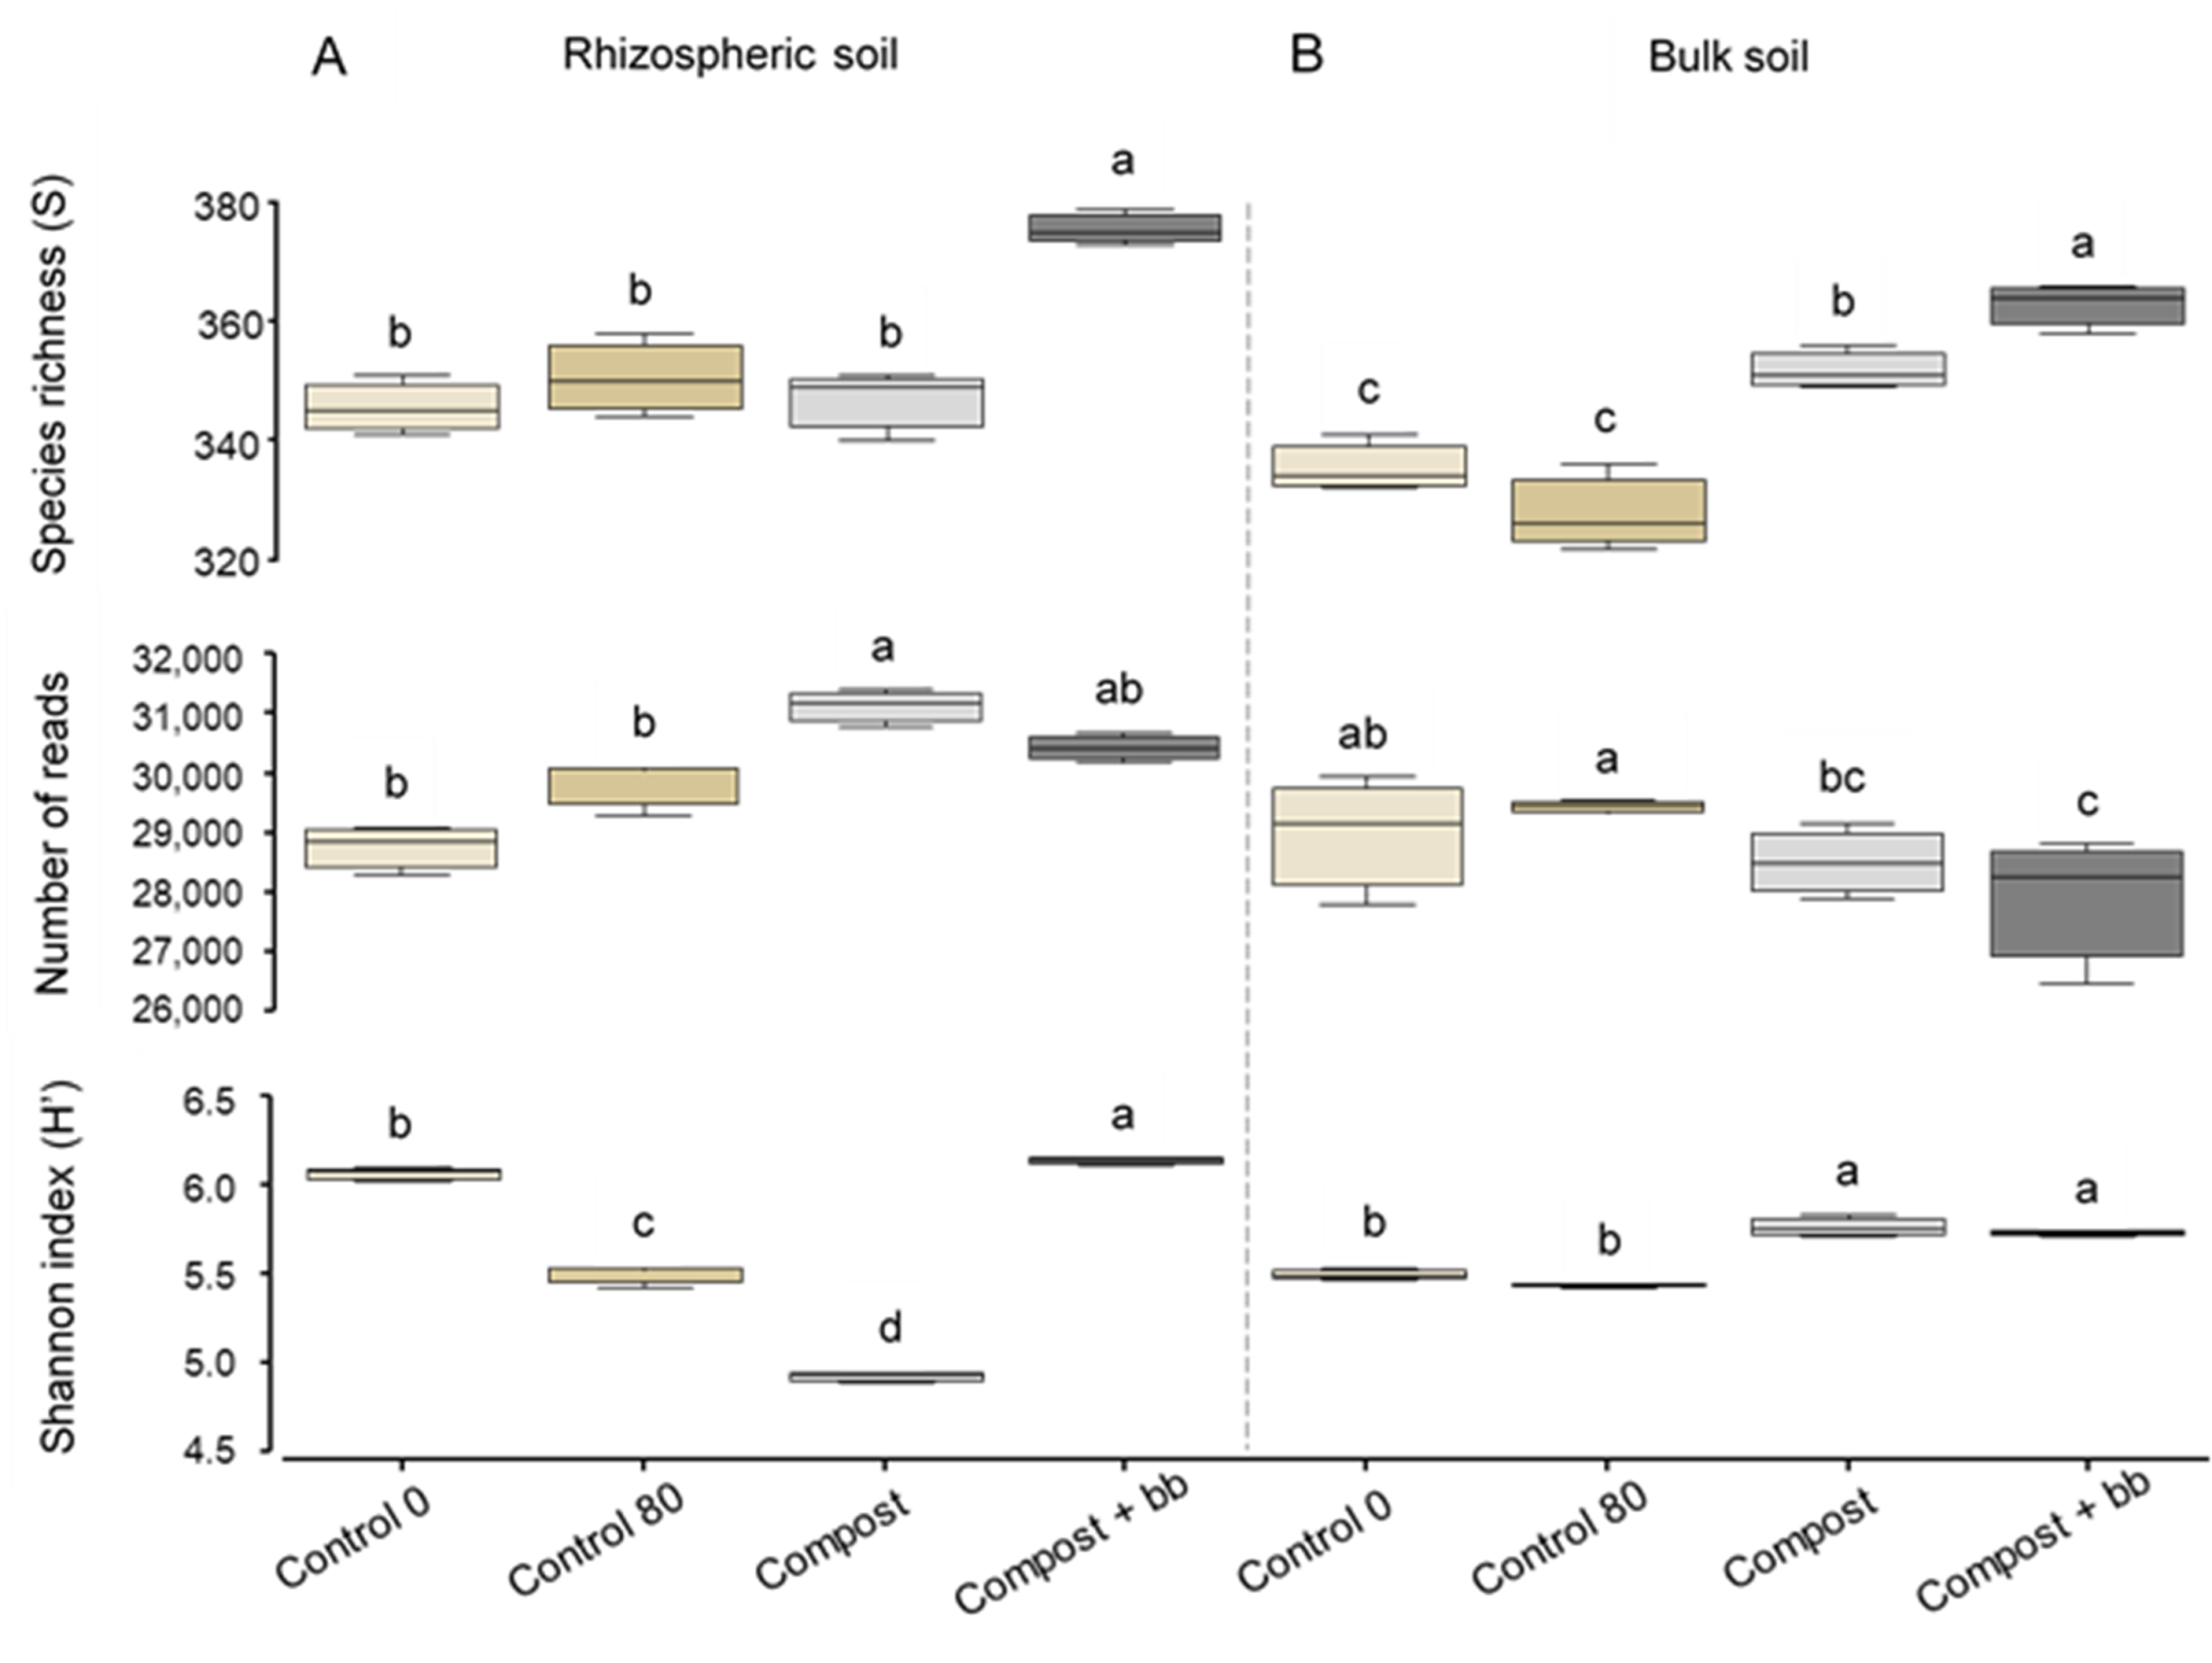
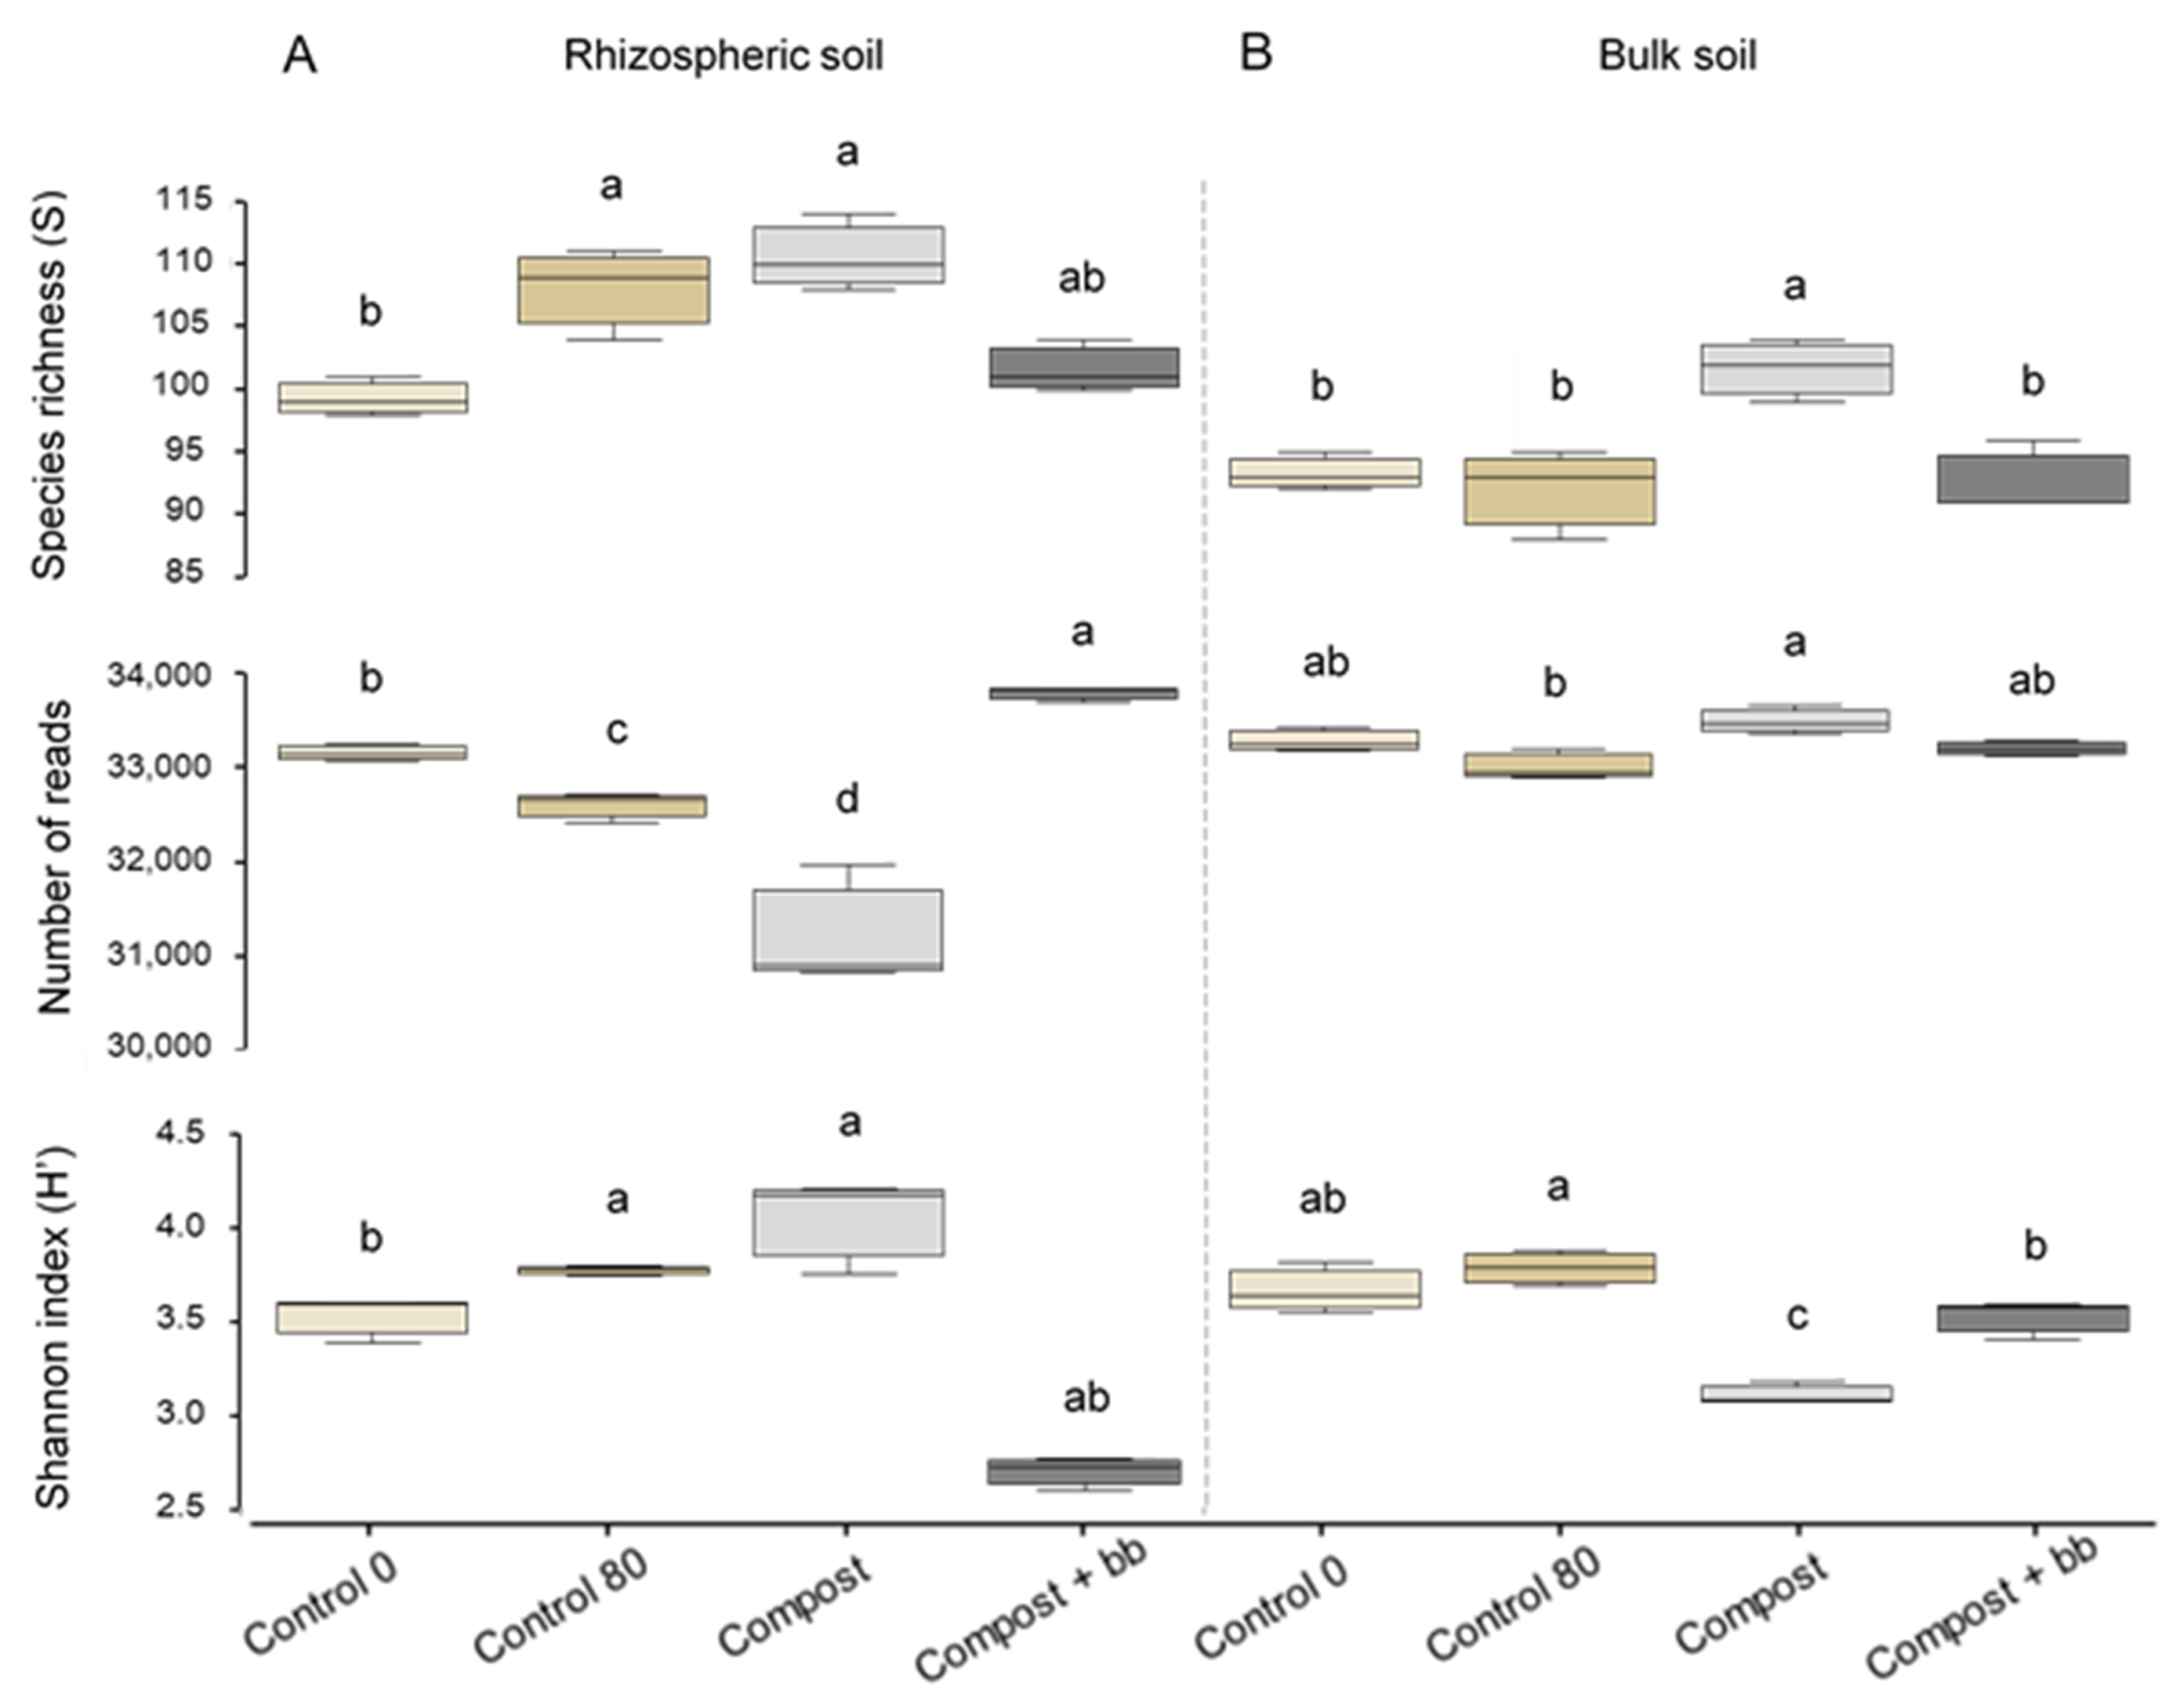
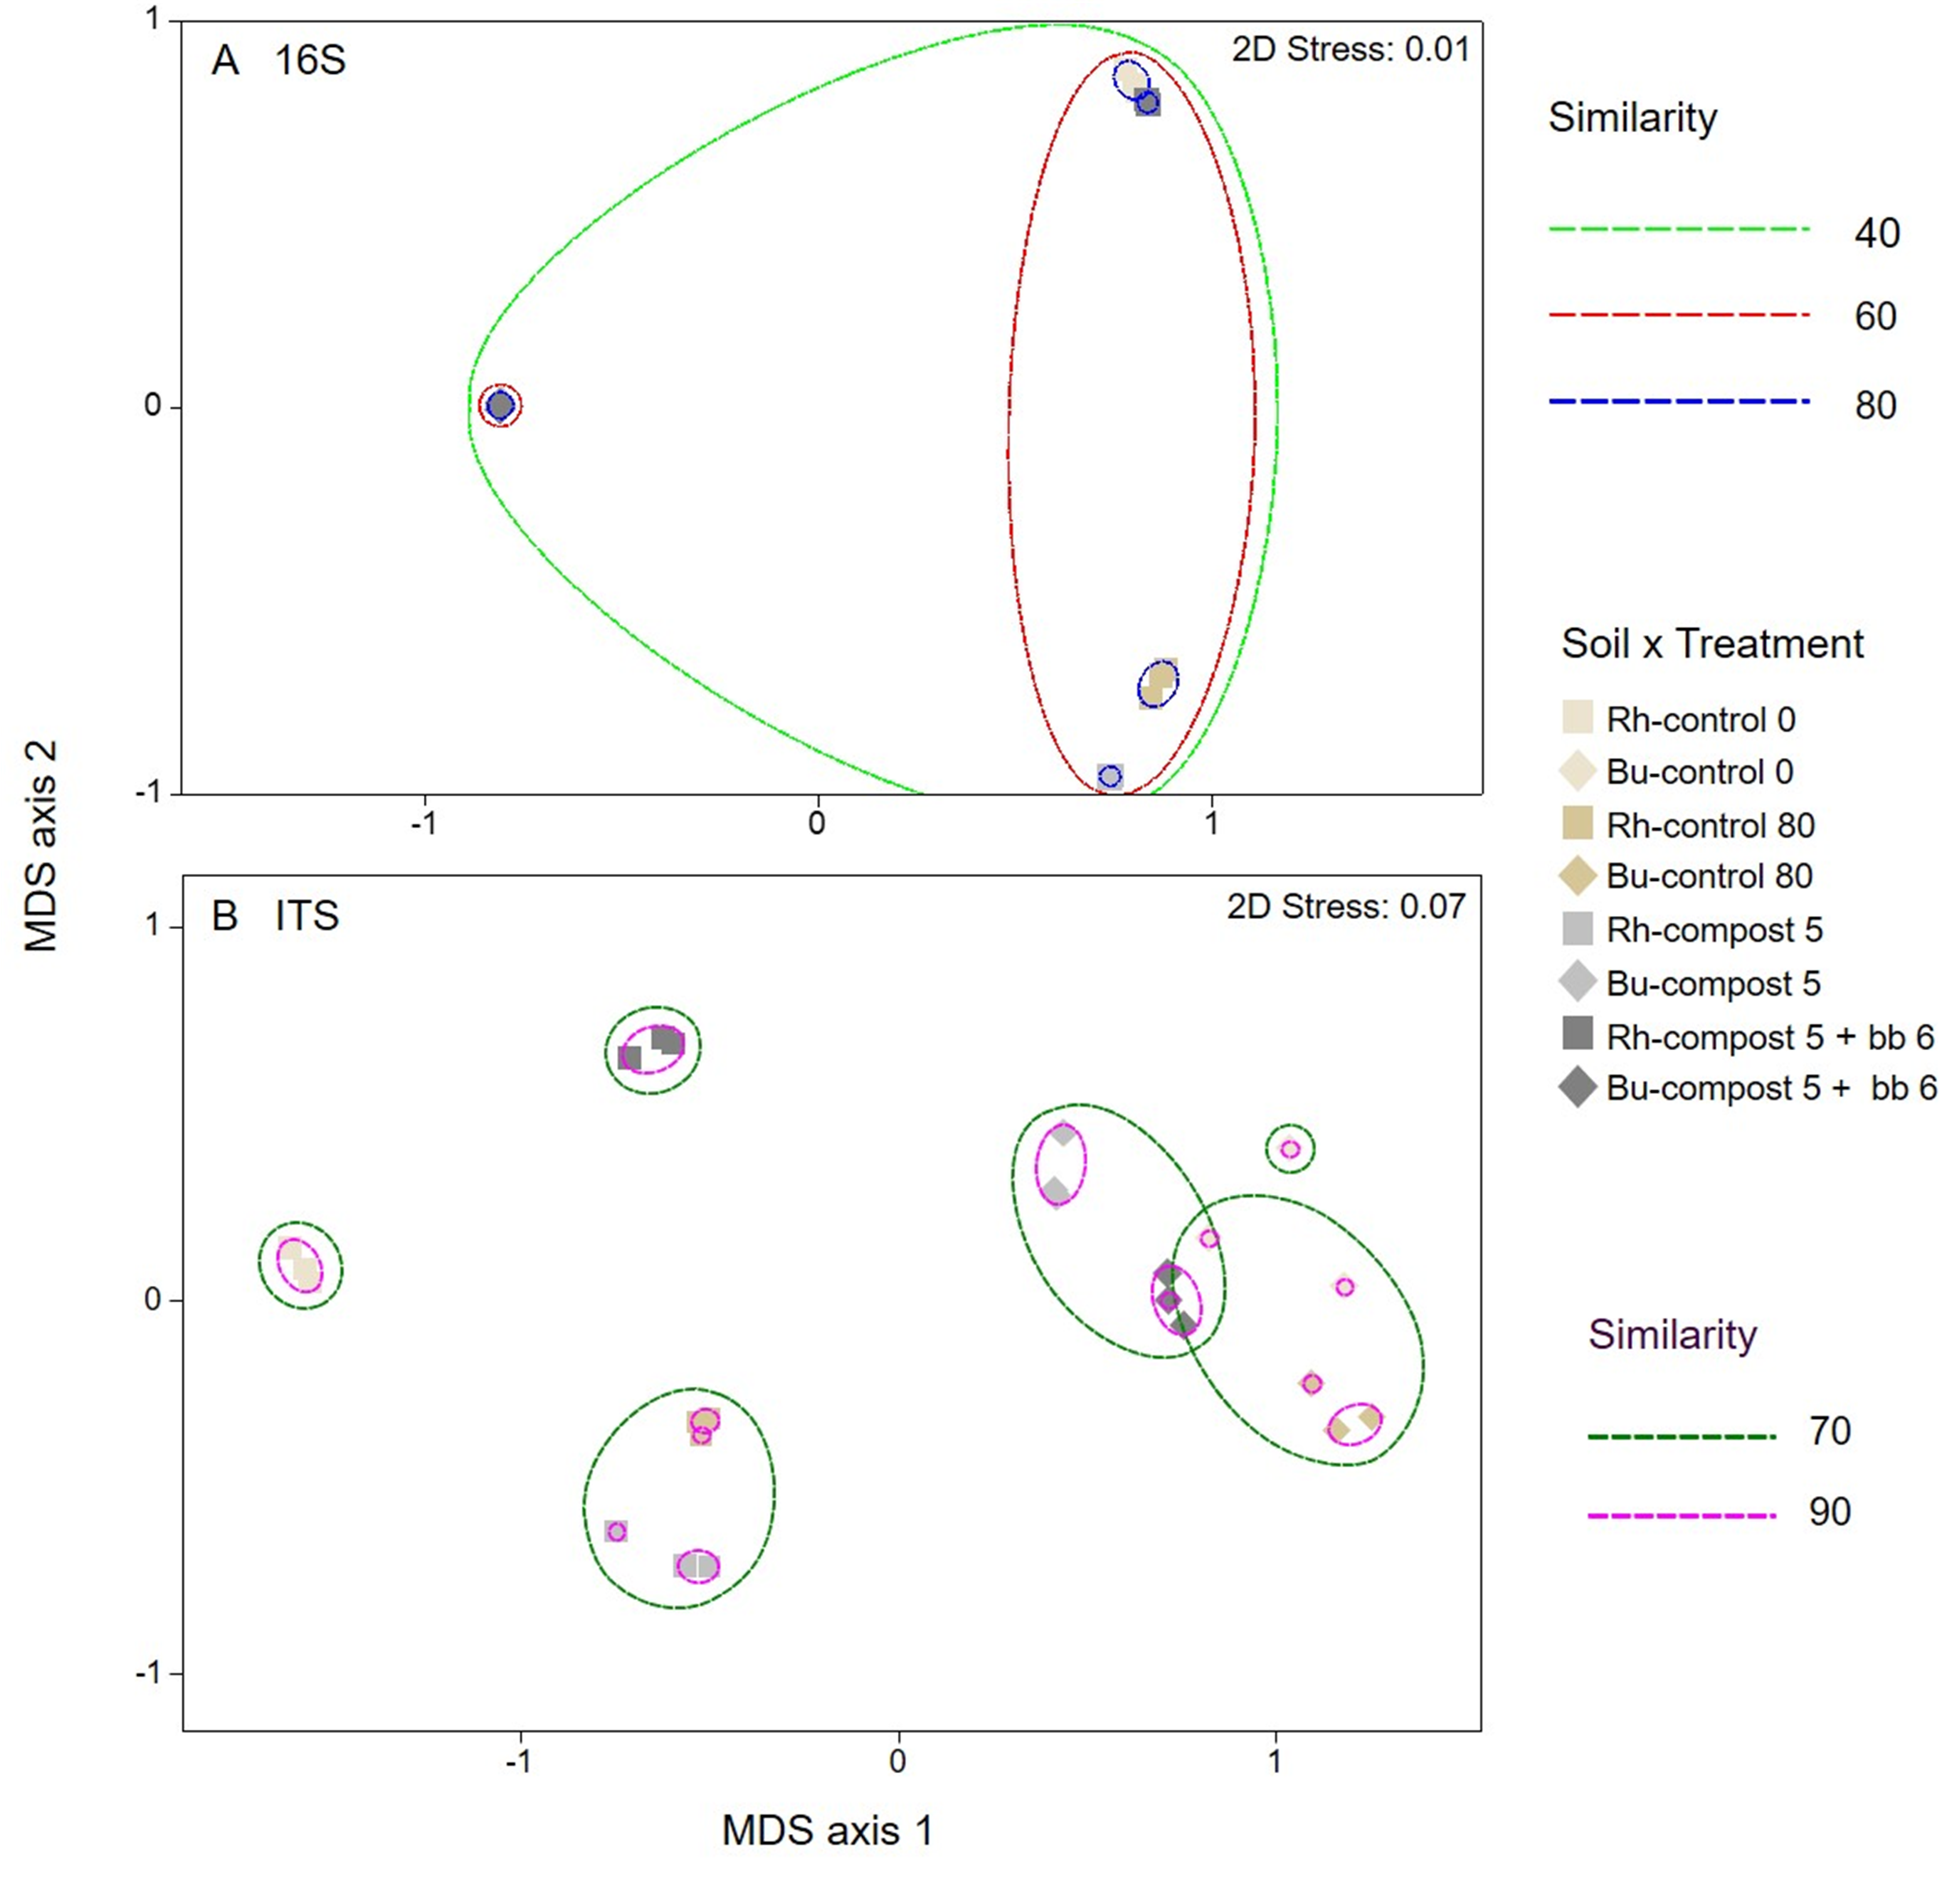
3.3. Bacterial and Fungal Diversity in Soil

Bacterial and fungal diversity showed a variation across the experimental samples (Figure 5 and Figure 6). For bacteria (Figure 5), species richness (S) was significantly higher in the doped compost compared with the rest of the treatments and controls, both in bulk and in rhizospheric soil, the absolute highest being in rhizospheric soil. The absolute lowest value was for control 80 in the bulk soil, but this value did not significantly differ from control 0 in the bulk soil. Regarding the number of reads, the highest value was for non-inoculated compost in the rhizospheric soil, which did not differ from the doped compost in the rhizospheric soil; conversely, in the bulk soil, the highest value was for control 80, which did not differ from control 0. The Shannon index (H’) indicated that the greatest diversity was in rhizospheric soil in the doped compost, and the lowest was in rhizospheric soil of the non-inoculated compost; interestingly, in the bulk soil, the H’ value did not significantly differ between the doped compost and the non-inoculated compost, being, in both cases, significantly higher than in the two controls. For the fungal community, S was generally higher in the rhizospheric soil than in the bulk soil, with few differences for the other parameters (number of reads and H’) between the two locations (Figure 6). Focusing on the rhizospheric soil (Figure 6A), the highest values for species richness and H’ were for the non-inoculated compost treatment, but they did not differ from either control 80 or the treatment with the doped compost; conversely, the number of reads was significantly lower for the non-inoculated compost treatment. Regarding the bulk soil (Figure 6B), the non-inoculated control produced significantly higher S and significantly lower H’ than the rest of the treatments and controls. The effect of the soil position, the treatments and their interaction on the diversity indexes for bacterial and fungi is shown in Tables S9 and S10.

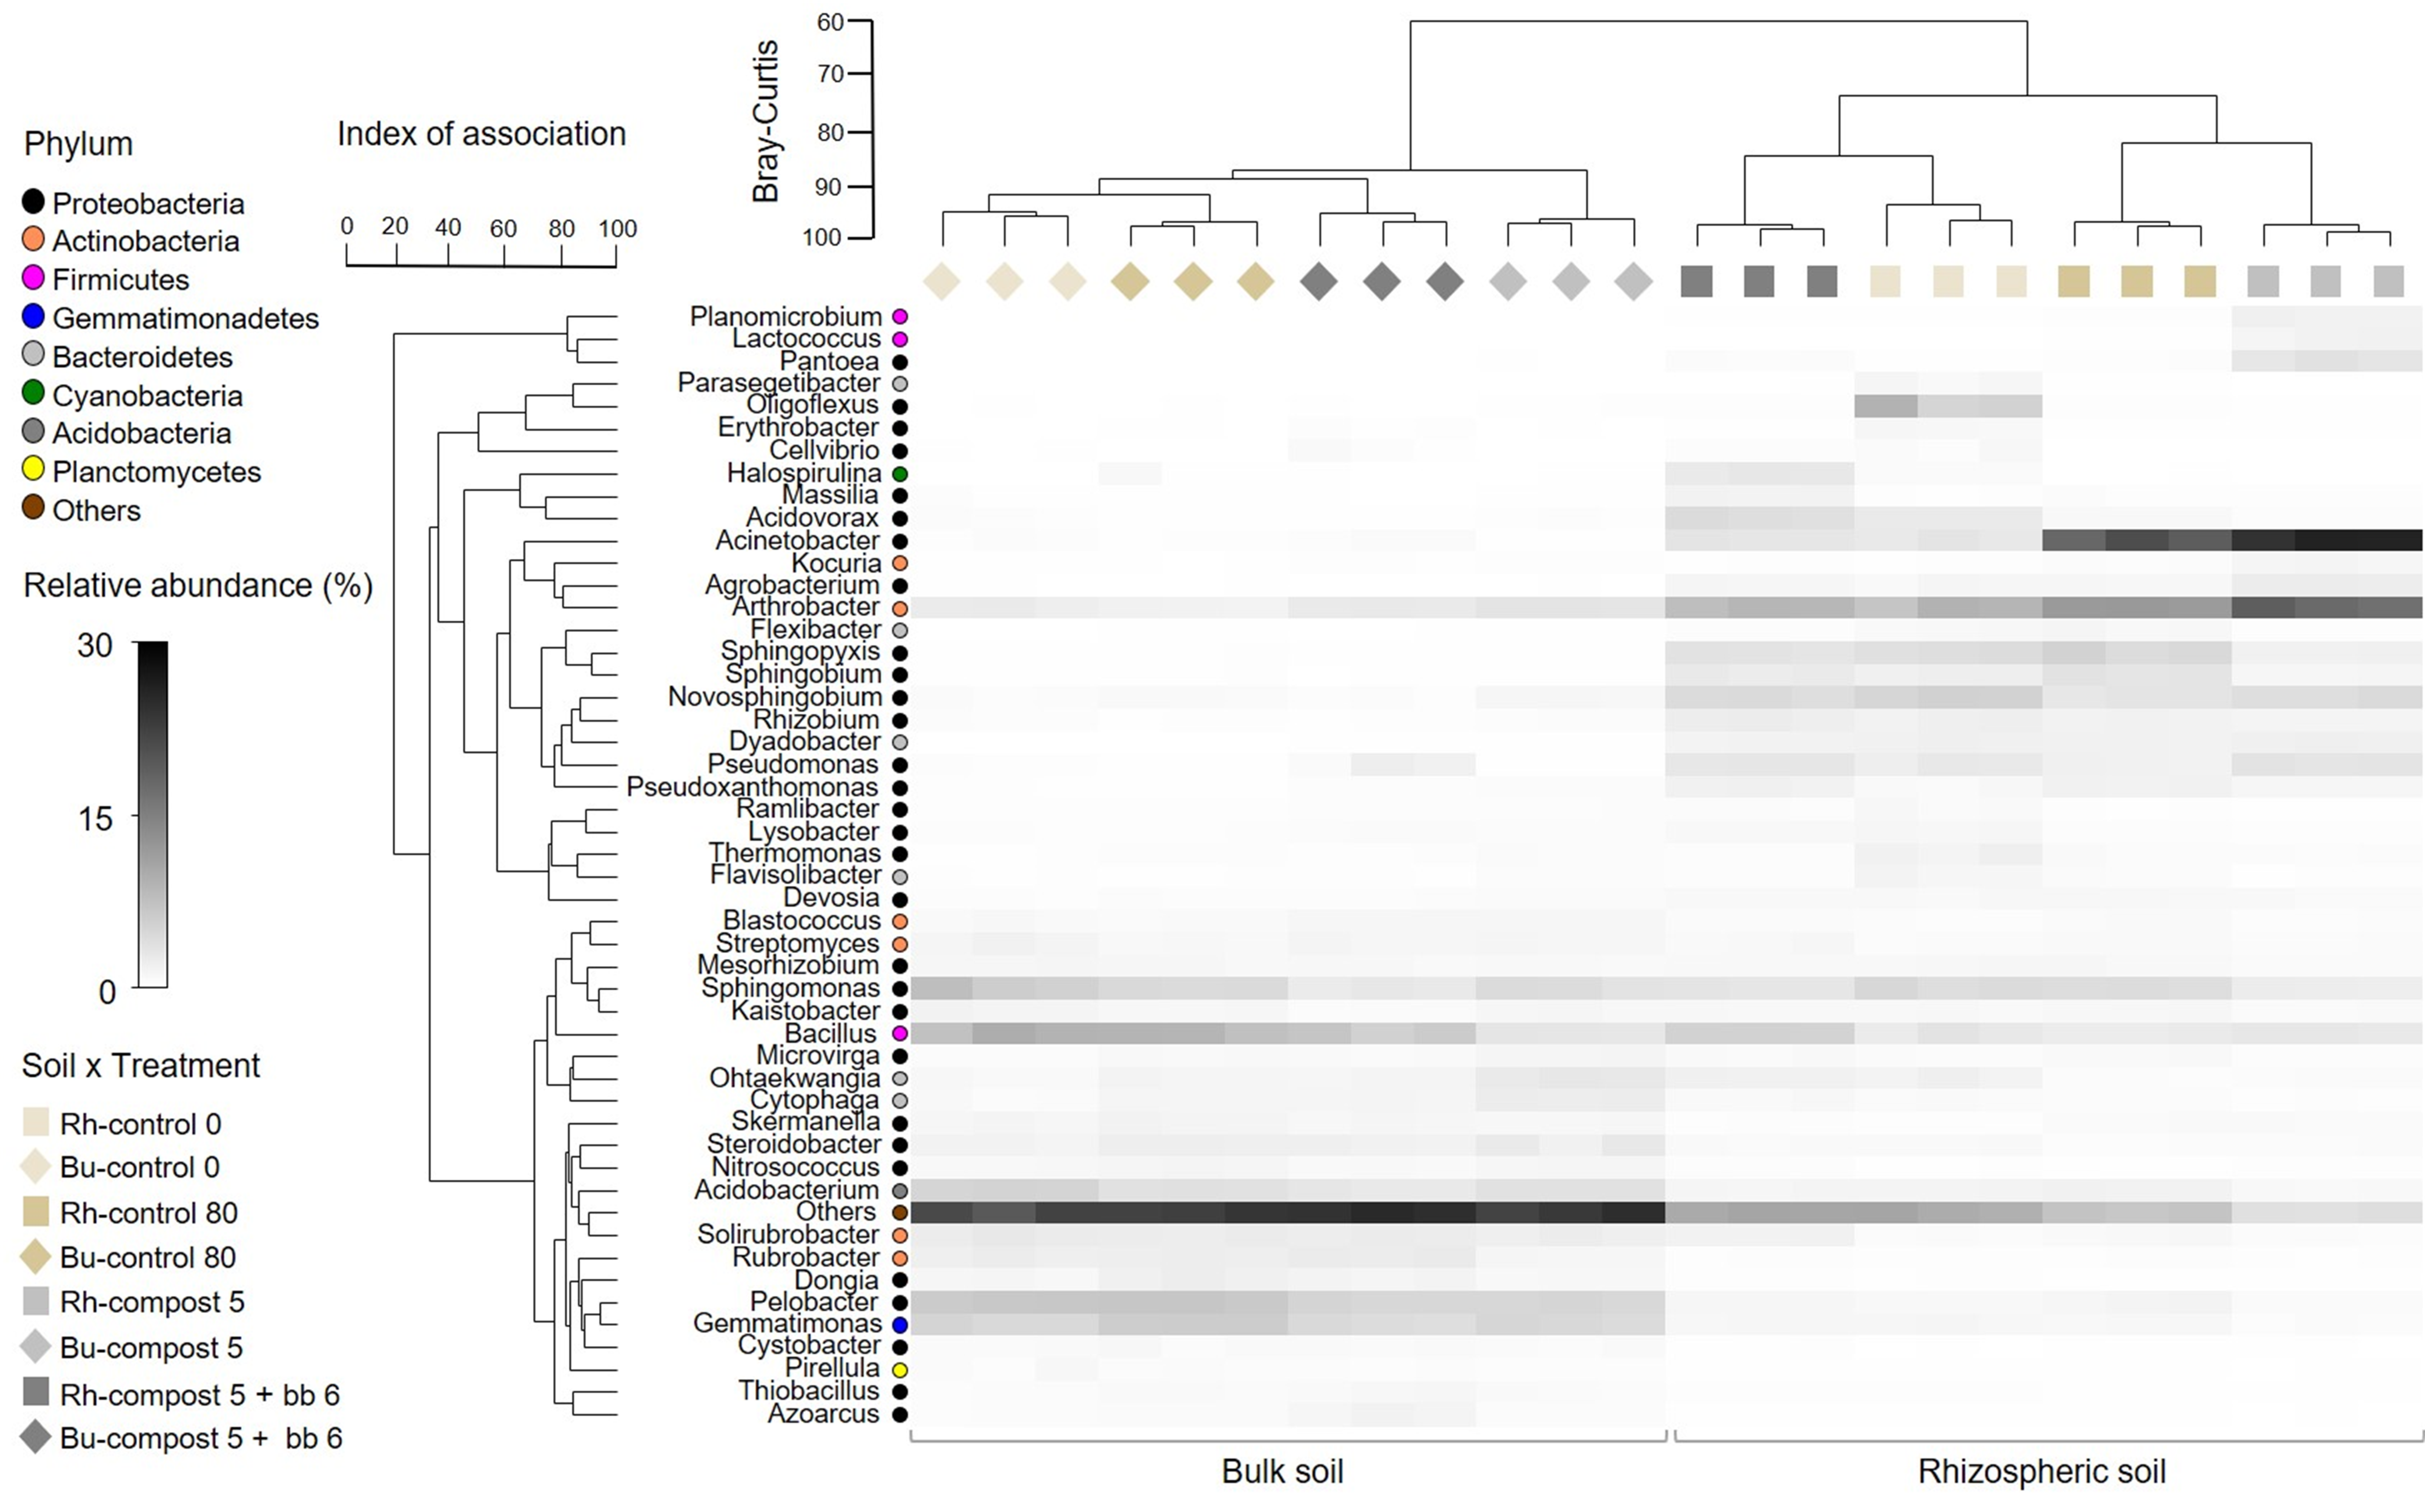
3.4. Composition of Bacterial and Fungal Soil Communities

The rhizospheric and bulk soil bacterial communities showed consistent changes in community organization when analyzed at the phylum level. The rhizospheric soil abundance of the phyla Proteobacteria, Actinobacteria and Bacteroidetes was higher, while in bulk soil, ASVs belonging to Firmicutes, Gemmatimonadetes and Acidobacteria dominated the bacterial community. Comparing communities by soil type, the differences between treatments were smaller in bulk soil than in rhizospheric soil (Figure S1). For fungal communities, non-relevant changes were observed at the phylum level for the type of soil, although the treatments produced an increased relative abundance of Basidiomycota in the rhizospheric soil (Figure S2).
At the ASV level, the bacterial and fungal communities differed between rhizospheric soil and bulk soil (Figure 7 and Figure 8), except for the shared presence of Ulocladium and Fusarium in both soil types. Irrespective of the treatment, the bacterial community was characterized by the high presence of Arthrobacter, Acinetobacter, Rhizobium, Pseudomonas, Sphingopyxis, Sphingobium and Novosphingobium in the rhizospheric soil and by Pelobacter, Gemmatimonas, Sphingomonas and Bacillus in the bulk soil (Figure 7).
The genus Bacillus showed a much higher relative abundance in the rhizospheric soil of the doped compost treatment than in the rest of the treatments. Concomitantly, several bacterial genera, such as Pseudoxantomonas, Massilia, Sphingopyxis, Sphingobium, Sphingomonas and Ohtaekwangia, increased in the doped compost treatment compared to the non-inoculated compost (compost 5), whilst the genera Pseudomonas and Rhizobium maintained their relative abundance but with a very slight increase in the latter, and the genera Acinetobacter and Arthrobacter decreased. However, few changes in relative abundance in the different genera were observed when comparing the doped compost treatment with the rest of the treatments in bulk soil. In the fungal community, irrespective of the treatment, an abundance of Plestosphaerella and Phoma in the rhizospheric soil and Erotium, Mortierella, Microascus, Chaetomium, Chrysosporium, Stachybotrys and Aspergillus in the bulk soil stood out (Figure 8). The treatment affected the relative abundance of the different genera in the rhizospheric soil, whilst negligible changes were observed in the bulk soil.
NMDS ordination showed that the bacterial community of the rhizospheric soil showed a response to the treatments, whilst there was no response in the bulk soil, as can be confirmed by the degree of similarity (Figure 9A). Notwithstanding, for the rhizospheric soil, control 0 and the treatment with compost 5+bb6 did not show significant differences in the pairwise comparison (Figure 9A) (Table 6), and the same occurred for control 80 and the treatment with compost 5 (Figure 9A and Table 6). Moreover, some differences in the composition of the fungal community as a result of the treatments were observed in the rhizospheric soil and, to a lesser extent, in the bulk soil (Figure 9B). In the pairwise comparisons, such differences were significant for three pairs of treatments in the rhizospheric soil and only for one pair of treatments in the bulk soil (Table 6).

4. Discussion

4.1. Yield, Yield Components and Biomass Production

For the two crops, melon and pepper, the doped compost produced a significant increase in yield and biomass production compared to the control with the same reduced dose of the mineral fertilizer (control 80). Moreover, the yield obtained in the treatment with the doped compost and a reduced dose of the mineral fertilizer was even higher than that obtained in the control without any type of compost and fertilized with the full mineral dose (control 100) (between 24% and 33% higher in melon and between 2% and 4% higher in pepper).
Furthermore, we have demonstrated that the incorporation of the inoculant, consisting of the Bacillus strain formulated with biochar as a carrier, improved the yield compared with the non-inoculated compost; this yield increase was up to 34% in the melon crop and up to 19% in the pepper crop. These results prove the effect of B. siamensis as a PGPR at field scale. Nowadays, not only is the biocontrol effect of Bacillus well known, but also its role as a plant growth promoter has been demonstrated. Examples of the latter are numerous for several horticultural crops and several different species of the genus Bacillus, e.g., red pepper [43], banana [44], radish [45], strawberry [46], Chinese cabbage [47], etc. It is known that the plant-growth-promoting effect of the MPBs belonging to the Bacillus species is largely due to phytohormone production [10], i.e., hormone-mediated effects are considered to be the reason for the yield increase when B. siamensis is inoculated onto the crop [48], and the same is true for other phylogenetically close species, such as B. amyloliquefaciens [49,50] and B. subtilis [51,52]. A possible hypothesis to explain the good field results obtained is that the mode of action of B. siamensis strain SCFB3-1 could be related to phytohormones. Indeed, SCFB3-1 was chosen as an MPB because, in a previous work [38], it showed a high rate of IAA production (2.8 μg IAA per each 1 × 10⁸ cfu) and high ACC deaminase activity (6.63 µmol ACC mg prot−1 h−1), the latter reducing the synthesis of the hormone ethylene. In the mentioned work, for both IAA and ACC, SCFB3-1 was at the beginning of the second quartile of the best producers, from a collection of 186 bacteria isolated from the rhizosphere of irrigated crops in Castilla y León (Spain) [38]. However, future research is needed to unravel the mode of action, because, according to [53], the hormone-producing microbes could improve the plant growth in two different ways: (i) direct action on the plant, or (ii) inducing changes in the rhizosphere microbiome (as observed in this work) consisting of attracting those taxa that exert a plant-growth-promotion effect.
Therefore, the observed effect of B. siamensis as an MPB is not a novelty, but what is truly new is the concept of the doped compost, which is a compost mixed with the MPB, using biochar as the carrier for the bacteria, which protects the bacteria and facilitates uniform mixing. Our results confirm that the addition of the formulated PGPR strain together with the compost at a final dose of 1.5 × 10⁹ cfu mL−1 exerted a noticeable effect on crop yield, which was accompanied by a modification of the rhizosphere microbiome. Although partial combinations of the components of the doped compost have been previously tested, the doped compost remains a novelty, as far as we know. In this way, biochar has been previously combined with NPK mineral fertilizers by [54], who observed crop yield increases and reduced greenhouse gas emissions compared to mineral fertilizers alone, and by [55,56], who also observed an improved nutrients’ availability by the crop, as a consequence of biochar addition. Other authors, e.g., [57,58], combined compost and biochar in soil and observed a synergistic effect on the microbial biomass and activity and, as a consequence, on plant growth. PGPRs have been mixed with biochar; [59] obtained the best economic return in wheat with a reduced dose of mineral fertilizer combined with biochar and PGPR. The effect of triple mixes of compost, biochar and PGPR has been analyzed at the microcosm scale, i.e., in pots, to overcome abiotic [60] and biotic stress [61], as well as for bioremediation [62,63]. However, to the best of our knowledge, this is the first work that analyzes the effect of doped compost (triple mix of compost, PGPR and biochar) at field scale, evaluating the effect on the soil microbiome and on the crop yield.

4.2. Chlorophyll Content, Flowering and Fruit Parameters

According to the literature, the observed higher chlorophyll content in the leaves of both melon and pepper crops could be due to the effect of IAA produced by the inoculated strain [64], which was as high as 2.8 μg IAA per each 1 × 10⁸ cfu [38]. Moreover, the chlorophyll content depends on the concentration of available nitrogen in plants [65] because N stimulates the chlorophyll biosynthesis process [66]. This is consistent with the fact that control 100 showed the highest chlorophyll content, as previously observed by [67] in tomato; however, compost is a source of N, and thus the addition of compost at the highest dose significantly improves the chlorophyll content compared to the control without compost; interestingly, supplementation of the compost also increased the chlorophyll content compared to the non-inoculated compost, and thus the inoculant, which does not provide N, must act in a different way, probably improving the N use efficiency.
For the melon crop, the treatment compost 5+bb6 produced the highest values of fruit contour, conductivity and solute concentration, which are fruit quality indexes, the latter two related to the concentration of minerals in the fruit flesh. The effect of the doped compost on the concentration of minerals in melon fruit flesh cannot be replaced by a higher dose of nutrients in mineral form, because control 100 showed significantly lower conductivity and solute concentration. A possible hypothesis to explain the observed improvement in mineral content in the fruit flesh could be related to gibberellin production [68], but the confirmation of this hypothesis would need further research. Surprisingly, for the pepper crop, the response of the crop to the treatments with doped compost was the opposite to that of the melon crop and resulted in a decreased solute concentration; moreover, the fruit contour was not modified by treatment with doped compost, indicating that the response regarding these parameters depends on the crop, and it is not possible to establish a general rule for such parameters.
In line with the results obtained for these parameters in plants and fruit, other authors, such as [69], have noted the importance and potential of PGPR for the improvement of sustainable, environmentally friendly vegetable production for healthy human nutrition, with special reference to selected vegetable species, such as tomato, pepper, melon, radish and lettuce, because of increasing food-borne illnesses.

4.3. Soil Microbiome: Bacteria

As expected, we observed sharp changes in the bacterial community in both the rhizosphere and the bulk soil. This is a common situation that has been described by other authors [70,71]. Moreover, the highest dose of doped compost (compost 5+bb6) modified the composition of the bacterial community, but only in the rhizospheric soil and not in the bulk soil; indeed, in the rhizospheric soil, the treatment compost 5+bb6 produced a greater relative abundance of the Bacillus genus, to which the inoculated strain also belongs; this could indicate that the crop would select the inoculated strain because it is beneficial for the plant, given that it was selected because it is a PGPR [16,38]. Moreover, comparing the rhizosphere bacterial community of the crop treated with the doped compost (compost 5+bb6) with that of the crop treated with the non-doped compost (compost 5), other changes were observed in addition to the Bacillus abundance; thus, the relative abundance of the genera Pseudoxantomonas, Massilia, Sphingopyxis, Sphingobium, Sphingomonas and Ohtaekwangia increased; Pseudomonas and Rhizobium maintained their relative abundance, whilst the relative abundance of Acinetobacter and Arthrobacter decreased. In such a way, the addition of a PGPR induces a modification of the rhizospheric taxa, specifically of the rhizosphere bacterial community. However, the following questions arise: how is the change in the rhizospheric community triggered? Is it the PGPR that directly attracts or diminishes other genera? By contrast, is it the plant that attracts other genera as a result of a change in the roots’ secretions in turn induced by the PGPR? Jacobs-Hoffman and Hills [72] indicated that the modification of the rhizosphere bacterial community could be induced by the inoculated PGPR, a selection taking place exerted by the roots of the crop. Moreover, [53] demonstrated that the inoculation of the PGPR B. subtilis stimulates the production of cytokinins in wheat, and this increases the diversity and size of the beneficial rhizospheric microbiota; thus, these authors demonstrated that the inoculated PGPR triggers biochemical changes in the plant root to attract specific bacteria. From our results, it could be hypothesized that similar processes are triggered by the inoculation of the PGPR B. siamensis at the highest dose that clearly modified the composition of the rhizosphere bacterial community, with a concurrent increase in bacterial diversity and richness, as could be seen in the boxplot. Consequently, the doped compost produces a positive effect on the rhizosphere compared with the non-inoculated compost. Thus, in our work, the inoculated PGPR strain could be responsible for: (i) the increase in the relative abundance of other bacteria with PGP properties, such as Pseudoxantomonas [73,74] and Massilia [75]; (ii) the maintenance of Rhizobium and Pseudomonas, which are proven PGPRs [76,77] and (iii) the increase in other bacterial genera that produce beneficial effects in the soil, which indirectly improves plant growth, e.g., Sphingopyxis, Sphingobium, Sphingomonas and Ohtaekwangia. Specifically, Sphingopyxis, Sphingobium and Sphingomonas degrade aromatic compounds [78,79], and could act synergistically with biochar, which favors the sorption of these compounds in soil [80]. Moreover, Ohtaekwangia contains nitrifying strains, and others with antifungal and insecticidal properties [81], while the Sphingopyxis genus has the ability to produce indolacetic acid (IAA) [82] and other secondary metabolites [79]. Therefore, an increase in or maintenance of the beneficial bacterial strains has been observed in the new rhizosphere microbiome obtained as a result of the treatment with doped compost (compost 5+bb6), and this could be related to the positive agronomic effects found for this treatment. However, interestingly, control 0 and compost 5+bb6 are shown to be similar in nMDS analysis and with no significant differences in the pairwise analysis via PERMANOVA. The reason for this could be that, in spite of the differences observed for the above-indicated genera, the rest of the bacterial genera have maintained their relative abundance in both treatments, with more species richness (S) in compost 5+bb6, but a similar Shannon index. This could be interpreted as the very low environmental impact of the use of the doped compost, i.e., the inoculated strains produce an increase in the beneficial strains whilst not altering the overall microbiome composition.
By contrast, in the bulk soil, where the plant cannot intervene directly, the doped compost did not modify the soil bacterial community, including the relative abundance of the Bacillus genus, compared, e.g., with control 0, which did not receive any treatment. Furthermore, in the bulk soil, there was no noticeable modification of the relative abundance of the rest of the bacterial genera in the doped treatment. These results clearly indicate that B. siamensis requires plant host proximity to exert its effect as a bio-stimulant and modulator of the rhizospheric community. The addition of B. siamensis to naked soil long before crop transplantation could otherwise bring a loss in frequency of the inoculated taxa that are otherwise overwhelmed by the extant soil microbiota.

4.4. Soil Microbiome: Fungi

The doped compost modified the fungal microbiome in the rhizospheric soil, whilst, in the bulk soil, the changes were negligible, as evidenced by the heat plot, the nMDS chart and the PERMANOVA. Accordingly, for the bulk soil, the doped compost, the non-inoculated compost and control 0 were plotted nearby in the nMDS, and the pairwise comparisons between them were not significant according to PERMANOVA. On the other hand, for the rhizospheric soil, the mentioned treatments were plotted clearly apart, and the pairwise comparison revealed significant differences. The observed differences between treatments in the rhizospheric soil were due to modifications in the microbiome, i.e., the increase in the genus Fusarium in the doped compost when it is compared to the other treatments; moreover, in the doped compost, Plectosphaerella and Phoma strongly decreased, Aspergillus and Chrysosporium practically disappeared and Ulocladium slightly decreased compared to the other treatments. The genus Fusarium is known for several species that are notorious soil-borne pathogens that cause serious losses in hundreds of economically important crops worldwide [83], including the melon crop. However, despite the increase in the genus Fusarium in both bulk and rhizospheric soils, in our field trial, there was no evidence of disease caused by Fusarium; conversely, there was a significantly higher yield and plant biomass, as well as better values of other parameters. Thus, the observed increase in Fusarium would correspond to non-pathogenic Fusarium strains that, interestingly, have been described as PGPRs and inducers of systemic resistance [84]. The genera Plectosphaerella and Phoma are well known as soil pathogens for plants [85], causing significant economic damage to horticultural crops [86]. Hence, the strong decrease in these genera in the treatments with doped compost is very beneficial for melon crops and could contribute to explaining the improved values of the agronomic parameters.

5. Conclusions

The doped compost, regardless of the inoculant dose (3% or 6%), produced the highest yield of all the treatments, which was, in comparison with the control that received the same mineral dose (control 80), 47% higher in melon and 30% higher in pepper. The yield components, the aerial biomass of the plant and the chlorophyll content, an indirect measurement of N assimilation, showed the same response to doped compost application. The best combination to optimize yields in melon and pepper crops was a reduced dose of mineral fertilizer (80%) combined with the lowest dose of compost (2 t/ha) doped with the highest dose of inoculant (6%). Interestingly, the yield increase did not involve a modification of the bacterial composition in the bulk soil, whilst the fungal composition was slightly modified. Conversely, the bacterial and, to a lesser extent, the fungal composition of the rhizosphere was modified by treatment with doped compost, although the modification was more evident with the inoculant dose of 6%. Thus, considering that the inoculant (biochar+PGPR) does not provide nutrients as such, the significant yield increase compared with the non-inoculated compost could be due to the inoculated strain B. siamensis SCFB3-1 but also to other native strains, potentially beneficial for the plant, that were attracted to the rhizosphere as a consequence of the treatment. It is relevant from the environmental side that the replacement of 20% of the mineral NPK fertilizer by the doped compost increased the yield compared to the full mineral NPK dose, contributing to mineral fertilizer savings for farmers and improvements in the environmental performance of these crops; moreover, in the case of melon, some fruit parameters were also increased, namely the fruit contour and the solute concentration in the fruit juice.
This work has demonstrated, at field scale, the agronomic value of supplementing compost with PGPRs. It has also demonstrated that the treatment mainly modified the rhizospheric microbiome. Thus, future research is necessary to unravel the mechanisms responsible for the observed agronomic effect, focusing on the effect of phytohormones, and the origin of such phytohormones, which can include not only those produced by the inoculated microbes, but also by the new components of the rhizosphere microbiome and by the plant as a response to the microbial inhabitants of its rhizosphere. Our study opens up the understanding of the association of plant and bacterial and fungal communities in response to an organic fertilizer inoculated with biochar and a PGPR strain in agricultural systems.

Supplementary Materials

The following supporting information can be downloaded at: https://www.mdpi.com/article/10.3390/agronomy12112620/s1, Figure S1: Stacked bar plot indicating the relative abundance of bacterial phyla for the factors: type of soil (A) and type of soil and treatment (B); Figure S2: Stacked bar plot indicating the relative abundance of fungal phyla for the factors: type of soil (A) and type of soil and treatment (B); Table S1: Composition of the compost used; Table S2: Composition of the biochar used for the experiment; Table S3: Soil analysis previous to the field trials; Table S4: Climatic conditions of the locations selected for field trials in 2018 and 2019; Table S5: Mean values for yield, yield components and biomass production, obtained in the field trial for the melon crop. Means followed by the same letter did not differ significantly at p ≤ 0.05 in Tukey’s test; Table S6: Mean values for yield, yield components and biomass production, obtained in the field trial for the pepper crop. Means followed by the same letter did not differ significantly at p ≤ 0.05 in Tukey’s test; Table S7: Mean values for leaf chlorophyll content, flowering and several fruit parameters obtained in the field trial for the melon crop. Means followed by the same letter did not differ significantly at p ≤ 0.05 in Tukey’s test; Table S8: Mean values for leaf chlorophyll content, flowering and several fruit parameters obtained in the field trial for the pepper crop. Means followed by the same letter did not differ significantly at p ≤ 0.05 in Tukey’s test; Table S9: Results of factorial ANOVA on bacterial species richness (S), number of reads (N), Shannon index (H’) according to the effect of the soil position (rhizospheric or bulk), the treatments and the interaction of the two explanatory variables. Significant differences for value of p below 0.05; Table S10: Results of factorial ANOVA on fungal species richness (S), number of reads (N), Shannon index (H’) according to the effect of the soil position (rhizospheric or bulk), the treatments and the interaction of the two explanatory variables. Significant differences for value of p below 0.05.

Author Contributions

N.O.-L. investigation, formal analysis, supervision, writing—original draft; M.Z. formal analysis, writing—review and editing; M.B. investigation, writing—review and editing; F.G.-A. conceptualization, formal analysis, writing—review and editing, funding acquisition. All authors have read and agreed to the published version of the manuscript.

Funding

This research was funded by the Spanish Ministry of Economy and Competitiveness (project ‘LIGNOxBIOp’ RTC 2016-5834-5), and by University of León, León, Spain.

Data Availability Statement

All relevant data supporting the findings of this study are included in this article. Correspondence and requests for materials should be addressed to F.G.-A.

Acknowledgments

N.O.-L. was granted a fellowship from the FPU program by the Spanish Ministry of Education with code (FPU 17/04201).

Conflicts of Interest

The authors certify that they have no affiliations with or involvement in any organization or entity with any financial interest (such as honoraria; educational grants; participation in speakers’ bureaus; membership, employment, consultancies, stock ownership, or other equity interest; and expert testimony or patent-licensing arrangements), or non-financial interest (such as personal or professional relationships, affiliations, knowledge or beliefs) in the subject matter or materials discussed in this manuscript.

References

  1. Poveda, J. Insect Frass in the Development of Sustainable Agriculture. A Review. Agron. Sustain. Dev. 2021, 41, 5. [Google Scholar] [CrossRef]
  2. FAO. World Food and Agriculture-Statistical Pocketbook; FAO: Rome, Italy, 2018. [Google Scholar]
  3. Barea, J.M. Future Challenges and Perspectives for Applying Microbial Biotechnology in Sustainable Agriculture Based on a Better Understanding of Plant-Microbiome Interactions. J. Soil Sci. Plant Nutr. 2015, 15, 261–282. [Google Scholar] [CrossRef]
  4. Backer, R.; Rokem, J.S.; Ilangumaran, G.; Lamont, J.; Praslickova, D.; Ricci, E.; Subramanian, S.; Smith, D.L. Plant Growth-Promoting Rhizobacteria: Context, Mechanisms of Action, and Roadmap to Commercialization of Biostimulants for Sustainable Agriculture. Front. Plant Sci. 2018, 9, 1473. [Google Scholar] [CrossRef] [PubMed] [Green Version]
  5. Wezel, A.; Goris, M.; Bruil, J.; Félix, G.F.; Peeters, A.; Bàrberi, P.; Bellon, S.; Migliorini, P. Challenges and Action Points to Amplify Agroecology in Europe. Sustainability 2018, 10, 1598. [Google Scholar] [CrossRef] [Green Version]
  6. Besset-Manzoni, Y.; Rieusset, L.; Joly, P.; Comte, G.; Prigent-Combaret, C. Exploiting Rhizosphere Microbial Cooperation for Developing Sustainable Agriculture Strategies. Environ. Sci. Pollut. Res. 2018, 25, 29953–29970. [Google Scholar] [CrossRef]
  7. Cong, R.G.; Thomsen, M. Review of Ecosystem Services in a Bio-Based Circular Economy and Governance Mechanisms. Ecosyst. Ser. 2021, 50, 101298. [Google Scholar] [CrossRef]
  8. Barquero, M.; Pastor-Buies, R.; Urbano, B.; González-Andrés, F. Challenges, Regulations and Future Actions in Biofertilizers in the European Agriculture: From the Lab to the Field. In Microbial Probiotics for Agricultural Systems. Sustainability in Plant and Crop Protection; Zúñiga-Dávila, D., González-Andrés, F., Ormeño-Orrillo, E., Eds.; Springer: Cham, Switzerland, 2019; pp. 83–107. [Google Scholar] [CrossRef]
  9. Gutierrez-Albanchez, E.; García-Villaraco, A.; Lucas, J.A.; Horche, I.; Ramos-Solano, B.; Gutierrez-Mañero, F.J. Pseudomonas palmensis Sp. Nov., a Novel Bacterium Isolated From Nicotiana Glauca Microbiome: Draft Genome Analysis and Biological Potential for Agriculture. Front. Microbiol. 2021, 12, 1–15. [Google Scholar] [CrossRef]
  10. Poveda, J.; González-Andrés, F. Bacillus as a Source of Phytohormones for Use in Agriculture. Appl. Microbiol. Biotechnol. 2021, 105, 8629–8645. [Google Scholar] [CrossRef]
  11. Gamalero, E.; Glick, B.R. Plant Growth-Promoting Bacteria in Agriculture and Stressed Environments. In Modern Soil Microbiology; van Elsas, J.D., Trevors, J.T., Eds.; CRC Press: Boca Raton, FL, USA, 2019; pp. 361–380. [Google Scholar]
  12. Glick, B.R. Introduction to Plant Growth-Promoting Bacteria. In Beneficial Plant-Bacterial Interactions; Glick, B.R., Ed.; Springer: Cham, Switzerland, 2020; p. 383. [Google Scholar] [CrossRef]
  13. Ngalimat, M.; Yahaya, R.; Baharudin, M.; Yaminudin, S.; Karim, M.; Ahmad, S.; Sabri, S. A Review on the Biotechnological Applications of the Operational Group Bacillus Amyloliquefaciens. Microorganisms 2021, 9, 614. [Google Scholar] [CrossRef]
  14. European Council Regulation (EU) 2019/1009 of the European Parliament and of the Council of 5 June 2019 Laying Down Rules on the Making Available on the Market of EU Fertilising Products and Amending Regulations (EC) No 1069/2009 and (EC) No 1107/2009 and Repealing Regulation (EC) No 2003/2003. Available online: https://eur-lex.europa.eu/legal-content/EN/TXT/?uri=celex%3A32019R1009 (accessed on 17 July 2022).
  15. Yadav, A.N. Plant Microbiomes for Sustainable Agriculture: Current Research and Future Challenges. In Plant Microbiomes for Sustainable Agriculture; Yadav, A.N., Singh, J., Rastegari, A., Yadav, N., Eds.; Springer: Cham, Switzerland, 2020; pp. 475–482. [Google Scholar]
  16. Pastor-Bueis, R.; Mulas, R.; Gómez, X.; González-Andrés, F. Innovative Liquid Formulation of Digestates for Producing a Biofertilizer Based on Bacillus siamensis: Field Testing on Sweet Pepper. J. Plant Nutr. Soil Sci. 2017, 180, 748–758. [Google Scholar] [CrossRef]
  17. Thapa, R.; Tully, K.L.; Cabrera, M.L.; Dann, C.; Schomberg, H.H.; Timlin, D.; Reberg-Horton, C.; Gaskin, J.; Davis, B.W.; Mirsky, S.B. Effects of Moisture and Temperature on C and N Mineralization from Surface-Applied Cover Crop Residues. Biol. Fertil. Soils 2021, 57, 485–498. [Google Scholar] [CrossRef]
  18. Cabrera, M.L.; Kissel, D.E.; Vigil, M.F. Nitrogen Mineralization from Organic Residues. J. Environ. Qual. 2005, 34, 75–79. [Google Scholar] [CrossRef] [PubMed] [Green Version]
  19. Joshi, D.R.; Clay, D.E.; Clay, S.A.; Smart, A.J. Seasonal Losses of Surface Litter in Northern Great Plains Mixed-Grass Prairies. Rangel. Ecol. Manag. 2020, 73, 259–264. [Google Scholar] [CrossRef]
  20. Poffenbarger, H.J.; Mirsky, S.B.; Weil, R.R.; Kramer, M.; Spargo, J.T.; Cavigelli, M.A.; Poff, H.J.; Mirsky, S.B.; Cavigelli, M.A.; Spargo, J.T. Legume Proportion, Poultry Litter, and Tillage Effects on Cover Crop Decomposition. Agron. J. 2015, 107, 2083–2096. [Google Scholar] [CrossRef]
  21. Mazzoleni, S.; Bonanomi, G.; Incerti, G.; Chiusano, M.L.; Termolino, P.; Mingo, A.; Senatore, M.; Giannino, F.; Cartenì, F.; Rietkerk, M.; et al. Inhibitory and Toxic Effects of Extracellular Self-DNA in Litter: A Mechanism for Negative Plant-Soil Feedbacks? New Phytol. 2015, 205, 1195–1210. [Google Scholar] [CrossRef] [Green Version]
  22. Bonanomi, G.; Lorito, M.; Vinale, F.; Woo, S.L. Organic Amendments, Beneficial Microbes, and Soil Microbiota: Toward a Unified Framework for Disease Suppression. Annu. Rev. Phytopathol. 2018, 56, 1–20. [Google Scholar] [CrossRef]
  23. De Corato, U. Sustainability Editorial Towards New Soil Management Strategies for Improving Soil Quality and Ecosystem Services in Sustainable Agriculture: Editorial Overview. Sustainability 2020, 12, 9398. [Google Scholar] [CrossRef]
  24. Arif, M.S.; Shahzad, S.M.; Riaz, M.; Yasmeen, T.; Shahzad, T.; Akhtar, M.J.; Bragazza, L.; Buttler, A. Nitrogen-Enriched Compost Application Combined with Plant Growth-Promoting Rhizobacteria (PGPR) Improves Seed Quality and Nutrient Use Efficiency of Sunflower. J. Plant Nutr. Soil Sci. 2017, 180, 464–473. [Google Scholar] [CrossRef]
  25. Biederman, L.A.; Stanley Harpole, W. Biochar and Its Effects on Plant Productivity and Nutrient Cycling: A Meta-Analysis. GCB Bioenergy 2013, 5, 202–214. [Google Scholar] [CrossRef]
  26. Jeffery, S.; Abalos, D.; Prodana, M.; Bastos, A.C.; van Groenigen, J.W.; Hungate, B.A.; Verheijen, F. Biochar Boosts Tropical but Not Temperate Crop Yields. Environ. Res. Lett. 2017, 12, 053001. [Google Scholar] [CrossRef]
  27. Tan, G.; Wang, H.; Xu, N.; Liu, H.; Zhai, L. Biochar Amendment with Fertilizers Increases Peanut N Uptake, Alleviates Soil N 2 O Emissions without Affecting NH 3 Volatilization in Field Experiments. Environ. Sci. Pollut. Res. 2018, 25, 8817–8826. [Google Scholar] [CrossRef]
  28. Kalu, S.; Oyekoya, G.N.; Ambus, P.; Tammeorg, P.; Simojoki, A.; Pihlatie, M.; Karhu, K. Effects of Two Wood-Based Biochars on the Fate of Added Fertilizer Nitrogen—A 15N Tracing Study. Biol. Fertil. Soils 2021, 57, 457–470. [Google Scholar] [CrossRef]
  29. Glaser, B.; Parr, M.; Braun, C.; Biochar, K.G. Is Carbon Negative. Nat. Geosci. 2009, 2, 2. [Google Scholar] [CrossRef]
  30. Singh, B.P.; Cowie, A.L.; Smernik, R.J. Biochar Carbon Stability in a Clayey Soil as a Function of Feedstock and Pyrolysis Temperature. Environ. Sci. Technol. 2012, 46, 11770–11778. [Google Scholar] [CrossRef] [PubMed]
  31. Borchard, N.; Schirrmann, M.; Cayuela, M.L.; Kammann, C.; Wrage-Mönnig, N.; Estavillo, J.M.; Fuertes-Mendizábal, T.; Sigua, G.; Spokas, K.; Ippolito, J.A.; et al. Biochar, Soil and Land-Use Interactions That Reduce Nitrate Leaching and N2O Emissions: A Meta-Analysis. Sci. Total Environ. 2019, 651, 2354–2364. [Google Scholar] [CrossRef]
  32. Nguyen, T.T.N.; Xu, C.Y.; Tahmasbian, I.; Che, R.; Xu, Z.; Zhou, X.; Wallace, H.M.; Bai, S.H. Effects of Biochar on Soil Available Inorganic Nitrogen: A Review and Meta-Analysis. Geoderma 2017, 288, 79–96. [Google Scholar] [CrossRef] [Green Version]
  33. Hagemann, N.; Kammann, C.I.; Schmidt, H.P.; Kappler, A.; Behrens, S. Nitrate Capture and Slow Release in Biochar Amended Compost and Soil. PLoS ONE 2017, 12, 1–16. [Google Scholar] [CrossRef] [Green Version]
  34. Ye, J.; Zhang, R.; Nielsen, S.; Joseph, S.D.; Huang, D.; Thomas, T. A Combination of Biochar-Mineral Complexes and Compost Improves Soil Bacterial Processes, Soil Quality, and Plant Properties. Front. Microbiol. 2016, 7, 372. [Google Scholar] [CrossRef]
  35. Araujo, J.; Díaz-Alcántara, C.A.; Urbano, B.; González-Andrés, F. Inoculation with Native Bradyrhizobium Strains Formulated with Biochar as Carrier Improves the Performance of Pigeonpea (Cajanus cajan L.). Eur. J. Agron. 2020, 113, 125985. [Google Scholar] [CrossRef]
  36. Pastor-Bueis, R.; Sánchez-Cañizares, C.; James, E.K.; González-Andrés, F. Formulation of a Highly Effective Inoculant for Common Bean Based on an Autochthonous Elite Strain of Rhizobium leguminosarum bv. phaseoli, and Genomic-Based Insights Into Its Agronomic Performance. Front. Microbiol. 2019, 10, 1–16. [Google Scholar] [CrossRef] [Green Version]
  37. Faostat. Available online: http://www.fao.org/faostat/en/#home (accessed on 28 February 2022).
  38. Barquero, M. Caracterización y Selección de Bacterias y Hongos Micorrícicos Aislados En Raíces de Alubia y Pimiento En La Provincia de León, Para El Desarrollo de Biofertilizantes; Universidad de Salamanca: Salamanca, Spain, 2014. [Google Scholar]
  39. Rosas, J.G.; Gómez, N.; Cara, J.; Ubalde, J.; Sort, X.; Sánchez, M.E. Assessment of Sustainable Biochar Production for Carbon Abatement from Vineyard Residues. J. Anal. Appl. Pyrolysis 2015, 113, 239–247. [Google Scholar] [CrossRef]
  40. Urbano-Terrón, P. Tratado De Fitotecnia General, 2nd ed.; Mundiprensa: Madrid, Spain, 2008. [Google Scholar]
  41. Feller, C.; Bleiholder, H.; Buhr, L.; Hack, H.; He, M.; Klose, R.; Meier, U.; Stau, R.; van den Boom, T.; Weber, E. Phenological Growth Stages of Vegetable Crops II. Fruit Vegetables and Pulses. Nachrichtenbl. Dtsch. Pflanzenschutzdienst. 1995, 47, 217–232. [Google Scholar]
  42. Clarke, K.R.; Gorley, R.N. Getting Started with PRIMER V7, 1st ed.; Primer-E: Plymouth, UK, 2015. [Google Scholar]
  43. Joo, G.J.; Kim, Y.M.; Lee, I.J.; Song, K.S.; Rhee, I.K. Growth Promotion of Red Pepper Plug Seedlings and the Production of Gibberellins by Bacillus cereus, Bacillus macroides and Bacillus pumilus. Biotechnol. Lett. 2004, 26, 487–491. [Google Scholar] [CrossRef] [PubMed]
  44. Yuan, J.; Ruan, Y.; Wang, B.; Zhang, J.; Waseem, R.; Huang, Q.; Shen, Q. Plant Growth-Promoting Rhizobacteria Strain Bacillus amyloliquefaciens Njn-6-Enriched Bio-Organic Fertilizer Suppressed Fusarium Wilt and Promoted the Growth of Banana Plants. J. Agric. Food Chem. 2013, 61, 3774–3780. [Google Scholar] [CrossRef] [PubMed]
  45. Kim, M.J.; Radhakrishnan, R.; Kang, S.M.; You, Y.H.; Jeong, E.J.; Kim, J.G.; Lee, I.J. Plant Growth Promontory Effect of Bacillus amyloliquefaciens H-2-5 on Crop Plants and Influence on Physiological Changes in Soybean under Soil Salinity. Physiol. Mol. Biol. Plants 2017, 23, 571–580. [Google Scholar] [CrossRef] [PubMed]
  46. Vicente-Hernández, A.; Salgado-Garciglia, R.; Valencia-Cantero, E.; Ramírez-Ordorica, A.; Hernández-García, A.; García-Juárez, P.; Macías-Rodríguez, L. Bacillus methylotrophicus M4-96 Stimulates the Growth of Strawberry (Fragaria × Ananassa ‘Aromas’) Plants In Vitro and Slows Botrytis cinerea Infection by Two Different Methods of Interaction. J. Plant Growth Regul. 2019, 38, 765–777. [Google Scholar] [CrossRef]
  47. Wang, X.; Xie, H.; Ku, Y.; Yang, X.; Chen, Y.; Yang, N.; Mei, X.; Cao, C. Chemotaxis of Bacillus cereus YL6 and Its Colonization of Chinese Cabbage Seedlings. Plant Soil 2020, 447, 413–430. [Google Scholar] [CrossRef]
  48. Ambawade, M.; Pathade, G. Production of Gibberellic Acid by Bacillus siamensis BE 76 Isolated from Banana Plant (Musa spp.). Int. J. Sci. Res. 2015, 4, 394–398. [Google Scholar]
  49. Idris, E.S.E.; Iglesias, D.J.; Talon, M.; Borriss, R. Tryptophan-Dependent Production of Indole-3-Acetic Acid (IAA) Affects Level of Plant Growth Promotion by Bacillus amyloliquefaciens FZB42. Mol. Plant Microbe Interact. 2007, 20, 619–626. [Google Scholar] [CrossRef] [Green Version]
  50. Liu, Y.; Chen, L.; Zhang, N.; Li, Z.; Zhang, G.; Xu, Y.; Shen, Q.; Zhang, R. Plant-Microbe Communication Enhances Auxin Biosynthesis by a Root-Associated Bacterium, Bacillus amyloliquefaciens SQR9. Mol. Plant Microbe Interact. 2016, 29, 324–330. [Google Scholar] [CrossRef]
  51. Ji, C.; Tian, H.; Wang, X.; Hao, L.; Wang, C.; Zhou, Y.; Xu, R.; Song, X.; Liu, Y.; Du, J.; et al. Bacillus subtilis HG-15, a Halotolerant Rhizoplane Bacterium, Promotes Growth and Salinity Tolerance in Wheat (Triticum aestivum). BioMed Res. Int. 2020, 2022, 1–16. [Google Scholar] [CrossRef] [Green Version]
  52. Lim, J.H. Synergistic Plant Growth Promotion by the Indigenous Auxins-Producing PGPR Bacillus subtilis AH18 and Bacillus licheniforims K11. J. Korean Soc. Appl. Biol. Chem. 2009, 52, 531–538. [Google Scholar] [CrossRef]
  53. Kudoyarova, G.R.; Melentiev, A.I.; Martynenko, E.V.; Timergalina, L.N.; Arkhipova, T.N.; Shendel, G.V.; Kuz’mina, L.Y.; Dodd, I.C.; Veselov, S.Y. Cytokinin Producing Bacteria Stimulate Amino Acid Deposition by Wheat Roots. Plant Physiol. Biochem. 2014, 83, 285–291. [Google Scholar] [CrossRef]
  54. Qian, L.; Chen, L.; Joseph, S.; Pan, G.; Li, L.; Zheng, J.; Zhang, X.; Zheng, J.; Yu, X.; Wang, J. Biochar Compound Fertilizer as an Option to Reach High Productivity but Low Carbon Intensity in Rice Agriculture of China. Carbon Manage. 2014, 5, 145–154. [Google Scholar] [CrossRef]
  55. Joseph, S.; Graber, E.R.; Chia, C.; Munroe, P.; Donne, S.; Thomas, T.; Nielsen, S.; Marjo, C.; Rutlidge, H.; Pan, G.X.; et al. Shifting Paradigms: Development of High-Efficiency Biochar Fertilizers Based on Nano-Structures and Soluble Components. Carbon Manage. 2013, 4, 323–343. [Google Scholar] [CrossRef] [Green Version]
  56. Yao, C.; Joseph, S.; Li, L.; Pan, G.; Lin, Y.; Munroe, P.; Pace, B.; Taherymoosavi, S.; Van zwieten, L.; Thomas, T.; et al. Developing More Effective Enhanced Biochar Fertilisers for Improvement of Pepper Yield and Quality. Pedosphere 2015, 25, 703–712. [Google Scholar] [CrossRef]
  57. Frimpong, K.A.; Abban-Baidoo, E.; Marschner, B. Can Combined Compost and Biochar Application Improve the Quality of a Highly Weathered Coastal Savanna Soil? Heliyon 2021, 7, e07089. [Google Scholar] [CrossRef]
  58. Mukhopadhyay, S.; Masto, R.E.; Singh, A.K.; Singh, P.K. Impact of the Combined Application of Biochar and Compost on Mine Soil Quality and Growth of Lady’s Finger (Abelmoschus esculentus). Bull. Environ. Contam. Toxicol. 2020, 108, 396–402. [Google Scholar] [CrossRef]
  59. Ijaz, M.; Tahir, M.; Shahid, M.; Ul-Allah, S.; Sattar, A.; Sher, A.; Mahmood, K.; Hussain, M. Combined Application of Biochar and PGPR Consortia for Sustainable Production of Wheat under Semiarid Conditions with a Reduced Dose of Synthetic Fertilizer. Braz. J. Microbiol. 2019, 50, 449–458. [Google Scholar] [CrossRef]
  60. Nadeem, S.M.; Imran, M.; Naveed, M.; Khan, M.Y.; Ahmad, M.; Zahir, Z.A.; Crowley, D.E. Synergistic Use of Biochar, Compost and Plant Growth-Promoting Rhizobacteria for Enhancing Cucumber Growth under Water Deficit Conditions. J. Sci. Food Agric. 2017, 97, 5139–5145. [Google Scholar] [CrossRef]
  61. Rasool, M.; Akhter, A.; Soja, G.; Haider, M.S. Role of Biochar, Compost and Plant Growth Promoting Rhizobacteria in the Management of Tomato Early Blight Disease. Sci. Rep. 2021, 11, 6092. [Google Scholar] [CrossRef]
  62. Zafar-Ul-Hye, M.; Tahzeeb-ul-Hassan, M.; Abid, M.; Fahad, S.; Brtnicky, M.; Dokulilova, T.; Datta, R.; Danish, S. Potential Role of Compost Mixed Biochar with Rhizobacteria in Mitigating Lead Toxicity in Spinach. Sci. Rep. 2020, 10, 12159. [Google Scholar] [CrossRef] [PubMed]
  63. Zafar-Ul-Hye, M.; Tahzeeb-Ul-Hassan, M.; Wahid, A.; Danish, S.; Khan, M.J.; Fahad, S.; Brtnicky, M.; Hussain, G.S.; Leonardo Battaglia, M.; Datta, R. Compost Mixed Fruits and Vegetable Waste Biochar with ACC Deaminase Rhizobacteria Can Minimize Lead Stress in Mint Plants. Sci. Rep. 2021, 11, 6606. [Google Scholar] [CrossRef] [PubMed]
  64. Samreen, T.; Zahir, Z.A.; Naveed, M.; Asghar, M. Boron Tolerant Phosphorus Solubilizing Bacillus spp. MN-54 Improved Canola Growth in Alkaline Calcareous Soils. Int. J. Agric. Biol. 2019, 21, 538–546. [Google Scholar] [CrossRef]
  65. Tekaya, M.; El-Gharbi, S.; Mechri, B.; Chehab, H.; Bchir, A.; Chraief, I.; Ayachi, M.; Boujnah, D.; Attia, F.; Hammami, M. Improving Performance of Olive Trees by the Enhancement of Key Physiological Parameters of Olive Leaves in Response to Foliar Fertilization. Acta Physiol. Plant. 2016, 38, 101. [Google Scholar] [CrossRef]
  66. Akram, M.S.; Ashraf, M. Alleviation of Adverse Effects of Salt Stress on Sunflower (Helianthus annuus L.) by Exogenous Application of Potassium Nitrate. J. Appl. Bot. Food Qual. 2009, 83, 19–27. [Google Scholar]
  67. Hasnain, M.; Chen, J.; Ahmed, N.; Memon, S.; Wang, L.; Wang, Y.; Wang, P. The Effects of Fertilizer Type and Application Time on Soil Properties, Plant Traits, Yield and Quality of Tomato. Sustainability 2020, 12, 9065. [Google Scholar] [CrossRef]
  68. Radhakrishnan, R.; Lee, I.J. Gibberellins Producing Bacillus methylotrophicus KE2 Supports Plant Growth and Enhances Nutritional Metabolites and Food Values of Lettuce. Plant Physiol. Biochem. 2016, 109, 181–189. [Google Scholar] [CrossRef]
  69. Kaymak, H.C. Potential of PGPR in Improvement of Environmental-Friendly Vegetable Production. In Field Crops: Sustainable Management by PGPR; Maheshwari, D., Dheeman, S., Eds.; Springer: Cham, Switzerland, 2019; Volume 23, pp. 221–251. [Google Scholar]
  70. Glick, B.R.; Gamalero, E. Recent Developments in the Study of Plant Microbiomes. Microorganisms 2021, 9, 1533. [Google Scholar] [CrossRef]
  71. Schmidt, J.E.; Kent, A.D.; Brisson, V.L.; Gaudin, A.C.M. Agricultural Management and Plant Selection Interactively Affect Rhizosphere Microbial Community Structure and Nitrogen Cycling. Microbiome 2019, 7, 146. [Google Scholar] [CrossRef] [Green Version]
  72. Jacobs-Hoffman, I.; Hills, P.N. Effects of the Commercial Biostimulant BC204 on the Rhizosphere Microbial Community of Solanum Lycopersicum L. South Afr. J. Bot. 2021, 143, 52–60. [Google Scholar] [CrossRef]
  73. Thierry, S.; Macarie, H.; Iizuka, T.; Geißdörfer, W.; Assih, E.A.; Spanevello, M.; Verhe, F.; Thomas, P.; Fudou, R.; Monroy, O.; et al. Pseudoxanthomonas mexicana Sp. Nov. and Pseudoxanthomonas japonensis Sp. Nov., Isolated from Diverse Environments, and Emended Descriptions of the Genus Pseudoxanthomonas Finkmann et al. 2000 and of Its Type Species. Int. J. Syst. Evol. Microbiol. 2004, 54, 2245–2255. [Google Scholar] [CrossRef] [PubMed] [Green Version]
  74. Nayaka, S.; Chakraborty, B.; Swamy, P.S.; Bhat, M.P.; Airodagi, D.; Basavarajappa, D.S.; Rudrappa, M.; Hiremath, H.; Nagaraja, S.K.; Madhappa, C. Isolation, Characterization, and Functional Groups Analysis of Pseudoxanthomonas Indica RSA-23 from Rhizosphere Soil. J. Appl. Pharm. Sci. 2019, 9, 101–106. [Google Scholar] [CrossRef] [Green Version]
  75. Ofek, M.; Hadar, Y.; Minz, D. Ecology of Root Colonizing Massilia (Oxalobacteraceae). PLoS ONE 2012, 7, e40117. [Google Scholar] [CrossRef]
  76. Hayat, R.; Ali, S.; Amara, U.; Khalid, R.; Ahmed, I. Soil Beneficial Bacteria and Their Role in Plant Growth Promotion: A Review. Ann. Microbiol. 2010, 60, 579–598. [Google Scholar] [CrossRef]
  77. Vargas, L.K.; Volpiano, C.G.; Lisboa, B.B.; Giongo, A.; Beneduzi, A.; Passaglia, L.M.P. Potential of Rhizobia as Plant Growth-Promoting Rhizobacteria. In Microbes for Legume Improvement, 2nd ed.; Khan, M.S., Musarrat, J., Zaidi, A., Eds.; Springer: Vienna, Austria, 2017; pp. 153–174. [Google Scholar] [CrossRef]
  78. Zhao, Q.; Yue, S.; Bilal, M.; Hu, H.; Wang, W.; Zhang, X. Comparative Genomic Analysis of 26 Sphingomonas and Sphingobium Strains: Dissemination of Bioremediation Capabilities, Biodegradation Potential and Horizontal Gene Transfer. Sci. Total Environ. 2017, 609, 1238–1247. [Google Scholar] [CrossRef]
  79. Sharma, M.; Khurana, H.; Singh, D.N.; Negi, R.K. The Genus Sphingopyxis: Systematics, Ecology, and Bioremediation Potential—A Review. J. Environ. Manage. 2021, 280, 111744. [Google Scholar] [CrossRef]
  80. Wu, L.; Bi, E. Sorption of Ionic and Neutral Species of Pharmaceuticals to Loessial Soil Amended with Biochars. Environ. Sci. Pollut. Res. 2019, 26, 35871–35881. [Google Scholar] [CrossRef]
  81. Rodríguez-Caballero, G.; Caravaca, F.; Alguacil, M.M.; Fernández-López, M.; Fernández-González, A.J.; Roldán, A. Striking Alterations in the Soil Bacterial Community Structure and Functioning of the Biological N Cycle Induced by Pennisetum setaceum Invasion in a Semiarid Environment. Soil Biol. Biochem. 2017, 109, 176–187. [Google Scholar] [CrossRef]
  82. Dias, A.C.F.; Costa, F.E.C.; Andreote, F.D.; Lacava, P.T.; Teixeira, M.A.; Assumpção, L.C.; Araújo, W.L.; Azevedo, J.L.; Melo, I.S. Isolation of Micropropagated Strawberry Endophytic Bacteria and Assessment of Their Potential for Plant Growth Promotion. World J. Microbiol. Biotechnol. 2009, 25, 189–195. [Google Scholar] [CrossRef]
  83. Ma, L.J.; Geiser, D.M.; Proctor, R.H.; Rooney, A.P.; O’donnell, K.; Trail, F.; Gardiner, D.M.; Manners, J.M.; Kazan, K. Fusarium Pathogenomics. Annu. Rev. Microbiol. 2013, 67, 399–416. [Google Scholar] [CrossRef] [PubMed] [Green Version]
  84. Sajeena, A.; Nair, D.S.; Sreepavan, K. Non-Pathogenic Fusarium oxysporum as a Biocontrol Agent. Indian Phytopathol. 2020, 73, 177–183. [Google Scholar] [CrossRef]
  85. Carlucci, A.; Raimondo, M.L.; Santos, J.; Phillips, A.J.L. Plectospharaella Species Associated with Root and Collar Rots of Horticultural Crops in Southern Italy. Persoonia 2012, 28, 34–48. [Google Scholar] [CrossRef] [PubMed] [Green Version]
  86. Deb, D.; Khan, A.; Dey, N. Phoma Diseases: Epidemiology and Control. Plant Pathol. 2020, 69, 1203–1217. [Google Scholar] [CrossRef]
Figure 1. Responses of several agronomic variables to the treatments applied in the field trial for the melon crop: yield (A), its components (BD), fresh aerial vegetative biomass (E) and dry aerial vegetative biomass (F). The values are expressed as relative values in percentage, using, as a reference (100%), the control 80. Comparison against control 80 was performed with the Dunnett test (* means significant difference at p ≤ 0.05 with the control 80, ns means not significant difference at p ≤ 0.05 with the control 80).
Agronomy 12 02620 g001
Figure 2. Responses of several agronomic variables to the treatments applied in the field trial for the pepper crop: yield (A), its components (BD), fresh aerial vegetative biomass (E) and dry aerial vegetative biomass (F). The values are expressed as relative values in percentage, using, as a reference (100%), control 80. Comparison against control 80 was performed with the Dunnett test (* means significant difference at p ≤ 0.05 with the control 80, ns means not significant difference at p ≤ 0.05 with the control 80).
Agronomy 12 02620 g002
Figure 3. Responses of other variables to the treatments applied in the field trial for the melon crop. The chlorophyll (A), the flowering (B), the penetrometry (C), the fruit contour (D), the conductivity (E), the solute concentration (F).The values are expressed as relative values in percentage, using, as a reference (100%), control 80. Comparison against control 80 was performed with the Dunnett test (* p ≤ 0.05, ns not significant).
Agronomy 12 02620 g003
Figure 4. Responses of other variables to the treatments applied in the field trial for the pepper crop. The chlorophyll (A), the fruit contour (B), the conductivity (C), the solute concentration (D).The values are expressed as relative values in percentage, using, as a reference (100%), control 80. Comparison against control 80 was performed with the Dunnett test (* means significant difference at p ≤ 0.05 with the control 80, ns means not significant difference at p ≤ 0.05 with the control 80).
Agronomy 12 02620 g004
Figure 5. Boxplots showing the distribution of diversity indices for the bacterial community in each treatment in (A) rhizospheric and (B) bulk soil. S: N° of ASV/number of amplicon sequence variant; number of reads for the bacterial community; H’: Shannon index. The lower and upper bounds of the boxplots show the first and third quartiles (the 25th and 75th percentiles), the middle line shows the median, and the whiskers above and below the boxplot indicate inter-quartile ranges. Different letters indicate significant differences for p-value below 0.05 according to Tukey’s HSD test.
Agronomy 12 02620 g005
Figure 6. Boxplots showing the distribution of diversity indices for the fungal community in each treatment in (A) rhizospheric and (B) bulk soil. S, number of ASVs/number of amplicon sequence variants; number of reads for the bacterial community; H’, Shannon index. The lower and upper bounds of the boxplots show the first and third quartiles (the 25th and 75th percentiles), the middle line shows the median, and the whiskers above and below the boxplot indicate inter-quartile ranges. Different letters indicate significant differences for p-values below 0.05 according to Tukey’s HSD test.
Agronomy 12 02620 g006
Figure 7. Heat plot showing the relative abundance of the 50 most frequent taxa in the bacterial community. In the column legend, the same color and shape indicate replicates of the same treatment and the same type of soil (Rh, rhizospheric; Bu, Bulk).
Agronomy 12 02620 g007
Figure 8. Heat plot showing the relative abundance of the 50 most frequent taxa in the fungal community. In the column legend, the same color and shape indicate replicates of the same treatment and the same type of soil (Rh, rhizospheric; Bu, Bulk).
Agronomy 12 02620 g008
Figure 9. Non-metric multidimensional scaling (nMDS) plots of bacterial (A) and fungal (B) communities according to treatment applied. Each point represents the microbiome of one replicate of soil according to soil type. All rhombus shapes for bulk soil are placed on the left for the bacterial community (A) and on the right for the fungal community (B) in the figure. MDS axis 1 and MDS axis 2 represent the two axes of the two-dimensional ordination space. The stress level shown indicates how well the individual distances are represented (the closer to 0, the better are the original data points represented in the ordination space). All ordinations were performed using ASV-level data (p = 0.001 based on 999permutations).
Agronomy 12 02620 g009
Table 1. Controls and treatments carried out in the field trial for melon and pepper crops.
TreatmentMineral N FertilizerOrganic Fertilizer
Dose
(kg N ha−1)
TypeDose
(t ha−1)
TypeAdditive
Percentage of Additive
in the Compost (w:w) (%)
Description
Control 00 0
Control 80176 (80% of full dose)NH4NO3 (27% N) 0
Control 100220 (full dose)NH4NO3 (27% N) 0
Compost 2176NH4NO3 (27% N) 2Compost0-
Compost 5176NH4NO3 (27% N) 5Compost0-
Compost 2 + bb3176NH4NO3 (27% N) 2Compost + additive3biochar:bacterial suspension 1 × 10⁹ cfu ml−1 (1:1 w:vol.)
Compost 2 + bb6176NH4NO3 (27% N) 2Compost + additive6biochar:bacterial suspension 1 × 10⁹ cfu ml−1 (1:1 w:vol.)
Compost 5 + bb3176NH4NO3 (27% N) 5Compost + additive3biochar:bacterial suspension 1 × 10⁹ cfu ml−1 (1:1 w:vol.)
Compost 5 + bb6176NH4NO3 (27% N) 5Compost + additive6biochar:bacterial suspension 1 × 10⁹ cfu ml−1 (1:1 w:vol.)
Table 2. ANOVA for yield, yield components and biomass production in the melon crop. The location, the year and the plot were considered random factors, whilst the compost dose and the additive (PGPR + biochar) dose were fixed factors (significance level: *** p ≤ 0.001; ** 0.001 < p ≤ 0.01; ns, not significant).
DosesFresh Aerial Vegetative Biomass
(g Per Plant)
Dry Aerial Vegetative Biomass
(g Per Plant)
Yield (kg ha−1)Number Fruits
Per Plant
Fruit Weight
(g)
Number Fruits
Per ha
Mean SquareF
Statistic
Mean SquareF
Statistic
Mean SquareF
Statistic
Mean SquareF
Statistic
Mean SquareF
Statistic
Mean SquareF
Statistic
Compost dose (t/ha)1,445,37833.32 ***802,25033.43 ***48,158,3519.19 ***0.231.13 ns29480.59 ns7,615,9158.06 ***
Additive dose (%)1,170,23126.98 ***629,32326.22 ***323,276,62861.67 ***1.014.94 **151,81830.27 ***29,944,52831.69 ***
Compost dose × Additive dose283,3386.53 ***163,8316.83 ***53,606,89810.23 ***0.472.27 ns44620.89 ns12,941,87113.69 ***
Table 3. ANOVA for yield, yield components and biomass production in the pepper crop. The location, the year and the plot were considered random factors, whilst the compost dose and the additive (PGPR + biochar) dose were fixed factors (significance level: *** p ≤ 0.001; ** 0.001 < p ≤ 0.01; * 0.01 < p ≤ 0.05; ns, not significant).
DosesFresh Aerial Vegetative Biomass
(g Per Plant)
Dry Aerial Vegetative Biomass
(g Per Plant)
Yield (kg ha−1)Number Fruits
Per Plant
Fruit Weight
(g)
Number Fruits
Per ha
Mean SquareF
Statistic
Mean SquareF
Statistic
Mean SquareF
Statistic
Mean SquareF
Statistic
Mean SquareF
Statistic
Mean
Square
F
Statistic
Compost dose (t/ha)49382.42 ns--51,096,3513.57 *405.71 **1522.02 ns24,859,770,9315.71 **
Additive dose (%)12,4286.10 **12845.43 **171,270,30211.95 ***40.59 ns2423.23 *2,582,073,1790.59 ns
Compost dose × Additive dose18130.89 ns--1,602,2400.11 ns456.47 ***4365.81 **28,180,202,3186.47 ***
Table 4. ANOVA for chlorophyll content, flowering and several fruit parameters, in the melon crop. The location, the year and the plot were considered random factors, whilst the compost dose and the additive (PGPR + biochar) were fixed factors (significance level: *** p ≤ 0.001; ns, not significant).
DosesChlorophyll
(CCI)
Flowering
(%)
Penetrometry
(kg)
Fruit Contour
(cm)
Conductivity
(µS cm−1)
Solute Concentration
(mg l−1)
Mean SquareF
Statistic
Mean SquareF
Statistic
Mean SquareF
Statistic
Mean SquareF
Statistic
Mean SquareF
Statistic
Mean SquareF
Statistic
Compost dose (t/ha)460.0309.640 ***3724.64337.421***0.0592.566 ns222.61031.083 ***0.59115.926 ***81045.25215.240 ***
Additive dose (%)71.7411.503 ns147.0241.477 ns0.24710.80 ***1.4270.199 ns0.56415.186 ***222846.50041.905 ***
Compost dose × Additive dose8.1900.172 ns22.0240.22 ns0.2189.507 ***10.4961.465 ns0.0090.231 ns8879.7861.670 ns
Table 5. ANOVA for chlorophyll content and several fruit parameters, in the pepper crop. The location, the year and the plot were considered random factors, whilst the compost dose and the additive (PGPR + biochar) were fixed factors (significance levels: *** p ≤ 0.001; ** 0.001 < p ≤ 0.01; * 0.01 < p ≤ 0.05; ns, not significant).
DosesChlorophyll
(CCI)
Fruit Contour
(mm)
Conductivity
(µS cm−1)
Solute Concentration
(mg l−1)
Mean SquareF
Statistic
Mean SquareF
Statistic
Mean SquareF
Statistic
Mean
Square
F
Statistic
Compost dose (t/ha) 383.867 6.790 ** 66.404 0.051 ns 0.532 7.733 ** 7926.82815.240 ***
Additive dose (%) 18.672 0.330 ns 0.141 0.000 ns 0.3575.194 *180,354.05641.905 ***
Compost dose × Additive dose 53.852 0.953 ns 6.699 0.005 ns 0.0821.187 ns18,287.0561.670 ns
Table 6. Results of PERMANOVA significance test across treatments within each type of soil in bacterial and fungal communities. Treatment and soil were used as fixed factors (number of permutations: 999). The test of significance was based on Bray–Curtis similarity values. The significance level was fixed for p-value equal to 0.001 (significance p-values are in bold).
BacteriaFungi
Rhizospheric SoilBulk SoilRhizospheric SoilBulk Soil
Pseudo-F/tp-ValuePseudo-F/tp-ValuePseudo-F/tp-ValuePseudo-F/tp-Value
Control 0 vs. Control 806.73290.0012.84310.0055.76290.0012.22730.027
Control 0 vs. Compost 510.4060.0014.61530.0024.45060.0033.14150.009
Control 0 vs. Compost 5+bb65.05380.0043.71170.0048.50040.0012.39730.025
Control 80 vs. Compost 58.11570.0024.78080.0022.19770.0317.36870.001
Control 80 vs. Compost 5+bb69.33500.0013.71240.0025.34300.0034.76380.003
Compost 5 vs. Compost 5+bb615.0990.0014.04050.0055.73260.0014.99250.002
Publisher’s Note: MDPI stays neutral with regard to jurisdictional claims in published maps and institutional affiliations.

