1. Introduction
Agriculture, forestry, and other land uses (AFOLU) are providing humans with food, feed, and timber, among other Ecosystem Services. The greenhouse gas (GHG) emissions from this sector at the global scale are equal to 21% of the total emissions (12 × 10
12 kg CO
2-eq) [
1]. The AFOLU sector emissions have increased at a 3% annual rate since 2010 [
1], mainly due to land-use changes and soil management that favor organic material decomposition (e.g., tillage). Carbon (C) storage in soils has been identified as a key process for emissions mitigation [
2,
3,
4,
5]. It can be achieved with carbon farming which deals with the management of carbon pools, flows, and GHG fluxes at the farm level [
4]. However, there are important knowledge gaps related to the nature and decomposition rates of organic materials to be used [
6], as well as technical and socio-economic aspects stemming from changes in farming practices [
7]. The well-known global initiative “four-per-1000” targets a 0.4% increase in soil organic carbon annually [
5,
8]. Nevertheless, increasing organic material in the soil might lead to alterations in the nutrient balance in agricultural soils and disruptions in plant nutrition (e.g., C/N balance and N and P availability) [
9]. Equally important, practices promoting C storage (
Table S1) might be incompatible with farmers’ goals and ambitions [
5]. Global initiatives, such as the “four-per-1000”, require approx. 570 million (10
6) farms to participate, with 94% of these smaller than 5 ha [
10].
In the EU, the European Green Deal, the Farm to Fork Strategy, and the Circular Economy Package make clear that the AFOLU sector needs more and better incentives for managing carbon to drive the necessary transformational change towards climate neutrality by 2050 [
5]. Carbon farming was included in the new CAP (Common Agriculture Policy) to increase C sequestration in agriculture and is expected to be implemented as agri-environmental measures or eco-schemes in the Member States’ Strategic Plans. Common and clear rules for monitoring, reporting, and verification of the results from carbon farming activities will be crucial, rendering the use of Life Cycle Analysis (LCA) methods imperative [
11].
Viticulture has global importance in terms of land use, with 7.45 million ha of vineyards globally [
12]. In the EU, Member States hold a 63% share of the global wine production [
13], followed by the USA, Argentina, and Australia. The area of vineyards in the EU is approx. 3 million ha, and the wine trade balance was about 12 billion euros in 2018 [
13]. Due to its global presence, viticulture could significantly contribute to the global efforts to offset atmospheric greenhouse gas concentrations via C sequestration [
12]. An average C sequestration rate (under different management practices, e.g., biochar additions, cover cropping, and no-tillage) reported in the literature is 7530 kg CO
2-eq ha
−1 yr
−1 to a soil depth of 30 cm [
12]. Most of the research, however, is conducted in the top-producing countries (e.g., Spain, Italy, and France), where high input viticulture is typically applied, and irrigation is also practiced, which favors biomass production.
Research on C sequestration in non-irrigated viticulture located in semi-arid climates is lacking. Another aspect of viticulture in arid areas is its generally low input nature [
14,
15], as well as its placement in a matrix of natural and semi-natural areas, with vineyard margins rich in wild vegetation [
16]. Yet, the potential of vineyard margin vegetation to store C has never been considered.
An important source of CHG emissions from wine production is winery waste, which, although rich in nutrients and C [
17], its improper management leads to increased GHG emissions, pollution (e.g., heavy metals) as well as nutrient loss (e.g., nitrogen to the environment) [
18]. The efficient management of winery waste is of paramount importance for the achievement of the transforming targets set in the EU Green Deal and associated strategies. Winery waste (grape pomace; skins, pulp, seeds, and stems) can be mixed with other types of organic material, such as goat and sheep manure, to develop a biofertilizer for addition to the vineyard soil.
Taking advantage of the potential of vineyards for carbon farming depends on the availability of easy-to-use methods to account for C fluxes. Global initiatives with a strong scientific basis, such as the Cool Farm Alliance [
19] and the Cool Farm Tool (CFT), could be employed for the shift towards C farming. The CFT is a scientifically based GHG, water and biodiversity calculator for farmers [
20]. It is considered one of the top farm-focused GHGs calculators [
21]. In addition to calculating carbon balance in agricultural plots, a GHG calculator can help farmers and other users understand the impact of different management practices on GHG emissions.
In Cyprus, as in most Mediterranean countries, viticulture and winemaking are important to the agricultural economy and rural development [
16,
18]. Most vineyards on the island are located in high nature value farmland (HNVf) areas, i.e., agricultural areas important for the conservation of species and habitats of EU importance [
16]. Climate change and vineyard abandonment are considered long-term threats to viticulture on the island [
22,
23]. Soil degradation and desertification are threatening soil resources. Because most of the soils are Leptosols (shallow soils), maintaining C stocks supports sustainable soil management. Overall, soil and farm management towards C storage is important for the sustainability of agriculture on the island.
Currently, even if organic material is occasionally applied in the vineyards (animal manure in most cases), the farmers are not familiar with C farming, and they lack the know-how to implement such schemes. Changes in management practices can, however, affect plant physiology, growth, and production, as well as qualitative characteristics, such as polyphenol and antioxidant content [
22].
The current study investigated the potential for C storage and GHG emissions reduction in non-irrigated viticulture, using the island of Cyprus and the indigenous variety Xynisteri as models. The objectives were (1) to determine the annual C balance in the vine and the vineyard scale under different management practices, (2) to study the effects of C farming practices on grape quality, (3) to test a tool for GHG emissions calculations in vineyards, based on the CFT, (4) explore and propose scenarios for mitigating GHG emissions in the vineyard and for storing C to the soil.
2. Materials and Methods
2.1. Study Area, Treatments, and Experimental Design
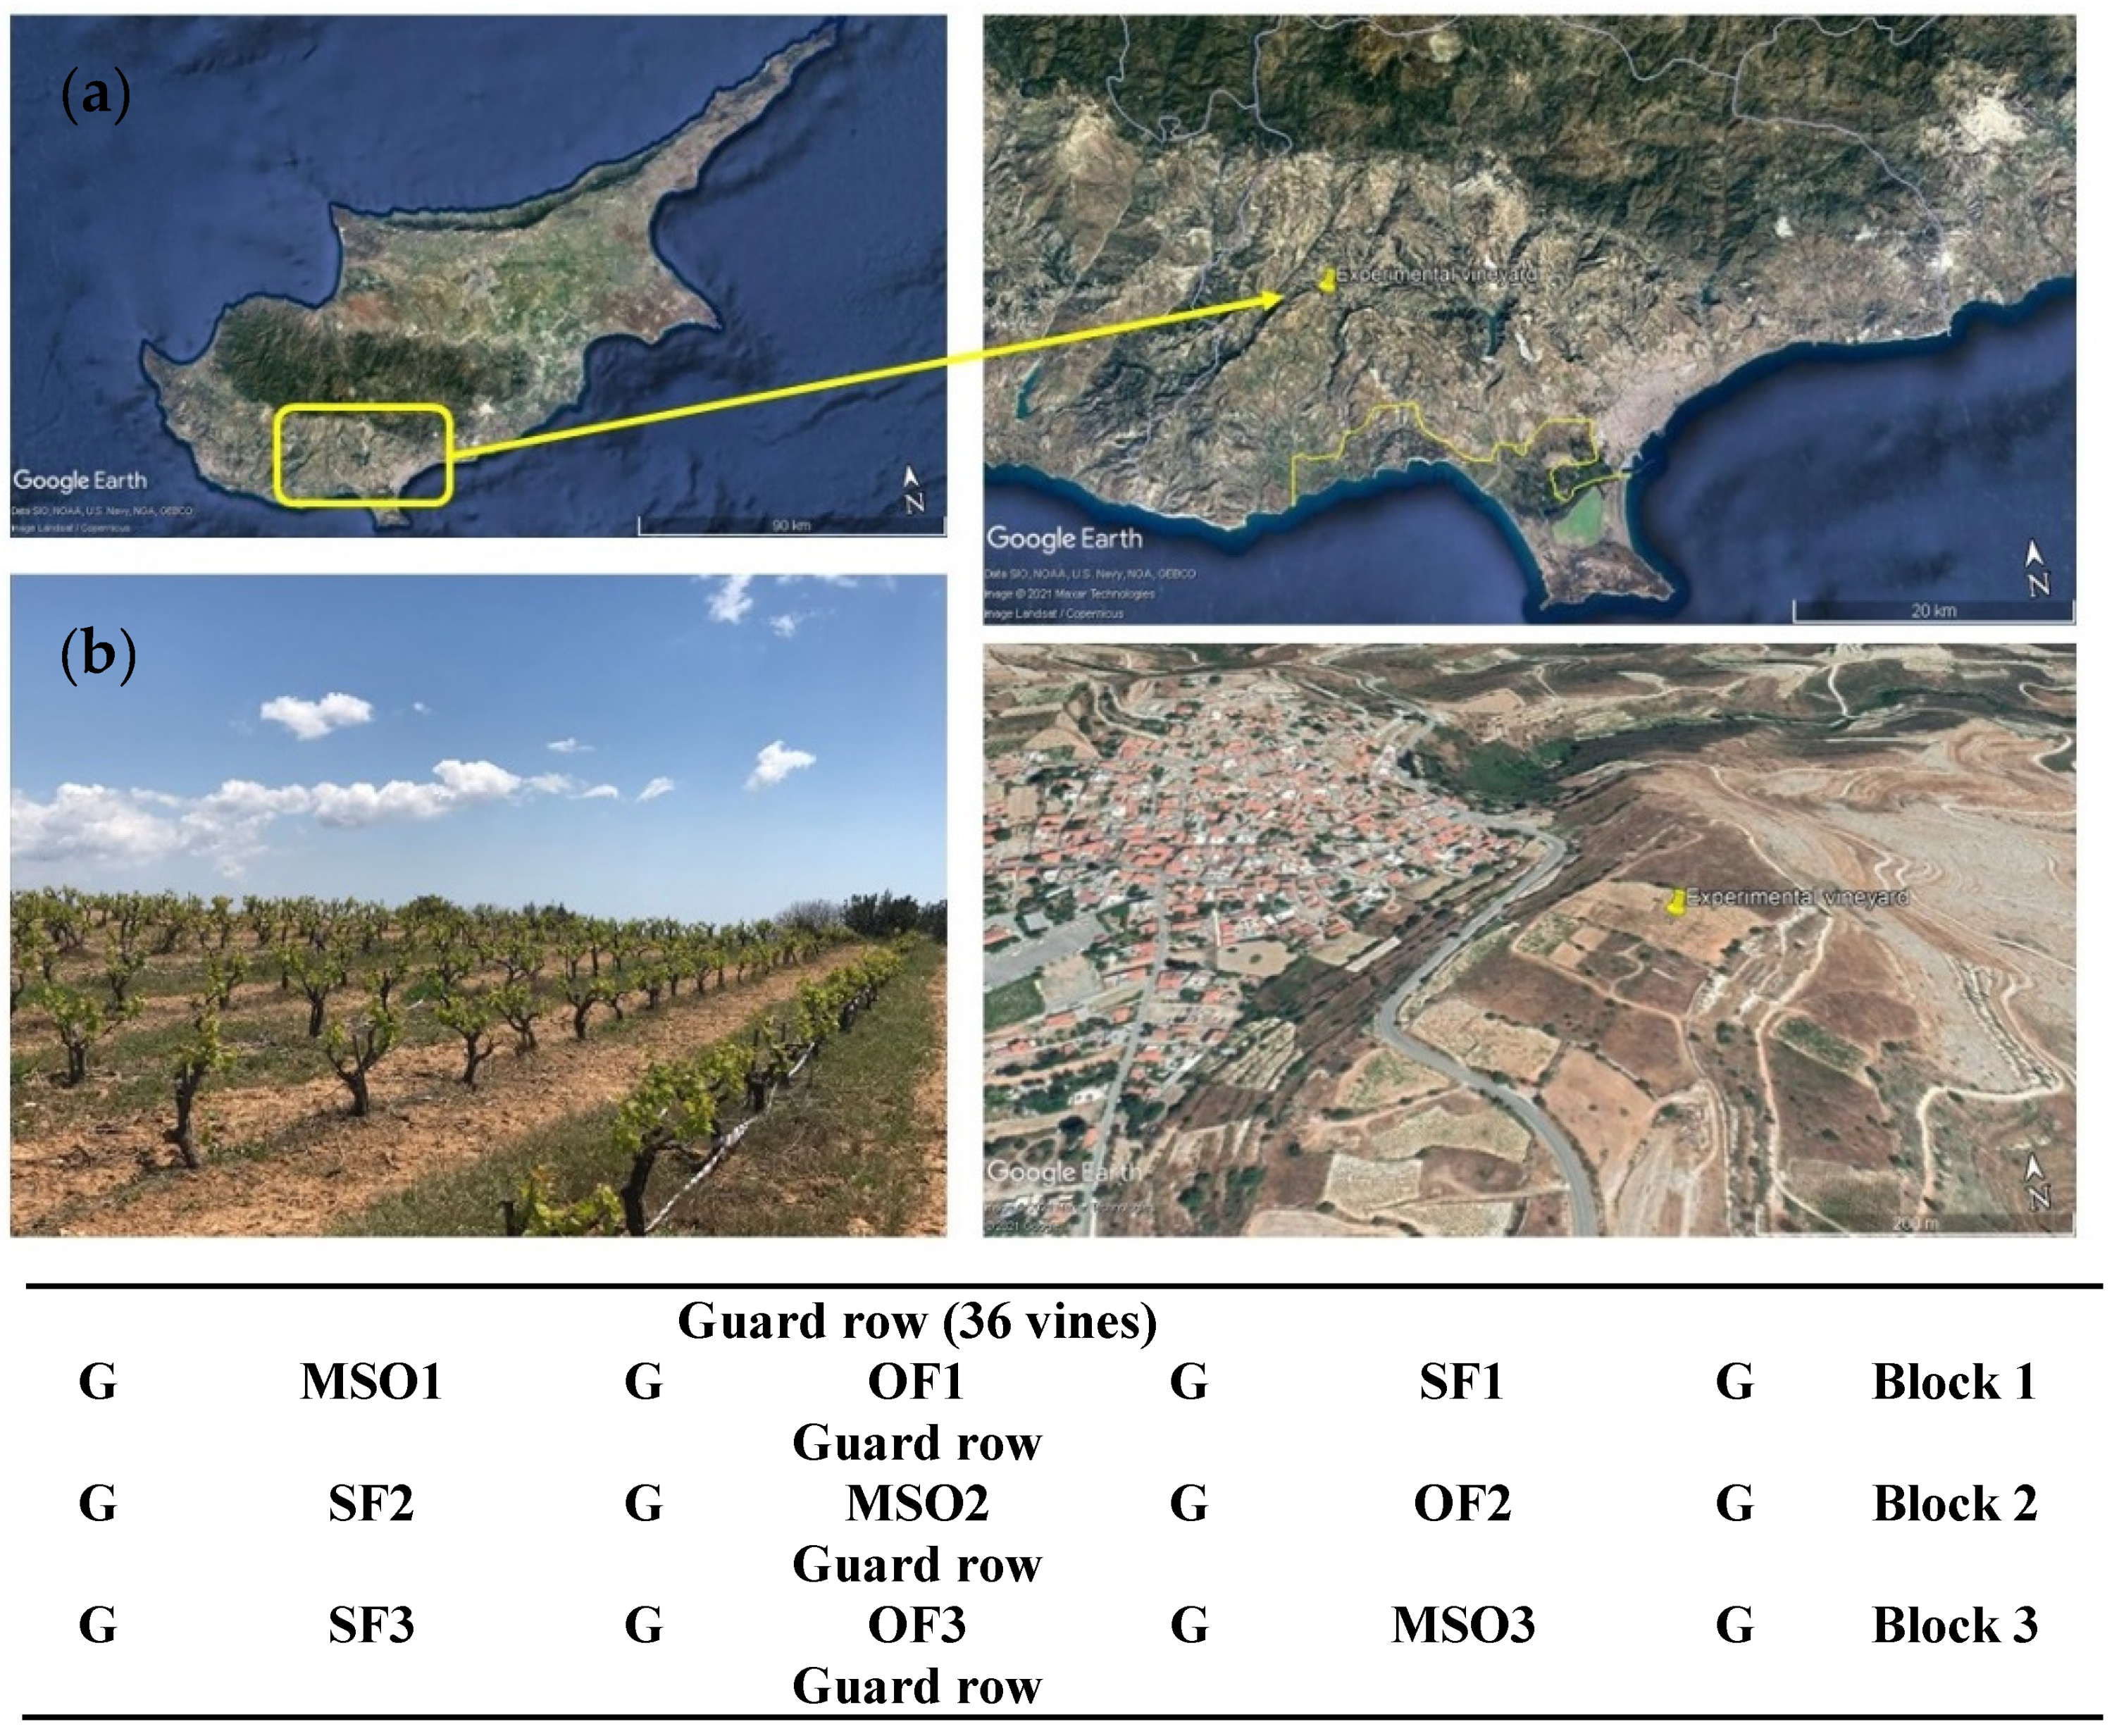
The experimental vineyard was located in Pachna, Limassol, Cyprus (34°46′36″ N 32°47′54″ S;
Figure 1a). The size of the vineyard was 0.6 ha, and the planting density for the indigenous Xynisteri variety bush vines was 2 × 2 m (2500 vines ha
−1). Soils in the region are classified as Calcaric cambisols and Calcaric regosols [
24].
Three treatments were established during the season of October 2019–September 2020:
MSO (Mix use of Synthetic and Organic fertilizer): Reduced tillage (once per year at a depth of 40 cm) for organic fertilizer incorporation (80% goat manure and 20% winery waste) to replace 50% of the N applied by synthetic fertilizers.
OF (Organic Fertilizer): Reduced tillage (once per year; 40 cm depth) for organic fertilizer (80% goat manure and 20% winery waste) incorporation to replace 100% of the N applied by synthetic fertilizers.
SF (Synthetic Fertilizer): Tillage 3 times/year (40 cm depth) and application of synthetic fertilizer (Control).
More information on the inputs for the treatments is provided in
Section 2.2.1 and
Section 2.2.2 (see
Table 1). Treatment SF is close to what is typically applied in Xynisteri grapes in Cyprus. In treatments MSO and SF, the synthetic fertilizer was ammonium sulfate [(NH
4)
2SO
4] 21-0-0 at a rate of 60 (treat. A) and 120 (treat. C) kg N ha
−1 year
−1. In treatments MSO and OF, organic fertilizer was applied to supply 60 and 120 kg N ha
−1 year
−1, respectively. The organic fertilizer was a mixture of winery waste and animal manure, and its properties are provided in
Section 2.2.2.
Three blocks containing 36 vines each, on a straight row, were established, separated by a guard row (
Figure 1b). In each block, 3 plots of 8 vines each were assigned to each of the three treatments (MSO, OF, SF), resulting in three replicates per treatment (one per block). Three vine plants (G) were left as guards between subsequent replicates.
2.2. Soil, Fertilizer Properties, and C Balance Determination
2.2.1. Soil Properties
The soil properties were determined before the initiation of the experiment by sampling conducted in September 2019. Six composite soil samples were collected from the experimental vineyard at a soil depth of 40 cm to determine physicochemical parameters. The soil was transported to the lab within 40 min, air-dried, and hand-sieved to pass a 2 mm mesh. Equivalent calcium carbonate (CaCO
3) was determined using the calcimeter method. Electrical conductivity (EC) and pH were determined according to a 1:1 soil-to-solution ratio, employing a portable pH/EC-meter (HI 98130 HR, Hanna Instruments, Woonsocket, RI, USA). Total nitrogen (N) was determined utilizing Kjeldahl (BUCHI, Digest automat K-439, and Distillation Kjelflex K-360, Flawil, Switzerland). Soil type (percentage of sand, silt, and clay) was measured by the hydrometer method with the Bouyoucos scale, and organic matter content was determined after the Walkley–Black volumetric method. Phosphorus (P) was determined spectrophotometrically (Multiskan GO, Thermo Fisher Scientific, Vantaa, Finland). Calcium (Ca) and magnesium (Mg) by an atomic absorption spectrophotometer (PG Instruments AA500FG, Leicestershire, UK). In
Table S2 (Supplementary Materials), soil physicochemical data are provided.
2.2.2. Fertilizers Properties
The organic material used as fertilizer was a mixture of goat manure and winery waste (grape pomace, skins, pulp, seeds, and stems) at an 80/20 ratio. Total organic carbon (TOC) was determined in each of the two materials (4 composite samples each) using the TOC analyzer TOC-VCSH of Shimadzu coupled with Solid Sample Module—5000A. The DIN EN 13137:2001 Characterization of Total Organic Carbon (TOC) in Waste, Sludges, and Sediments protocol was used for this analysis [
25]. The other parameters determined in these two materials were: pH, EC (μS cm
−1), and N%, following the same protocols as those used for the soil samples (
Table S3; Supplementary Material). The synthetic fertilizer used was ammonium sulfate [(NH
4)
2SO
4] 21-0-0 purchased from a commercial supplier located in Pachna, Limassol.
2.2.3. Carbon Balance Determination
For determining the (annual) C balance at the vine level, the following approach was used:
The annual above-ground biomass was directly measured (September 2020) by the destructive sampling of 9 vines (3 per treatment). The dry weight (dw) of leaves, lateral shoots, primary shoots, and bunches was measured at their final stage of development. The samples were transported to the lab within 1 h after collection. Then, they were weighed and placed in the oven (60 °C) until a constant weight was obtained (typically 72–100 h). It was assumed that 50% of the dw is carbon [
26,
27].
Root biomass was quantified in June 2020 after taking soil core samples at a depth of 0–40 cm in selected areas where the soil was kept free of weeds (by hand) during the growing season. All fine (annual) roots were removed to produce a pooled sample from four vines per treatment. In total, nine root samples (three pooled samples × three replications) were collected. The samples were transported within 45 min to the lab, and they were used for root respiration measurements. Root respiration (CO
2 production) was determined in the collected root samples using the methodology presented in [
26,
28]. A dual gas analyzer (International Control Analyser Ltd., Kent, UK) was used. The root samples were placed in a plastic container (sealed) at room temperature for 1 h, and afterward, the container’s air was withdrawn for 40 s through a hole on the container, whilst recording the % CO
2. The respiration rate was computed according to the volume and weight of the root samples.
After the completion of root respiration measurements, the roots were weighed and placed in the oven (60 °C) until a constant weight was obtained. The C content was considered as 50% of the root dry weight biomass [
26,
27]. Total root biomass was calculated considering root renewal in a volume of 0.4 m
3 vine
−1 (depth 0.40 m; width canopy 1.0 m; length 1.0 m). Deeper roots were not considered in the calculations.
For determining the C balance at the vineyard level, the following approach was used:
The amount of C added with the organic fertilizer was estimated based on its N content to supply the vines according to the requirements of treatments MSO and OF. The N% content of the organic material (
Table S3) was 2.66% dry weight (dw). To add 0.048 kg N per vine (120 kg N ha
−1; 2500 vines ha
−1), 1.805 kg of organic material dw were required (= 48 × 100/2.66). Since the water content of the organic material was 30% before its application in the vineyard, 2.346 kg wet weight (ww) of organic fertilizer was applied per vine in the treatment OF and half of this (1.173 kg ww) in treatment MSO. The approach assumes that the N release rate from the organic fertilizer is similar to that of the synthetic.
According to the C content of the organic material, 0.852 (=1.805 × 0.4722) and 0.426 kg C (=1.805 × 0.4722/2) were added per vine in treatments OF and MSO, respectively. The C pool, according to the soil C content and soil bulk density and prior to C addition with the organic fertilizer, was estimated to be 19.59 kg C per vine, according to soil samples analysis (
Table 1).
Finally, for determining soil microbial respiration, three treatments were prepared in a 720 mL glass jar (mesocosm), according to the treatments established in the vineyard (MSO, OF, SF; see
Section 2.1) by using the same soil (0.3 kg dw) and fertilizers (organic and synthetic) as those in the vineyard experiment. Treatments were replicated (×3), and that resulted in nine mesocosms in total. Mesocosms were rewetted to 20% per dry weight with distilled H
2O and were let to equilibrate for 4 days at 20 °C in the dark. After that, mesocosms were incubated for 60 days at 20 °C. Soil moisture was maintained by adding the required amount of H
2O, and headspace gas samples were taken regularly. Headspace CO
2 concentration was determined by attaching an infrared gas monitor (Li800, Licor, Lincoln, NE, USA) through headspace fittings attached to an air-tight closed mesocosm. The accumulated CO
2, approx. after 30 min of mesocosm closure, was converted to an hourly rate (C-CO
2 mg kg
−1 h
−1) and interpolated to a cumulative flux (C mg kg
−1), assuming a linear relationship between measurements.
Litter decomposition (C release) and pruning or other plant residues C from previous seasons were not measured.
2.3. Climatic Parameters and Soil Water
Climate characteristics of the vine-growing area were evaluated by establishing a weather station in the vineyard (Watchdog 2700 weather station; Spectrum Technologies, Inc., Aurora, IL, USA), which was used to compute the following climatic indexes: (1) the thermal Index of Winkler (WI), (2) the Heliothermal Index of Huglin (HI), (3) the Cool night index (CI) which is a night coolness variable that takes into account the mean minimum night temperature during ripening phase (August–September) and (4) the number of days with maximum temperatures above 30 °C, an expression of drastic climatic events. The period for the calculations was from 1 April 2020 to 31 October 2020. The formulas for the calculations are:
Tmean = daily mean temperature °C
Tmax = daily maximum temperature °C
baseline temperature = 10 °C
K = parameter dependent on the latitude of the location; in the case of Cyprus, this value is equal to 1.02.
Soil temperature (°C) and volumetric water content (cm3 cm−3) measurements were obtained at a weekly interval, typically at 10–11 am, during the period April–September 2020 (18 measurements in total for this period). Stainless steel and analog soil thermometers (ETI Ltd., West Sussex, UK) were used. They were placed in the soil (20 cm depth) and allowed to equilibrate for 30 min before measurement. Three measurements per replication (n = 3 measurements × 3 replications × 3 treatments = 27) were made at each of the time points.
Soil samples (
n = 27) were additionally obtained to determine soil volumetric water content and soil bulk density (using a 7 × 10 cm ring; 384.65 cm
3). They were weighed and dried at 105 °C for 48 h to obtain the dry weight. The gravimetric soil water content was determined and converted to volumetric, using the average value obtained for the soil bulk density ρ
b = 1.2 g cm
−3. Soil temperature and moisture graphs for the 3 treatments are presented in
Figure S1 (Supplementary Material).
2.4. Grape Qualitative Attributes
To check if the applied treatments affect grape quality, berries were harvested based on their ripening stage, with sugar concentration reaching approx. 24 °Brix. The collected berries were placed in nylon bags (100 berries from each of the replicates per treatment) and kept in a cool box to prevent dehydration in the field, and transferred within 40 min to the laboratory. At the lab, berries from all treatments were weighed and then either used for measurements or were frozen and conserved at −20 °C for further analyses.
The pH, total soluble solids (TSS), and titratable acidity (TA) were determined according to the methods described by the International Organization of Vine and Wine [
29]. TSS was determined with a portable digital refractometer (Master Baume 2594, Atago, Japan). The pH values were measured with a pH meter (HI 2222, Hanna Instruments, Inc., Woonsocket, RI, USA). TA was determined potentiometrically (titration with 0.1 mol L
−1 NaOH up to pH 8.1) as described in [
30]. All measurements were carried out in triplicate. The content of ascorbic acid (AA) was determined by the 2,6-dichloroindophenol titration method according to [
31], and results were expressed as mg of ascorbic acid per 100 mL of grape juice (mg of AA 100 mL
−1 grape juice). Polyphenols were extracted by a modified method described by [
32]. Fresh grapes were homogenized with 80% acetone, and extraction was assisted with an ice sonication water bath for 10 min. Samples were centrifuged at 4000×
g at 4 °C for 15 min, and supernatants were stored at −20 °C until use for the analysis of total phenolics. Total phenolic content was measured using the Folin-Ciocalteu method at 755 nm [
30], and results were expressed as equivalents of gallic acid per g of fresh weight (mg of GAE g
−1 Fw). Condensed tannins were determined using the Bate-Smith assay as described by [
33] at 550 nm, and results were expressed as g of condensed tannins per liter of grape juice (mg of condensed tannins per 100 mL grape juice).
2.5. The Vineyard Carbon Tool and Modelling Zero Emissions and Carbon Farming Management Scenarios
2.5.1. The Vineyard Carbon Tool
In parallel to the annual C balance determination work, a tool based on Microsoft Excel was developed using (1) the Ledo et al. [
34] perennial GHG model and (2) the Cool Farm Tool (CFT [
19]; Hillier et al., [
20]), (3) Data relating on vine cultivation and growth.
All information about the CFT tool, the equations, and the modeling approach is provided in detail in these sources and will not be repeated here. Briefly, the CFT is used worldwide for estimating the GHG impacts of agricultural production and is largely based on IPCC Tier 1 quantification methods [
20,
21]. Its most recent version supports carbon farming project development worldwide and incorporates the latest IPCC guidelines for C sequestration. It also incorporates the philosophy of the ROTH-C model [
35]. The CFT follows the LCA principles from cradle to farm gate. Therefore, data elements required to calculate direct emissions from fertilizers, pesticides, energy usage, land management/land-use change, and transportation were collected in the interface and processed through the Cool Farm Tool Application Programming Interface (API).
The current version of the online CFT has limited capabilities for incorporating GHG emissions from perennial crop production, specifically concerning biomass growth and residue management. Therefore, Vineyard Carbon Tool (VCT) (available as
Supplementary Materials) was developed to support perennials modeling. The VCT uses as inputs vineyard-specific data on the management of (a) Soil and Agricultural Inputs, (b) Yield and Pruning, (c) Residues, (d) Land (including tillage frequency and non-vine plant biomass), (e) Energy use, and (f) Transport. It then determines the carbon footprint of grapes.
Data on vine growth and grape production were applied to the perennial GHG model developed by Ledo et al. [
34]. The VCT was programmed in Python with an additional API that makes it user-friendly. It simulated the growth of the vines over the life cycle of the crop and the emissions that resulted from different biomass managements, i.e., removed from the farm, burned, composted, or chipped and spread on the soil. GHG estimates from the perennials tool (i.e., biomass and perennials residues management) plus GHG from farm management (fertilizers, energy use) from the online CFT were combined within the VCT to provide a summary estimate of overall emissions or sequestration associated with vineyard management. These estimates were also reported in terms of emissions intensities (CO
2-eq kg
−1 of grapes and CO
2 ha
−1 of vineyards). In the CO
2-eq determination, this approach also considers the presence of natural vegetation in the vineyard margins (e.g., bushes and trees). The species and density of natural vegetation in the vineyard margins were assessed and coupled with literature data to estimate its biomass and annual growth in terms of trunk increase (cm). The LCA approach followed by the VCT is from cradle to winery gate.
2.5.2. Modelling Zero Emissions and Carbon Farming Management Scenarios
The VCT tool was used to explore scenarios for different management practices that would bring a reduction of the GHG emissions and, therefore, to select practices that increase C storage in the vineyard soil. In
Table 1, the management practices relevant to the 3 different treatments (MSO, OF, SF) are presented. The data presented in
Table 1 are required to run the VCT and perform LCA from cradle to farm gate.
- (I)
Zero emissions scenario
Treatment SF, which is considered a typical situation in the case of indigenous grape varieties cultivation in Cyprus, was used to explore management practices for achieving 0-emissions grape production. Accordingly, the following were explored:
- (a)
Reduction in N fertilizer use to reduce soil emissions and GHG from the fertilizer production and distribution processes;
- (b)
Adopting no-till in part of the vineyard area;
- (c)
Reduction in fuel use due to no-till, reduction in pesticide application, and reduction of fuel used for transportation (visits of the farmer to the vineyards and adopting more fuel-efficient means for produce transportation to the winery, e.g., delivering to wineries closer to the farm).
- (II)
Carbon farming scenario
A second scenario was studied for reducing GHG emissions and increasing C storage, also based on the treatment SF of the experiment (
Table 1). The focus was to propose practices that could lead to benefits for the farmers due to increased C storage in the vineyard. Therefore, the following practices were examined:
- (a)
A 50% reduction in N fertilizer (60 kg N ha−1);
- (b)
A 75% reduction in pesticides (1-time sulfur);
- (c)
All pruned materials incorporated into the soil;
- (d)
A 50% of the vineyard under no-tillage (for the whole life of vines);
- (e)
Use of a maximum of 150 L diesel year−1 ha−1 in the vineyard;
- (f)
A 100% (+100 trees ha−1) increase in vegetation (trees, shrubs) in the vineyard margins.
2.6. Data Treatment and Statistical Analysis
Kruskal-Wallis tests were used to test the null hypothesis that the medians of C content (kg C) in grapes, stalks, berries, leaves, stem, shoots, and roots within each of the 3 treatments (MSO, OF, SF) were not significantly different. This was also performed for Above ground C and total C in vines, root, and soil respiration, as well as grape quality attributes. The pairwise comparisons among the 3 treatments were made using the Bonferroni procedure at the 95% confidence level. Statgraphics Centurion V19 (STATPOINT) was used for data visualization and analysis.
2.7. Assumptions and Limitations of This Research
The main assumptions and limitations of the current work are that: the year 2020 measurements (8-year-old vines) are representative of the average annual of the whole life cycle of grapes; the rate of nutrients released from organic fertilizer is similar to that of synthetic (typically, the nutrient release rate is slower in organic materials); the C content in plant tissue is 50% of the dry weight; C due to litter addition/decomposition to the soil is not considered in the annual C balance (field) experiment. Instead, this was considered by the CFT (modeling work); soil respiration is similar to that observed in the mesocosm experiment, and only CO2 was considered (not N2O, CH4, NH3); the life of the vineyard for Xynisteri is assumed to be 30 years.
3. Results
3.1. Climatic Parameters and Soil Moisture
The temperature (average ± Standard Deviation; SD) was 25.6 °C (±4.8), relative humidity (RH) 41.0% (±20.7), wind gust 6.6 km h
−1 (±7.2), and prevailing wind direction was SE (Southeast). The thermal Index of Winkler (WI), the Heliothermal Index of Huglin (HI), and the Cool night index (CI) values were 2901, 2917, and 22.8 °C. In
Figure S2, the T
max is plotted, and 43% of the days during the period 1 April to 31 October 2020 had a temperature above 30 °C. The soil water content was high at the beginning of the season (0.5 cm
3 cm
−3) due to the winter rainfall and decreased to 0.2 cm
3 cm
−3 during the period June-September (
Figure S1; Supplementary Materials). The soil temperature range was 17–30 °C (20 cm soil depth) during the experimental period. Irrigation was not applied, and rain was zero during the period June–September 2020.
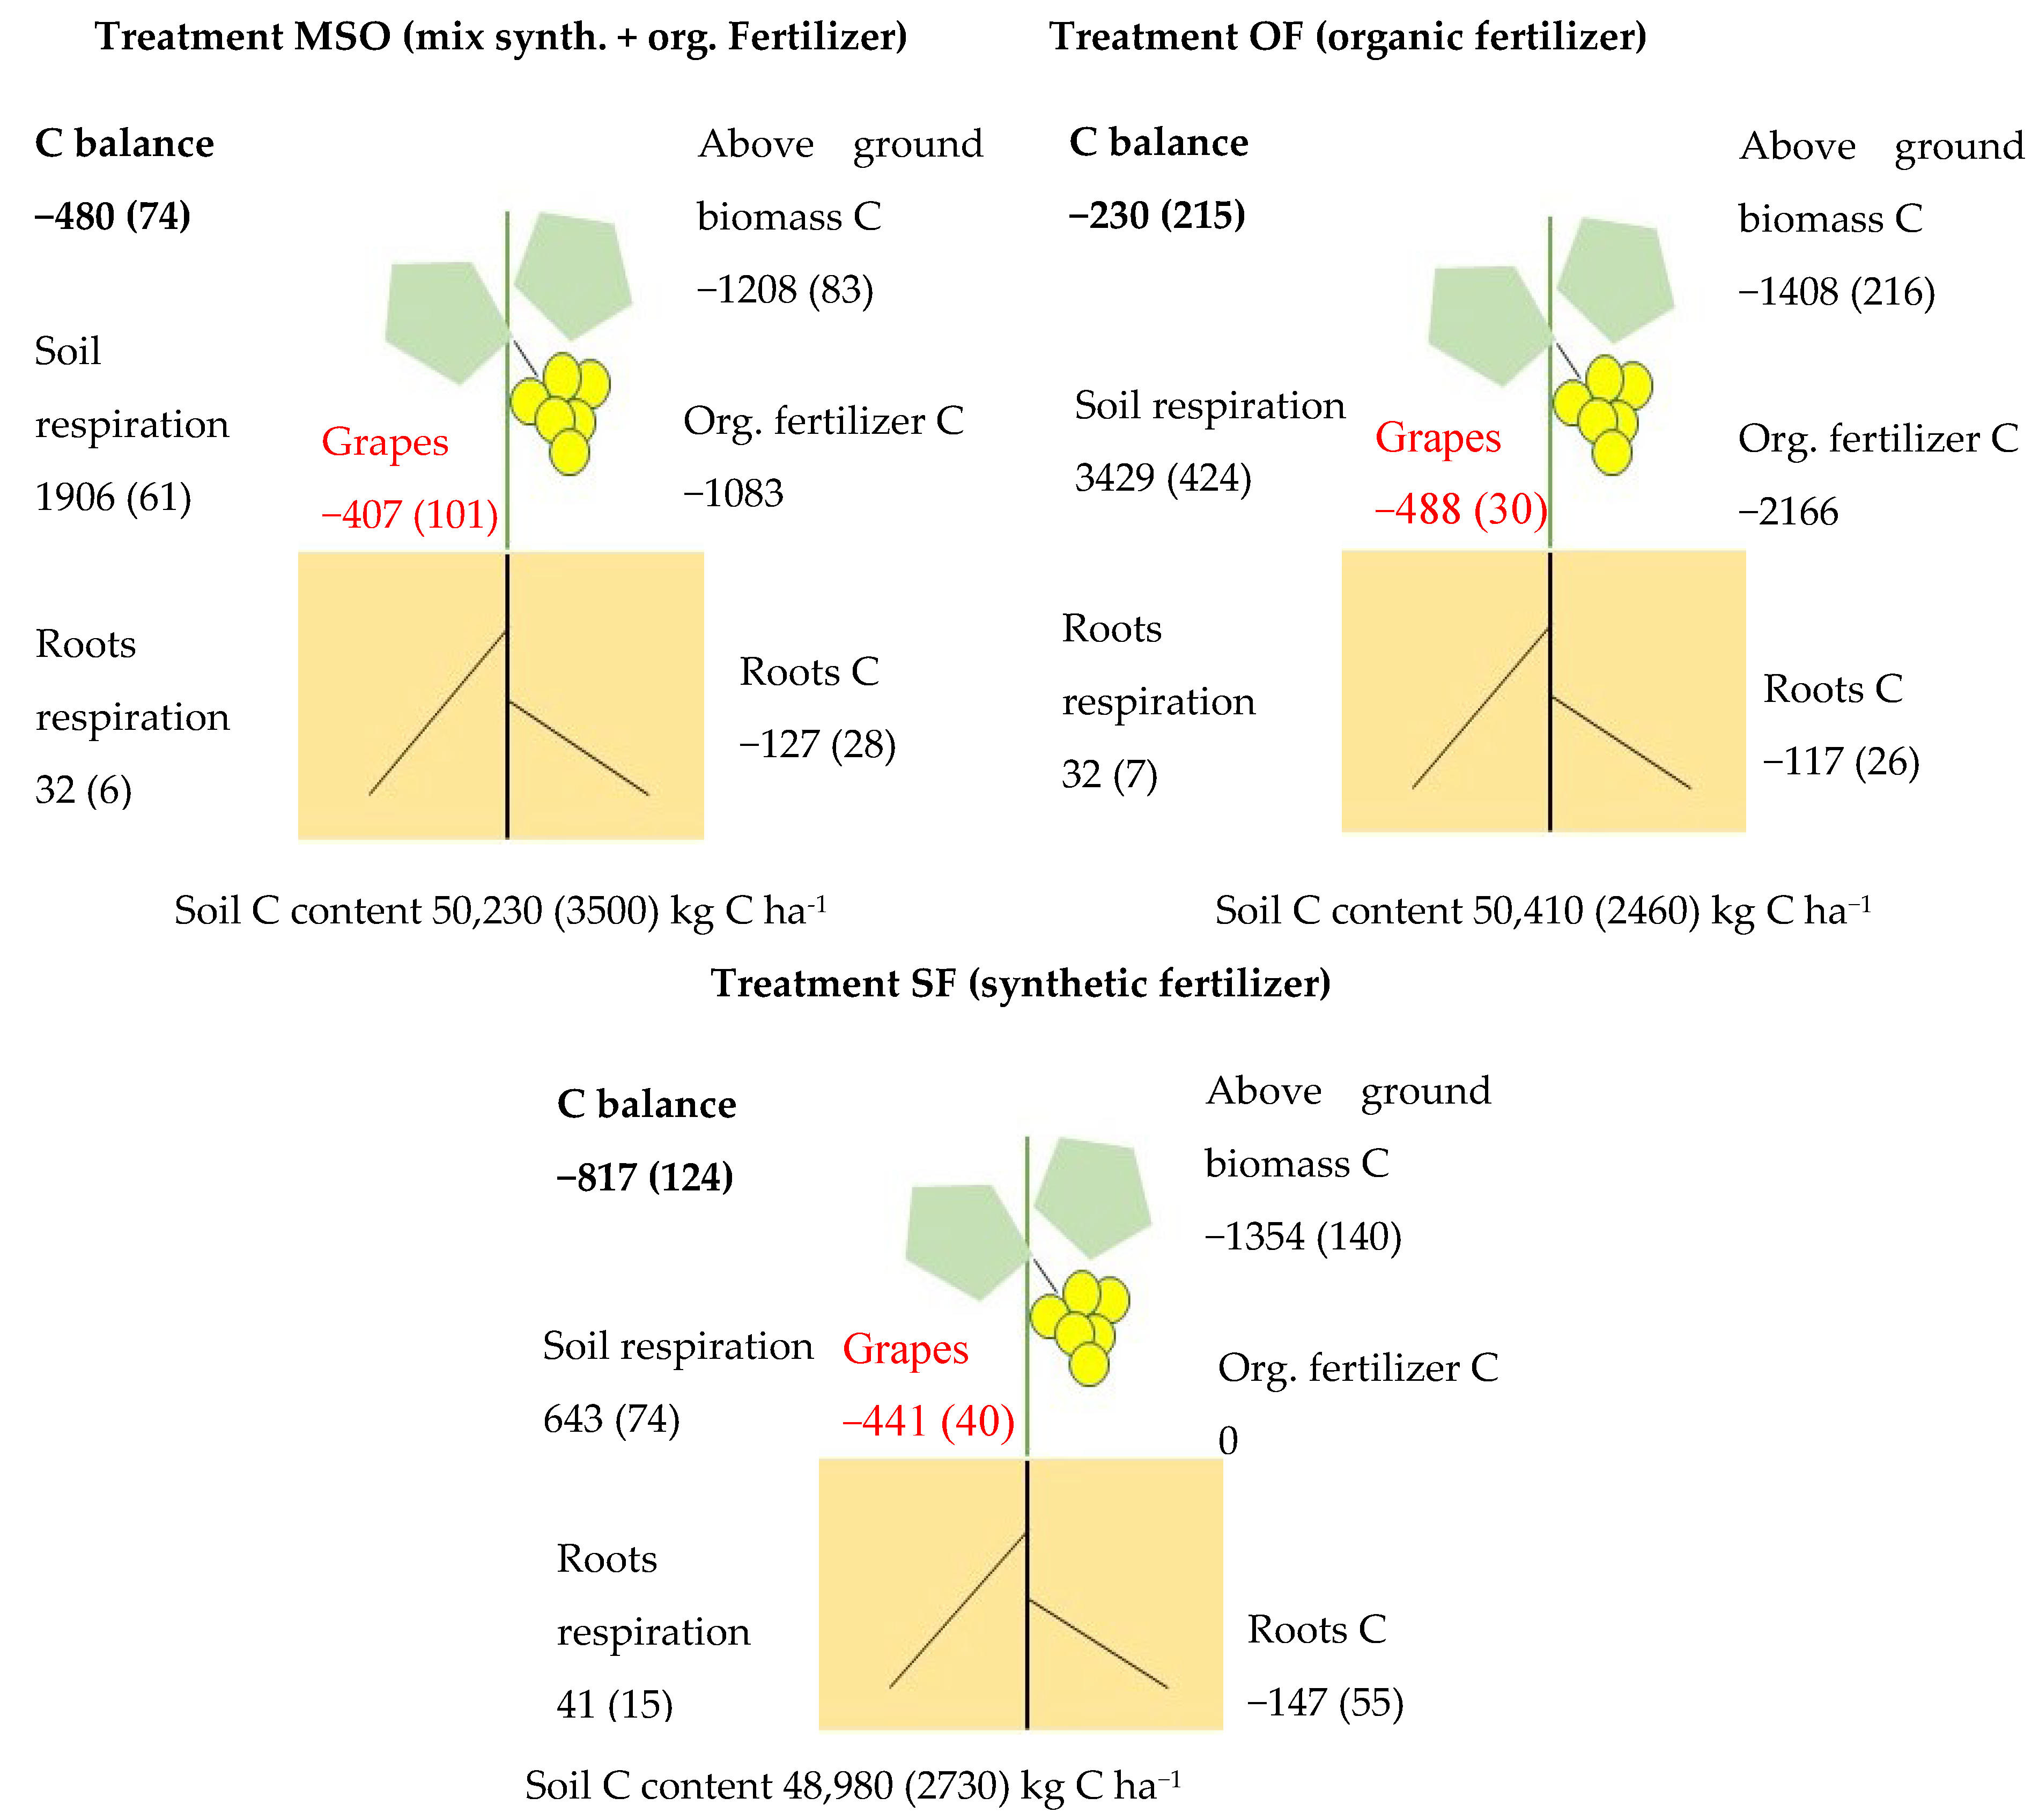
3.2. C Balance at the Vine and the Vineyard Level
In
Figure 2, the results for the determination of C balance in Xynisteri vines (field measurements) are presented for the three treatments.
In
Figure S3 (Supplementary Materials), the C balance results are provided in kg C per vine. In
Figure S4 (Supplementary Materials), the measured biomass C (kg C) that is stored annually per vine plant and treatment is presented, while in
Figure S5, soil (
Figure S5a) and root (
Figure S5b) respiration are presented. Considering soil and roots respiration as C outputs and organic material addition plus annual biomass (above and below ground) as inputs, the balance (average and standard deviation) was −480 (74), −230 (215), and −817 (124) kg C ha
−1 year
−1 for treatments MSO, OF and SF, respectively.
Carbon storage in grapes (fruit) was not considered as they are exported from the system. Soil respiration increased in treatments MSO and OF, where organic material was added, in comparison to treatment SF. After the end of the period, soil organic C was slightly increased in treatments MSO and OF.
3.3. Effects of Different Management Practices on Grape Quality
In
Figure 3, the effects of the three treatments on the grape’s qualitative characteristics are presented. There were no statistically significant differences (Kruskal-Wallis test) for the grape quality parameters among the three different treatments applied in the vineyard.
The average (standard deviation; SD) pH values obtained were 3.7 (0.026), 3.6 (0.095) and 3.6 (0.153) for treatments MSO, OF and SF, respectively. Total Soluble Solids (TSS) were 21.9 (2.16), 22.7 (2.94), and 18.8 (2.71) °Brix, for treatments MSO, OF, and SF, respectively. Total phenolic content for treatments MSO, OF, and SF was 3.2 (0.42), 2.5 (0.47), and 2.8 (0.32) g GAE g−1 fw (fresh weight), respectively.
Tannins concentration was 0.38 (0.05), 0.38 (0.05) and 0.37 (0.02) g L−1 in treatments MSO, OF and SF, respectively. Ascorbic acid content was 0.5 (0.02), 0.4 (0.07) and 0.4 (0.02) mg AA/100 mL in treatments MSO, OF and SF, respectively. Finally, titratable acidity was 3.5 (0.25), 3.7 (0.44), and 4.5 (0.46) g tartaric acid L−1 in treatments MSO, OF, and SF, respectively.
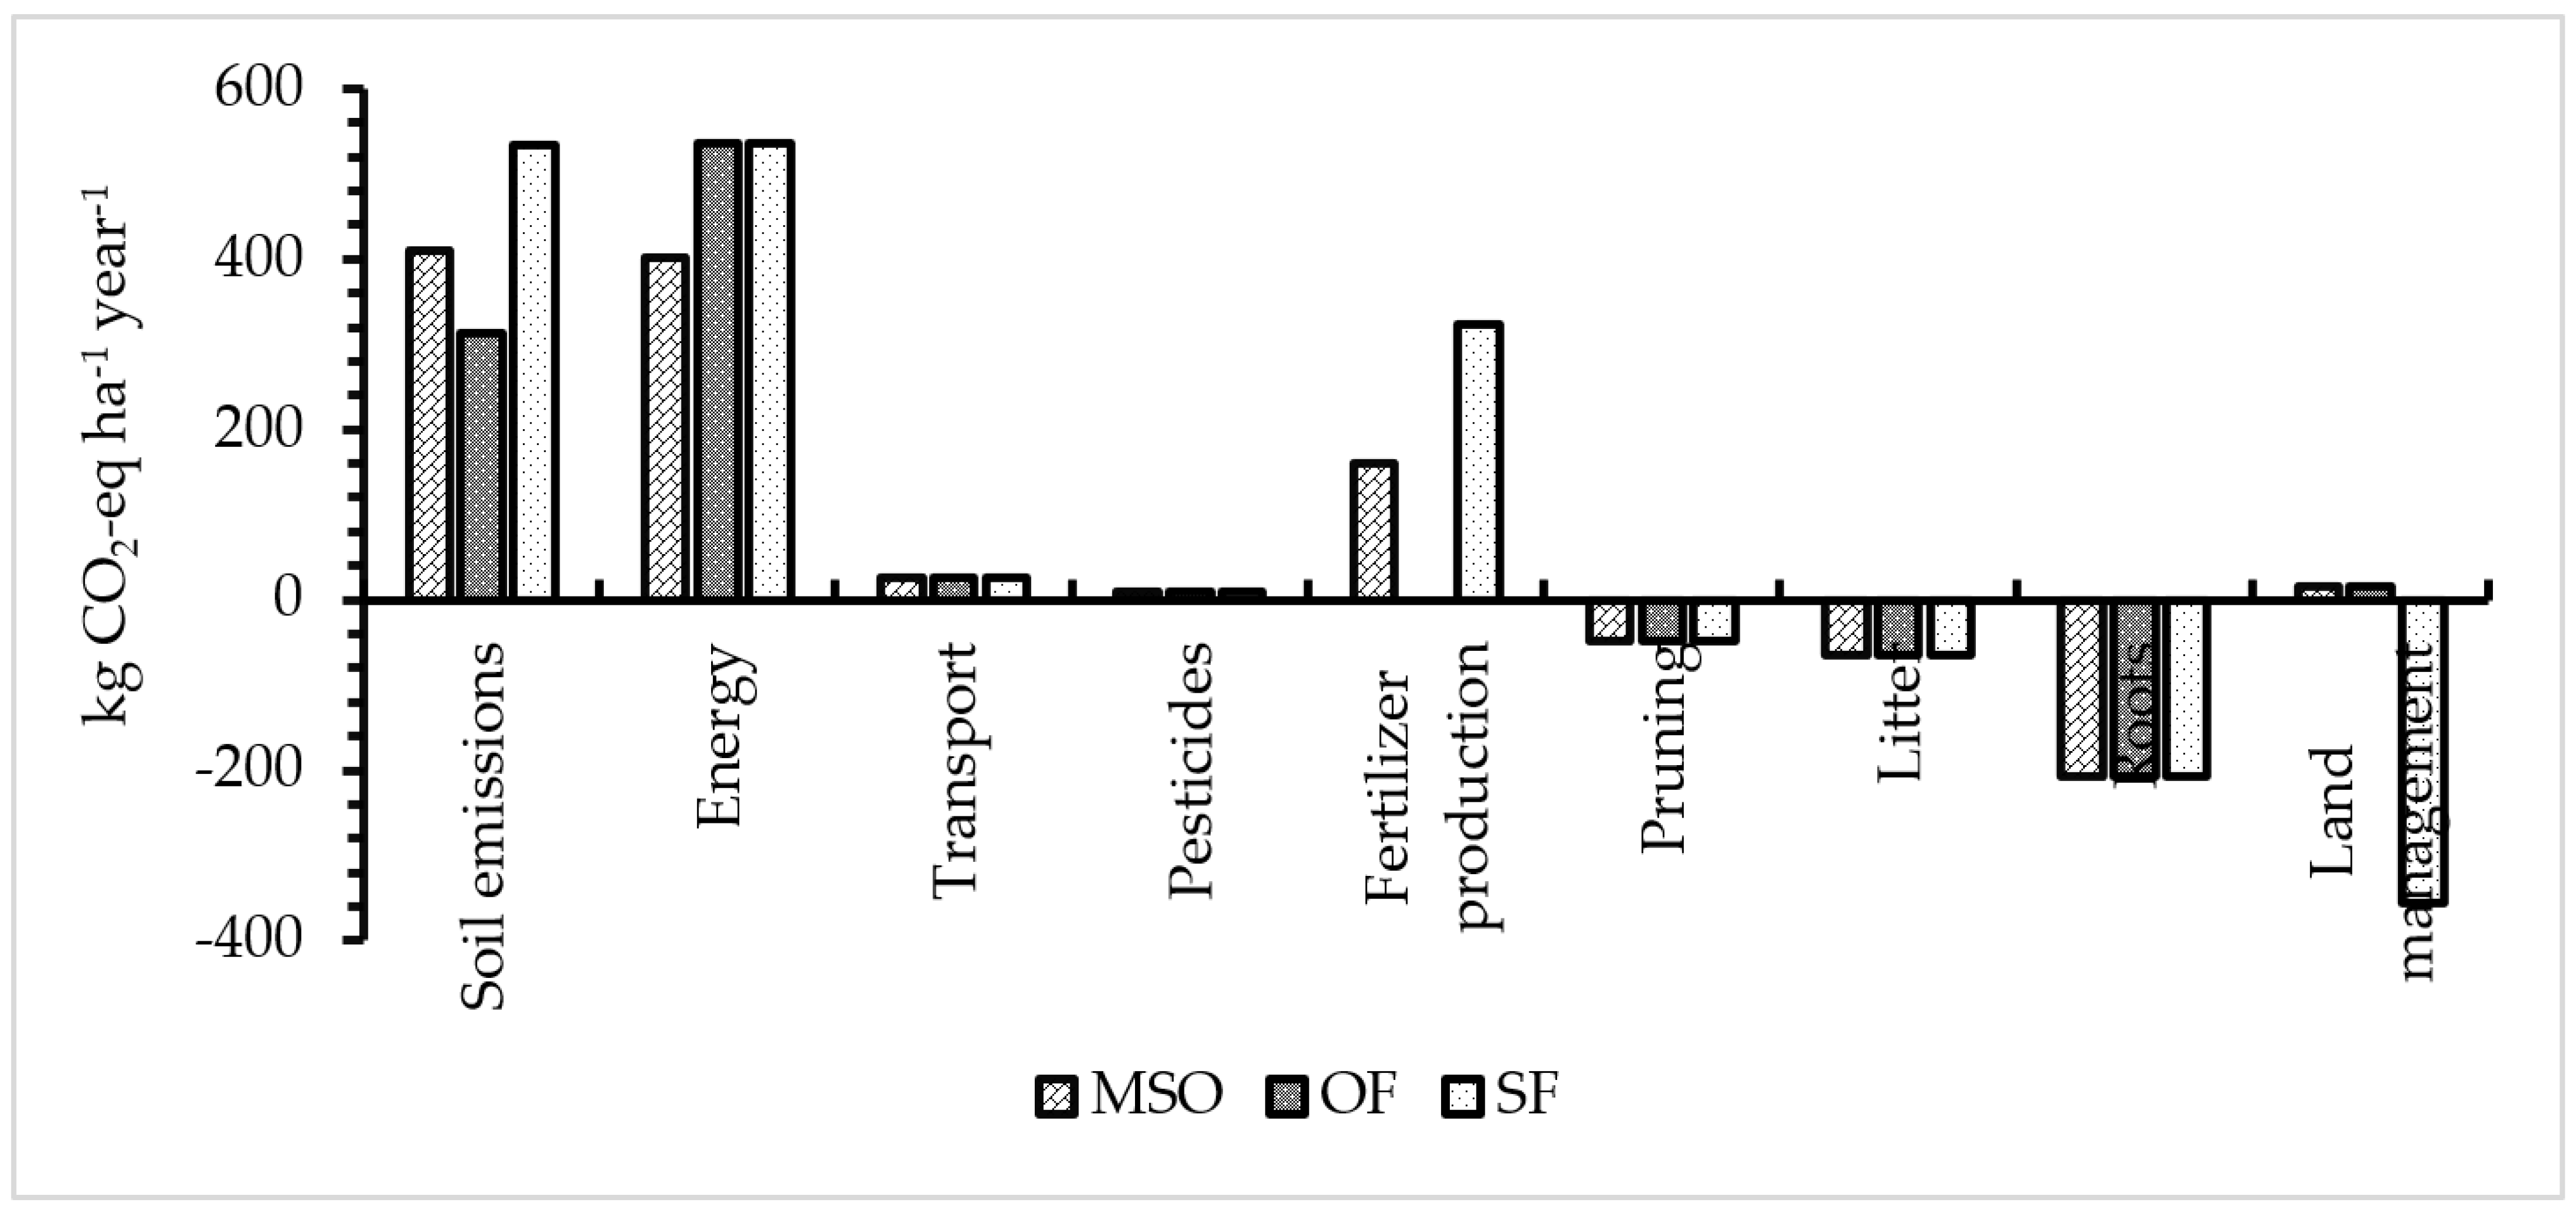
3.4. GHG Emissions for the Different Management Practices
In
Figure 4, the parameters and management practices that are considered in GHG emissions are presented, as obtained after applying the VCT for the three treatments (MSO, OF, and SF) and given as kg CO
2-eq ha
−1 year
−1. In
Figure S6 (Supplementary Materials), vine biomass (modeled) is presented (
Figure S6a), as well as the partition in wood, roots, and leaves (
Figure S6b). The comparison of the measured and modeled C biomass is presented in
Figure S7. The Tool also estimates C storage due to litter, roots, and pruning material addition to the soil, which was equal to −64, −48, and −208 kg CO
2 ha
−1 year
−1, respectively, and assumed to be the same for the three treatments. Soil emissions were 411, 314, and 535 kg CO
2-eq ha
−1 year
−1 for the treatments MSO, OF, and SF, respectively.
Energy-related emissions were 402 for the treatment MSO (organic and synthetic fertilizer application) and 536 kg CO2-eq ha−1 year−1 for the treatments OF (organic fertilizer) and SF (synthetic fertilizer), respectively. Emissions related to the production of fertilizers were 161, 0, and 322 kg CO2-eq ha−1 year−1 for the treatments MSO, OF, and SF, respectively. Transportation and pesticide production and use emissions were equal to 26 and 10 kg CO2-eq ha−1 year−1 for the treatments MSO, OF, and SF, respectively. Finally, land management-related emissions, due to C storage in vineyard margins and tillage, were 16 kg CO2-eq ha−1 year−1 for the treatments MSO and OF and −355 kg CO2-eq ha−1 year−1 for the treatment SF. Due to vines removal and use as fuel wood after the end of the life cycle (30 years), the C stored in the vine wood was not considered. Therefore, the annual balance was 705, 581, and 754 kg CO2-eq ha−1 year−1 for the treatments MSO, OF, and SF, respectively. Using a typical production of 3800 kg ha−1 year−1 for this vineyard, the emissions per kg of grape were 0.186, 0.153, and 0.198 kg CO2-eq kg−1 for the treatments MSO, OF, and SF, respectively. Finally, the emissions for the life cycle (30 years total) of the vineyard (cradle to winery door) were 21,160, 17,437, and 22,614 kg CO2-eq ha−1 for the treatments MSO, OF, and SF, respectively.
3.5. Modelling A Zero Emissions and A Carbon Farming Management Scenario
3.5.1. Zero Emissions Scenario
Based on treatment C (see
Table 1), which is typical for the study area, zero-emission grapes could be produced by applying the following practices (results based on the Vineyard Carbon Tool—
Table 2):
A 33% reduction in N fertilizer use (80 kg N ha−1);
No-tillage in 30% of the vineyard area;
An 18% reduction in diesel fuel used (170 L ha−1 year−1) for vineyard tillage, spraying, and transportation;
Reducing pesticide applications (active substances) to two times per year.
3.5.2. Carbon Farming Scenario
A second scenario was studied for increasing Carbon storage, also based on treatment C (
Table 1). The focus was to propose practices that could be adopted in eco schemes to reward farmers due to increased C storage in the vineyard (
Table 3). Therefore, according to the VCT, the following practices could be adopted:
A 50% reduction in N fertilizer use (60 kg N ha−1);
A 75% reduction in pesticide use (one-time sulfur);
All pruning’s and end-of-life wood added to the soil;
A 50% of the vineyard no-till and cultivation to incorporate residues;
Use of 150 L diesel year−1 in the vineyard;
A 100% (total 200 bushes ha−1) increase in vegetation (trees, shrubs) in the vineyard margins.
The adoption of the above will lead to total CO2 savings equal to 25,124 kg CO2-eq ha−1 (over the 30 year vineyard life cycle).
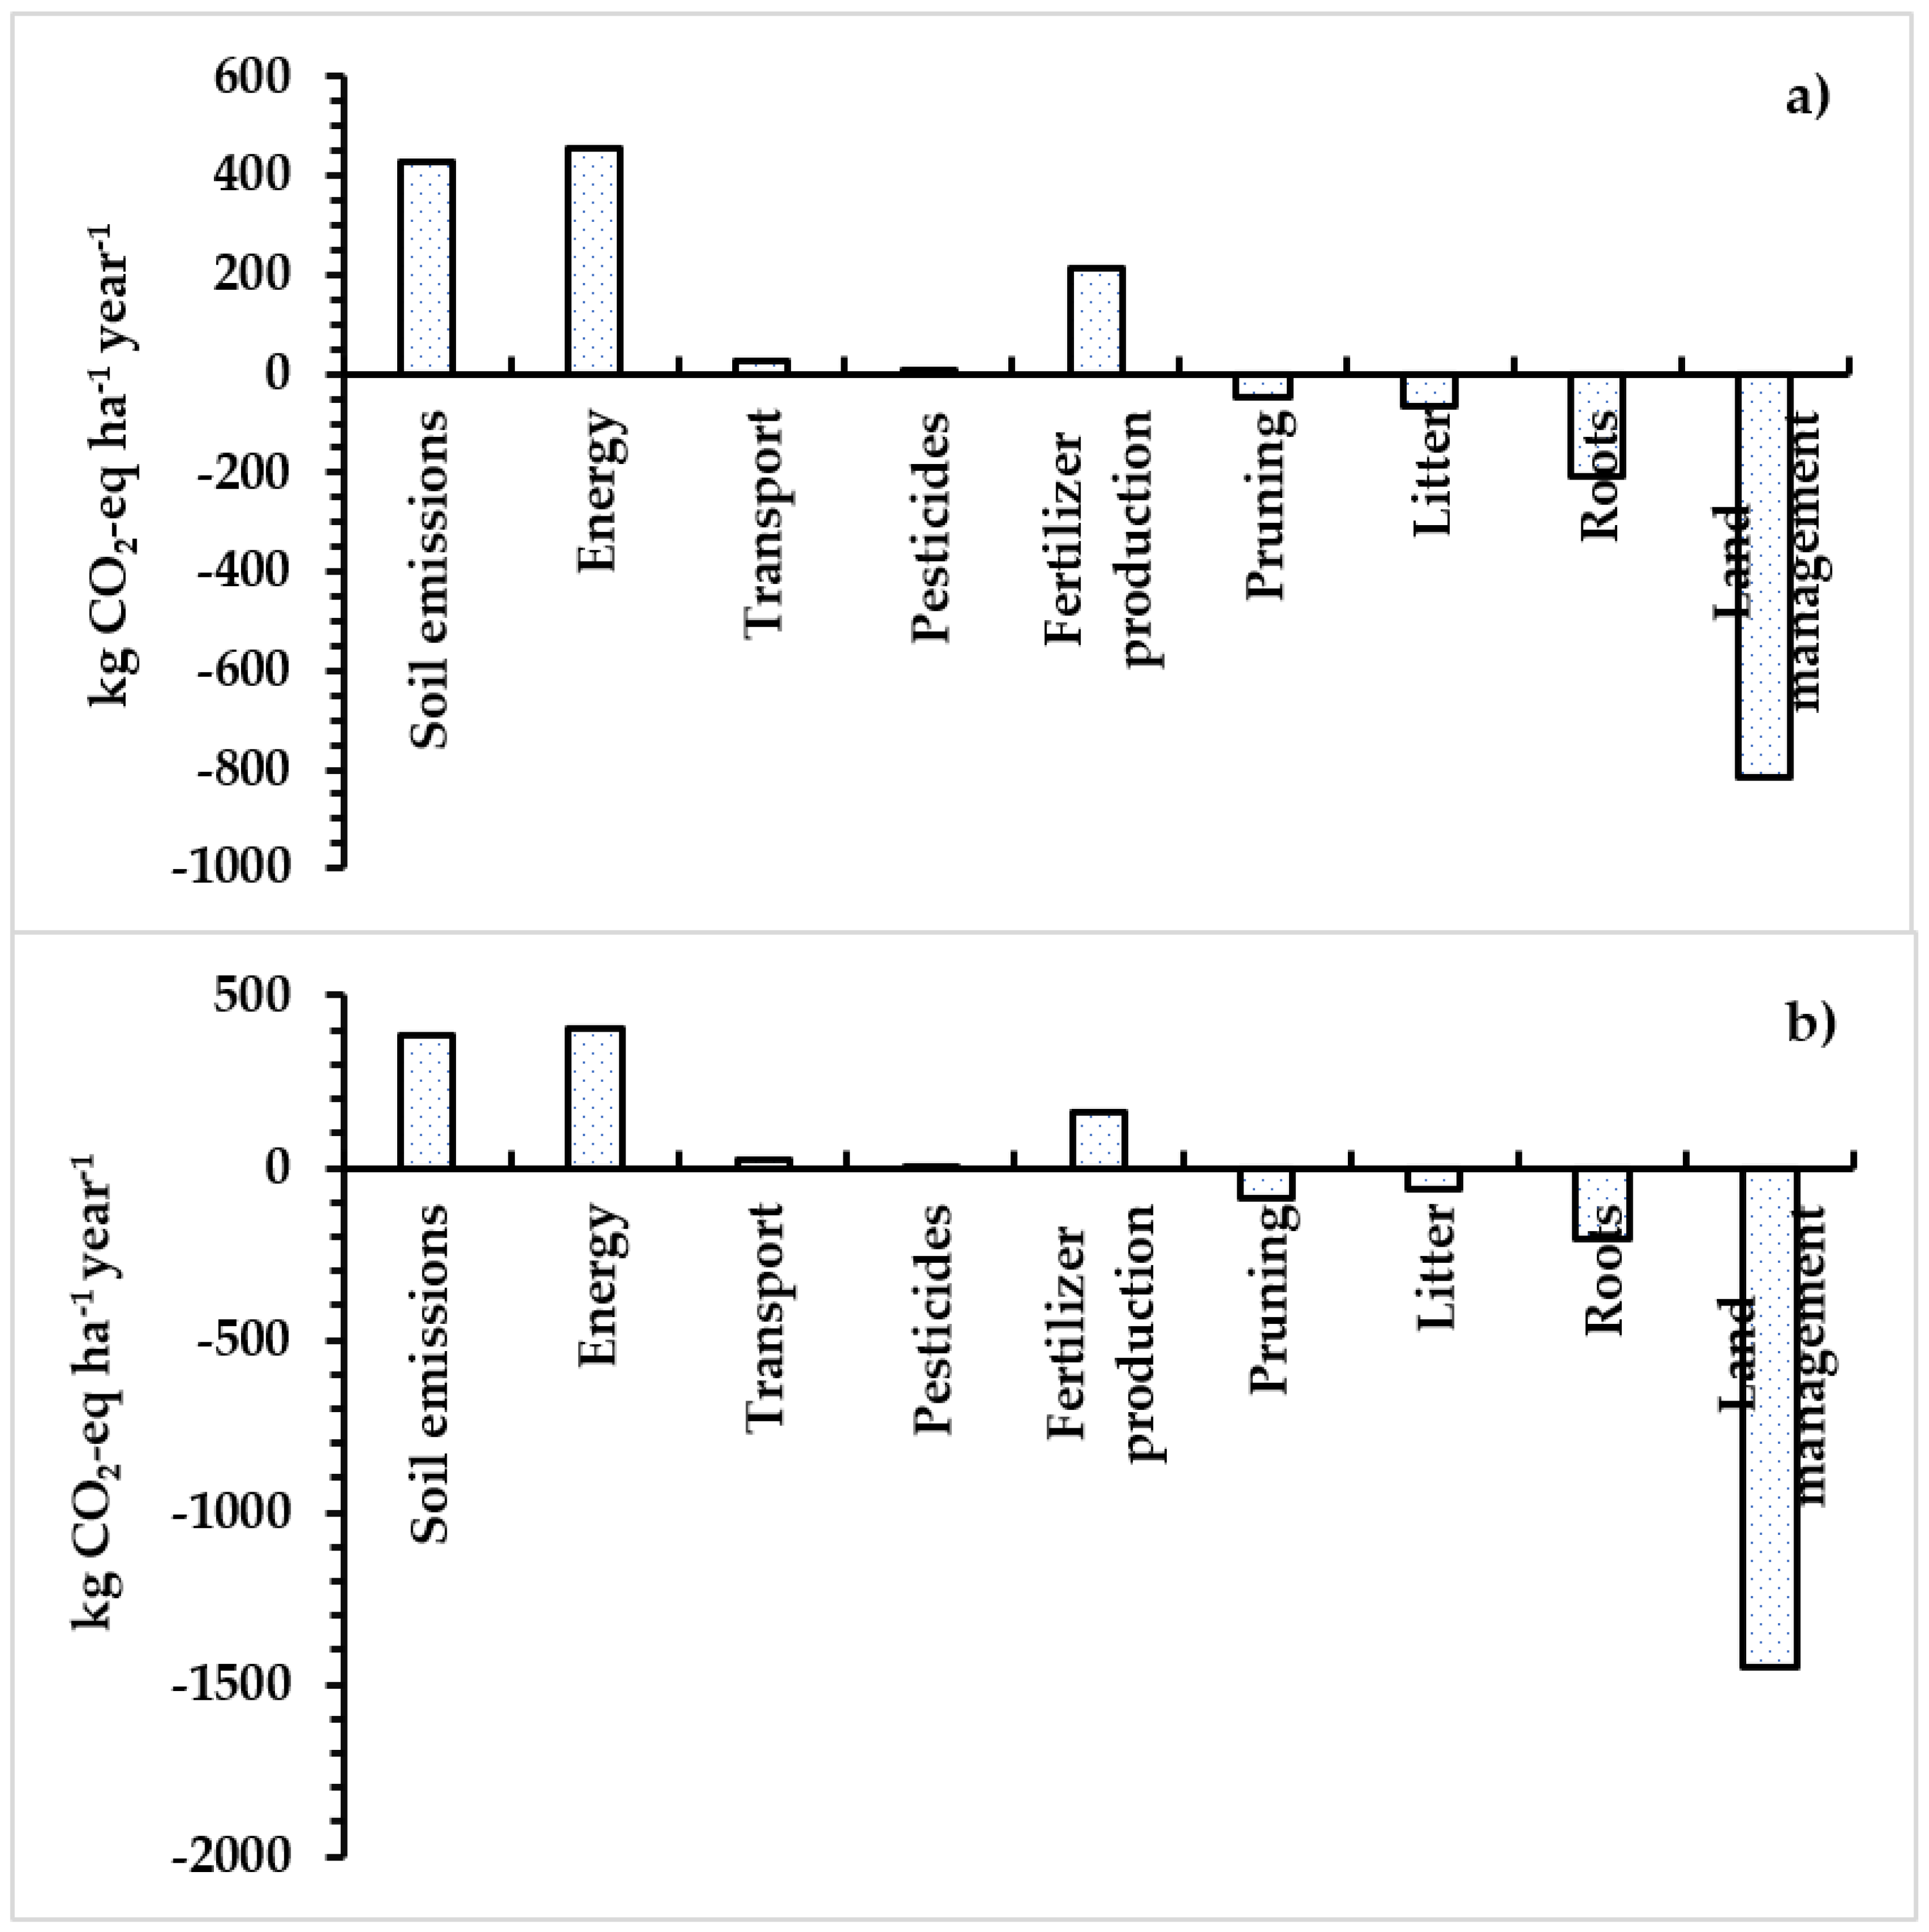
The contribution of each of the management practices and parameters in the emissions for the cases of zero-emissions grape production and Carbon farming scenarios are presented in
Figure 5a,b.
4. Discussion
To the best of our knowledge, the current work represents the first calculation of C balance in a non-irrigated vineyard. Results show that above-ground biomass plays an important role in C sequestration (
Figure 2). However, we only accounted for the annual C balance and considered only the roots present in the 0–40 cm layer of the soil. Vines have extensive and deep-root systems (reaching down to 5–10 m on arid Cypriot soils to exploit water), which also allows for direct transfer of organic C into the subsoil, which reduces the risks of soil organic C mineralization due to the reduced microbial activity at deeper soil depths [
36]. Per vine, we measured 0.5 kg of C (or 1.83 kg CO
2) stored annually above ground (grapes were not taken into consideration as they were removed from the system). Annual roots remain in the soil, and a part of this enriches the soil’s organic matter. Most of the annual above-ground biomass is removed after pruning. This means that the management of pruning material is important for enriching the soil with organic matter. Trunk C storage was not considered as trunks are typically used as fuelwood at the end of life of the vineyard, instead of fossil fuels, and the C is returned to the atmosphere.
Per ha of vineyards, our measurements showed that the above-ground biomass removes 1200–1400 kg C annually. Depending on the management practices and the climatic conditions, a part of this C could be stored in the soil as organic material. Nevertheless, incorporating prunings into the soil is not the best available option for C storage [
12] compared to other options, such as organic material addition. We estimated (litter bags; data not shown) that 50% of the biomass added annually in the soil remains after one year. This practically means that if the pruning material is incorporated into the vineyard soil, 600–700 kg C ha
−1 year
−1 could be stored. This value is close to the benefit that is expected from using cover crops in a semi-arid environment [
5]. However, our results cover one year only. Multi-year data, taken under variable management practices, cultivars, and soil-climatic data, could give a clearer picture regarding C management [
37].
In a similar study in Italy, the C balance ranged between −1700 and 4750 kg C ha
−1 year
−1 [
26] for irrigated grapes. In our case, the range was −230–−817 kg C (or Mg) ha
−1 year
−1, and the difference is attributed to higher biomass production and soil respiration in the Italian study. The C pool in the soil in our experiment was measured at 48,980–50,410 kg C ha
−1 (
Figure 2) at a depth of 0–40 cm. The value is lower than what was reported in the study of Brunori et al. (2016), where C content was 44,160–73,350 kg C ha
−1, considering the first 20 cm only.
Although there is data available on C storage in vineyards, the effect of different management practices related to C farming on grape quality has not been studied. Grape juice quality characteristics are very important for the production of high-quality wines [
23]. No significant difference was observed for pH, TSS, total phenolic content, tannins, ascorbic acid, and titratable acidity among the three different treatments (
Figure 3). Our results are complementary to the work of Chrysargyris et al. [
38], where a more in-depth analysis was conducted regarding tillage and irrigation regimes in Xynisteri. We stress, however, that our study covered only one growing season and that more studies on the topic are needed to reach safe conclusions.
Regarding the modeling work using the Vineyard Carbon Tool, different management practices affected the CO
2 emissions of grapes produced from an LCA perspective (
Figure 4). Land management, which in our case was captured as soil tillage practices and vineyard margin vegetation, is highly important for mitigating GHG emissions from viticulture. Additionally, field margins are very important for ecosystem services provisioning and biodiversity conservation. Preserving vineyard margin vegetation during the lifetime of the vineyard (30 years) could lead to C storage of 355 kg CO
2-eq ha
−1 year
−1.
In the modeling study, vine growth was considered not to be affected by management practices. This was supported by the measurements conducted (
Figure S3), where no significant differences were observed among the three treatments for biomass production. Accordingly, C storage in the soil resulting from root biomass, litter, and pruning residue management was considered the same for the three treatments (
Figure 4).
Treatment SF (synthetic fertilizer) had the highest emissions related to fertilizers production (industrial process). Treatment MSO (synthetic and organic fertilizer use) had half the emissions of C, as the synthetic fertilizer was reduced by 50%. Finally, treatment OF (organic fertilizer) had zero emissions related to fertilizer production. This is a simplification, as we were not able to account for the emissions related to goat manure production, which was kept outside the facility for one year. Anaerobic conditions in manure lead to CH
4 emissions. The organic material from the winery (e.g., stalks, lees) was immediately mixed with the manure; thus, emissions from production are practically zero. Soil emissions were modeled according to N fertilizer use (N
2O, NH
3 emissions) and organic matter decomposition due to soil tillage. Therefore, higher soil emissions were observed for treatment C (
Figure 4), which is typically practiced in Xynisteri cultivation in Cyprus.
Energy use was slightly reduced in treatment MSO due to lower amounts of synthetic and organic fertilizer applied in comparison to treatments OF and SF. Overall, the emissions for treatments MSO, OF, and SF per year were 0.186, 0.153, and 0.198 kg CO
2-eq kg
−1 grapes, respectively. For the life cycle (30 years total) of the vineyard and for the treatments, MSO, OF, and SF 21,160, 17,437, and 22,614 kg CO
2-eq ha
−1, respectively. These results indicate the role of vineyards as CO
2 emitters and the importance of promoting low input viticulture (reducing fertilizers and energy), preserving vineyard margins, and shifting to no-till viticulture to achieve zero-emissions farming. Non-irrigated viticulture and indigenous varieties are very important for the shift [
14].
In treatments MSO and OF, reducing and replacing synthetic fertilizers with organic and adopting reduced tillage leads to drastic GHG emissions reduction. However, the use of organic material should be carefully considered as it could trigger flash CO
2 emissions due to increased soil respiration (
Figure 2). To modify management practices in treatment SF and propose a way of producing zero emissions grapes, we concluded that this is possible after a 33% reduction in synthetic N fertilizer use, no-till in 30% of the vineyard area, and 18% reduction in fuel consumption for tillage, pesticides application (50% reduction; only two times per year) application and transportation. As presented in
Figure 5a, C storage in the soil and plant biomass (roots, litter, pruning residues, reduced tillage, and preserving vineyard margins vegetation) is equal to the emissions resulting from fertilizer production, pesticides production, and the use and transportation of N fertilizers and the fuel use and soil emissions associated with their use and organic matter decomposition. This modeling exercise also highlighted the importance of the LCA approach in C farming, as C sequestration was increased to 1135 kg CO
2-eq ha
−1 year
−1, but emissions due to energy and fertilizer production and use resulted in additional GHG emissions, which offsets this benefit.
Moving towards the adoption of C farming schemes in viticulture, we estimated that it is feasible to save 25,124 kg CO
2-eq ha
−1, in total for the life cycle of the vineyard, after a 50% reduction in synthetic fertilizers and pesticide use, pruning incorporation, no-tillage applied in 50% of the vineyard area, using a maximum 150 L diesel per year and maintain 200 bush trees ha
−1 as vineyard margin vegetation (
Figure 5b). In this case, the C storage in the soil is maximized for our system, reaching 1812 kg CO
2-eq ha
−1 year
−1. These practices seem to be realistic and could be further evaluated for incorporation in eco-schemes proposed in the new EU Common Agricultural Policy (CAP).
Following the Net Ecosystems Carbon Budget approach for different management practices and various crop production systems could further support GHG emissions mitigation and improve the approach followed in our experimental work [
39,
40,
41].
Finally, a reduction in the inputs used for viticulture (e.g., diesel, fertilizers), investigated by this work, can result in economic savings for the producers (farmers, winemakers). However, it was beyond the scope of the current work to carry out a comparison of the economics of the three treatments.


 ,
, 


