Article

The Effect of the Application of Stimulants on the Photosynthetic Apparatus and the Yield of Winter Wheat

1
Department of Botany and Plant Physiology, Faculty of Agrobiology, Food and Natural Resources, Czech University of Life Sciences Prague, Kamycka 129, 16500 Prague, Czech Republic
2
Ditana Ltd., CSA 780, 783 53 Velka Bystrice, Czech Republic
3
Agrotest Fyto Ltd., Havlickova 2787-121, 767 01 Kromeriz, Czech Republic
4
Department of Languages, Faculty of Economics and Management, Czech University of Life Sciences Prague, Kamycka 129, 16500 Prague, Czech Republic
*
Author to whom correspondence should be addressed.
Agronomy 2022, 12(1), 78; https://doi.org/10.3390/agronomy12010078
Submission received: 18 November 2021 / Revised: 22 December 2021 / Accepted: 27 December 2021 / Published: 30 December 2021
(This article belongs to the Special Issue Alternative Cropping Systems for Climate Change)

Abstract

:
The use of stimulation preparations seems to be a promising means for mitigating the effects of abiotic and biotic stressors. Their significance includes plant organism stimulation and metabolism optimisation, water regime, and nutrition during periods of stress. They help bridge it over and create conditions for rapid regeneration. In a field experiment, the effect of the application of stimulation preparations on cultivars Triticum aestivum L. with different genetic composition was evaluated (donor of blue aleurone colour KM-72-18; donor of a multi-row spike (MRS) KM-94-18). Our results show a predominantly positive effect of the application of stimulants on the yield and thousand-grain weight (TKW). The results obtained were influenced by the year, based on different temperatures and precipitation. Higher yields were achieved in 2020 with higher total precipitation during the grain filling period and with a higher maximum quantum yield of the photosystem II (Fv/Fm). In 2019, this period was significantly dry and warm, which was reflected in a lower yield and TKM, higher proline content in the leaves, and lower Fv/Fm values. In both experimental years, there was a higher yield of the cultivar with blue aleurone (KM-72-18). In the case of cultivars with coloured grains, the promising use of the content substances in cultivars as natural means of increasing resistance to abiotic and biotic stressors seems to be promising.

1. Introduction

Field crops in general are constantly exposed to a lot of stressors during the growing season. These are usually divided into two categories—abiotic and biotic—depending on the nature of the trigger [1]. In field conditions, individual stressors do not act on plants separately, but always in combination, e.g., high temperature, higher intensity of sunlight, and water deficit [2]. Triticum aestivum L. is one of the most widespread crops. Global wheat production is expected to reach a new record of 780 million tonnes in 2021, according to a preliminary forecast issued on March 4 by the Food and Agriculture Organization of the United Nations [3]. According to some predicted reports, agriculture is considered the most endangered activity adversely affected by the climate change [4].
Abiotic stress factors cause morphological, physiological, and biochemical changes. Ultimately, they can affect the yield and product quality as well as change the visual appearance and/or nutritional value [5]. Generally, many stress factors act at the same time, such as water and high-light stresses [6].
Plant adaptation and reducing the effect of stress factors are essential for the increase of the agricultural system’s resilience, crop yields, and quality assurance. The environmental conditions cannot be controlled, and therefore several strategies such as agronomic techniques or the breeding of more tolerant cultivars are needed [7].
For years, research and practice have been dealing with ways to reduce the effects of stressors on field crops stands: from the breeding of tolerant cultivars and the introduction of new species, to the optimisation of agricultural techniques. One possible method from the set of all used measures is the application of stimulation preparations [5]. They usually have a different chemical composition, where the stimulation effect is a consequence of the synergistic action of different bioactive molecules. These are usually products obtained from various organisms or microorganisms, or even inorganic substances that are capable of improving plant growth, productivity, and alleviating the negative effects of stress [8,9,10]. Mineral elements, vitamins, amino acids, poly- and oligosaccharides, traces of natural plant hormones are among the most well-known components [11]. They can act directly on the physiology of the plant and modify some molecular processes, allowing improving the efficiency of water and nutrient utilisation in crops and stimulating plant development by increasing primary and secondary metabolism [10]. According to a report by Grand View Research, Inc. in March 2018, the size of the biostimulant market is expected to reach a turnover of USD 4.14 billion by 2025 [12].
Another way to eliminate the impact of abiotic stressors is the increasing of the yield potential of new cultivars. The spike storage capacity, which stimulates the inflow of assimilates into the grain in the period after anthesis, plays an important role in the formation of the yield [13]. Therefore, gene sources are sought to increase the number of reproductive organs [14], such as the number of spikelets in a spike, the number of grains in a spikelet, or the number of embryos in a flower [15,16]. A multi-row spike (MRS) was transferred to common wheat from a hexaploid radiomutant source obtained from VIR St. Petersburg. Multi-row spike is conditioned by the recessive gene mrs1, located on the short arm of the 2DS chromosome. It is manifested by an increased number of sessile spikelets growing from individual nodes of the spike and by an increase in the spike storage capacity [17].
The accumulation of secondary metabolites may also be important in the elimination of abiotic stressors. The study of the resistance of coloured grain genotypes to abiotic stressors seems very promising. Coloured wheat grains biosynthesise and accumulate anthocyanin [18]. Anthocyanins have osmoregulatory abilities, thus causing a protective role under conditions of extreme temperatures. Under the influence of drought and salinity, they can prevent the oxidation of lipids and, in this way, protect the plasma membrane from damage [19,20]. Comparative analysis of almost isogenic wheat lines, differing from each other by the content of anthocyanins in the coleoptile and pericarp, showed a higher drought tolerance in the line with a higher content of purple dye [21]. Under drought stress, the expression levels of TaCHS, TaCHI, TaF3H, TaDFR, and TaANS in wheat leaves were upregulated, the anthocyanin content was increased, and the plants had stronger drought resistance [20]. Coloured wheat genotypes with high anthocyanin content are capable of maintaining significantly higher dry matter production after salt stress treatment [22].
The field experiment aimed to evaluate the effect of the application of stimulation preparations on cultivars with different genetic architecture to cope with unfavourable climatic conditions. First, the use of the possibility of influencing the metabolism by content substances (anthocyanins). The experimental cultivars were a donor of blue colour aleurone and donor of the multi-row spike (MRS). The monitored parameters were yield and selected physiological characteristics.

2. Materials and Methods

2.1. Experimental Design

The field experiment took place in the period of 2018–2020 in Velký Týnec, Czech Republic (49°33.11838’ N, 17°20.25320’ E). The research was focused on monitoring the effect of the application of commercial stimulation preparations on selected physiological parameters and yield on the winter wheat. The application scheme and characteristics of the preparations are given in Table 1. The plant material was derived from cultivars in Kroměříž, the Czech Republic: (i) donor of the blue colour aleurone KM-72-18 (A), conditioned by the presence of the Ba2 gene on the long arm of the chromosome 4A [23], which causes a blue anthocyanin colouration of the grain; (ii) multirow spike (MRS) donor KM-94-18 (B), conditioned by the presence of the FRIZZY PANICLE 1 gene [24], capable of producing a larger number of spikelets from the spindle node [25] (Figure 1).
Sowing was carried out in both years in the first decade of October in 4 million seeds per hectare. During March and April, calcium ammonium nitrate (CAN) was applied in three doses (151.2 kg N ha−1 in total). During the experiment, classical agrotechnics was performed with the application of herbicides, insecticides, and morphoregulators according to current needs. The experimental plots were in blocks according to the Latin square, measuring 1.125 × 8.9 M, in triplicate. In the experimental stands, the physiological characteristics were evaluated in phenological phases 65 and 73 BBCH-scale. The phenological phase of the stand was classified according to Meier [26].

2.2. Photosynthetic Pigments and Free Proline Analyses

The pigment content in the leaves was measured photometrically with the Evolution 2000 UV–Vis (Thermo Fisher Scientific Inc., Waltham, MA, USA) by the Porra method [27] in ten replicates from each experimental plot and is given in mg m−2. The content of free proline was determined using the method of Bates et al. [28] with modifications. A sample of leaves (0.5 g) was homogenised in 10 mL of 3% sulfosalicylic acid using a mortar and pestle, and the homogenate was filtered through filter paper. Aliquots of 1 mL of the filtrate were mixed with 1 mL of acid ninhydrin solution and 1 mL of acetic acid and placed on a shaker for 20 min. The samples were then heated at 90 °C for 30 min, cooled in ice water, thoroughly mixed with 3 mL of toluene, and incubated for 20 min at room temperature. The samples were stored for 24 h at 4 °C. Next, the upper layer of the separation mixture was used for the measurement of absorbance at 520 nm (UV–Vis, Evolution 210, Thermo Scientific, Waltham, MA, USA). Five plants were used as independent samples for each treatment. The proline concentration was determined using a calibration curve for proline as µM g−1 FW (fresh weight) in five replicates from each experimental plot and is expressed in µmolg−1 of fresh biomass.

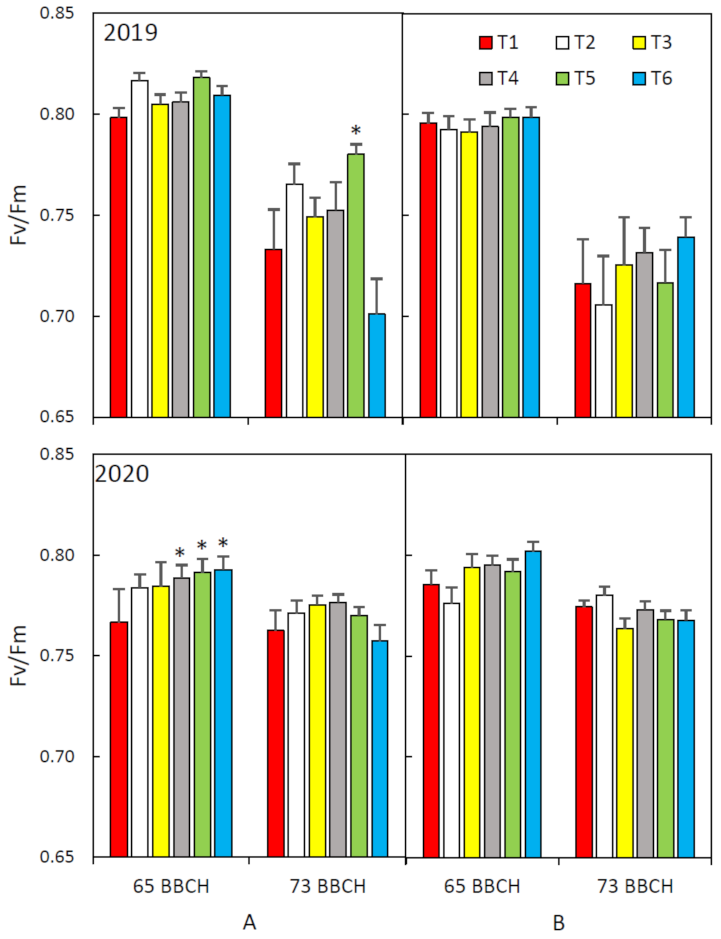
2.3. Chlorophyll Fluorescence

The minimum chlorophyll fluorescence (F0) and the maximum chlorophyll fluorescence (Fm) were also measured in situ, with the portable fluorometer OS5p+ (ADC BioScientific Ltd., Hoddesdon, Great Britain) with 1 s excitation pulse (660 nm) and a saturation intensity of 3000 μM m−2 s−1 after 20 min of darkness adaptation of the 4th or 5th fully expanded leaves. The maximum quantum yield of PSII was calculated using the formula: Fv/Fm = (Fm − F0)/Fm. These parameters were measured in five replicates of each experimental plot.

2.4. Analysis of the Yield Components

In each plot of the experimental treatments (T1–T6), the yield (t ha−1), and the thousand-grain weight (TKW) were evaluated.

2.5. Statistical Analysis

One-way ANOVA was used to evaluate the variables in treatments. After obtaining significant results (p < 0.05), multiple comparisons using Tukey’s test were applied to identify significant differences between treatments. All analyses were performed using STATISTICA 12 software (Statsoft, Tulsa, OK, USA).

3. Results and Discussion

3.1. Characteristics of the Experimental Period 2018–2020 and the State of the Stands

The characteristics of the weather during the vegetation period of 2018–2020 compared to the long-term Normal 1981–2010 (N30) are shown in Figure 2. The vegetation period from September 2018 to August 2019 was warmer by 2.2 °C in the experimental locality than the long-term Normal (N30 = 8.8 °C) with a total precipitation of 579 mm, which represents 113% of the long-term Normal (512 mm). However, the precipitation was not evenly distributed; October, November, April, and June were very dry. The autumn was warm and the winter mild. Winter wheat stands were well established and survived the winter well with no visible frost damage, no reduction of plants. The months of March and April were below normal in terms of precipitation and temperatures were up to 3 °C higher than the long-term Normal. It caused the early onset of spring, and the very rapid generative development of the winter wheat stands. May was above normal and colder than the long-term Normal (approximately 1.4 °C); June was warm and dry. July was dry and warm, which accelerated ripening.
The growing season from September 2019 to August 2020 was warmer by 2.1 °C than the long-term Normal, with a total precipitation of 600 mm, which represents 117% of the long-term Normal. The distribution of the precipitation was again not uniform—almost no precipitation fell in April. By contrast, February, May, and especially June had above-normal precipitation. Autumn was a very warm, humid, and mild winter, followed by an early onset of spring (February was warmer by 5.2 °C than the long-term Normal). An anhydrous April (3 mm of precipitation) significantly affected the condition of the stands. May and June saw above normal precipitation, which improved the condition of the stands. It significantly increased the risk of lodging of winter wheat stands and their subsequent lodging if it was not sufficiently regulated.
The uneven distribution of precipitation is considered to be an unfavourable vegetation factor, which even in years with normal or above-normal total precipitation can affect the amount of crop yield [29,30,31].

3.2. Photosynthetic Pigments

Photosynthesis is the primary process leading to production in the Biosphere [32], and its rate is affected by various factors including high temperature and CO2 concentration [33,34], drought [35], minerals [36,37], and many others [38]. The content of photosynthetic pigments is an important parameter influencing the rate of photosynthesis. It has been shown in many different scientific works that the content of photosynthetic pigments is reduced by the action of stress factors [39,40]. In the content of total chlorophylls (Chlt) significant differences were determined between experimental years, vegetation phases, and genotypes [41]. For carotenoids (Car), there was a significant difference between experimental years and vegetation phases (Table 2).
The higher content of Chlt and Car was determined in phase 65 BBCH. The reduction in photosynthetic pigments was determined in phase 73 BBCH, which may be caused by gradual leaf senescence [41] or stress factors. A decrease in the content of photosynthetic pigments results in a decrease in photosynthetic activity [42]. Of the monitored cultivars, KM-72-18 with a blue aleurone had the highest Chlt content, and there were no significant differences between the cultivars for Car.
Table 3 shows the contents of Chlt and Car according to single treatments and cultivars. In 2019, the positive effect of the application of stimulation preparations was manifested. The cultivar KM-72-18 in the developmental phase 65 BBCH showed a significant increase in Chlt content compared to the control (T1) in the treatments of T3 (112%) and T4 (106%). In phase 73 BBCH, a higher content of Chlt was evident in comparison with the control in T3 (122%), while a decrease in pigment content occurred in T6. There was no significant effect of carotenoid content in the application of stimulation preparations. In the cultivar KM-94-18 with a multi-row spike, the positive effect of the application of stimulants was manifested only in the developmental phase 73 BBCH. Compared to the control (T1), the Chlt content after the treatments T6 (158%), T4 (150%), T5 (134%), and T2 (117%) was significantly higher. In phase 73 BBCH, the content of carotenoids also showed a positive effect of the application of stimulants. Compared to the control (T1), carotenoids content after the treatments T6 (149%) was significantly higher. June of this year was warm and dry, heat stress during anthesis and grain filling were found to accelerate the degradation of the leaf chlorophyll content. It resulted in a decrease in both leaf photosynthetic activity and the final biomass [43]. The increase in the pigment content of KM-72-18 with blue aleurone may also be caused by the protective function of anthocyanins in plants under stress conditions [21]. In 2020, a positive effect of the application of stimulation preparations on the content of Chlt and Car during the monitored development phases of both cultivars was not shown.
The generally accepted parameter indicating the level of stress in plants is the maximum quantum yield of PSII (Fv/Fm). In plants under optimal conditions, the maximum quantum yield is ~0.8 [44]. The maximum quantum yield of PSII was significantly different between experimental years, vegetation phases, and cultures. The higher Fv/Fm value was in the 65 BBCH phases and from monitored cultivars, the cultivar KM-72-18 with blue aleurone had a higher Fv/Fm ratio. Significant differences in Fv/Fm were determined between the monitored variants of stimulants application (Table 2). Peripolli et al. [45] report an increase in Fv/Fm and the electron transport rate after biostimulator application.
In 2019, during the developmental phase 65 BBCH, the Fv/Fm ratio in both cultivars ranged from 0.791 to 0.817. It can be considered the optimal state [44], while there were no significant differences among applied preparations (Figure 3). These results can be related to the higher amount of precipitation in May, and that the measurement itself took place after the day of the precipitation. During the developmental phase of 73 BBCH, there was a decrease in Fv/Fm. In the KM-72-18 cultivar with blue aleurone, T5 treatment significantly increased the Fv/Fm ratio compared to the control. The decrease in Fv/Fm values suggests that some of the reaction centres of the PSII photosystem are damaged or inactivated. This phenomenon is commonly observed in stressed plants [40]. In addition to the current water and temperature stress in this period, the decrease in these values may also be related to the accelerated leaf senescence, because of which the Fv/Fm decreases [41,46,47]. It is known that many different species can speed up their post-anthesis development in conditions of terminal drought [48].
In 2020, during the developmental phases 65 and 73 BBCH, the Fv/Fm ratio for both cultivars ranged from 0.757 to 0.802. In the development phase 65 BBCH of the KM-72-18 cultivar with blue aleurone, T4–T6 treatments significantly increased the FV/Fm ratio compared to the control (T1). It is evident that with sufficient precipitation, when the month of June was significantly above normal precipitation, there was no significant decrease in the Fv/Fm ratio in the period of grain pouring. The stimulating effect of the applied preparations also was not manifested. According to Zivcak et al. [49], the Fv/Fm values are extremely stable, starting to decline at a dehydration level that is lethal for typical leaves. If drought stress persists under field conditions for a longer period of time (days), the decrease in the Fv/Fv values can be dramatic. The increase in sugar biosynthesis in biostimulant-treated plants has been found in several species, and it is associated with the increase in chlorophyll content, pure photosynthesis, and the quantum efficiency of the photosystem II [50,51].

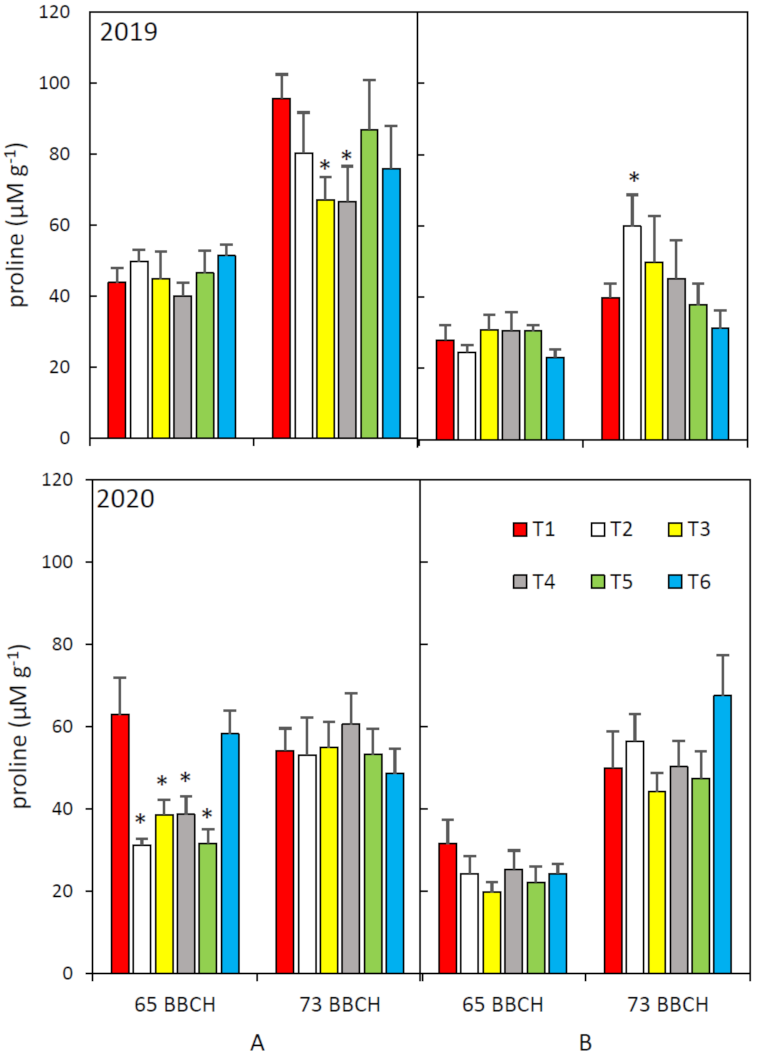
3.3. Proline Content

The amino acid proline is increasingly synthesised in plants under conditions of water deficit, low temperature, UV radiation, in the presence of heavy metals, etc. (see Kaur et al. [52]). After the stress subsides, the proline is broken down and can be used as an energy source for plant regeneration after stress [45].
There were significant differences in proline content between experimental years, vegetation phases, and cultivars (Table 2). The higher proline content was in phase 73 BBCH. Of the cultivars monitored, the proline content was higher in KM-72-18 with blue aleurone. Higher accumulation of proline has an important function in protection against complex stress factors [53]. Proline protects plants by contributing to osmotic adaptation inside cells, stabilising membranes and enzymes, and scavenging free radicals [54]. Furthermore, colour-grained genotypes are expected to be more resistant to abiotic strains due to their higher anthocyanin content [55,56,57]. Under salinity conditions, genotypes with a higher content of anthocyanins accumulated more proline [22]. Purple wheat cultivars have been shown to have stable yields and can withstand drought stress [58].
Figure 4 shows the proline contents according to individual treatments and cultivars in the monitored years. In 2019, in phase 65 BBCH, there were no significant differences in the proline content between individual treatments of the two cultivars. It can be reconciled with the sufficient precipitation in this period. The higher proline content was determined in phase 73 BBCH. In the cultivar KM-72-18 with blue aleurone, the values of proline were significantly lower in the T3 and T4 treatments. For KM-94-18, the proline content of T2 treatment significantly increased. In 2020, in phase 65 BBCH, the KM-72-18 cultivar with blue aleurone had a lower proline content compared to the control for T2 to T5 treatments. No differences in proline content were determined in phase 73 BBCH and cultivar KM-94-18. We suggest that the increase in proline content is due to the natural accumulation of this osmoprotectant under stress conditions with the precipitation deficit and high temperatures [54,59]. It should also be taken into account that the proline content is a cumulative result not only of the rate of biosynthesis and degradation, but also of transport between cells and organs [60,61].

3.4. Yield Parameters

Grain yield and quality is one of the main parameters monitored in field experiments. They are given, among other things, by the course of weather conditions, habitat conditions, agrotechnical measures, genotype selection, etc. (see Pačuta et al. [62]). Yield and thousand-grain weight (TKW) were influenced by the year, cultivar, and applied product (Table 2). Higher yields were achieved in both cultivars in 2020, though yields were higher in the KM-72-18 cultivar with blue aleurone. The application of stimulation preparations significantly increased the yield and was also affected by the TKW. According to Van Oosten et al. [63], the effects of biostimulants consist in an increase in yield and the resistance to biotic and abiotic stress. Other authors also report a positive effect of stimulant application [64]. Optimal precipitation conditions during the grain filling period can affect the yield level. In winter wheat, accelerated ripening occurs under dry conditions during the grain filling period, when the yield and grain quality are subsequently negatively affected [65].
The yield (Table 4) increased for all applications in 2019 compared to T1 (100%). The cultivar KM-72-18 with blue aleurone had the highest yield for T5 treatment (107.0%). This difference was statistically significant. For the KM-94-18 cultivar with a multi-row spike, the highest yield was for the T6 treatment (105.5%). In 2020, KM-72-18 with blue aleurone had the highest yield compared to the control for T4 treatment (102.9%). For T2 and T6 treatments, there was a decrease in the yield compared to the control. Differences with the control (T1) were not statistically significant, except for the T6 treatment. For KM-94-18 with a multi-row spike, the yield was significantly higher for all treatments except for T6, but also for this treatment, the yield was higher compared to the control (T1). The highest yield was for T2 and T3 treatments (108.9%) compared to the T1 control (100%). In 2019, the TKW significantly increased compared to the control in the cultivar KM-72-18 with blue aleurone in the treatment T2 to T5, and in KM-94-18 with a multi-row spike in T3 to T6. In 2020, treatments did not significantly increase TKW.
When comparing the yield between the monitored cultivars, a higher yield was achieved with the blue aleurone cultivar in both experimental years. Therefore, the potential for an increase in reproductive organs in the spike and thus an increase in the storage capacity of the spike in the cultivar KM-94-18 with a multi-row spike was not significantly manifested.
Changing climatic conditions, rising temperatures, and, above all, the uneven distribution of precipitation significantly affect the quantity and quality of agricultural products. The response of a plant to a stress factor depends on its developmental phase, genotype, and the size and duration of the stress [66]. The reduction of global yields of wheat by 6.0%, rice by 3.2%, maize by 7.4%, and soybean by 3.1% is supposed [29]. However, changes in yields are very variable and depend on the conditions of individual regions, technologies used, genotypes [67,68,69,70,71]. Climate change could reduce global crop yields by 3–12% by mid-century and by 11–25% by the century’s end, under a vigorous warming scenario [72].
Nowadays, implicating the application of stimulation and support preparations in agrotechnical technologies is up-to-date. As previously mentioned, their contribution to increasing the yield of field and garden crops is documented. The T2 to T6 preparations used include, among others, free amino acids (T2–T5), L-proline (T4), macro and micronutrients (T4–T6), and seaweed and plant extracts (T6). Amino acids, as basic building blocks of proteins, have a multitude of functions in the plant organism, such as anti-stress agents, growth stimulators, a precursor of auxin, a precursor and stimulation of chlorophyll synthesis, and many others [73]. For the increase in yield and improvement of winter wheat quality parameters after the application of amino acid-based preparations and their possible use, see in [74,75,76]. The effect of exogenous application of proline has been extensively studied, and its effects are described [52]. The individual effects of macro- and microelements on growth, development, and yield generation are generally known [77]. Seaweed extracts also have a positive effect on plant metabolism [78,79,80].
Due to the different compositions of individual preparations, it is necessary to take into consideration the variable effects on individual physiological and metabolic processes in the plant. This variability was manifested both at the level of individual parameters and between the monitored cultivars and experimental years. The high variability of the influence of factors on the monitored parameters is reported by Pačuta et al. [62]. They think that the degree of stability of applied preparations needs to be increased in the future. Gozzo and Faoro [81] even report that biostimulants show variable efficiency under real field conditions, in contrast to the promising and positive effects observed under controlled laboratory conditions. In addition, it is necessary to focus on increasing the influence of bioactive substances on the quality parameters of cultivated crops [62].
Some authors also deal with the issue of economic efficiency [64]. Calvo et al. [82] confirm that the application of biostimulants increases the productivity and quality of crops while responding to economic and sustainable requirements.

4. Conclusions

Utilising stimulant preparations can have a positive effect on the optimisation of metabolism and photosynthetic apparatus in a period of unfavourable precipitation and temperature. The composition of the products under study varies and it can be assumed that they will have different effects on the various subprocesses within the plant organism. The obtained results were influenced by the year and were based on different temperatures and precipitation. Higher yields were achieved in 2020 with higher total precipitation, especially during the grain filling period. It also seems possible that the stimulatory effect of the applied products may not be applied in periods of high rainfall. There was also no potential to increase the reproductive organs in the spike, and thus increase the storage capacity of the spike in a cultivar with a multi-row spike, which would be reflected in the yield. The use of content substances in cultivars as a natural means of increasing resistance to abiotic and biotic stressors seems to be promising. It follows that for the sustainability of agricultural production in the subsequent period, it is necessary to use all innovative technological procedures, optimal selection of genotypes, suitable mineral nutrition, and stand protection in correlation with economic efficiency.

Author Contributions

Conceptualisation, K.K., H.H., P.M. and A.B.; methodology, K.K., A.B., H.H. and P.M.; validation, H.H. and K.K.; formal analysis, H.H., K.K., J.P. and M.L.; writing—original draft preparation, H.H. and K.K.; writing—review and editing F.H., P.M. and L.K.; supervision, F.H.; project administration, F.H. All authors have read and agreed to the published version of the manuscript.

Funding

This research was funded by the Ministry of Agriculture of the Czech Republic, Project No. QK 1910343.

Data Availability Statement

Data sharing not applicable.

Conflicts of Interest

The authors declare no conflicts of interest. The funders had no role in the design of the study; in the collection, analyses, or interpretation of data; in the writing of the manuscript; or in the decision to publish the results.

References

  1. Verma, A.K.; Deepti, S. Abiotic Stress and Crop Improvement: Current Scenario. Adv. Plants Agric. Res. 2016, 4, 345–346. [Google Scholar] [CrossRef] [Green Version]
  2. Mittler, R. Abiotic Stress, the Field Environment and Stress Combination. Trends Plant Sci. 2006, 11, 15–19. [Google Scholar] [CrossRef]
  3. Schroeder, E. FAO Forecasts Record Wheat Production in 2021. Available online: https://www.world-grain.com/articles/14970-fao-forecasts-record-wheat-production-in-2021 (accessed on 24 August 2021).
  4. Raza, A.; Razzaq, A.; Mehmood, S.S.; Zou, X.; Zhang, X.; Lv, Y.; Xu, J. Impact of Climate Change on Crops Adaptation and Strategies to Tackle Its Outcome: A Review. Plants 2019, 8, 34. [Google Scholar] [CrossRef] [Green Version]
  5. Bulgari, R.; Franzoni, G.; Ferrante, A. Biostimulants Application in Horticultural Crops under Abiotic Stress Conditions. Agronomy 2019, 9, 306. [Google Scholar] [CrossRef] [Green Version]
  6. Xiong, L.; Schumaker, K.S.; Zhu, J.-K. Cell Signaling during Cold, Drought, and Salt Stress. Plant Cell 2002, 14 (Suppl. 1), 165–183. [Google Scholar] [CrossRef] [PubMed] [Green Version]
  7. Mariani, L.; Ferrante, A. Agronomic Management for Enhancing Plant Tolerance to Abiotic Stresses—Drought, Salinity, Hypoxia, and Lodging. Horticulturae 2017, 3, 52. [Google Scholar] [CrossRef] [Green Version]
  8. Du Jardin, P. Plant Biostimulants: Definition, Concept, Main Categories and Regulation. Sci. Hortic. 2015, 196, 3–14. [Google Scholar] [CrossRef] [Green Version]
  9. Rouphael, Y.; Colla, G. Synergistic Biostimulatory Action: Designing the Next Generation of Plant Biostimulants for Sustainable Agriculture. Front. Plant Sci. 2018, 9, 1655. [Google Scholar] [CrossRef] [PubMed] [Green Version]
  10. Shahrajabian, M.H.; Chaski, C.; Polyzos, N.; Petropoulos, S.A. Biostimulants Application: A Low Input Cropping Management Tool for Sustainable Farming of Vegetables. Biomolecules 2021, 11, 698. [Google Scholar] [CrossRef]
  11. Paul, K.; Sorrentino, M.; Lucini, L.; Rouphael, Y.; Cardarelli, M.; Bonini, P.; Reynaud, H.; Canaguier, R.; Trtílek, M.; Panzarová, K.; et al. Understanding the Biostimulant Action of Vegetal-Derived Protein Hydrolysates by High-Throughput Plant Phenotyping and Metabolomics: A Case Study on Tomato. Front. Plant Sci. 2019, 10, 47. [Google Scholar] [CrossRef]
  12. Biostimulants Market Size Worth $4.14 Billion by 2025|CAGR: 10.2%. Available online: Https://www. Grandviewresearch.Com/Press-Release/Global-Biostimulants-Market (accessed on 8 March 2019).
  13. Wang, Z.; Yin, Z.; He, M.; Cao, H. Source-Sink Manipulation Effects on Postanthesis Photosynthesis and Grain Setting on Spike in Winter Wheat. Photosynthetica 1998, 35, 453–459. [Google Scholar] [CrossRef]
  14. Miralles, D.; Slafer, G. Sink Limitations to Yield in Wheat: How Could It Be Reduced? J. Agric. Sci. 2007, 145. [Google Scholar]
  15. Sreenivasulu, N.; Schnurbusch, T. A Genetic Playground for Enhancing Grain Number in Cereals. Trends Plant Sci. 2012, 17, 91–101. [Google Scholar] [CrossRef] [PubMed]
  16. Reynolds, M.; Pellegrineschi, A.; Skovmand, B. Sink-limitation to Yield and Biomass: A Summary of Some Investigations in Spring Wheat. Ann. Appl. Biol. 2005, 146, 39–49. [Google Scholar] [CrossRef]
  17. Dobrovolskaya, O.; Martinek, P.; Voylokov, A.V.; Korzun, V.; Röder, M.S.; Börner, A. Microsatellite Mapping of Genes That Determine Supernumerary Spikelets in Wheat (T. Aestivum) and Rye (S. Cereale). Theor. Appl. Genet. 2009, 119, 867–874. [Google Scholar] [CrossRef]
  18. Jiang, W.; Liu, T.; Nan, W.; Jeewani, D.C.; Niu, Y.; Li, C.; Wang, Y.; Shi, X.; Wang, C.; Wang, J.; et al. Two Transcription Factors TaPpm1 and TaPpb1 Co-Regulate Anthocyanin Biosynthesis in Purple Pericarps of Wheat. J. Exp. Bot. 2018, 69, 2555–2567. [Google Scholar] [CrossRef] [PubMed] [Green Version]
  19. Hughes, N.M.; Carpenter, K.L.; Cannon, J.G. Estimating Contribution of Anthocyanin Pigments to Osmotic Adjustment during Winter Leaf Reddening. J. Plant Physiol. 2013, 170, 230–233. [Google Scholar] [CrossRef]
  20. Ma, D.; Sun, D.; Wang, C.; Li, Y.; Guo, T. Expression of Flavonoid Biosynthesis Genes and Accumulation of Flavonoid in Wheat Leaves in Response to Drought Stress. Plant Physiol. Biochem. 2014, 80, 60–66. [Google Scholar] [CrossRef]
  21. Shoeva (Tereshchenko), O.; Gordeeva, E.; Arbuzova, V.; Börner, A.; Khlestkina, E. The D Genome Carries a Gene Determining Purple Grain Colour in Wheat. Cereal Res. Commun. 2012, 40, 334–341. [Google Scholar] [CrossRef]
  22. Mbarki, S.; Sytar, O.; Zivcak, M.; Abdelly, C.; Cerda, A.; Brestic, M. Anthocyanins of Coloured Wheat Genotypes in Specific Response to SalStress. Molecules 2018, 23, 1518. [Google Scholar] [CrossRef] [Green Version]
  23. Burešová, V.; Kopecký, D.; Bartoš, J.; Martinek, P.; Watanabe, N.; Vyhnánek, T.; Doležel, J. Variation in Genome Composition of Blue-Aleurone Wheat. Theor. Appl. Genet. 2015, 128, 273–282. [Google Scholar] [CrossRef] [PubMed]
  24. Dobrovolskaya, O.; Pont, C.; Sibout, R.; Martinek, P.; Badaeva, E.; Murat, F.; Chosson, A.; Watanabe, N.; Prat, E.; Gautier, N.; et al. Frizzy Panicle Drives Supernumerary Spikelets in Bread Wheat. Plant Physiol. 2015, 167, 189–199. [Google Scholar] [CrossRef] [Green Version]
  25. Rizwan, M.; Mahboob, W.; Faheem, M.; Shimelis, H.; Hameed, A.; Sial, M.A.; Shokat, S. Can We Exploit Supernumerary Spikelet and Spike Branching Traits to Boost Bread Wheat (Triticum Aestivum L.) Yield? Appl. Ecol. Environ. Res. 2020, 18, 6243–6258. [Google Scholar] [CrossRef]
  26. Meier, U. Growth Stages of Mono- and Dicotyledonous Plants: BBCH Monograph; Julius Kühn-Institut: Quendlinburg, Germany, 2018; ISBN 978-3-95547-071-5. [Google Scholar]
  27. Porra, R.J.; Thompson, W.A.; Kriedemann, P.E. Determination of Accurate Extinction Coefficients and Simultaneous Equations for Assaying Chlorophylls a and b Extracted with Four Different Solvents: Verification of the Concentration of Chlorophyll Standards by Atomic Absorption Spectroscopy. Biochim. Biophys. Acta 1989, 975, 384–394. [Google Scholar] [CrossRef]
  28. Bates, L.S.; Waldren, R.P.; Teare, I.D. Rapid Determination of Free Proline for Water-Stress Studies. Plant Soil 1973, 39, 205–207. [Google Scholar] [CrossRef]
  29. Zhao, C.; Liu, B.; Piao, S.; Wang, X.; Lobell, D.B.; Huang, Y.; Huang, M.; Yao, Y.; Bassu, S.; Ciais, P.; et al. Temperature Increase Reduces Global Yields of Major Crops in Four Independent Estimates. Proc. Natl. Acad. Sci. USA 2017, 114, 9326–9331. [Google Scholar] [CrossRef] [Green Version]
  30. Kyei-Mensah, C.; Kyerematen, R.; Adu-Acheampong, S. Impact of Rainfall Variability on Crop Production within the Worobong Ecological Area of Fanteakwa District, Ghana. Adv. Agric. 2019, 2019, e7930127. [Google Scholar] [CrossRef] [Green Version]
  31. Li, Y.; Guan, K.; Schnitkey, G.D.; DeLucia, E.; Peng, B. Excessive Rainfall Leads to Maize Yield Loss of a Comparable Magnitude to Extreme Drought in the United States. Glob. Chang. Biol. 2019, 25, 2325–2337. [Google Scholar] [CrossRef] [PubMed] [Green Version]
  32. Baslam, M.; Mitsui, T.; Hodges, M.; Priesack, E.; Herritt, M.T.; Aranjuelo, I.; Sanz-Sáez, Á. Photosynthesis in a Changing Global Climate: Scaling Up and Scaling Down in Crops. Front. Plant Sci. 2020, 11, 882. [Google Scholar] [CrossRef]
  33. Dusenge, M.E.; Duarte, A.G.; Way, D.A. Plant Carbon Metabolism and Climate Change: Elevated CO2 and Temperature Impacts on Photosynthesis, Photorespiration and Respiration. New Phytol. 2019, 221, 32–49. [Google Scholar] [CrossRef] [Green Version]
  34. Moore, C.E.; Meacham-Hensold, K.; Lemonnier, P.; Slattery, R.A.; Benjamin, C.; Bernacchi, C.J.; Lawson, T.; Cavanagh, A.P. The Effect of Increasing Temperature on Crop Photosynthesis: From Enzymes to Ecosystems. J. Exp. Bot. 2021, 72, 2822–2844. [Google Scholar] [CrossRef]
  35. Pinheiro, C.; Chaves, M.M. Photosynthesis and Drought: Can We Make Metabolic Connections from Available Data? J. Exp. Bot. 2011, 62, 869–882. [Google Scholar] [CrossRef] [Green Version]
  36. Santos, E.F.; Zanchim, B.J.; Campos, A.G.; Garrone, R.F.; Lavres Junior, J. Photosynthesis Rate, Chlorophyll Content and Initial Development of Physic Nut without Micronutrient Fertilization. Rev. Bras. Ciênc. Solo 2013, 37, 1334–1342. [Google Scholar] [CrossRef] [Green Version]
  37. Glanz-Idan, N.; Wolf, S. Upregulation of Photosynthesis in Mineral Nutrition-Deficient Tomato Plants by Reduced Source-to-Sink Ratio. Plant Signal Behav. 2020, 15, 1712543. [Google Scholar] [CrossRef] [PubMed]
  38. Ashraf, M.; Harris, P.J.C. Photosynthesis under Stressful Environments: An Overview. Photosynthetica 2013, 51, 163–190. [Google Scholar] [CrossRef]
  39. Li, Y.; He, N.; Hou, J.; Xu, L.; Liu, C.; Zhang, J.; Wang, Q.; Zhang, X.; Wu, X. Factors Influencing Leaf Chlorophyll Content in Natural Forests at the Biome Scale. Front. Ecol. Evol. 2018, 6, 64. [Google Scholar] [CrossRef] [Green Version]
  40. Croft, H.; Chen, J.M.; Luo, X.; Bartlett, P.; Chen, B.; Staebler, R.M. Leaf Chlorophyll Content as a Proxy for Leaf Photosynthetic Capacity. Glob. Chang. Biol. 2017, 23, 3513–3524. [Google Scholar] [CrossRef]
  41. Del Pozo, A.; Méndez-Espinoza, A.M.; Romero-Bravo, S.; Garriga, M.; Estrada, F.; Alcaíno, M.; Camargo-Rodriguez, A.V.; Corke, F.M.K.; Doonan, J.H.; Lobos, G.A. Genotypic Variations in Leaf and Whole-Plant Water Use Efficiencies Are Closely Related in Bread Wheat Genotypes under Well-Watered and Water-Limited Conditions during Grain Filling. Sci. Rep. 2020, 10, 460. [Google Scholar] [CrossRef] [Green Version]
  42. Gregersen, P.L.; Holm, P.B. Transcriptome Analysis of Senescence in the Flag Leaf of Wheat (Triticum Aestivum L.). Plant Biotechnol. J. 2007, 5, 192–206. [Google Scholar] [CrossRef]
  43. Liu, B.; Asseng, S.; Wang, A.; Wang, S.; Tang, L.; Cao, W.; Zhu, Y.; Liu, L. Modelling the Effects of Post-Heading Heat Stress on Biomass Growth of Winter Wheat. Agric. Forest Meteorol. 2017, 247, 476–490. [Google Scholar] [CrossRef]
  44. Maxwell, K.; Johnson, G.N. Chlorophyll Fluorescence—A Practical Guide. J. Exp. Bot. 2000, 51, 659–668. [Google Scholar] [CrossRef] [PubMed]
  45. Peripolli, M.; Dornelles, S.H.B.; Lopes, S.J.; Tabaldi, L.A.; Trivisiol, V.S.; Rubert, J. Application of Biostimulants in Tomato Subjected to Water Deficit: Physiological, Enzymatic and Production Responses1. Rev. Bras. Eng. Agríc. Ambient. 2021, 25, 90–95. [Google Scholar] [CrossRef]
  46. Desotgiu, R.; Pollastrini, M.; Cascio, C.; Gerosa, G.; Marzuoli, R.; Bussotti, F. Chlorophyll a Fluorescence Analysis along a Vertical Gradient of the Crown in a Poplar (Oxford Clone) Subjected to Ozone and Water Stress. Tree Physiol. 2012, 32, 976–986. [Google Scholar] [CrossRef] [PubMed] [Green Version]
  47. Kotakis, C.; Kyzeridou, A.; Manetas, Y. Photosynthetic Electron Flow during Leaf Senescence: Evidence for a Preferential Maintenance of Photosystem I Activity and Increased Cyclic Electron Flow. Photosynthetica 2014, 52, 413–420. [Google Scholar] [CrossRef] [Green Version]
  48. Kottmann, L.; Wilde, P.; Schittenhelm, S. How Do Timing, Duration, and Intensity of Drought Stress Affect the Agronomic Performance of Winter Rye? Eur. J. Agron. 2016, 75, 25–32. [Google Scholar] [CrossRef]
  49. Zivcak, M.; Brestic, M.; Olsovska, K. Application of Photosynthetic Parameters in the Screening of Wheat (Triticum Aestivum L.) Genotypes for Improved Drought and High Temperature Tolerance. In Photosynthesis. Energy from the Sun; Allen, J.F., Gantt, E., Golbeck, J.H., Osmond, B., Eds.; Springer: Dordrecht, The Netherlands, 2008; pp. 1247–1250. ISBN 978-1-4020-6707-5. [Google Scholar]
  50. Ertani, A.; Nardi, S.; Altissimo, A. Review: Long-Term Research Activity on the Biostimulant Properties of Natural Origin Compounds. Acta Hortic. 2013, 181–187. [Google Scholar] [CrossRef]
  51. Amanda, A.; Ferrante, A.; Valagussa, M.; Piaggesi, A. Effect of Biostimulants on Quality of Baby Leaf Lettuce Grown under Plastic Tunnel. Acta Hortic. 2009, 407–412. [Google Scholar] [CrossRef]
  52. Kaur, G.; Asthir, B. Proline: A Key Player in Plant Abiotic Stress Tolerance. Biol. Plant. 2015, 59, 609–619. [Google Scholar] [CrossRef]
  53. Liang, X.; Zhang, L.; Natarajan, S.K.; Becker, D.F. Proline Mechanisms of Stress Survival. Antioxid. Redox Signal. 2013, 19, 998–1011. [Google Scholar] [CrossRef] [Green Version]
  54. Nahar, K.; Hasanuzzaman, M.; Fujita, M. Roles of Osmolytes in Plant Adaptation to Drought and Salinity. In Osmolytes and Plants Acclimation to Changing Environment: Emerging Omics Technologies; Springer: New Delhi, India, 2016; pp. 37–68. ISBN 978-81-322-2615-4. [Google Scholar]
  55. Gould, K.S.; Jay-Allemand, C.; Logan, B.A.; Baissac, Y.; Bidel, L.P.R. When Are Foliar Anthocyanins Useful to Plants? Re-Evaluation of the Photoprotection Hypothesis Using Arabidopsis Thaliana Mutants That Differ in Anthocyanin Accumulation. Environ. Exp. Bot. 2018, 154, 11–22. [Google Scholar] [CrossRef]
  56. Pietrini, F.; Iannelli, M.A.; Massacci, A. Anthocyanin Accumulation in the Illuminated Surface of Maize Leaves Enhances Protection from Photo-Inhibitory Risks at Low Temperature, without Further Limitation to Photosynthesis. Plant Cell Environ. 2002, 25, 1251–1259. [Google Scholar] [CrossRef]
  57. Steyn, W.J.; Wand, S.J.E.; Holcroft, D.M.; Jacobs, G. Anthocyanins in Vegetative Tissues: A Proposed Unified Function in Photoprotection. New Phytol. 2002, 155, 349–361. [Google Scholar] [CrossRef]
  58. Li, X.; Lü, X.; Wang, X.; Peng, Q.; Zhang, M.; Ren, M. Biotic and Abiotic Stress-Responsive Genes Are Stimulated to Resist Drought Stress in Purple Wheat. J. Integr. Agric. 2020, 19, 33–50. [Google Scholar] [CrossRef]
  59. Kishor, P.B.K.; Sreenivasulu, N. Is Proline Accumulation per Se Correlated with Stress Tolerance or is Proline Homeostasis a More Critical Issue? Plant Cell Environ. 2014, 37, 300–311. [Google Scholar] [CrossRef] [PubMed]
  60. Lehmann, S.; Funck, D.; Szabados, L.; Rentsch, D. Proline Metabolism and Transport in Plant Development. Amino Acids 2010, 39, 949–962. [Google Scholar] [CrossRef] [PubMed] [Green Version]
  61. Yao, X.; Nie, J.; Bai, R.; Sui, X. Amino Acid Transporters in Plants: Identification and Function. Plants 2020, 9, 972. [Google Scholar] [CrossRef]
  62. Pačuta, V.; Rašovský, M.; Michalska-Klimczak, B.; Wyszyňski, Z. Grain Yield and Quality Traits of Durum Wheat (Triticum Durum Desf.) Treated with Seaweed- and Humic Acid-Based Biostimulants. Agronomy 2021, 11, 1270. [Google Scholar] [CrossRef]
  63. Van Oosten, M.J.; Pepe, O.; De Pascale, S.; Silletti, S.; Maggio, A. The Role of Biostimulants and Bioeffectors as Alleviators of Abiotic Stress in Crop Plants. Chem. Biol. Technol. Agric. 2017, 4, 5. [Google Scholar] [CrossRef] [Green Version]
  64. Kocira, S.; Szparaga, A.; Hara, P.; Treder, K.; Findura, P.; Bartoš, P.; Filip, M. Biochemical and Economical Effect of Application Biostimulants Containing Seaweed Extracts and Amino Acids as an Element of Agroecological Management of Bean Cultivation. Sci. Rep. 2020, 10, 17759. [Google Scholar] [CrossRef]
  65. Balla, K.; Karsai, I.; Bónis, P.; Kiss, T.; Berki, Z.; Horváth, Á.; Mayer, M.; Bencze, S.; Veisz, O. Heat Stress Responses in a Large Set of Winter Wheat Cultivars (Triticum Aestivum L.) Depend on the Timing and Duration of Stress. PLoS ONE 2019, 14, e0222639. [Google Scholar] [CrossRef]
  66. Beltrano, J.; Ronco, M.G. Improved Tolerance of Wheat Plants (Triticum Aestivum L.) to Drought Stress and Rewatering by the Arbuscular Mycorrhizal Fungus Glomus Claroideum: Effect on Growth and Cell Membrane Stability. Braz. J. Plant Physiol. 2008, 20, 29–37. [Google Scholar] [CrossRef]
  67. Kukal, M.S.; Irmak, S. Climate-Driven Crop Yield and Yield Variability and Climate Change Impacts on the U.S. Great Plains Agricultural Production. Sci. Rep. 2018, 8, 3450. [Google Scholar] [CrossRef] [Green Version]
  68. Shew, A.M.; Tack, J.B.; Nalley, L.L.; Chaminuka, P. Yield Reduction under Climate Warming Varies among Wheat Cultivars in South Africa. Nat. Commun. 2020, 11, 4408. [Google Scholar] [CrossRef]
  69. Liliane, T.N.; Charles, M.S. Factors Affecting Yield of Crops; IntechOpen: London, UK, 2020; ISBN 978-1-83881-223-2. [Google Scholar]
  70. Ray, D.K.; West, P.C.; Clark, M.; Gerber, J.S.; Prishchepov, A.V.; Chatterjee, S. Climate Change Has Likely already Affected Global Food Production. PLoS ONE 2019, 14, e0217148. [Google Scholar] [CrossRef]
  71. He, W.; Yang, J.Y.; Qian, B.; Drury, C.F.; Hoogenboom, G.; He, P.; Lapen, D.; Zhou, W. Climate Change Impacts on Crop Yield, Soil Water Balance and Nitrate Leaching in the Semiarid and Humid Regions of Canada. PLoS ONE 2018, 13, e0207370. [Google Scholar] [CrossRef]
  72. Wing, I.S.; De Cian, E.; Mistry, M.N. Global Vulnerability of Crop Yields to Climate Change. J. Environ. Econ. Manag. 2021, 109, 102462. [Google Scholar] [CrossRef]
  73. Paleckiene, R.; Sviklas, A.; Šlinkšiene, R. Physicochemical Properties of a Microelement Fertilizer with Amino Acids. Russ. J. Appl. Chem. 2007, 80, 352–357. [Google Scholar] [CrossRef]
  74. Popko, M.; Michalak, I.; Wilk, R.; Gramza, M.; Chojnacka, K.; Górecki, H. Effect of the New Plant Growth Biostimulants Based on Amino Acids on Yield and Grain Quality of Winter Wheat. Molecules 2018, 23, 470. [Google Scholar] [CrossRef] [Green Version]
  75. Schmidt, C.; Mrnka, L.; Frantík, T.; Bárnet, M.; Vosátka, M.; Švecová, E. Impact of Protein Hydrolysate Biostimulants on Growth of Barley and Wheat and Their Interaction with Symbionts and Pathogens. Agric. Food Sci. 2020, 29. [Google Scholar] [CrossRef]
  76. Colla, G.; Hoagland, L.; Ruzzi, M.; Cardarelli, M.; Bonini, P.; Canaguier, R.; Rouphael, Y. Biostimulant Action of Protein Hydrolysates: Unraveling Their Effects on Plant Physiology and Microbiome. Front. Plant Sci. 2017, 8, 2202. [Google Scholar] [CrossRef] [PubMed] [Green Version]
  77. Pandey, P.; Irulappan, V.; Bagavathiannan, M.V.; Senthil-Kumar, M. Impact of Combined Abiotic and Biotic Stresses on Plant Growth and Avenues for Crop Improvement by Exploiting Physio-Morphological Traits. Front. Plant Sci. 2017, 8, 537. [Google Scholar] [CrossRef] [PubMed] [Green Version]
  78. Sharma, H.S.S.; Fleming, C.; Selby, C.; Rao, J.R.; Martin, T. Plant Biostimulants: A Review on the Processing of Macroalgae and Use of Extracts for Crop Management to Reduce Abiotic and Biotic Stresses. J. Appl. Phycol. 2014, 26, 465–490. [Google Scholar] [CrossRef]
  79. Tarakhovskaya, E.R.; Maslov, Y.I.; Shishova, M.F. Phytohormones in Algae. Russ. J. Plant Physiol. 2007, 54, 163–170. [Google Scholar] [CrossRef]
  80. Kumar, R.; Trivedi, K.; Anand, K.G.V.; Ghosh, A. Science behind Biostimulant Action of Seaweed Extract on Growth and Crop Yield: Insights into Transcriptional Changes in Roots of Maize Treated with Kappaphycus Alvarezii Seaweed Extract under Soil Moisture Stressed Conditions. J. Appl. Phycol. 2020, 32, 599–613. [Google Scholar] [CrossRef]
  81. Gozzo, F.; Faoro, F. Systemic Acquired Resistance (50 Years after Discovery): Moving from the Lab to the Field. J. Agric. Food Chem. 2013, 61, 12473–12491. [Google Scholar] [CrossRef]
  82. Calvo, P.; Nelson, L.; Kloepper, J.W. Agricultural Uses of Plant Biostimulants. Plant Soil 2014, 383, 3–41. [Google Scholar] [CrossRef] [Green Version]
Figure 1. (A) Cultivar KM-72-18 (donor of the blue colour aleurone); (B) cultivar KM-94-18 (multirow spike donor).
Agronomy 12 00078 g001
Figure 2. Monthly and long-term air temperature (°C) and precipitation (mm) at the experimental site Velký Týnec in the Czech Republic during the experimental period of 2018–2020. The long-term average is from the period of 1981–2010.
Agronomy 12 00078 g002
Figure 3. The maximum quantum yield of PS II (Fv/Fm) in the cultivar with blue aleurone KM-72-18 (A) and a multi-row spike KM-94-18 (B) in the development phases 65 and 73 BBCH at single treatments of the stand (T1–T6). Means ± SE; n = 5; LSD post hoc test. For each period and cultivars, the columns with the symbol * are significantly different at p < 0.05 compared to the control treatment (T1).
Agronomy 12 00078 g003
Figure 4. Proline content in the cultivar with blue aleurone KM-72-18 (A) and a multi-row spike KM-94-18 (B) in the development phases 65 and 73 BBCH at single treatments of the stand (T1–T6). Means ± SE; n = 5; LSD post hoc test. For each period and cultivars, the columns with the symbol * are significantly different at p < 0.05 compared to the control treatment (T1).
Agronomy 12 00078 g004
Table 1. Scheme of monitored preparations application and their brief characteristics. For the applied stimulation preparation (T2–T6), the applied dose (L ha−1) for the experimental stands and the period of the application according to the phenological phase (BBCH) of the experimental stand is given.
TreatmentsApplied Dose of Monitored Stimulants (L ha−1) and the Phenological Phase of the Stand (BBCH)Preparation Characteristics
BBCH 30BBCH 37BBCH 49–51BBCH 63
T1-----
T2Cleanstorm (0.1)Cleanstorm (0.1)Cleanstorm (0.1)Cleanstorm (0.1)Free amino acids
12%, combustible substances in dry matter 50%
T3Energen 3D Plus (0.1)Energen 3D Plus (0.1)Energen 3D Plus (0.2)Energen 3D Plus (0.3)Free amino acids 13%, combustible substances in dry matter 50%
T4Atlante-Cu-Prolina (0.6)---K2O 20%, P2O5 30%, Cu 0.5%, free amino acids (L-proline) 2%
T5Aminocat 30 (0.2)-Aminocat 30 (0.2)-Free amino acids 30%, total N 3%, P2O5 1%, K2O 1%
T6Fertileader 2M (2.0)---Seactive complex *, MgO 2%, Mn 11.7%
* Seactive complex (seaweed extract, plant extracts).
Table 2. Total chlorophylls (Chlt), carotenoids (Car), the maximum quantum yield of PS II (Fv/Fm), proline content, yield, and thousand-grain weight (TKW). The values given are means ± SE for 2019 and 2020, phenological phases 65 and 73 BBCH, cultivars KM-72-18 (A) and KM-94-18 (B) and individual stand treatments (T1–T6). LSD post hoc test. Different letters differ significantly at p < 0.05.
Chlt (mg m−2)Car (mg m−2)Fv/FmProline (µM g−1)Yield (t ha−1)TKW (g)
2019275.1 ± 4.7 a45.0 ± 0.7 a0.768 ± 0.003 b49.2 ± 2.0 a8.65 ± 0.14 b43.49 ± 0.86 b
2020254.2 ± 3.9 b42.7 ± 0.7 b0.778 ± 0.002 a43.7 ± 1.5 b9.37 ± 0.08 a46.49 ± 0.53 a
65 BBCH326.7 ± 2.9 a53.5 ± 0.4 a0.793 ± 0.002 a35.5 ± 1.2 b--
73 BBCH182.9 ± 3.9 b31.0 ± 0.6 b0.751 ± 0.003 b57.6 ± 1.9 a--
A272.6 ± 5.2 a43.8 ± 0.8 a0.776 ± 0.003 a55.6 ± 1.8 a9.42 ± 0.07 a48.94 ± 0.23 a
B262.1 ± 4.1 b44.5 ± 0.7 a0.769 ± 0.003 b37.3 ± 1.5 b8.60 ± 0.14 b41.05 ± 0.45 b
T1267.9 ± 8.8 a45.0 ± 1.4 a0.764 ± 0.006 b50.7 ± 3.2 a8.71 ± 0.22 c44.23 ± 1.34 b
T2263.4 ± 7.2 a43.1 ± 1.2 a0.774 ± 0.005 ab47.3 ± 3.1 a9.07 ± 0.23 ab45.11 ± 1.39 a
T3268.2 ± 8.7 a44.0 ± 1.3 a0.773 ± 0.004 ab43.7 ± 2.8 a9.15 ± 0.25 ab45.52 ± 1.48 a
T4275.3 ± 7.5 a45.7 ± 1.1 a0.775 ± 0.004 a44.7 ± 2.8 a9.14 ± 0.23 ab45.38 ± 1.26 a
T5264.7 ± 8.0 a43.9 ± 1.3 a0.779 ± 0.004 a44.5 ± 3.2 a9.18 ± 0.23 a44.70 ± 1.28 ab
T6263.5 ± 7.9 a43.2 ± 1.2 a0.771 ± 0.004 ab47.6 ± 3.1 a8.82 ± 0.16 bc45.03 ± 1.27 ab
Table 3. Total chlorophylls (Chlt) and carotenoids (Car) in the cultivar with blue aleurone KM-72-18 (A) and multi-rowed spike KM-94-18 (B) in the developmental phases 65 and 73 BBCH in single vegetation treatments (T1–T6). Means ± SE; n = 10; LSD post hoc test. Different letters differ significantly at p < 0.05.
20192020
Chlt (mg m−2)Car (mg m−2)Chlt (mg m−2)Car (mg m−2)
65 BBCH73BBCH65 BBCH73BBCH65 BBCH73BBCH65 BBCH73BBCH
AT1333.1 ± 15.9 b156.7 ± 13.4 b51.4 ± 2.4 ab31.7 ± 2.9 a363.0 ± 15.7 a206.2 ± 5.9 a63.9 ± 2.4 a32.8 ± 0.7 a
T2350.6 ± 10.5 ab181.4 ± 23.0 ab54.5 ± 1.5 a30.3 ± 3.9 a341.4 ± 13.6 a184.9 ± 7.6 a59.9 ± 2.1 ab28.9 ± 1.4 a
T3374.0 ± 13.2 a191.0 ± 28.2 a56.2 ± 1.8 a34.5 ± 4.5 a335.6 ± 15.3 ab193.3 ± 12.1 a59.4 ± 2.0 ab29.5 ± 2.1 a
T4353.7 ± 9.9 a128.2 ± 21.6 bc53.1 ± 1.4 ab25.1 ± 3.4 b309.2 ± 12.8 b208.5 ± 5.6 a54.9 ± 1.6 b32.9 ± 0.8 a
T5325.9 ± 14.2 b164.0 ± 22.6 ab49.2 ± 2.0 b28.4 ± 4.1 ab342.5 ± 15.6 a210.8 ± 6.8 a60.7 ± 2.4 ab33.2 ± 0.9 a
T6338.4 ± 13.8 ab111.7 ± 12.4 c51.1 ± 1.8 ab20.4 ± 2.4 b320.6 ± 12.5 b203.0 ± 8.1 a54.8 ± 3.3 b31.3 ± 1.4 a
BT1332.7 ± 12.0 a137.6 ± 21.0 c55.4 ± 1.6 a26.8 ± 3.6 bc310.6 ± 8.2 a200.8 ± 6.3 a54.8 ± 1.7 a31.4 ± 1.0 a
T2282.4 ± 8.8 b160.9 ± 19.6 b44.5 ± 1.7 c29.1 ± 3.5 bc305.4 ± 8.3 a204.8 ± 2.9 a53.7 ± 1.3 a31.7 ± 0.5 a
T3306.8 ± 12.4 ab140.5 ± 16.1 c51.8 ± 1.9 ab24.5 ± 2.7 c284.5 ± 6.1 b203.1 ± 3.9 a51.6 ± 1.2 ab31.0 ± 0.6 a
T4330.7 ± 8.6 a206.8 ± 19.4 a55.6 ± 1.2 a37.3 ± 2.8 ab326.5 ± 7.1 a198.7 ± 4.2 ab56.9 ± 1.3 a30.6 ± 0.6 a
T5325.2 ± 12.6 a184.0 ± 23.4 ab55.9 ± 2.1 a34.7 ± 3.1 ab285.8 ± 14.5 b190.2 ± 4.9 ab48.9 ± 1.8 b30.3 ± 0.8 a
T6307.8 ± 17.2 ab217.3 ± 15.8 a50.2 ± 2.5 b39.8 ± 2.6 a310.2 ± 10.8 a183.9 ± 4.4 b54.6 ± 1.9 a29.2 ± 0.7 a
A346.0 ± 5.4 a155.5 ± 8.8 a52.6 ± 0.7 a28.4 ± 1.5 b335.4 ± 6.0 a201.1 ± 3.3 a58.9 ± 1.0 a31.4 ± 0.6 a
B314.2 ± 5.1 b174.6 ± 8.4 a52.2 ± 0.8 a32.1 ± 1.3 a307.2 ± 4.1 b200.2 ± 4.3 a54.0 ± 0.7 b32.0 ± 0.7 a
Table 4. Yield and thousand-grain weight (TKW) in cultivar with blue aleurone KM-72-18 (A) and a multi-row spike KM-94-18 (B) in 2019 and 2020 for single treatments of the stand (T1–T6). Means ± SE; n = 3; LSD post hoc test. Different letters are significantly different at p < 0.05.
TreatmentsYield (t ha−1)TKW (g)
2019202020192020
AT19.01 ± 0.19 b9.51 ± 0.15 a47.33 ± 0.38 c48.87 ± 0.41 ab
T29.31 ± 0.27 ab9.41 ± 0.43 a49.00 ± 0.15 ab49.27 ± 1.23 ab
T39.41 ± 0.13 ab9.69 ± 0.24 a49.67 ± 0.24 a50.46 ± 1.09 a
T49.37 ± 0.09 ab9.79 ± 0.05 a48.76 ± 0.43 ab49.63 ± 0.23 ab
T59.64 ± 0.11 a9.67 ± 0.18 a48.53 ± 0.19 b48.00 ± 1.45 b
T69.45 ± 0.09 ab8.83 ± 0.09 b47.67 ± 0.49 bc49.63 ± 0.78 ab
BT17.67 ± 0.25 a8.65 ± 0.27 b37.50 ± 0.40 c43.20 ± 0.42 a
T28.02 ± 0.34 a9.56 ± 0.15 a38.20 ± 0.06 bc43.97 ± 0.55 a
T37.91 ± 0.42 a9.58 ± 0.12 a38.63 ± 0.30 ab43.30 ± 0.35 a
T47.98 ± 0.26 a9.42 ± 0.20 a39.3 ± 0.35 a43.90 ± 0.31 a
T57.95 ± 0.37 a9.42 ± 0.03 a38.57 ± 0.23 ab43.71 ± 0.44 a
T68.09 ± 0.32 a8.89 ± 0.04 b38.73 ± 0.30 ab44.32 ± 0.33 a
Publisher’s Note: MDPI stays neutral with regard to jurisdictional claims in published maps and institutional affiliations.

