Article

Improvement of Soil Health and System Productivity through Crop Diversification and Residue Incorporation under Jute-Based Different Cropping Systems

1
ICAR-Central Research Institute for Jute and Allied Fibres (ICAR-CRIJAF), Barrackpore, Kolkata 700120, West Bengal, India
2
Department of Agronomy, Dr. Rajendra Prasad Agricultural University (RPCAU), Pusa, Samastipur 848125, Bihar, India
3
ICAR-Indian Institute of Sugarcane Research (ICAR-IISR), Lucknow 226002, Uttar Pradesh, India
4
Department of Biology, College of Science, Taif University, P.O. Box 11099, Taif 21944, Saudi Arabia
5
Department of Clinical Laboratories Sciences, The Faculty of Applied Medical Sciences, Taif University, P.O. Box 11099, Taif 21944, Saudi Arabia
6
Department of Agronomy, Bangladesh Wheat and Maize Research Institute, Dinajpur 5200, Bangladesh
*
Authors to whom correspondence should be addressed.
Agronomy 2021, 11(8), 1622; https://doi.org/10.3390/agronomy11081622
Submission received: 13 July 2021 / Revised: 12 August 2021 / Accepted: 12 August 2021 / Published: 16 August 2021
(This article belongs to the Special Issue Cropping Systems and Agronomic Management Practices of Field Crops)

Abstract

:
Crop diversity through residue incorporation is the most important method for sustaining soil health. A field study was conducted over five consecutive years (2012–2017) to see the impact of residue incorporartions in Inceptisol of eastern India. The main plot treatments had five cropping systems (CS), namely, fallow−rice−rice (FRR), jute−rice−wheat (JRW), jute−rice−baby corn (JRBc), jute−rice−vegetable pea (JRGp), jute−rice−mustard−mungbean/green gram (JRMMu), which cinsisted of four sub-plots with varied nutrient and crop residue management (NCRM) levels, namely crops with no residue +75% of the recommended dose of fertilizers (RDF) (F1R0), crops with the residue of the previous crops +75% RDF (F1R1), crops with no resiude +100% RDF (F2R0), and crops with residue +100% RDF (F2R1). The highest system productivity was obtained for JRBc (15.3 Mg·ha−1), followed by JRGp (8.81 Mg·ha−1) and JRMMu (7.61 Mg·ha−1); however, the highest sustainability index was found with the JRGp cropping system (0.88), followed by JRMMu (0.82). Among the NCRMs, the highest productivity (8.78 Mg·ha−1) and sustainability index (0.83) were recorded in F2R1. Five soil parameters, namely, bulk density, available K, urease activity, dehydrogenase activity, and soil microbial biomass carbon (SMBC), were used in the minimum data-set (MDS) for the calculation of the soil quality index (SQI). The best attainment of SQI was found in the JRGp system (0.63), closely followed by the JRMMu (0.61) cropping system.

1. Introduction

The eastern part of the Indo-Gangetic Plain (IGP) is often considered as the supreme agro-ecological zone of the globe [1]. Cropping systems using rice as a base crop, like the double cropping systems of rice−rice and rice−potato, and intensive triple cropping systems like jute−rice−rice and jute−rice-mustard, have been practiced for a long in this region [2,3]. Crop intensification is needed in order to produce more food per unit area per unit time, so as to assure food security for the burgeoning Indian population, expected to exceed 1.60 billion people in 2050 [4]. Nevertheless, crop intensification poses a major threat regarding sustainability issues for the rice-based system in this region. Excess nutrient removal through crops being harvested in an area year after year have altered the soil fertility status [5]. Moreover, intensive and poor-planned inorganic nutrition in intensive cropping-system has led to nutrient imbalance in the soil, and thus a decline in soil fertility, which is of great concern for production sustainability and soil health in this region [2]. Henceforth, the current need is to sustain soil fertility with some alternative, but easy methods, like returning the crop residue back to the soil through suitable crop diversification, as well as using some promising crops that are believed to boost soil health. Establishing an efficient cropping sequence with the best possible crop management can ensure soil fertility as well as profitability [6,7,8,9].
Diversified cropping systems are one of the key options that can benefit to the soil by supplying organic matter, although the amount and quality vary with the type of crops grown in a field. Crop diversification includes crops that return plenty of organic matter (through the roots, root exudates, leaves, and stems) into the soil, as well as being re able to sustain or enhance economic yields and reduce nutrient loss through runoff and leaching. Legume crop inclusion in crop rotation, either through conventional cropping systems or conservation tillage systems, can return the crop residue to the soil and augment the soil organic carbon (SOC), making the overall system sustainable [10]. All positive attributes of soil are increased with residue return. Soil loss, through erosion, soil-nutrient leaching loss, etc., is also reduced through residue retention in the soil [11,12,13,14]. All of these factors influence soil quality. Many earlier findings [15,16,17] have demonstrated that crop-residue incorporation under conservation-tillage practice improves soil attributes such as SOC; available N, P, and K; soil aggregates; water-holding capacity (WHC); soil aeration; soil enzymes, as assessing the soil quality and its trend of change by different crop management practices is key for making agricultural practices more sustainable. According to Karlen et al. [18] soil quality is “the capacity of a specific kind of soil to function within natural or managed ecosystem boundaries, to sustain plant and animal productivity, maintain or enhance water and air quality, and support human health and habitation”. As soil is a complex phenomenon, soil quality cannot be measured directly. However, soil quality indicators that are sensitive to change in land use management and conservation practices are measurable attributes. These attributes also influence the ability of soil regarding sustainable crop production. Thus, it is necessary to develop minimum data-sets of varied soil quality indicators under different determining parameters, such as fields [19], landscapes, and regions [20,21,22]. The jute-based cropping system for the jute growing region of India is mainly a jute−rice−wheat cropping system [3]. This system needs to be diversified by including legumes or oilseeds or high-value crops like baby corn in order to maintain soil health and economic return. In this study, we diversified the jute−rice−wheat system by replacing winter crop wheat with mustard, vegetable pea, or baby corn.
The soil quality index (SQI) was developed by Andrews et al. [23] to quantify the physical, chemical, and biological properties. This soil quality index (SQI) is based on a combination of soil properties to provide a better indication of soil quality than through individual parameters. SQI is a tool for evaluating the sustainability of different soil and crop management practices [21,24,25]. Higher values of SQI indicate a better soil quality, which means the soil will perform better and produce a higher yield in a more sustainable manner than those with a lower SQI. Hence, research on determining soil quality as affected by the various cropping systems and crop management has significance in the global scientific community [22]. Plenty of research has been carried out regarding the long-term nutrition and tillage that influence soil quality [25,26,27,28], but little information [21,29,30] is available about the SQI of diverse cropping systems and the integration of different types of crop residues with nutrients.
To bridge the wide research gap, the present investigation was executed with the following objectives: (i) to evaluate the system productivity of diverse cropping systems with crop residue and nutrient management and (ii) to estimate the soil quality index of different cropping systems with various nutrient and crop residue management practices in Inceptisols, in the eastern part of the Indo-Gangetic plain.

2. Materials and Methods

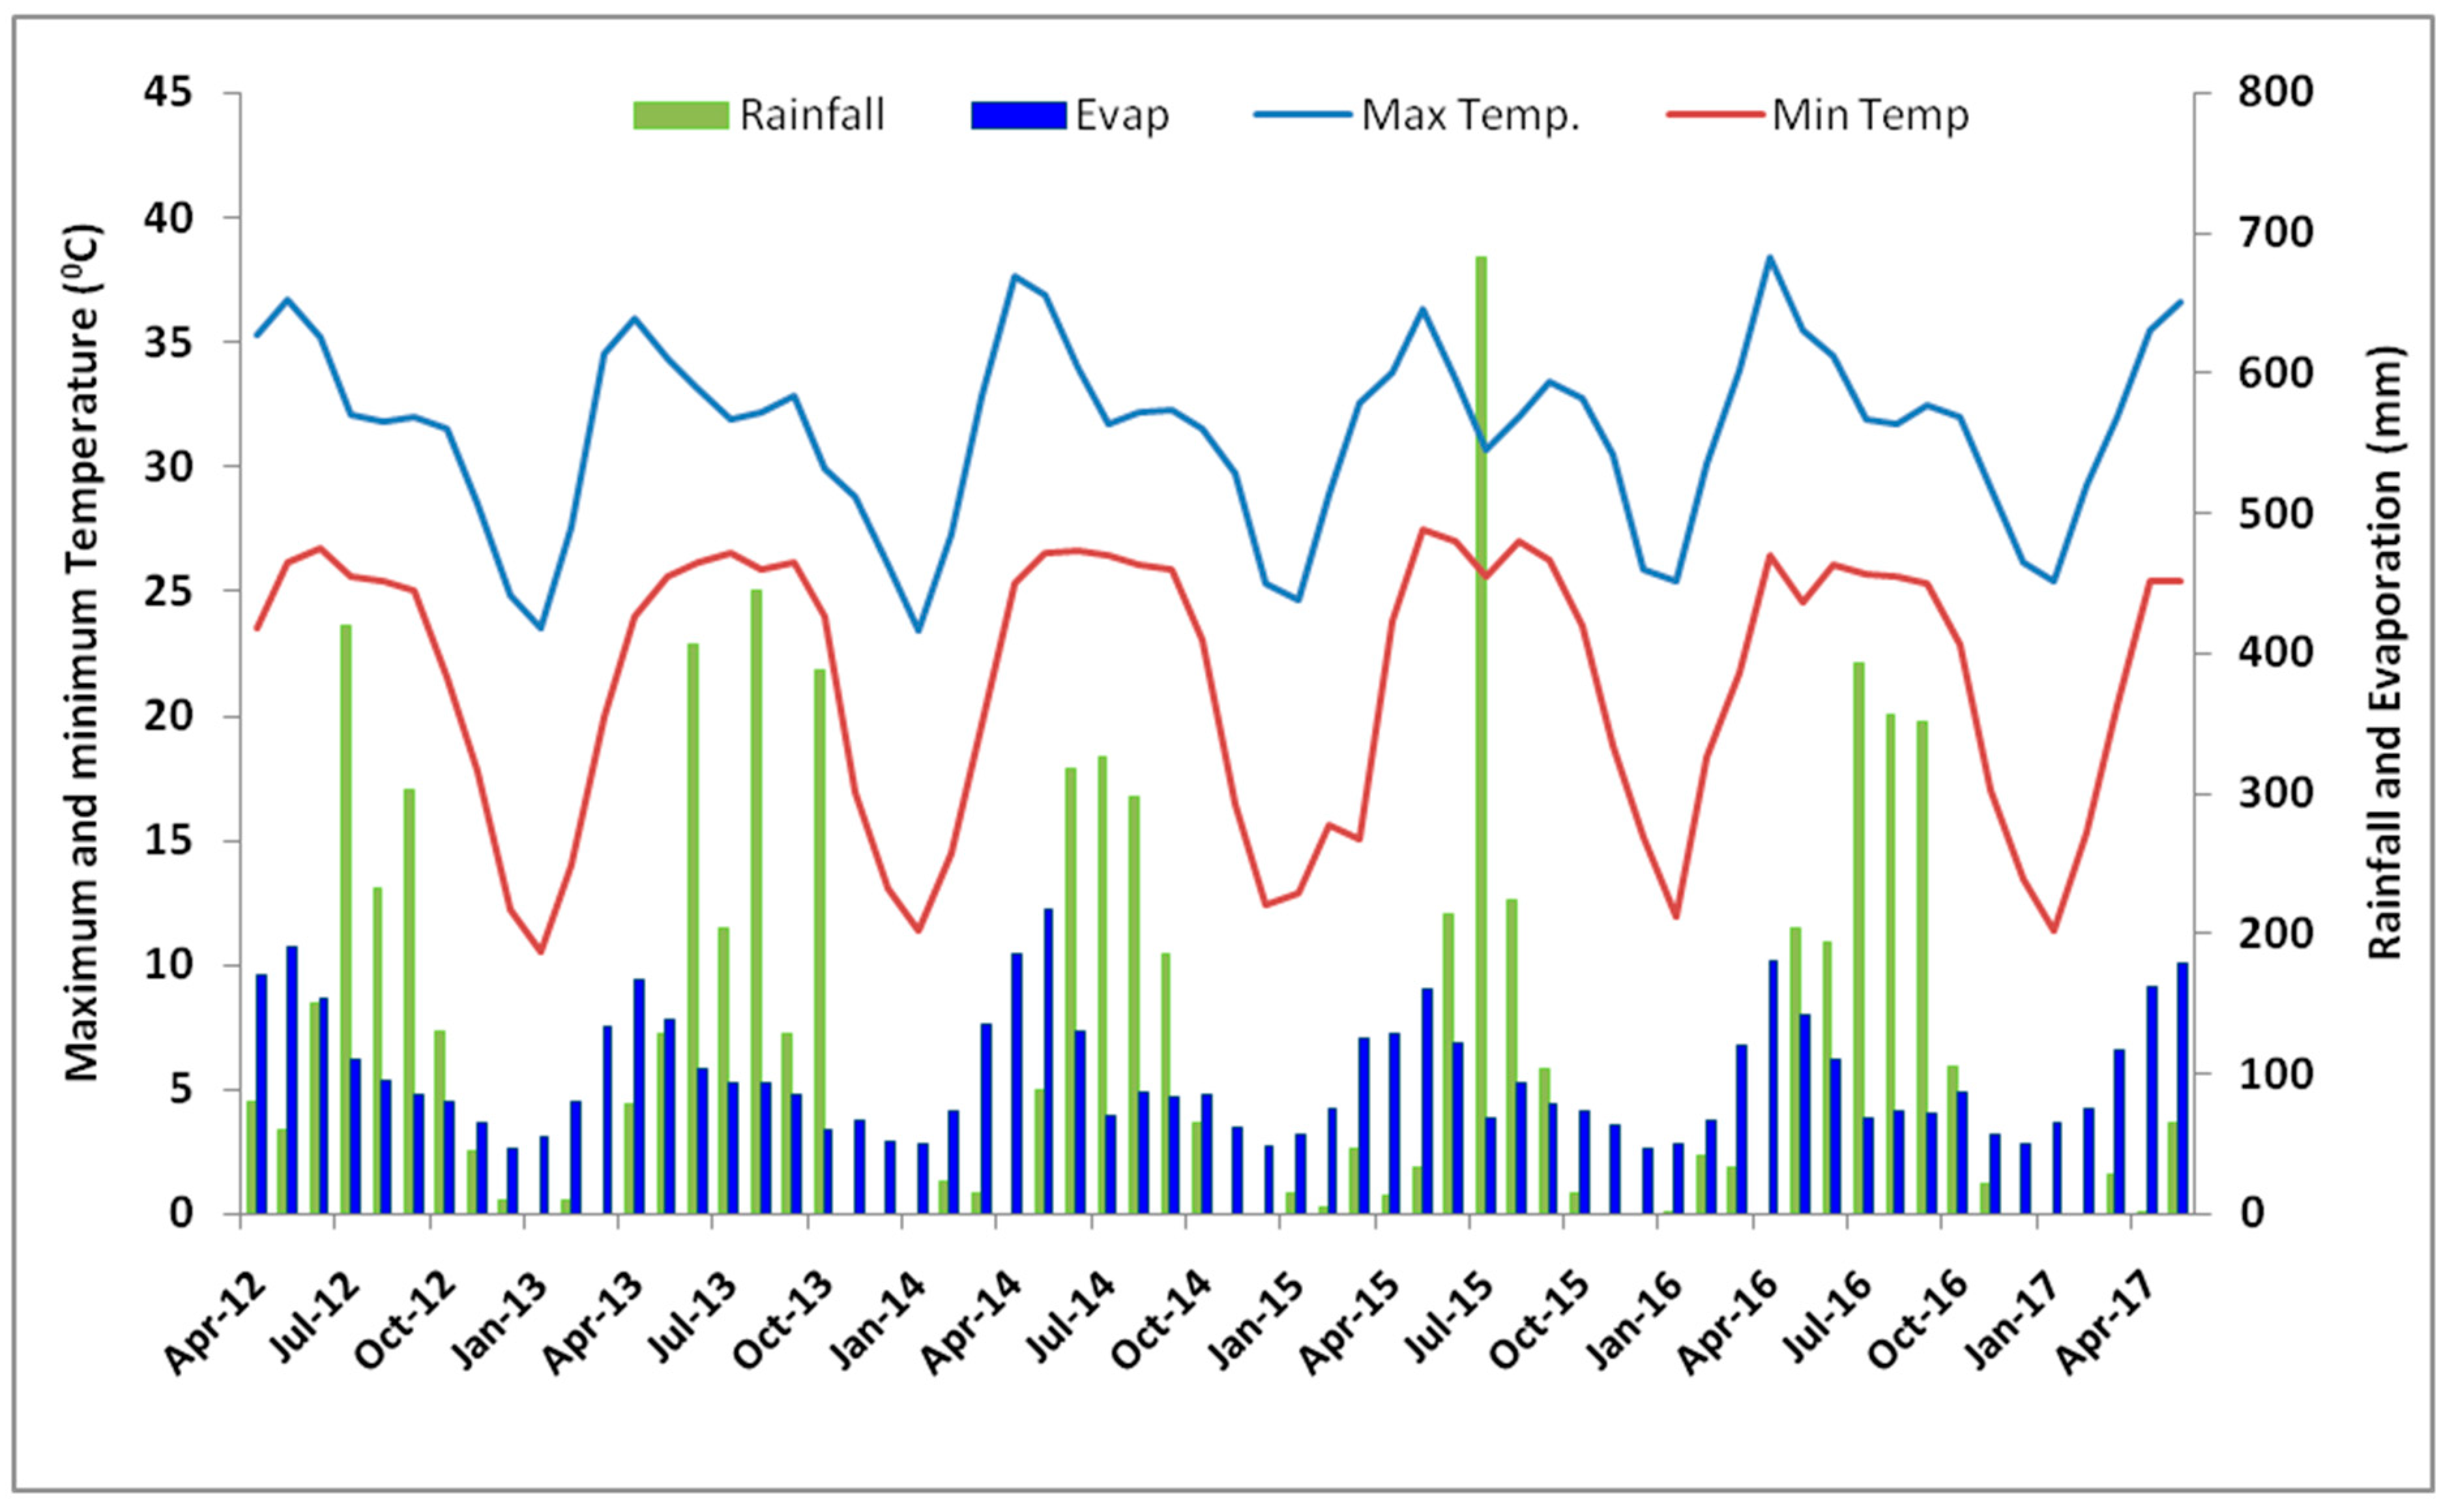
2.1. Experimental Site

The research work was performed at ICAR-CRIJAF, Barrackpore, India (22°45′ N, 88°26′ E, 9.0 MSL) during 2012–2017 in Inceptisols, where the order of soil falls under the new alluvial zone (NAZ). The primary crop at the study site was jute (Corchorus olitorius L.) mono-cropping. The soil was 54%, 34%, and 12% sand, silt, and clay, respectively, which falls under the category of loam soil. Prior to commencing the study, soil was sampled from the entire experimental field at a 0–15 cm depth, and was analysed subsequently after making a composite sample. The initial value of the soil pH was 7.1 (neutral), with 1.43 Mg/m3 and 16.4 cmol/kg bulk density and cation exchange capacity, respectively, while the organic carbon and available N, P, and K were 6.80 g/kg, 126 mg/kg, 17 mg/kg, and 103 mg/kg, respectively. The total rainfall/annum over the experimental period, i.e., 2012–2013, 2013–2014, 2014–2015, 2015–2016, and 2016–2017 was 1434 mm, 1810 mm, 1337 mm, 1682 mm, and 1552 mm, respectively (Figure 1). The rainfall was well distributed. June to August is known as monsoon season (rainy season), and had the maximum amount of rainfall during experimentation period (2012–2017). The average rainfall during the five-year study was 1563 mm/annum, with a maximum rainfall of 1810 mm/annum in 2013–2014 and a minimum of 1337 mm/annum in 2014–2015. During the research work, the average mean minimum and maximum temperature ranged from 20.7 to 21.1 °C and 30.7 to 34.4 °C, respectively. Considering the entire study during 2012–2017, the average values of the monthly minimum relative humidity (RH) varied from 58 to 63%, while the average monthly maximum RH varied between 92% and 94%.

2.2. Experimental Design and Treatments

A two-factor statistical design (split-plot design) was used in the current study, with one factor being different cropping systems (CSs) and the other being different nutrient and crop residue managements (NCRMs). Five different CSs were designed in the main plots, namely, fallow−rice−rice (FRR), jute−rice−wheat (JRW), jute−rice−baby corn (JRBc), jute−rice−vegetable pea (JRGp), jute−rice−mustard−mungbean (JRMMu), with four different NCRM practices superimposed in the sub-plots, namely, 75% of the recommended dose of fertilizers (RDF) without crop residue (F1R0), 75% RDF with crop residue (F1R1), 100% RDF without crop residue (F2R0), and 100% RDF with crop residue (F2R1). This set of treatment combinations was replicated three times. The same cropping systems (CSs) and nutrient and crop residues managements (NCRMs) were repeated in their respective fixed plots for five years. The RDF for different crops and crop calendar for the sowingand harvesting of each crop are provided in Table A1. The harvested residues of rice, wheat, and corn were weighed, and a fixed amount of 4 Mg·ha−1 for these residues was incorporated in the soil, while the amount of residue for vegetable pea and mungbean was 2 Mg·ha−1. These amounts of residues for the respective crops were fixed for the entire study period. All of the residues were incorporated into the soil with the help of tractor-drawn single disc-harrowing, after which they were cultivated with a rotavator in their particular cropping-systems just before sowing of jute (April). Residues were added and incorporated once in a year, i.e., before sowing the jute. Before sowing the other crops, primary and secondary tillage operations were completed. However, the mustard and mungbean in the JRMMu cropping system were sown just one day after harvesting the rice and mustard, respectively, without any tillage operations in order to accommodate four crops in the year, thus saving the time required for tillage operations. A puddling operation was done before transplanting the rice crop.

2.3. Soil Sampling and Analysis

Soil samples were collected from five random places from each plot of 20 m2, at a 0–15 cm depth, using an auger (5 cm diameter), after the end of the five-year long experiment. These five samples from each plot were mixed together to make a composite sample of 500 g. Thereafter, the fresh soil samples were divided into two parts, in which a part of the soil sample was air-dried, ground, and sieved (through 2 mm mesh) for the chemical analysis. The soil organic carbon (SOC) was determined using 0.167 M K2Cr2O7 [31], available N from the KMnO4 extraction methods [32], available phosphorus (Av.P) from the Olsen method [33], and available potassium (Av.K) from the 1N NH4OAc method, following the method illustrated by Jackson (1973) [34]. As per the chloroform (CCl4) fumigation extraction methods of Vance et al. [35], estimations of the microbial biomass carbon (SMBC) and microbial biomass N (SMBN) were worked out in the laboratory using the remainder of the fresh soil samples. The viable and cultural microbial population was enumerated by adopting the standard-serial-dilution-plate technique with a selective medium for specified groups of soil microorganisms. Such as enumeration of bacteria was done using nutrient agar containing 50 mg/L cycloheximide [36], Azotobacter by Ashby’s N free mannitol agar, and phosphate solubilizing bacteria (PSB) by Pikovskaya’s agar media [37]. The dehydrogenase activity (DHA) in the soil was estimated as per the method given by Tabatabai (1982) [38], which is based on the reduction of idonitotetrazolium chloride (TTC) into triphenyl formazan (TPF), thereafter examining the sample using a spectrophotometer at a wavelength of 485 nm. The estimation of the fluorescein diacetate hydrolytic activity (FDA) was done following the standard procedure mentioned by Schnurer and Rosswall [39], in which the fluorescein released after the reduction was measured on with a spectrophotometer at a wavelength of 490 nm. Urease activity (UA) was determined by quantifying the NH4+ released during 2 h of soil incubation at 370 °C after distillation with magnesium oxide (MgO) using a boric acid indicator and back titration with 0.005 N sulphuric acid [40]. The acid phosphatase (ACP) and alkaline phosphatase (ALP) activities the in soil were estimated through the detection of p-nitrophenol (PNP) released after incubation for 1 h at 37 °C at pH 6.5 of soil with p-Nitrophenyl phosphate disodium [41].

2.4. System Productivity and Sustainable Yield Index (SYI)

To compute the productivity of the different cropping systems, the crop equivalent yield (CEY) was calculated based on the price of jute fibre using the following formula.
CEY = yield of crop in system (Mg·ha−1) × price of crop (Rs/t)/price of jute (Rs/t)
System productivity was calculated by adding the jute yield and crop equivalent yield of the other crops for the respective years.
The sustainable yield index (SYI) of the system was calculated based on the data of five years of system productivity, following the formula given by Singh et al. [42].
SYI = (YA − α)/Yh
where YA is the average system productivity of the particular treatment, α is the standard deviation, and Yh is the highest system productivity recorded in a set of management practice during a year.

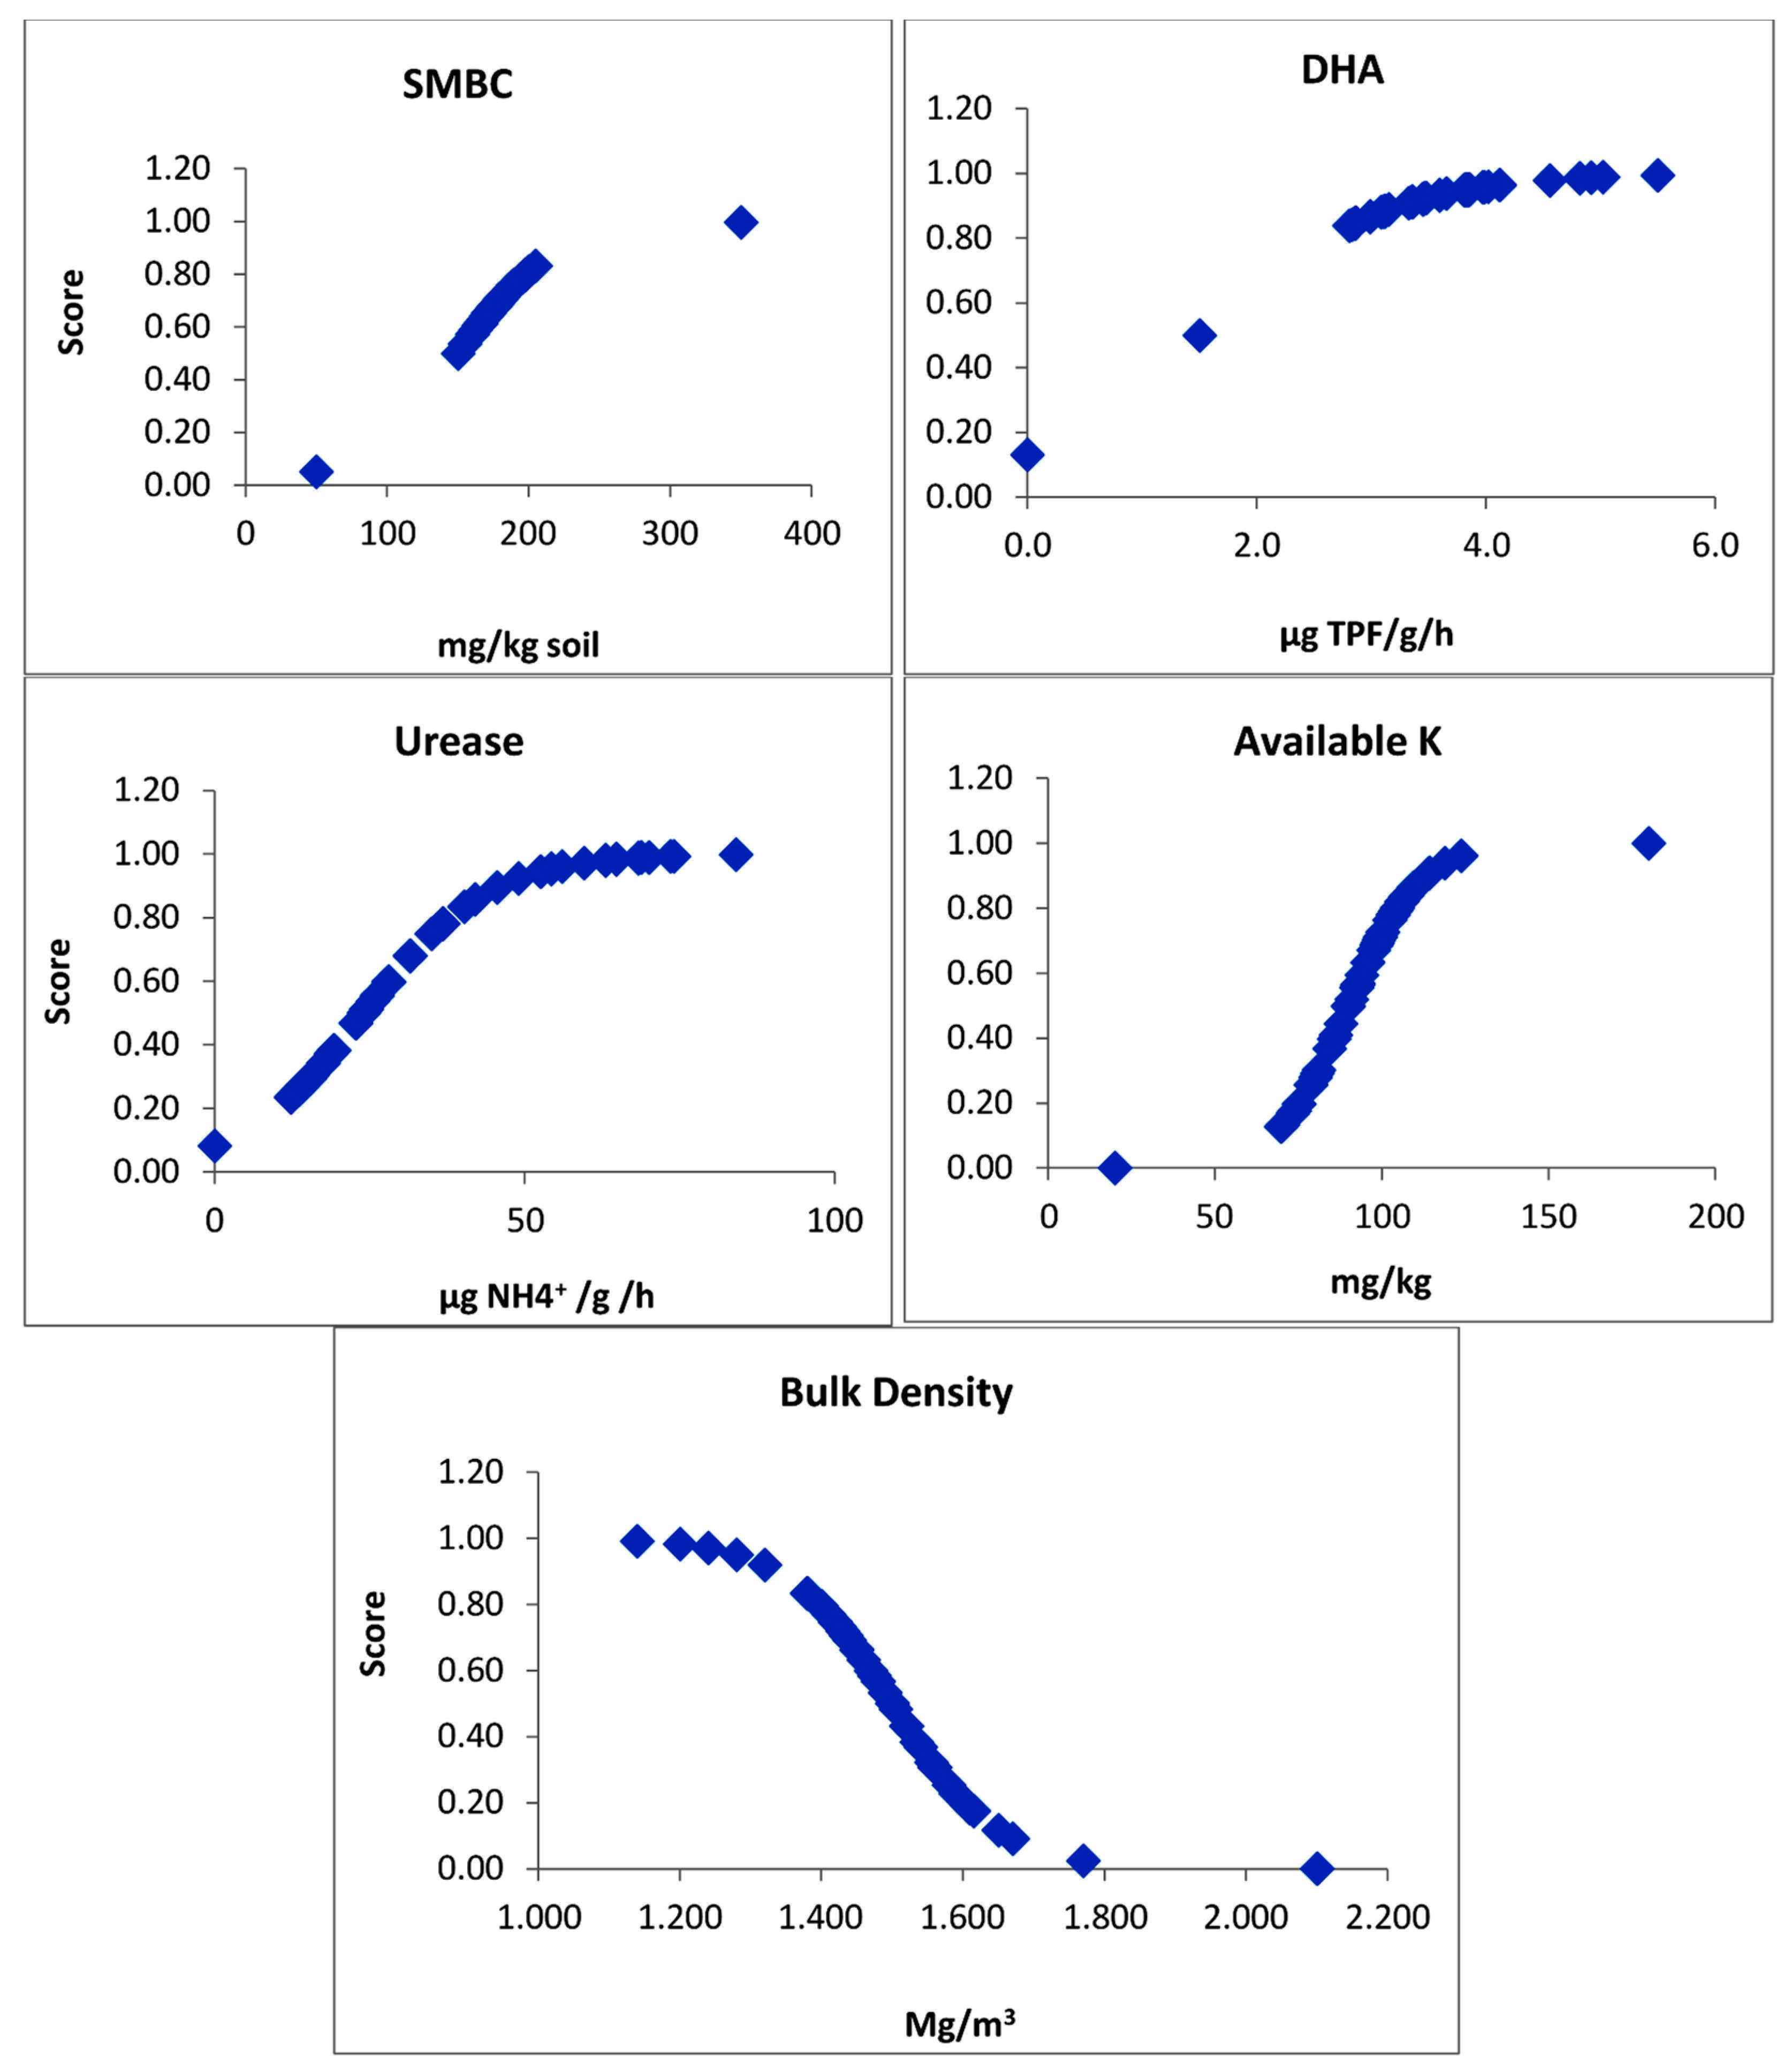
2.5. Soil Quality Index (SQI) Calculation

The procedure to determine the soil quality index had the following four steps: (i) setting the goal, (ii) selection of minimum data set (MDS) of indicators that represent the best soil function, (iii) scoring the MDS indicators, and (iv) the integration of an indicator score into a relative soil quality index [21,25]. In this study, the system productivity of different cropping systems was defined as the goal, because the farmers wanted to get greater productivity from their land area. A total of 16 soil attributes were analyzed during the investigation, of which only 12 soil attributes were included in the MDS for soil quality using the principal component analysis (PCA). Only those soil attributes that differed significantly among treatments were selected as representative of MDS through PCA, as suggested by Andrews et al. [42]. Principal component (PC) variables that had high factor loading and eigen values were assumed to be the best representation of those attribute variables. Therefore, the variables selected in this study explained at least 5% of the data variation and had PCs with eigen values >1 [43]. Moreover, only highly weighted factor loadings were selected within each PC, namely those with absolute values within 10% of the highest factor loading. In the situation when more than one factor fell into a single PC, a multivariate correlation coefficient was applied to exclude the redundant variables from the MDS [23]. Among the significantly correlated variables of one PC, the higher factor loading variable was retained. The variables that were not correlated but were highly weighted in PC were considered important and were kept in the MDS. After the selection of the MDS indicators, every observation of each MDS indicator was assigned a score using a non-linear scoring method [43]. Indicators were arranged based on its value, whether a higher value was considered “good” or “bad”, and according to its function soil. In the present study, SMBC, DHA, urease, and available K were retained in the MDS and scored as “more is better”, as they were good with a higher value. However, bulk density was considered good with a lower range, and thus was scored as “less is better”. For indicators that fell under “more is better”, each observation was divided by the highest observed value, so this received a score of 1. In contrast to the “less is better” indicators, each observation was divided by the lowest observed value so that the lowest observed value received a score of 1. Non-linear scoring function (NLSF):
NLSF (Y) = 1/[1 + e^{−b(x − A)}]
where x is the soil property value, A is the baseline or value of the soil property where the score is equal to 0.5, and b is the slope.
Once the variables were assigned a score, the MDS variables for each observation were weighted using the PCA results. As in the total data set, each PC explained a certain amount (%) of the variation. This percentage is divided by the total percentage of variation explained by all PCs with eigen vectors >1, only if the weighted factor for the variables was chosen for a given PC. Then, the weighted MDS variable scores were summed up for each observation to calculate the soil quality index (SQI), using the following equation:
Soil   quality   index   ( SQI ) = i = 1 n ( Wi × Si )
where Si is the score indicated for the ith variable and Wi is the weightage of the factor for the ith variable, which is derived from the PCA. Here, the assumption is that a higher SQI indicates a better soil quality or better performance of soil. Furthermore, the present contribution of each final key indicator towards SQI was also calculated. The SQI was calculated by assigning the estimated factors to the soil quality indicators as follows:
SQI = 0.353 ×SSMBC + 0.131 × SDHA+ 0.136 SUA + 0.117× SAvK + 0.103 × SBD
where S is the score for the subscripted variable and the coefficients are the weighting factors.

2.6. Statistical Analysis

Analysis of variance (ANOVA) was performed to determine the effects of the treatment of the cropping systems and NCRM practices on the system productivity and soil quality attributes. SPSS Windows version 20.0 (SPSS Inc., Chicago, IL, USA) was used for the statistical analysis of the data (PCA, scoring functions). The least-square difference (LSD) was performed post hoc in order to find the pair-wise comparison of the significant difference of all of the data, with a level of significance at p ≤ 0.05 [44].

3. Results and Discussion

3.1. System Productivity and Sustainable Yield Index

System productivity differed considerably (p ≤ 0.05) among the varied cropping systems and NRCM practices during all of the experimental years. System productivity was significantly higher (15.3 Mg·ha−1) in JRBc compared with the other cropping systems. The system productivity of the remaining cropping systems recorded was as follows: JRGp (8.81 Mg·ha−1) > JRMMu (7.61 Mg·ha−1) > JRW (6.65 Mg·ha−1) > FRR (4.41 Mg·ha−1; Table 1). Although the system productivity was equilvalent to the NRCM practices during the first three years of the experiment (2012–2015), a significantly higher system productivity was recorded with F2R1 than for the remaining NRCM treatments during the last two years (2015–2017) of experimentation. The pooled data for five years of system productivity indicated significant (p ≤ 0.05) variation among the different cropping systems. The interaction between CS and NCRM was found to be non-significant (p ≤ 0.05) for system productivity. The highest system productivity was recorded in JRBc, followed by JRGp. This is mainly due to the higher yield and market price of baby corn compared with what the other crops produced [3]. System productivity is directly related to and functions with the market price and yield of crops, hence their crop yield and its value decide the system productivity. Among the NRCM practices, the system productivity was similar among the treatments, but the highest system productivity (8.78 Mg·ha−1) was recorded for the F2R1 treatment. The application of 100% NPK to each test crop included in the system with crop residue enhanced the crop productivity of each test crop, and thereby increased the system productivity. This is because the use of crop residues is likely to improve the soil tilth through a reduced bulk density and by increasing soil aggregation. Moreover, the addition of crop residues also increased the SOC and available N, P, and K content, which resulted in increased crop productivity by improving the nutrient acquisition and reducing wind and water erosion, and prevented nutrient losses from run-off and leaching [11,12,45]. Our results were corroborated with the results of Sharma and Behera [46], who also reported that crop residue incorporation led to increased soil health and crop productivity.
The highest sustainable yield index (SYI) was the JRGp cropping system (0.88), followed by JRMMu (0.82), and the lowest was for JRBc (0.71). Nonetheless, with the higher system productivity of JRBc compared with the other systems, year-wise variations existed, which led to a decreased SYI. Although the market value of baby corn was higher than the other products, fluctuation in the market price (varies from INR. 10–20/kg cob), which depend on the availability and demand of baby corn in the local market, led to decreased SYI. Among the NRCM practices, the highest SYI was recorded (0.83) for F2R1, followed by F1R1 (0.80). The lowest SYI was recorded where lower doses of mineral fertilizer were applied without crop residue. SYI is the function of crop yield and the fluctuation in yield/standard deviation (α). During the course of the study, the fluctuation of crop yield, which determines the standard deviation, was less where 100% NPK was applied with crop residue, and led to a higher SYI. The benefit of crop residue incorporation is that could provide proper soil health to the region to help sustain the crop yield. The high content of SOC under F2R1 could increase the microbial activity and soil enzymes, as microbes use SOC as a carbon substrate, which helps to increase the availability of N, P, and K. The highest SYI was recorded under F2R1 because of the greater availability of N, P, and K, and accelerated nutrient acquisition resulting increased crop yields of each of the test crops [45,47].

3.2. Soil pH and Bulk Density (BD)

The soil pH did not exhibit significant differences with different cropping systems and NRCM practices (Table 2). Bulk density differed significantly (p ≤ 0.05) among the cropping systems and NCRM practices. The JRGp system had a significantly lower bulk density (1.43 Mg/m3) compared with the JRMMu system (1.57 Mg/m3), but was not significant compared with the rest of the cropping systems. Among the NCRM practices, a significantly lower bulk density was recorded in F2R1 (100% NPK with crop residue) compared with F1R0, but was it was similar to F1R1. The differences in BD under the JRGp system are mainly associated with the addition of legume crops, which are responsible for lowering the BD. The effect of legume crops on bulk density has been reported by Latif et al. [48]. The bulk density of the soil decreased with loosening the soil through tillage and through the incorporation of crop residue [7]. The interaction effect of CS and NRCM practices on pH and BD was non-significant.

3.3. Soil Organic Carbon and Available N, P and K

Soil organic carbon (SOC) was significantly (p ≤ 0.05) higher (7.3 mg/kg) in the JRGp cropping system compared with the JRW and JRBc cropping systems, but it was similar to the JRMMu system (7.27 g/kg; Table 2). The JRBc cropping system exhibited the lowest amount of SOC. The higher SOC for the cropping system including vegetable pea (Gp) and mungbean (Mu) might be attributed to the higher decomposition of residues due to the lower C:N ratio of leguminous crops. On the contrary, cereal dominated systems like JRW and JRBc, which consisted of nutrient-exhaustive crops like corn, rice, and wheat, had a higher C:N ratio in their residues, hindering the decomposition of SOC, therefore resulting in a lower SOC [9]. Among the NRCM practices, a significantly (p ≤ 0.05) higher SOC was recorded in F2R1 compared with F1R0. The short term variability in SOC might be due to the addition of crop residues in soil [45,49], through increasing the cropping intensity [50] by diversifying with leguminous crops, which resulted in increased SOC [47]. Available N (Av.N) did not differ significantly among the cropping systems, but available P and K differed significantly (p ≤ 0.05). However, the maximum available N in the soil was recorded in the JRGp and JRMMu cropping systems. Significantly higher available P (Av. P) was recorded in the JRGp cropping system compared with the JRW and JRBc systems, but it was similar to the JRMMu and RR cropping systems. Similarly, significantly higher available K (av.K) was recorded in JRMMu compared with other cropping systems, but it was statistically at the same level as the JRGp and JRBc cropping systems. The maximum available N in the cropping system with legume crops like pea and mung bean/green gram might be because legumes obtain atmospheric nitrogen through N-fixation for their own requirements, and subsequently release N into the soil as a result of nodulation, root, leaf, etc., incorporation and decomposition throughout growth, thus adding considerable quantities of N, P, and K to the soil [14,46,51,52]. Among NRCM practices, significantly higher available primary nutrients (av. NPK) were recorded in F2R1 compared with F1R0 and F2R0, and it was similar to F1R1. A substantial increase in the N content of soil due to crop residue incorporation has also been reported by Bakht et al. [12] and Shafi et al. [11]. Furthermore, Gupta et al. [53] found a higher available phosphorus and potassium content when practicing return of crop-residue to the soil in a 4-year study compared with a no residue return, i.e., residue removal.

3.4. Soil Microbial Properties

Cropping system and crop residue management had a significant effect on soil microbial activities (Table 3). Soil microbial biomass nitrogen (SMBN) and soil microbial biomass carbon (SMBC) were significantly (p ≤ 0.05) higher in the JRMMu cropping system compared with the other systems. Among the NRCM practices, higher SMBN and SMBC were recorded in F2R1 compared with the other NRCM treatments. The microbial population was differed according to cropping systems and NRCM practices—the bacterial population was the highest in the JRW cropping system, but the lowest count was recorded in the FRR cropping system. Contrary to that, the Azotobacter population was the highest in JRBc, followed by the JRMMu system. A comparatively higher PSB was recorded in the JRGp and JRMMu cropping systems than for the other cropping systems. The JRGp and the JRMMu cropping systems, which had pea and mungbean, respectively, required a higher P nutrition for N fixation. The legume crops have the capacity to solubilize P quickly compared with cereals, by secreting root exudates that enhance the growth and activities of PSB [54,55]. Among the NCRM practices, all of the soil microbes were higher in F2R1 compared with the other NCRM practices. The bacterial population was higher where more nitrogen and crop residue were applied because the availability of the growth substances for bacteria were higher from the crop residues and applied N, which led to increased bacteria growth that was responsible for the decomposition of crop residues. Crop residues with comparative considerable constituents of cellulose, chitin, lignin, etc., are degraded by these soil bacteria [56,57].

3.5. Soil Enzyme Activities

The cropping systems and the residues returned to the soil significantly alter the enzymatic activities in the soil (Table 4). The dehydrogenase (DHA) activity was significantly higher (3.86 µg TPF/g soil/hr) in the JRMMu system compared with the other cropping systems. The residue returned to soil definitely modified the soil microclimate, which manipulated the microbial metabolism [58,59] and led to a significantly enhanced DHA activity on the surface soil. The fluorescein diacetate hydrolytic (FDH) activity was also significantly higher (16.7 µg fluorescein/g/h) in JRMMu; however, it was similr to the JRGp (16.46 µg fluorescein/g/h) and FRR (16.6 µg fluorescein/g/h) cropping systems. Although the acid phosphatase (AcP) activity was non-significant in the cropping systems, the highest value (513.8 µg pNP/g/h) was recorded in the JRGp cropping system. In contrast, the alkaline phosphatase (AlP) was significantly higher (810.8 µg pNP/g/h) in the JRMMu cropping system compared with JRW and FRR, but it was similar to the JRGp (739.7 µg pNP/g/h) cropping system. The urease (UA) activity was significantly higher (59.8 µg NH4+/g/h) in the JRGp cropping system compared with the other systems, except for the JRMMu system. Among the NCRM practices, the DHA and FDH activities were significantly higher in F2R1 compared with the other NCRM practices. Although the activity of AcP, AlP, and UA was non-significant among the NCRM practices, a higher value was recorded for the F2R1 treatment. Returning crop residues to the soil alters the soil enzyme activities by providing a more congenial environment for the growth of microbes; as a result, a soil matrix with more enzyme accumulation was observed. Adding more residues to the soil results in a higher SOC, which is important for forming stable complexes with free enzymes [60]. Moreover, jute added a large amount of shedding leaves (~1 Mg·ha−1) into the soil, which contain a considerable amount of N, P, and K, and improved the rhizosphere, hence promoting the growth and multiplication of the soil microbes, MBC, and soil enzymes [61,62]. The inclusion of legumes and/or their residue in the soil of a cereal-based system has been reported to improve the soil organic matter status, soil enzyme activity, and soil respiratory activity [59,63].

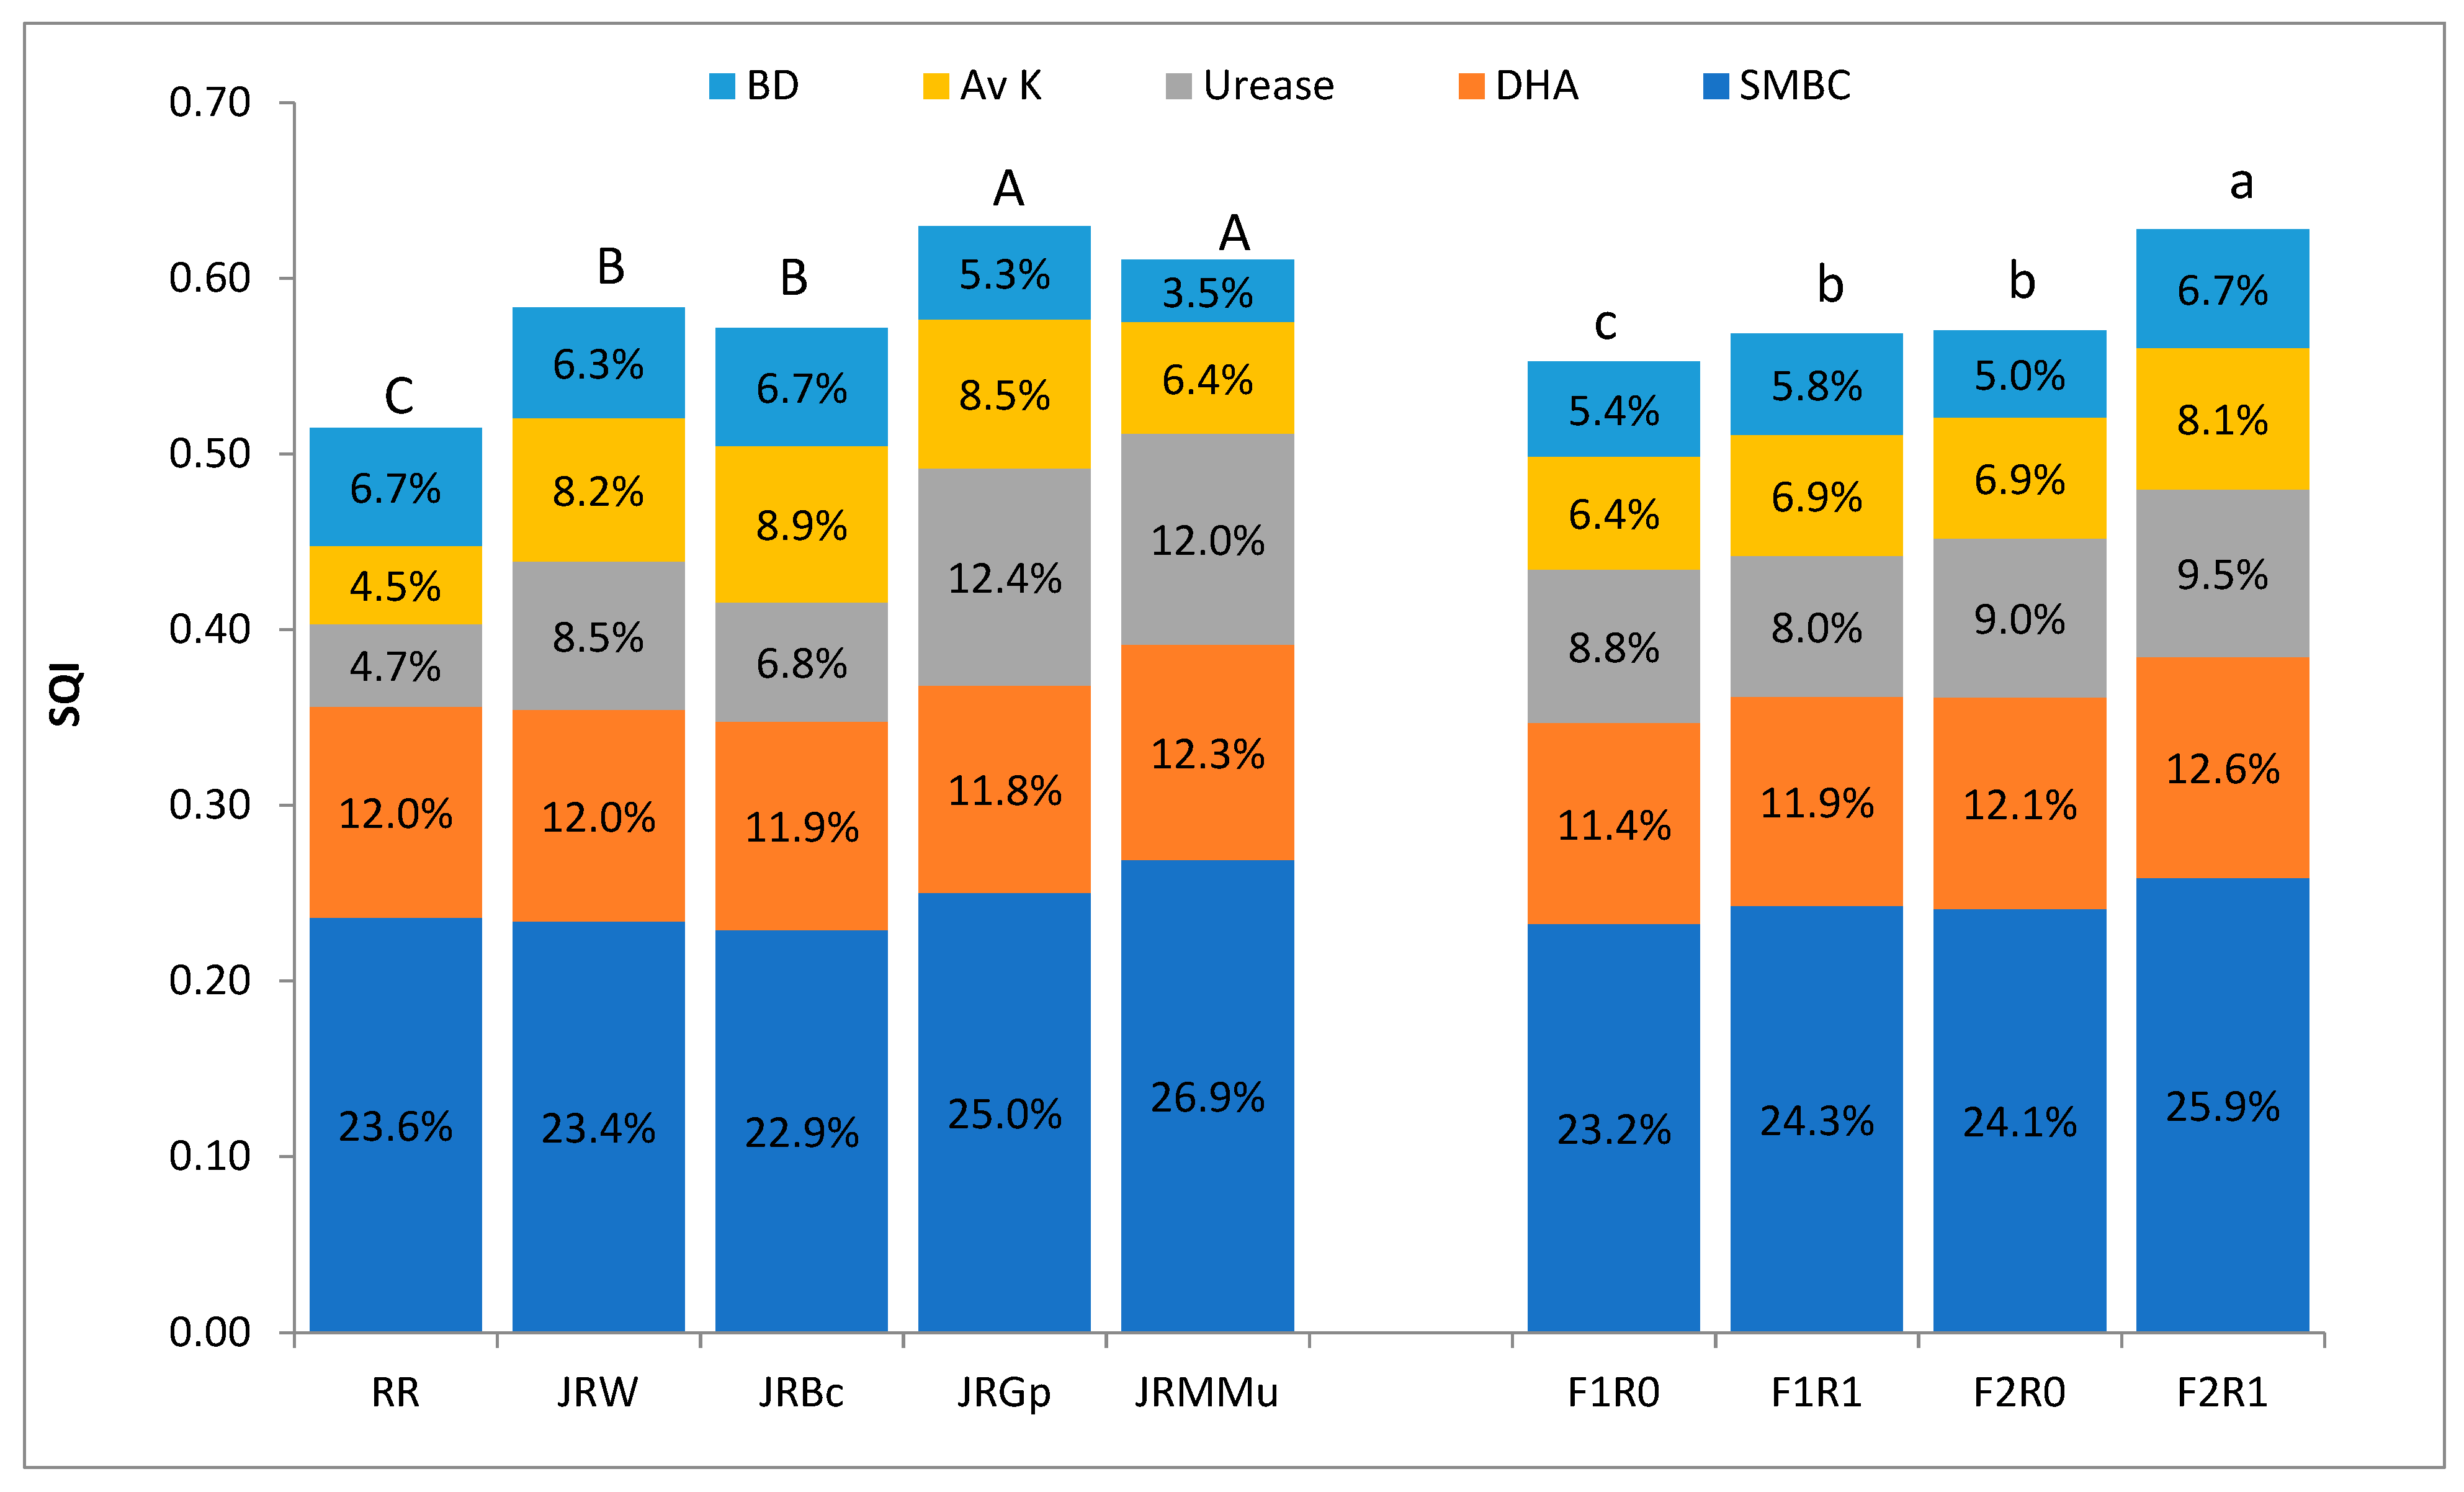
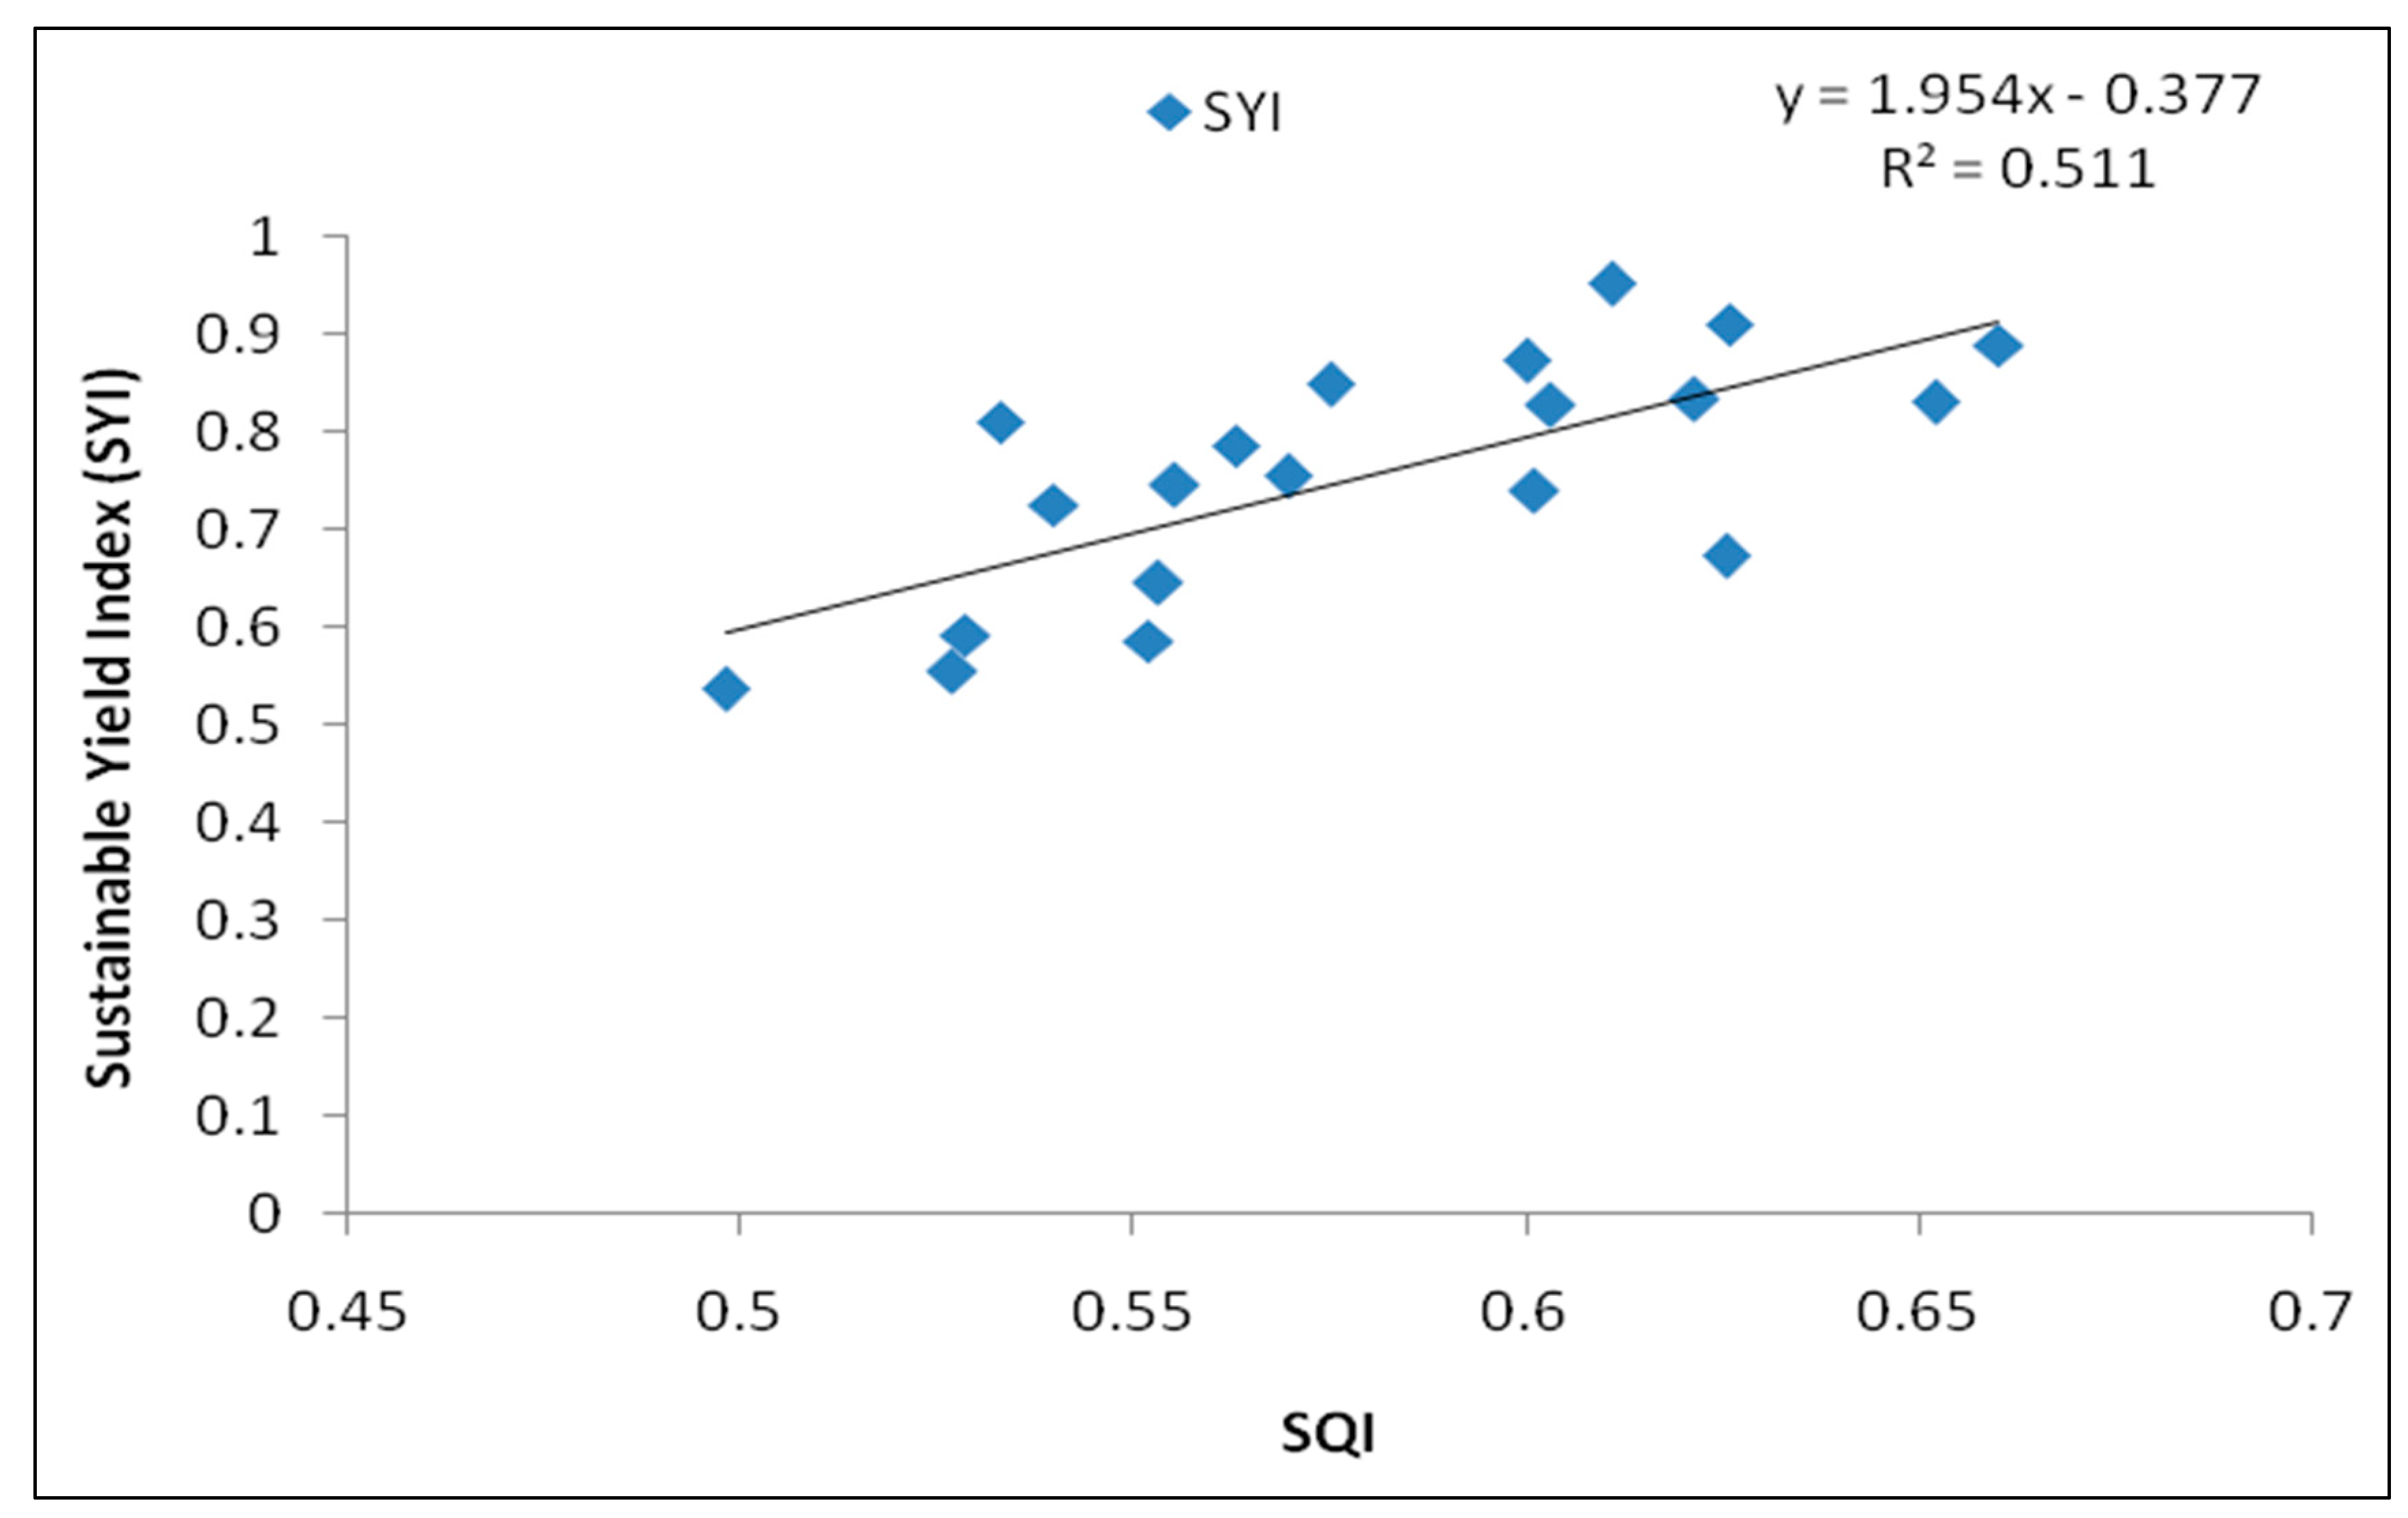
3.6. Soil Quality Index (SQI)

The goal of this study was to enhance and sustain the system productivity, which applied the PCA method for selecting MDS, i.e., minimum data set from the varied bio-physicochemical soil attributes [5]. Following Brejda et al. [24], and Wander and Bollero [64], the MDS was composed of principal components (PCs) with an eigen value ≥ 1 and PCs with a minimum of 5% data variations. PCs with a higher eigen value with variability were the best describing parameters for SQI. The cumulative variance of the four principal components (PCs) was 68.6% (Table 5). The amount of variability explained by PC-1, PC-2, PC-3, and PC-4 was 32.18, 16.10, 11.09, and 9.19%, respectively. Within each PC, only the highest weighted factors possessing absolute values within 10% of the highest factor loading were retained for MDS. For those PCs where more than one factor was retained for MDS, the redundant factor was eliminated using multivariate correlation coefficients [23]. The variables that were significantly correlated among the variables in each PC were eliminated, and only the highest eigen value among the correlated variables was retained in MDS.
In contrast, the non-significant correlated values were preferably retained in MDS. Consequently, in PC-1, three highly weighted factors namely, SMBC, FDA, and SOC, were selected, but SMBC was retained for MDS, as it had the highest eigen value and significant correlation with SOC (R2 = 0.418 **) and with FDA (R2 = 0.355 **; Table 6).
In PC-2, there were three highly loaded factors, namely, UA (0.575), DHA (0.557), and AlP (0.541), but two parameters, i.e., DHA and UA, were selected for the MDS because DHA was not significantly correlated with UA (R2 = 0.014) and AlP (R2 = 0.051), whereas UA was retained for the MDS because of the high factor loading, despite having a significant correlation with AlP (R2 = 0.460 **). In PC-3 and PC-4, only available K and bulk density, respectively, had the highest factor loading, and thus both were retained for MDS. Finally, five soil indicators, i.e., SMBC, DHA, UA, Av. K, and BD, were selected for MDS in Inceptisol. According to Biswas et al. [65], UA and BD changed through soil management practices are of a good quality indicators in Inceptisol.
However, although SOC was selected as a good soil indicator by many researchers [27,66,67], in our study, SOC had a lower factor loading value than SMBC. SMBC also had a strong significant correlation with SOC; hence, SMBC was taken for the MDS. In addition, SMBC is strongly influenced by management factors in the short term, thus it provides an indication of the soil’s functions, i.e., ability to store and recycle nutrients and energy. It also serves as a sensitive indicator of change in organic matter levels and its equilibrium [21,62,67]. The set of indicators chosen for MDS should be easily measurable; cost-effective; and vary with crop, soil, and climatic conditions [21,43,67]. Each PC explains a certain amount of the variation (%) in the total dataset. The weighted factors for the indicators chosen under a given PC were calculated from the variation of each PC divided by the cumulative percentage of the variation explained by all PCs with eigen values ≥1. The weighted factors (i.e., % variation of each PC/cumulative % variation explained by all PCs) for PC-1, PC-2, PC-3, and PC-4 were 0.47, 0.23, 0.16, and 0.13, respectively.
The MDS indicator values were normalized on a scale of 0–1 using the non-linear scoring function (NLSF), as shown in equation 3, following the approach of Andrews et al. [43] and Masto et al. [66]. After deciding the shape of the predicting response, i.e., more is better, less is better, or optimum is better for soil function, the limits or threshold values were assigned for each indicator (Table 7), and the scoring function curves of all MDS indicators are presented in Figure 2.
The score of each MDS was derived from the curve and was used for the SQI calculation for the cropping system and NCRM practices. Among the five cropping systems, SQI varied from 0.51 to 0.63 (Figure 3), and the highest SQI was in JRGp (0.63) and the lowest was in FRR (0.51). However, the SQI of JRGp was the same as for JRMMu (0.61). Among the NCRM practices, the highest SQI was 0.63 in the F2R1 (100% NPK with crop residue) treatment, which was significantly higher than the rest of the NCRM treatments. The SQI for F1R1 and F2R0 was similar. The highest SQI was recorded for the cropping systems with legume crops and for nutrients applied along with the crop residue. Legume cropd and their residues have been well known to enhance soil fertility through soil N2-fixation, nutrient recycling, falling leaves, and root exudates, thereby sustaining productivity [11,14,46,67], which is evident from the value of SQI, which was higher in the cropping systems with legume crops in their sequence.
The average contribution of each MDS varied among all of the cropping systems and NCRM practices, but the highest contribution was recorded with SMBC (24.1%), followed by DHA (11.8%), urease (8.76%), available K (7.01%), and BD (5.63%) in all cropping systems and NCRM practices. The contribution of BD, Av K, and UA varied among cropping systems, but not in NCRM practices. The higher contribution was for BD (6.7%) towards SQI development compared with Av. K (4.5%) and urease (4.7%) in the FRR cropping system, but the reverse trend was observed in the other cropping systems. A positive and linear correlation (y = 1.954x − 0.377; R2 = 0.51) was recorded between the sustainable yield index and SQI (Figure 4). It indicated that sustainability increased with increasing the soil quality, adding legumes in the cropping system, and residue incorporation in the soil, which also increased SQI.

4. Conclusions

From the consideration and analysis of the experimental data, it can be concluded that the system productivity of the jute−rice−baby corn (JRBc) system was higher than for the other cropping systems, followed by the jute−rice−pea (JRGp) and jute−rice−mustard−mungbean (JRMMu) cropping systems, while sustainability was higher in the JRGp cropping system. Both system productivity and sustainability were higher when the recommended dosed of fertilizers were applied with crop residue (F2R1) in the soil. All the important soil attributes were higher in JRGp and JRMMu for the 100% NPK applied with crop residue incorporation. The highest soil quality index (SQI) was seen for the jute−rice−vegetable pea (JRGp) and jute−rice−mustard−mung bean (JRMMu) when grown with the application of 100%NPK with crop residues. The five soil indicators, i.e., SMBC, DHA, UA, AvK, and BD, were selected for MDS in Inceptisols, in which SMBC contributed the highest towards the soil quality index (SQI) determination out of all of the cropping systems and NRCM practices. Hence, diversification/intensification of rice−rice or jute−rice cropping should be included vegetable pea (JRGp) or mustard−mung bean (JRMMu) provided with 100% NPK/RDF applied with crop residue in order to sustain the cropping system and higher soil quality.

Author Contributions

Conceptualization, M.K., S.M., S.P.M., B.M., A.R.S., S.R.S. and B.P.; methodology, M.K.; software, M.K. and B.P.; validation, M.K., S.P.M. and S.M.; formal analysis, M.K., B.P. and A.H.; investigation, M.K.; resources, S.M. and S.P.M.; data curation, M.K., B.P. and A.H.; writing—original draft preparation, M.K., S.M., S.P.M., B.M., A.R.S., S.R.S. and B.P.; writing—review and editing, A.G., A.H. and W.F.A.; visualization, M.K., S.M., S.P.M. and B.P.; supervision, S.M. and S.P.M.; project administration, S.M., A.G., W.F.A. and S.P.M.; funding, A.G., A.H. and W.F.A. All authors have read and agreed to the published version of the manuscript.

Funding

The current research work was funded by the Director of the Central Research Institute for Jute and Allied Fibres and the Taif University Researchers Supporting Project number (TURSP-2020/53), Taif University, Taif, Saudi Arabia.

Institutional Review Board Statement

Not applicable.

Informed Consent Statement

Not applicable.

Data Availability Statement

Most of the recorded data are available in all Tables in the manuscript.

Acknowledgments

We are highly thankful to the Director of the Central Research Institute for Jute and Allied Fibres for providing facilities and encouragement for this study. The authors also extend their appreciation to Taif University for funding current work by Taif University Researchers Supporting Project number (TURSP-2020/53), Taif University, Taif, Saudi Arabia.

Conflicts of Interest

The authors would hereby like to declare that there is no conflict of interests.

Appendix A

Table A1. Details of cropping systems and recommended dose of fertilizers (RDF).
Particulars Jute Rainy RiceWinter RiceWheatBaby CornVegetable PeaMustard Mungbean
Land preparation One harrowing and one rotavator to incorporate residues in case of residue application and while no-residue was there then only one rotavatorPuddlingPuddlingOne rotavatorOne rotavatorOne rotavatorNo tillage No tillage
Sowing/transplanting time (same for all the years of study)15 April12 August24 January25 November15 November25 November11 November5 February
Variety JRO-204KhitishKhitishPBW 343G-5414 Azad P-3B-54Pant mung-5
Crop duration (Days)110 120 14013090100 8570
Spacing (cm)25 × 7 cm20 × 15 cm20 × 15 cm20 cm50 × 15 cm40 × 10 cm35 × 5cm35 × 10 cm
Harvesting 5 August12 November13 June5 April15 March5 March4 February10 April
100 % Recommended doses of fertilizer (RDF) with crop residue
Fertilizer−N (kg/ha)8012080120100406025
Fertilizer−P2O5 (kg/ha)4060406060603060
Fertilizer−K2O (kg/ha)4060404040403040
75% RDF with or without crop residue
Fertilizer−N (kg/ha)6090609075304518.75
Fertilizer−P (kg/ha)30453045454522.545
Fertilizer−K (kg/ha)30453030303022.530

References

  1. Timsina, J.; Connor, D.J. Productivity and management of rice-wheat cropping systems: Issues and challenges. Field Crops Res. 2001, 69, 93–132. [Google Scholar] [CrossRef]
  2. Biswas, B.; Ghosh, D.C.; Dasgupta, M.K.; Trivedi, N.; Timsina, J.; Dobermann, A. Integrated assessment of cropping systems in the Eastern Indo-Gangetic plain. Field Crop Res. 2006, 99, 35–47. [Google Scholar] [CrossRef]
  3. Kumar, M.; Singh, S.R.; Jha, S.K.; Shamna, A.; Mazumdar, S.P.; Singh, A.; Kundu, D.K.; Mahapatra, B.S. System productivity, profitability and resource use efficiency of jute based cropping systems in the eastern Indo-Gangetic plain. Ind. J. Agric. Sci. 2014, 84, 209–213. [Google Scholar]
  4. UN-Pop. World Population Prospects: The 2017 Revision, Online Demographic Profiles. 2017. Available online: http://www.population.un.org/wpp/Graphs/DemographicProfiles/ (accessed on 12 March 2020).
  5. Chaudhury, J.; Mandal, U.K.; Sharma, K.L.; Ghosh, H.; Mandal, B. Assessing soil quality under long-term rice-based cropping system. Commun. Soil Sci. Plant Anal. 2005, 36, 1141–1161. [Google Scholar] [CrossRef]
  6. Hobbs, P.R.; Gupta, R.K. Rice–wheat cropping systems in the Indo-Gangetic plains: Issues of water productivity in relation to new resource-conserving technologies. In Water Productivity in Agriculture: Limits and Opportunities for Improvement; Kijne, J.W., Barker, R., Molden, D., Eds.; CAB International: Wallingford, UK, 2003; pp. 239–253. [Google Scholar]
  7. Bhattacharyya, R.; Prakash, V.; Kundu, S.; Srivastva, A.K.; Gupta, H.S. Soil aggregation and organic matter in a sandy clay loam soil of the Indian Himalayas under different tillage and crop regimes. Agric. Ecosyst. Environ. 2009, 132, 126–134. [Google Scholar] [CrossRef]
  8. Ramesh, P.; Panwar, N.R.; Singh, A.B.; Ramana, S.; Rao, A.S. Impact of organic manure combinations on the productivity and soil quality in different cropping systems in central India. J. Plant Nutr. Soil Sci. 2009, 172, 577–585. [Google Scholar] [CrossRef]
  9. Kar, S.; Pramanick, B.; Brahmachari, K.; Saha, G.; Mahapatra, B.S.; Saha, A.; Kumar, A. Exploring the best tillage option in rice based diversified cropping systems in alluvial soil of eastern India. Soil Tillage Res. 2021, 205, 104761. [Google Scholar] [CrossRef]
  10. Yang, X.M.; Kay, B.D. Rotation and tillage effects on soil organic carbon sequestration in a typicHapludalf in Southern Ontario. Soil Tillage Res. 2001, 59, 107–114. [Google Scholar] [CrossRef]
  11. Shafi, M.; Bakht, J.; Jan, M.T.; Shah, Z. Soil C and N dynamics and maize (Zea mays) yield as affected by cropping systems and residue management in North western Pakistan. Soil and Tillage Res. 2007, 94, 520–529. [Google Scholar] [CrossRef]
  12. Bakht, J.; Shafi, M.; Jan, M.T.; Shah, Z. Influence of crop residue management, cropping system and N fertilizer on soil N and C dynamics and sustainable wheat (Triticumaestivum) production. Soil Tillage Res. 2009, 104, 233–240. [Google Scholar] [CrossRef]
  13. Singh, Y.; Gupta, R.K.; Singh, J.; Singh, G.; Singh, G.; Ladha, J.K. Placement effects on rice residue decomposition and nutrient dynamics on two soil types during wheat cropping in rice–wheat system in north Western India. Nutr. Cycl. Agroecosyst. 2010, 88, 471–480. [Google Scholar] [CrossRef]
  14. Kumar, T.K.; Rana, D.S.; Nain, L. Legume residue and N management for improving productivity and N economy and soil fertility in wheat (Triticum aestivum)-based cropping systems. Natl. Acad. Sci. Lett. 2019, 42, 297–307. [Google Scholar] [CrossRef]
  15. Islam, K.R.; Weil, R.R. Land use effects on soil quality in a tropical forest ecosystem of Bangladesh. Agric. Ecosys. Environ. 2000, 79, 9–16. [Google Scholar] [CrossRef]
  16. Lobe, I.; Amelung, W.; Du Preez, C.C. Losses of carbon and nitrogen with prolonged arable cropping from sandy soils of the South African Highveld. Eur. J. Soil Sci. 2001, 52, 93–101. [Google Scholar] [CrossRef]
  17. Jaskulska, I.; Romaneckas, K.; Jaskulski, D.; Galezewski, L.; Breza-Boruta, B.; Debska, B.; Lemanowicz, J. Soil properties after eight years of the use of strip-till one-pass technology. Agronomy 2020, 10, 1596. [Google Scholar] [CrossRef]
  18. Karlen, D.L.; Mausbach, J.W.; Doran, J.W.; Cline, R.G.; Harris, R.F.; Schuman, G.E. Soil quality: A concept, definition and framework for evaluation. Soil Sci. Soc. Am. J. 1997, 61, 4–10. [Google Scholar] [CrossRef] [Green Version]
  19. Bastida, F.; Moreno, J.L.; Hernández, T.; García, C. Microbiological degradation index of soils in a semi aridsemi-arid climate. Soil Biol. Biochem. 2006, 38, 3463–3473. [Google Scholar] [CrossRef]
  20. Cluzeau, D.; Guernion, M.; Chaussod, R.; Martin-Laurent, F.; Villenave, C.; Cortet, J.; Ruiz-Camacho, N.; Pernin, C.; Mateille, T.; Philippot, L.; et al. Integration of biodiversity in soil quality monitoring: Baselines for microbial and soil fauna parameters for different land-use types. Eur. J. Soil Biol. 2012, 49, 63–72. [Google Scholar] [CrossRef]
  21. Sharma, K.L.; Mandal, U.K.; Srinivas, K.; Vittal, K.P.R.; Mandal, B.; Grace, J.K.; Ramesh, V. Long-term soil management effects on crop yields and soil quality in a drylandAlfisol. Soil Tillage. Res. 2005, 83, 246–259. [Google Scholar] [CrossRef]
  22. Bhaduri, D.; Purakayastha, T.J. Long-term tillage, water and nutrient management in rice–wheat cropping system: Assessment and response of soil quality. Soil Tillage Res. 2014, 144, 83–95. [Google Scholar] [CrossRef]
  23. Andrews, S.S.; Mitchel, J.P.; Mancinelli, R.; Larlen, D.I.; Hartz, T.K.; Horwarth, W.R.; Pettygrove, G.S.; Scow, K.M.; Munk, D.S. On farm assessment of soil quality in California’s central valley. Agron. J. 2002, 94, 12–23. [Google Scholar] [CrossRef] [Green Version]
  24. Brejda, J.J.; Moorman, T.B.; Karlen, D.L.; Dao, T.H. Identification of regional soil quality factors and indicators I.Central and Southern High Plains. Soil Sci. Soc. Am. J. 2000, 64, 2115–2124. [Google Scholar] [CrossRef]
  25. Masto, R.E.; Chhonkar, P.K.; Singh, D.; Patra, A.K. Soil quality response to long-term nutrient and crop management on a semi-arid Inceptisol. Agric. Ecosyst. Environ. 2007, 118, 130–142. [Google Scholar] [CrossRef]
  26. Manna, M.C.; Swarup, A.; Wanjari, R.H.; Ravankar, H.N.; Mishra, B.; Saha, M.N. Long term effect of fertilizer and manure application on soil organic carbon storage, soil quality and yield sustainability under subhumid and semi-arid tropical India. Field Crop Res. 2005, 93, 264–280. [Google Scholar] [CrossRef]
  27. Bhaduri, D.; PurakayasthaPurakayastha, T.J.; Patra, A.K.; Chakraborty, D. Evaluating soil quality under a long-term integrated tillage–water–nutrient experiment with intensive rice–wheat rotation in a semi-arid Inceptisol. India. Environ. Monit. Assess. 2014, 186, 2535–2547. [Google Scholar] [CrossRef] [PubMed]
  28. Choudhary, M.; Jat, H.S.; Datta, A.; Yadav, A.K.; Sapkota, T.B.; Mondal, S.; Meena, R.P.; Sharma, P.C.; Jat, M.L. Sustainable intensification influences soil quality, biota, and productivity in cereal-based agroecosystems. Appl. Soil Ecol. 2018, 126, 189–198. [Google Scholar] [CrossRef]
  29. Sinha, N.K.; Chopra, U.K.; Singh, A.K. Cropping system effects on soil quality for three agro-ecosystems in india. Expl Agric. 2014, 50, 321–342. [Google Scholar] [CrossRef]
  30. Sofi, J.A.; Bhat, A.G.; Kirmai, N.A.; Wani, J.A.; Lone, A.H.; Ganie, M.A.; Dar, G.I.H. Soil quality index as affected by different cropping systems in northwestern Himalayas. Environ. Monit. Assess. 2016, 188, 161–174. [Google Scholar] [CrossRef]
  31. Walkley, A.; Black, I.A. An examination of Degtjareff method for determining organic carbon in soils: Effect of variations in digestion conditions and of inorganic soil constituents. Soil Sci. 1934, 63, 251–263. [Google Scholar] [CrossRef]
  32. Subbiah, B.V.; Asija, G.L. A rapid procedure for assessment of available nitrogen in soils. Curr. Sci. 1956, 31, 196–260. [Google Scholar]
  33. Olsen, S.; Cole CWatanabe, F.; Dean, L. Estimation of available phosphorus in soils by extraction with sodium bicarbonate. In United States Department of Agriculture Circular No. 939; USDA: Washington, DC, USA, 1954. [Google Scholar]
  34. Jackson, M.L. Soil Chemical Analysis; Prentice Hall of India Pvt., Ltd.: New Delhi, India, 1973. [Google Scholar]
  35. Vance, E.D.; Brookes, P.C.; Jenkinson, D.S. An extraction method for measuring soil microbial biomass C. Soil Biol. Biochem. 1987, 19, 703–707. [Google Scholar] [CrossRef]
  36. Parkinson, D.; Gray, T.R.G.; Williams, S.T. Methods for studying the ecology of soil microorganisms. In International Biological Programme Handbook 19; Blackwell Scientist Publications: Oxford, UK, 1971. [Google Scholar]
  37. Pikovskaya, A.I. Mobilization of phosphorus in soil in connection with vital activity of some microbial species. Microbiology 1948, 17, 362–370. [Google Scholar]
  38. Tabatabai, M.A. Soil enzymes. In Methods of Soil Analysis. Part 2. Chemical and Microbiological Properties; Academic Press: New York, NY, USA, 1982; pp. 903–947. [Google Scholar]
  39. Schnurer, J.; Rosswall, T. Fluorescein di-acetate hydrolysis as a measure of total microbial activity in soil and litter. Appl. Environ. Microb. 1982, 43, 1256–1261. [Google Scholar] [CrossRef] [PubMed] [Green Version]
  40. Tabatabai, M.A.; Bremner, J.M. Assay of Urease Activity in Soils. Am. J. Soil Sci. Soc. 1972, 41, 350–352. [Google Scholar] [CrossRef]
  41. Tabatabai, M.A.; Bremner, J.M. 1969. Use of p-nitrophenyl phosphate for assay of soil phosphatase activity. Soil Biol. Biochem. 1969, 1, 301–307. [Google Scholar] [CrossRef]
  42. Singh, R.P.; Das, S.K.; BhaskaraRao, U.M.; Narayana Reddy, M. Towards Sustainable Dryland Agricultural Practices, Technical Bulletin; Central Research Institute for Dryland Agriculture: Hyderabad, India, 1990; p. 106. [Google Scholar]
  43. Andrews, S.S.; Karlen, D.I.; Mitchell, J.P. A comparison of soil quality indexing methods for vegetable production systems in Northern California. Agric. Ecosyst. Environ. 2002, 90, 25–45. [Google Scholar] [CrossRef]
  44. Gomez, K.A.; Gomez, A.A. Statistical Procedures for Agricultural Research; John Wiley & Sons Inc.: New York, NY, USA, 1984. [Google Scholar]
  45. Gangwar, K.S.; Singh, K.K.; Sharma, S.K.; Tomar, O.K. Alternative tillage and crop residue management in wheat after rice in sandy loam soils of Indo-Gangetic plains. Soil Tillage Res. 2006, 88, 242–252. [Google Scholar] [CrossRef]
  46. Sharma, A.R.; Behera, U.K. Recycling of legume residue for nitrogen economy and higher productivity in maize (Zea mays)–wheat (Triticumaestivum) cropping system. Nutr. Cycl. Agroecosyst. 2009, 83, 197–210. [Google Scholar] [CrossRef]
  47. Ghosh, P.K.; Venkatesh, M.S.; Hazra, K.K.; Kumar, N. Long term effect of pulses and nutrient management on soil organic carbon dynamics and sustainability on an Inceptisol of Indo-Gangetic Plains of India. Exp. Agric. 2012, 48, 473–487. [Google Scholar] [CrossRef]
  48. Latif, M.A.; Mehuys, G.R.; Mackenzie, A.F.; Alli, I.; Faris, M.A. Effects of legumes on soil physical quality in maize crops. Plant Soil 1992, 140, 15–23. [Google Scholar] [CrossRef]
  49. Das, T.K.; Bhattacharyya, R.; Sharma, A.R.; Das, S.; Saad, A.A.; Pathak, H. Impacts of conservation agriculture on total soil organic carbon retention potential under an irrigated agro-ecosystem of the western Indo-Gangetic Plains. Eur. J. Agron. 2013, 51, 34–42. [Google Scholar] [CrossRef]
  50. Hutchinson, J.J.; Campbell, C.A.; Desjardins, R.L. Some perspectives on carbon sequestration in agriculture. Agric. For. Meteorol. 2007, 142, 288–302. [Google Scholar] [CrossRef]
  51. Peoples, M.B.; Herridge, D.F.; Ladha, J.K. Biological nitrogen fixation: An efficient source of nitrogen for sustainable agricultural production. Plant Soil 1995, 174, 3–28. [Google Scholar] [CrossRef]
  52. Gupta, R.K.; Yadvinder-Singh Ladha, J.K.; Singh, J.; Bijay-Singh Singh, G.; Pathak, H. Yield and phosphorus transformations in a rice–wheat system with crop residueand phosphorus management. Soil Sci. Soc. Am. J. 2007, 71, 1500–1507. [Google Scholar] [CrossRef]
  53. Kundu, B.S.; Nehra KYadav, R.; Tomar, M. Biodiversity of phosphate solubilizing bacteria in rhizosphere of chickpea, mustard and wheat grown in different regions of Haryana. Ind. J. Microbiol. 2009, 49, 120–127. [Google Scholar] [CrossRef] [Green Version]
  54. Mishra, P.K.; Mishra, S.; Selvakumar, G.; Bisht, J.K.; Kundu, S.; Gupta, H.S. Coinoculation of Bacillus thuringeinsis-KR1 with Rhizobium leguminosarum enhances plant growth and nodulation of pea (Pisumsativum L.) and lentil (Lens culinaris L.). World J. Microbiol. Biotechnol. 2009, 25, 753–761. [Google Scholar] [CrossRef]
  55. Zhao, S.; Li, K.; Zhou, W.; Qiu, S.; Huang, S.; He, P. Changes in soil microbial community, enzyme activities and organic matter fractions under long-term straw return in north-central China. Agric. Ecosyst. Environ. 2016, 216, 82–88. [Google Scholar] [CrossRef]
  56. Arcand, M.; Helgason, B.; Lemke, R. Microbial crop residue decomposition dynamics in organic and conventionally managed soils. Appl. Soil Ecol. 2016, 107, 347–359. [Google Scholar] [CrossRef]
  57. Sinsabaugh, R.L.; Follstad Shah, J.J. Ecoenzymatic stoichiometry of recalcitrant organic matter decomposition: The growth rate hypothesis in reverse. Biogeochemistry 2011, 102, 31–43. [Google Scholar] [CrossRef]
  58. Singh, G.; Bhattacharyyaa, R.; Das, T.K.; Sharma, A.R.; Ghosh, A.; Das, S.; Jha, P. Crop rotation and residue management effects on soil enzyme activities, glomalin and aggregate stability under zero tillage in the Indo-Gangetic Plains. Soil Tillage. Res. 2018, 184, 291–300. [Google Scholar] [CrossRef]
  59. Gianfreda, L.; Ruggiero, P. Enzyme activities in soil. In Nucleic Acids and Proteins in Soil; Nannipieri, P., Smalla, K., Eds.; Springer: Berlin, Germany, 2006; pp. 257–311. [Google Scholar]
  60. Chang, E.H.; Chung, R.S.; Tsai, Y.W. Effect of application rates of organic fertilizers on soil enzymes activities and microbial counts. Soil Sci. Plant Nutr. 2007, 53, 132–140. [Google Scholar] [CrossRef]
  61. Singh, S.R.; Kundu, D.K.; Tripathi, M.K.; Dey, P.; Saha, A.R.; Kumar, M.; Singh, I.; Mahapatra, B.S. Impact of balanced fertilization on nutrient acquisition, fibre yield of jute and soil quality in New Gangetic alluvial soils of India. Appl. Soil Ecol. 2015, 92, 24–34. [Google Scholar] [CrossRef]
  62. Chander, K.; Goyal, S.; Mundra, M.C.; Kapoor, K.K. Organic matter, microbial biomass and enzyme activity of soils under different crop rotations in the tropics. Biol. Fertil. Soils 1997, 24, 306–310. [Google Scholar] [CrossRef]
  63. Wander, M.M.; Bollero, G.A. Soil quality assessment of tillage impacts to Illinois. Soil Sci. Soc. Am. J. 1999, 63, 961–971. [Google Scholar] [CrossRef]
  64. Biswas, S.; Hazra, G.C.; Purakayastha, T.J.; Saha, N.; Mitran, T.; Roy, S.S.; Basak, N.; Mandal, B. Establishment of critical limits of indicators and indices of soil quality in rice-rice cropping systems under different soil orders. Geoderma 2017, 292, 34–48. [Google Scholar] [CrossRef]
  65. Masto, R.E.; Chhonkar, P.K.; PurakayasthaTJPatra, A.K.; Singh, D. Soil quality indices for evaluation of long term land use and soil management practices in semi-arid sub-tropical India. Land Degrad. Dev. 2008, 19, 1–14. [Google Scholar] [CrossRef]
  66. Shahid, M.; Nayak, A.K.; Shukla, A.K.; Tripathi, R.; Kumar, A.; Mohanty, S.; Bhattacharyya, P.; Raja, R.; Panda, B.B. Long-term effects of fertilizer and manure applications on soil quality and yields in a sub-humid tropical rice-rice system. Soil Use Manag. 2013, 29, 322–332. [Google Scholar] [CrossRef]
  67. Sharma, K.L.; Ramachandrappa, B.K.; Suma Chandrika, D.; Sathish, A.; Dhanpal, G.N.; Rao, C.S.; Shankar, M.A.; Grace, J.K.; Sankar, G.M.; Chary, G.R.; et al. Effect of organic manure and crop residue based long-term nutrient management systems on soil quality changes under sole finger millet (Eleusinecoracana (L.) Gaertn.) and Groundnut (Arachishypogaea L.)–Finger millet rotation in rainfed Alfisol. Commun. Soil Sci. Plant Anal. 2016, 47, 899–914. [Google Scholar]
Figure 1. Monthly rainfall. Mean monthly maximum and minimum temperature and evaporation during the year of experimentation 2012–2017.
Agronomy 11 01622 g001
Figure 2. Nonlinear scoring functions for six ninimum data set (MDS)/soil quality indicator. SMBC—soil microbial biomass carbon; DHA—dehydrogenase.
Agronomy 11 01622 g002
Figure 3. Soil quality index and contribution of soil quality indicator for different cropping system (CS) and nutrient and crop residue management (NRCM) practices. J-Jute, R-Rice, W-Wheat, Bc-Baby corn; Gp: Vegetable pea; M-Mustard, Mu-mung bean (green gram); F1R0-75% NPK/RDF without crop residue; F1R1-75% NPK/RDF with crop residue F2R0-100% NPK without crop residue; F2R1-100% NPK with crop residue. BD—bulk density; SOC—soil organic carbon; AvK—available K; SMBC—soil microbial biomass carbon; DH—dehydrogenase. Capital and small similar letters mean there are non-significant difference between CS and NRCM, respectively.
Agronomy 11 01622 g003
Figure 4. Relationship between sustainable yield index (SYI) and soil quality index (SQI).
Agronomy 11 01622 g004
Table 1. System productivity and sustainable yield index (SYI) of different cropping systems under nutrient and crop residue management practices.
Cropping Systems (CS)System Productivity (Mg·ha−1)SYI
2012–20132013–20142014–20152015–20162016–2017Pooled
Cropping system
FRR4.644.804.743.813.964.410.79
JRW6.297.217.835.896.056.650.75
JRBc18.315.313.717.811.515.30.71
JRGp8.948.809.417.879.108.810.88
JRMMu #8.138.518.137.237.107.610.82
SEm (±)0.420.290.340.310.120.29
LSD (p ≤ 0.05)1.160.850.980.910.370.84
Nutrient and residue management practices (NRCM)
F1R09.108.728.417.867.218.260.76
F1R19.128.808.678.307.408.510.80
F2R09.409.918.958.387.548.670.79
F2R19.419.129.058.778.048.780.83
SEm (±)0.250.180.210.150.100.18
LSD (p < 0.05)NSNSNS0.420.300.36
CS × NRCMNSNSNSNSNSNS
J—jute; R—rice; w—wheat, Bc—baby corn; Gp—vegetable pea; M—mustard; Mu—mung bean (green gram); F1R0—75% NPK/RDF without crop residue; F1R1—75% NPK/RDF with crop residue F2R0—100% NPK without crop residue; F2R1—100% NPK with crop residue; # crop was sown on zero tillage; SEm—standard error of mean; LSD—least significant difference; S—significant; NS—non-significant.
Table 2. Soil physio-chemical properties influenced by different cropping systems and nutrient and crop residue management practices.
Cropping System/Soil AttributespHBD (Mg/m3)SOC (g/kg)Av N (mg/kg)Av P (mg/kg)Av K (mg/kg)
Cropping system (CS)
FRR7.111.476.94109.722.583.8
JRW7.131.466.57108.518.988.1
JRBc7.161.496.48103.816.499.3
JRGp7.111.437.37111.425.1101.6
JRMMu #7.071.557.27111.422.7104.5
SEm (±)0.060.040.236.102.185.26
LSD (p ≤ 0.05)NS0.100.55NS5.0312.35
Nutrients and crop residue management practices (NCRM)
F1R07.071.526.65103.220.192.2
F1R17.131.466.90110.621.395.1
F2R07.151.516.84106.420.994.8
F2R17.111.437.32115.722.499.8
SEm (±)0.060.030.223.020.772.53
LSD (p ≤ 0.05))NS0.080.506.161.566.50
CS × NCRMNSNSNSNSNSNS
J—jute; R—rice; W—wheat; Bc—baby corn; Gp—vegetable pea; M—mustard; Mu—mung bean (green gram); F1R0—75% NPK/RDF without crop residue; F1R1—75% NPK/RDF with crop residue; F2R0—100% NPK without crop residue; F2R1—100% NPK with crop residue; # crop was sown on zero tillage; BD—bulk density; SOC—soil organic carbon; AvN—available N; AvP—available P; AvK—available K, SEm—standard error of mean; LSD—least significant difference; S—significant; NS—non-significant.
Table 3. Soil microbial properties influenced by different cropping systems and nutrient and crop residue management practices.
TreatmentsSMBN
(mg/kg Soil)
SMBC
(mg/kg Soil)
Bacteria
(106 cfu/g Soil)
Azotobacter
(104 cfu/g Soil)
PSB
(106 cfu/g Soil)
Cropping system (CS)
FRR19.1174.434.225.615.3
JRW20.3173.843.928.315.5
JRBc20.5171.342.443.717.5
JRGp22.0180.842.835.320.7
JRMMu #23.5190.637.538.720.8
SEm (±)0.662.771.873.520.88
LSD (p ≤ 0.05)1.907.995.3910.042.55
Nutrients and crop residue management practices (NCRM)
F1R017.4173.233.533.415.5
F1R120.6177.542.035.318.9
F2R021.7176.738.733.918.1
F2R124.6185.246.4040.519.0
SEm (±)0.490.911.552.110.86
LSD (p ≤ 0.05)1.402.624.48NS2.48
CS × NCRMNS**NS*
J—jute; R—rice; W—wheat; Bc—baby corn; Gp—vegetable pea; M—mustard; Mu—mung bean (green gram); F1R0—75% NPK/RDF without crop residue; F1R1—75% NPK/RDF with crop residue F2R0—100% NPK without crop residue; F2R1—100% NPK with crop residue; # crop was sown on zero tillage; SMBC—soil microbial biomass carbon; SMBN—soil microbial biomass N; SEm—standard error of mean; * significant at p ≤ 0.05 level; LSD—least significant difference; S—significant; NS—non-significant.
Table 4. Soil enzymes are influenced by different cropping systems and nutrient and crop residue management practices.
TreatmentsDHA
(µg TPF/g/h)
FDA
(µg Fluorescein/g/h)
AcP
(µg pNP/g/h)
AlP
(µg pNP/g/h)
Urease
(µg NH4+/g/h)
Cropping system (CS)
FRR3.5116.56367.39674.1833.3
JRW3.5114.78402.08542.3534.52
JRBc3.4015.26359.38736.5537.45
JRGp3.3616.46513.75793.7559.79
JRMMu #3.8616.67488.04810.6042.02
SEm (±)0.080.3943.4037.985.69
LSD (p ≤ 0.05)0.231.14NS109.6716.43
Nutrients and crop residue management practices (NCRM)
F1R03.0614.52400.74653.4933.88
F1R13.4015.73414.95730.7435.51
F2R03.5216.42440.78726.2834.88
F2R14.1417.12448.95735.2845.45
SEm (±)0.060.1717.6728.323.079
LSD (p ≤ 0.05)0.180.4934.532.648.89
CS × NCRM**NSNSNS
J—jute; R—rice; W—wheat; Bc—baby corn; Gp—vegetable pea; M—mustard; Mu—mung bean (green gram); F1R0—75% NPK/RDF without crop residue; F1R1—75% NPK/RDF with crop residue F2R0—100% NPK without crop residue; F2R1—100% NPK with crop residue; # crop was sown on zero tillage; DHA—dehydrogenase; FDA—fluorescein diacetate hydrolytic; AcP-Acid phosphatase; AlP—alkaline phosphatase; UA—urease. * Significant at p ≤ 0.05 level; SEm—standard error of mean; LSD—least significant difference; S—significant; NS—non-significant.
Table 5. Principle component analysis of the soil variables.
Principle ComponentsPC-1PC-2PC-3PC-4
Eigenvalue3.8621.9321.3321.103
Variance (%)32.1816.1011.099.19
Cumulative variance (%)32.1848.2859.3868.57
Eigen vector
BD0.2360.1980.4370.766
SOC0.6410.2430.205−0.033
AvN0.569−0.348−0.2440.035
AvP0.5750.299−0.5520.06
AvK−0.127−0.3080.722−0.258
SMBC0.752−0.2230.1060.313
SMBN0.630−0.4040.325−0.184
DHA0.616−0.557−0.185−0.18
FDA0.698−0.432−0.0840.111
AcP0.5460.4420.205−0.414
AlP0.5440.5410.071−0.294
UA0.5480.5750.0920.097
BD—bulk density; SOC—soil organic carbon; AvN—available N; AvP—available P; AvK—available K; SMBC—soil microbial biomass carbon; SMBN—soil microbial biomass N; DHA—dehydrogenase; FDA—fluorescein diacetate hydrolytic; AcP—acid phosphatase; AlP—alkaline phosphatase; UA—urease.
Table 6. Correlation matrix of higher weighted factor loading under different PC.
BDSOCSMBCFDAAvKDHAAlphosUrease
BD1.00
SOC0.181.00
SMBC0.301 *0.418 **1.00
FDA0.100.355 **0.611 **1.00
AvK0.012−0.02−0.093−0.0181.00
DHA−0.1280.2110.494 **0.578 **−0.0241.00
Alphos0.282*0.390 **0.313 *0.063−0.0990.0511.00
UA0.0720.412 **0.2160.196−0.1430.0140.460 **1.00
* Correlation is significant at the 0.05 level (two-tailed); ** Correlation is significant at the 0.01 level (two-tailed). BD—bulk density; SOC—soil organic carbon; AvN—available N; AvP—available P; AvK—available K; SMBC—soil microbial biomass carbon; SMBN—soil microbial biomass; DHA—dehydrogenase; FDA—fluorescein diacetate hydrolytic; AcP-Acid phosphatase; AlP—alkaline phosphatase; UA—urease.
Table 7. Scoring functions (SF), threshold values, and weight for the MDS indicators.
Soil IndicatorLower ThresholdUpper ThresholdA/BaslineSlopeReferences
SMBC03501500.029Masto et al. [66]
DHA05.51.51.260Masto et al. [66]
UA1274240.10Biswas et al. [65]
AvK20180900.095Masto et al. [66]
BD1.22.11.5−13.5Bhaduri et al. [27]
SMBC—soil microbial biomass carbon; DHA—dehydrogenase; UA—urease; AvK—available K; BD—bulk density.
Publisher’s Note: MDPI stays neutral with regard to jurisdictional claims in published maps and institutional affiliations.

