Article

Effect of Salinity Stress on Physiological Changes in Winter and Spring Wheat

1
Department of Agronomy, Ghazi University, Dera Ghazi Khan 32200, Pakistan
2
Department of Agronomy, Muhammad Nawaz Shareef Agricultural University, Multan 66000, Pakistan
3
College of Agronomy, Northwest A&F University, Yangling 712100, China
4
Soil and Crop Sciences Department, Texas A&M University, 2474 TAMU, College Station, TX 77843-2474, USA
5
Fujian Provincial Key Laboratory of Crop Molecular and Cell Biology, Fujian Agriculture and Forestry University, Fuzhou 350002, China
6
Key Lab of Biology and Genetic Improvement of Oil Crops, Oil Crops Research Institute, Chinese Academy of Agricultural Sciences (CAAS), Wuhan 430062, China
7
Department of Entomology, Bahauddin Zakariya University, Multan 60800, Pakistan
8
Department of Botany, Bahauddin Zakariya University, Multan 60800, Pakistan
9
Department of Forestry, Bahauddin Zakariya University, Multan 60800, Pakistan
10
Department of Environmental Biological and Pharmaceutical Sciences and Technologies, University of Campania “Luigi Vanvitelli”, Via Antonio Vivaldi, 43-81100 Caserta, Italy
*
Authors to whom correspondence should be addressed.
Agronomy 2021, 11(6), 1193; https://doi.org/10.3390/agronomy11061193
Submission received: 26 April 2021 / Revised: 7 June 2021 / Accepted: 9 June 2021 / Published: 11 June 2021
(This article belongs to the Collection Crop Physiology and Stress)

Abstract

:
Salinity is a leading threat to crop growth throughout the world. Salt stress induces altered physiological processes and several inhibitory effects on the growth of cereals, including wheat (Triticum aestivum L.). In this study, we determined the effects of salinity on five spring and five winter wheat genotypes seedlings. We evaluated the salt stress on root and shoot growth attributes, i.e., root length (RL), shoot length (SL), the relative growth rate of root length (RGR-RL), and shoot length (RGR-SL). The ionic content of the leaves was also measured. Physiological traits were also assessed, including stomatal conductance (gs), chlorophyll content index (CCI), and light-adapted leaf chlorophyll fluorescence, i.e., the quantum yield of photosystem II (Fv/Fm′) and instantaneous chlorophyll fluorescence (Ft). Physiological and growth performance under salt stress (0, 100, and 200 mol/L) were explored at the seedling stage. The analysis showed that spring wheat accumulated low Na+ and high K+ in leaf blades compared with winter wheat. Among the genotypes, Sakha 8, S-24, W4909, and W4910 performed better and had improved physiological attributes (gs, Fv/Fm′, and Ft) and seedling growth traits (RL, SL, RGR-SL, and RGR-RL), which were strongly linked with proper Na+ and K+ discrimination in leaves and the CCI in leaves. The identified genotypes could represent valuable resources for genetic improvement programs to provide a greater understanding of plant tolerance to salt stress.

1. Introduction

Plants respond to environmental changes by altering metabolism, growth, and development. When climate changes are rapid, plants perceive them as stress. Among the abiotic stresses, those that most affect the productivity of agricultural crops are: extreme temperatures, osmotic stress, drought, and salinity. Many environmental conditions can lead to water stress in plants. For example, the high concentrations of salt in saline habitats make it difficult for roots to absorb water from the soil. Drought reduces morphological traits such as the reduction of leaf size and vegetative growth, and physiological traits such as the reduction of photosynthesis and stomatal conductance, and alters the anatomical characteristic of the stem [1,2].The results of these stresses induce an excessive production of reactive oxygen species (ROS), which cause extensive cell damage and inhibition of photosynthesis [3,4]. To these stresses are added the deficits of inorganic nutrients, the residues of chemicals such as herbicides and pesticides used in normal agricultural practice and heavy metals present in the earth’s crust that emanate from industrial activities [5,6,7,8].
Salinity is a major threat to agriculture, among other abiotic stresses; currently, more than 20% of agricultural land is affected by salinity, which is expanding day by day and already affects almost 954 million hectares of the world’s total land area [5,9,10]. Pakistan is located in arid and semi-arid regions where precipitation is scarce; therefore, the salt concentration accumulates in the rootzone [11].The presence of high salt levels in the soil and water used for irrigation is one of the worrying factors for agriculture. For this reason, it is important to develop effective strategies to improve yield through salt tolerance. Salinity affects plant growth due to the toxicity of Na+ and decreases the uptake of essential nutrients such as calcium (Ca+) and potassium (K+) [12]. A high salt concentration causes both osmotic and ionic stresses, which damages the photosynthetic apparatus and physiology, e.g., closes the stomata and reduces the leaf expansion rate [13,14]. Due to the high concentration of Na+ in saline soil, it causes water-stressed conditions that lead to decreased yield production worldwide [15,16]. Plant responses vary in salinity tolerance, as reflected in their different growth and physiological responses [6,17]. Indeed, there is potential for improving salt tolerance in cultivated species through selection and breeding. Among cereals, rice is the most salt-sensitive, and barley is the most salt-tolerant, whereas bread wheat is a moderately salt-tolerant crop.
Wheat (Triticum aestivum L.) is the most cultivated cereal in the world, after maize. Wheat is a staple food for more than one-third of the world’s people, supplying about 20% of total protein and daily calories [18,19]. Globally, wheat is cultivated on non-saline and saline soils, covering an area of approximately 214.79 million hectares [19,20]. Primary salinity refers to weathering of natural materials, while secondary salinity may occur due to anthropogenic activities. In low rainfall arid and semi-arid areas, improper irrigation practices are the main sources of secondary salinization [21]. Initial exposure to salinity leads to osmotic stress, which negatively affects plant growth due to the change in water content between cells which inhibits cell expansion and division with decreased stomatal opening and transpiration [10,22]. Long-term exposure to salinity causes plants to undergo ionic stress mainly due to the increase in sodium chloride concentration, which induces premature senescence, chlorosis, and necrosis in older leaves. Such changes negatively affect protein synthesis and photosynthetic activity [10]. In addition, the growth of the shoots is strongly reduced than that of the roots. This is because the decrease in leaf expansion compared with root growth reduces the water supply to the plant. Consequently, the soil moisture is conserved by avoiding an escalation of the salt concentration in the soil itself. Furthermore, high concentration levels of Na + and/or Cl are toxic in the cell, negatively affecting the photosynthetic capacity. Consequently, there is a lower contribution of carbohydrates to young leaves, with a reduction in the growth rate of shoots [23]. Indeed, studies conducted on plants subjected to salt stress have shown different responses attributable to the plasticity of the plant genome being stress-related. These responses involve specific epigenetic modifications such as activation of transcription factors that modulate gene expression, which can influence the physiological processes of plants, compromise growth, and development [3,24,25]. The selection of salinity-tolerant plants could allow farmers to identify the genotypes best suited to salinized soils. However, progress in developing salt tolerance is limited by the genetic complexity of wheat. It is necessary to understand the mechanism of salinity tolerance in wheat genotypes. Many researchers and scientists have focused on exploring physiological mechanisms for developing the salt-tolerant germplasm in wheat. Since wheat (Triticum spp.) is a major food crop, the development and identification of salt-tolerant wheat cultivars is an important research purpose.
Fluorescence of chlorophyll (e.g., Fv/Fm′, Ft) and gas exchange have been considered important physiological indicators for screening the tolerance of different cultures. There are two important exit photosystems (PSI and PSII) in the plant. PSII is found to be more prone to the hazardous effects of salinity [26]. Measuring chlorophyll fluorescence is a good indicator of salt effects in the photosynthetic apparatus [27]. Consequently, it is important to evaluate the relationship between the efficiency of PSII and CO2 assimilation in the leaves as the measurement of fluorescence detects the differences in the response of plants to abiotic stresses by evaluating their tolerance. The use of morphological traits, along with physiological tolerance and their relationship with salinity tolerance indices, are applicable and considered sufficient to be exploited as selection criteria in the breeding of salt-tolerant germplasm [27].
Wheat is also called a salt excluder, which means it mitigates salinity stress by excluding Na+ from the shoot as much as possible [28,29]. The capacity of bread wheat to exclude Na+ is much stronger than that of durum wheat genotypes [10]. Moreover, salt tolerance is a polygenic trait, and its expression can be influenced by genetic, environmental, and physiological factors. In fact, in the same species it is possible to select a salt-tolerant genotype [30], suggesting that this potential may be improved through conventional breeding approaches. Furthermore, little work has been carried out to examine physiological differences in spring and winter genotypes under salt stress. In the present study, we used five different spring wheat and five durum wheat genotypes to test the different responses and adaptations to salt stress. Some of these, such as S-24, were selected for their well-known salt-tolerance; therefore, it was used as reference one [31]. The genotypes used were evaluated for the effect of salinity on some key physiological and morphological traits. The identified genotypes could represent valuable resources for genetic improvement programs to provide greater understanding of plant tolerance to salt stress, supporting agricultural production on salinized soils irrigated with brackish water.

2. Results

2.1. Response of Wheat Genotypes against Different Salinity Levels

Significant differences (p ≤ 0.05) were recorded among the spring wheat genotypes (G), winter wheat genotypes, and the total wheat genotypes (Table 1) in terms of their interactions (G∗S) at different NaCl salt stress levels (S) for ionic, physiological, and seedling growth traits (Table 1).

2.2. Value of % Control

Significant variation (p ≤ 0.05) was observed between the spring wheat and winter wheat for ionic, seedling growth, and physiological traits (Figure 1a–l). The value of % control of ionic, physiological, and growth traits was decreased by increasing the salt stress (Figure 1a–l). Spring wheat showed a maximum value of % control for ionic (Na+, K+ and K+/Na+ ratio; Figure 1a–c), growth (RGR-SL), and physiological traits (gs, Ft, QY, and CCI; Figure 1i–l) compared with winter wheat.

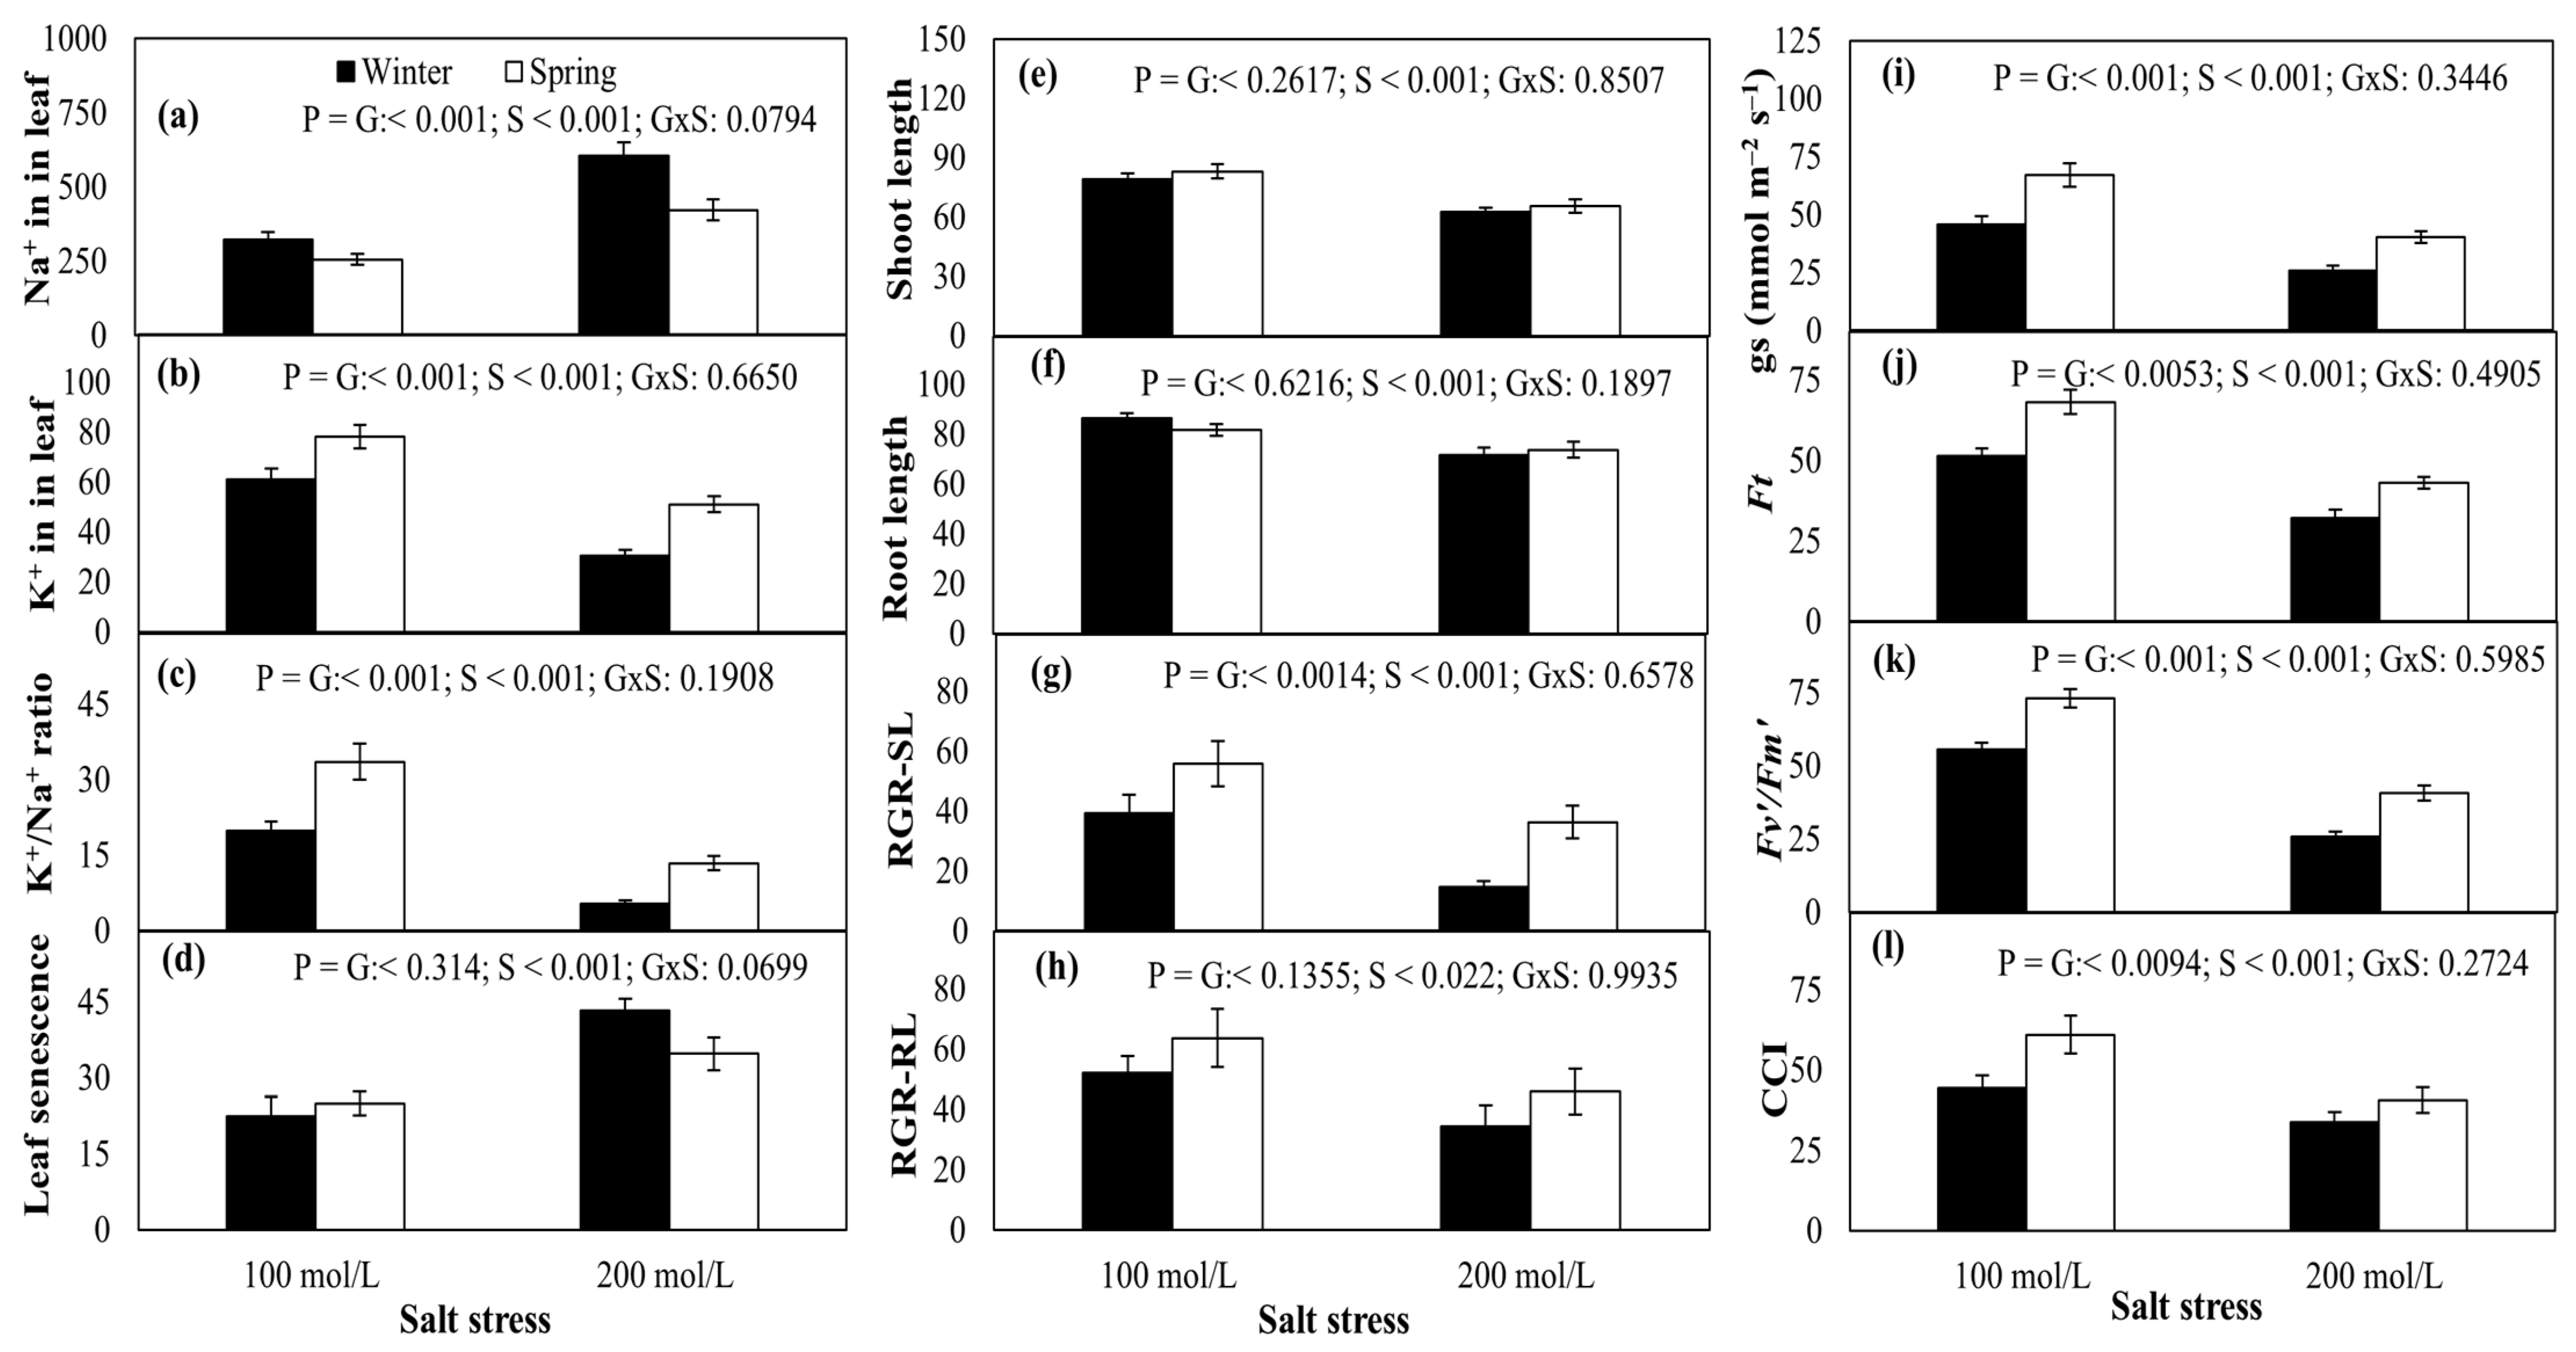
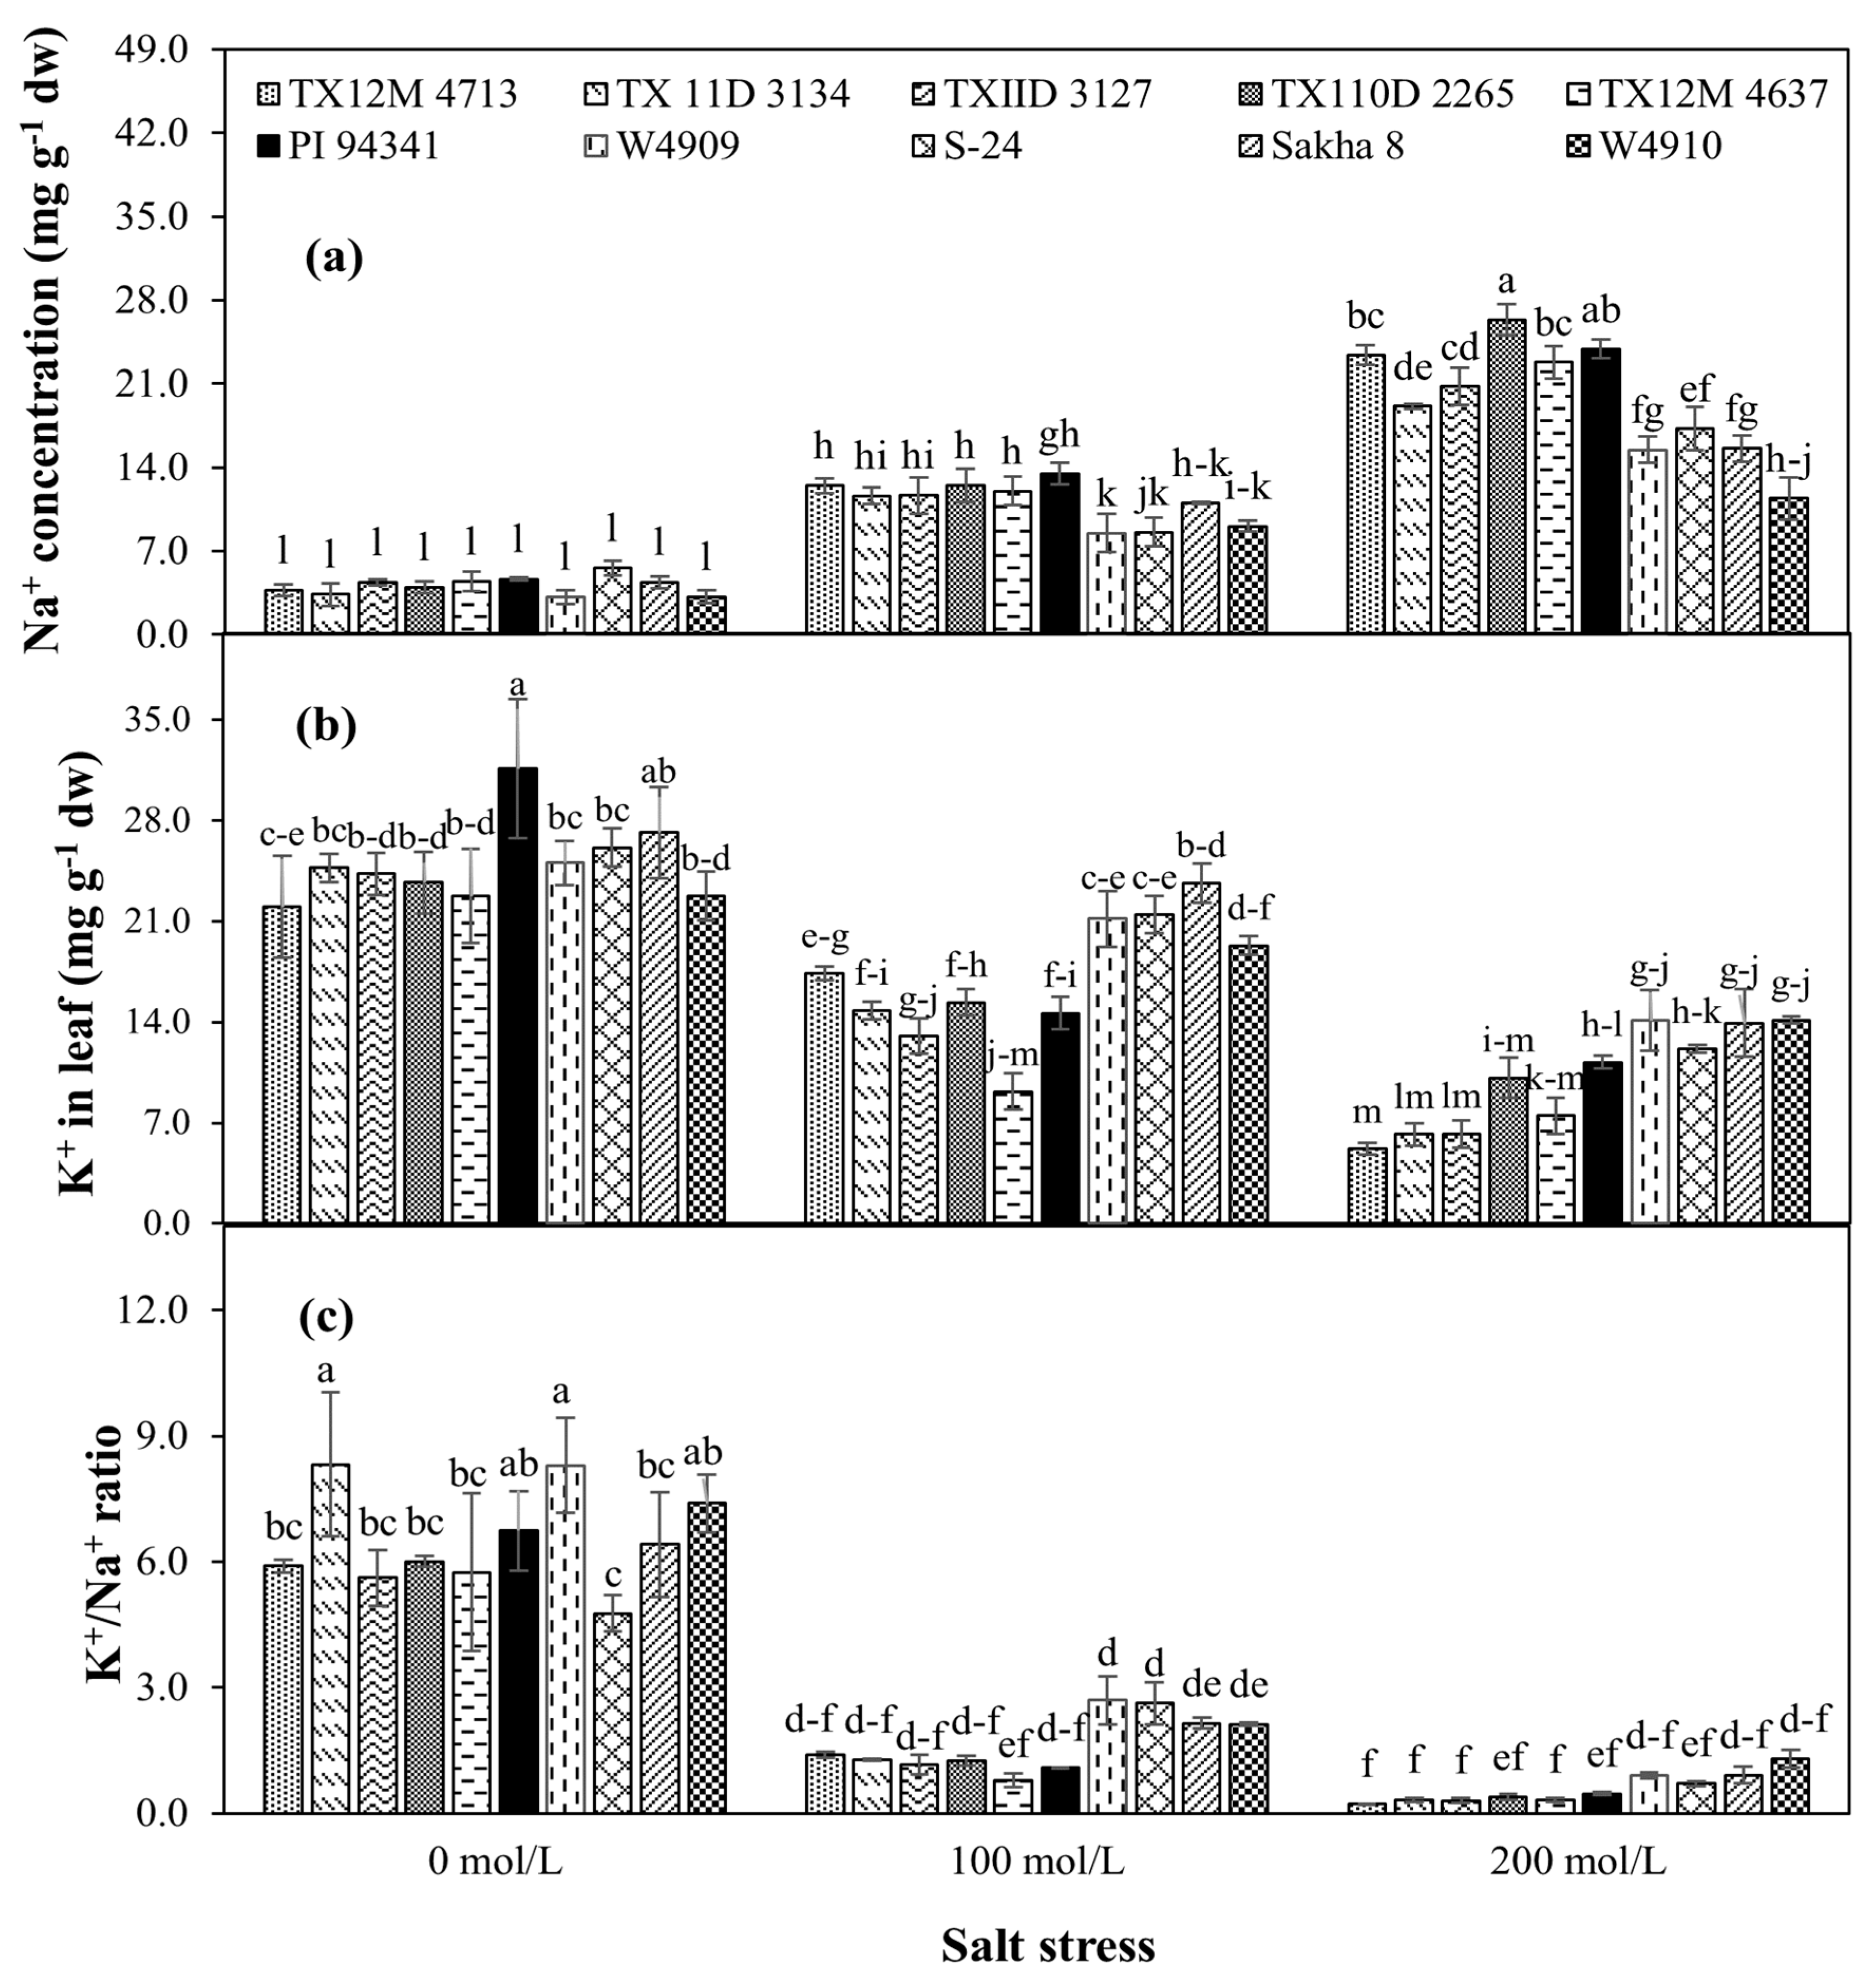
2.3. Leaf Na+ and K+ Contents

Significant variations in Na+ and K+ content were identified between the leaves of genotypes treated with salinity stress (Table 1; Figure 2a,b). Na+ concentration in leaves was increased in all wheat genotypes by increasing the salinity stress (Figure 2a,b). At 100 mol/L salinity stress, the minimum Na+ content in leaves was found in W4909 (8.51 mg g−1 DW; SW) followed by S-24 (8.59 mg g−1 DW; SW), W4910 (9.09 mg g−1 DW; SW), and Sakha 8 (11.03 mg g−1 DW; SW), respectively (Figure 2a). Genotypes W4910 (11.40 mg g−1 DW; SW), W4909 (15.48 mg g−1 DW; SW), Sakha 8 (15.58 mg g−1 DW; SW), and S-24 (11.40 mg g−1 DW; SW) performed better at accumulating low leaf Na+ at 200 mol/L salt stress and were considered to be salt tolerant. K+ concentrations in leaves were decreased in all wheat genotypes by increasing the salinity stress (Figure 2b). The maximum K+ concentration and K+/Na+ ratio were observed in Sakha 8 (23.67 mg g−1 DW; SW), followed by S-24 (21.46 mg g−1 DW; SW), W4909 (21.17 mg g−1 DW; SW), and W4910 (19.31 mg g−1 DW; SW), respectively (Figure 2b), at 100 mol/L. At the high salinity level (200 mol/L), W4910 (14.13 mg g−1 DW; SW), W4909 (14.12 mg g−1 DW; SW), Sakha 8 (213.94 mg g−1 DW; SW), and S-24 (12.12 mg g−1 DW; SW) genotypes performed better by accumulating more leaf K+ (Figure 2b). Furthermore, the K+/Na+ ratio was also decreased by increasing the salt stress in both wheat genotypes (Figure 2c).

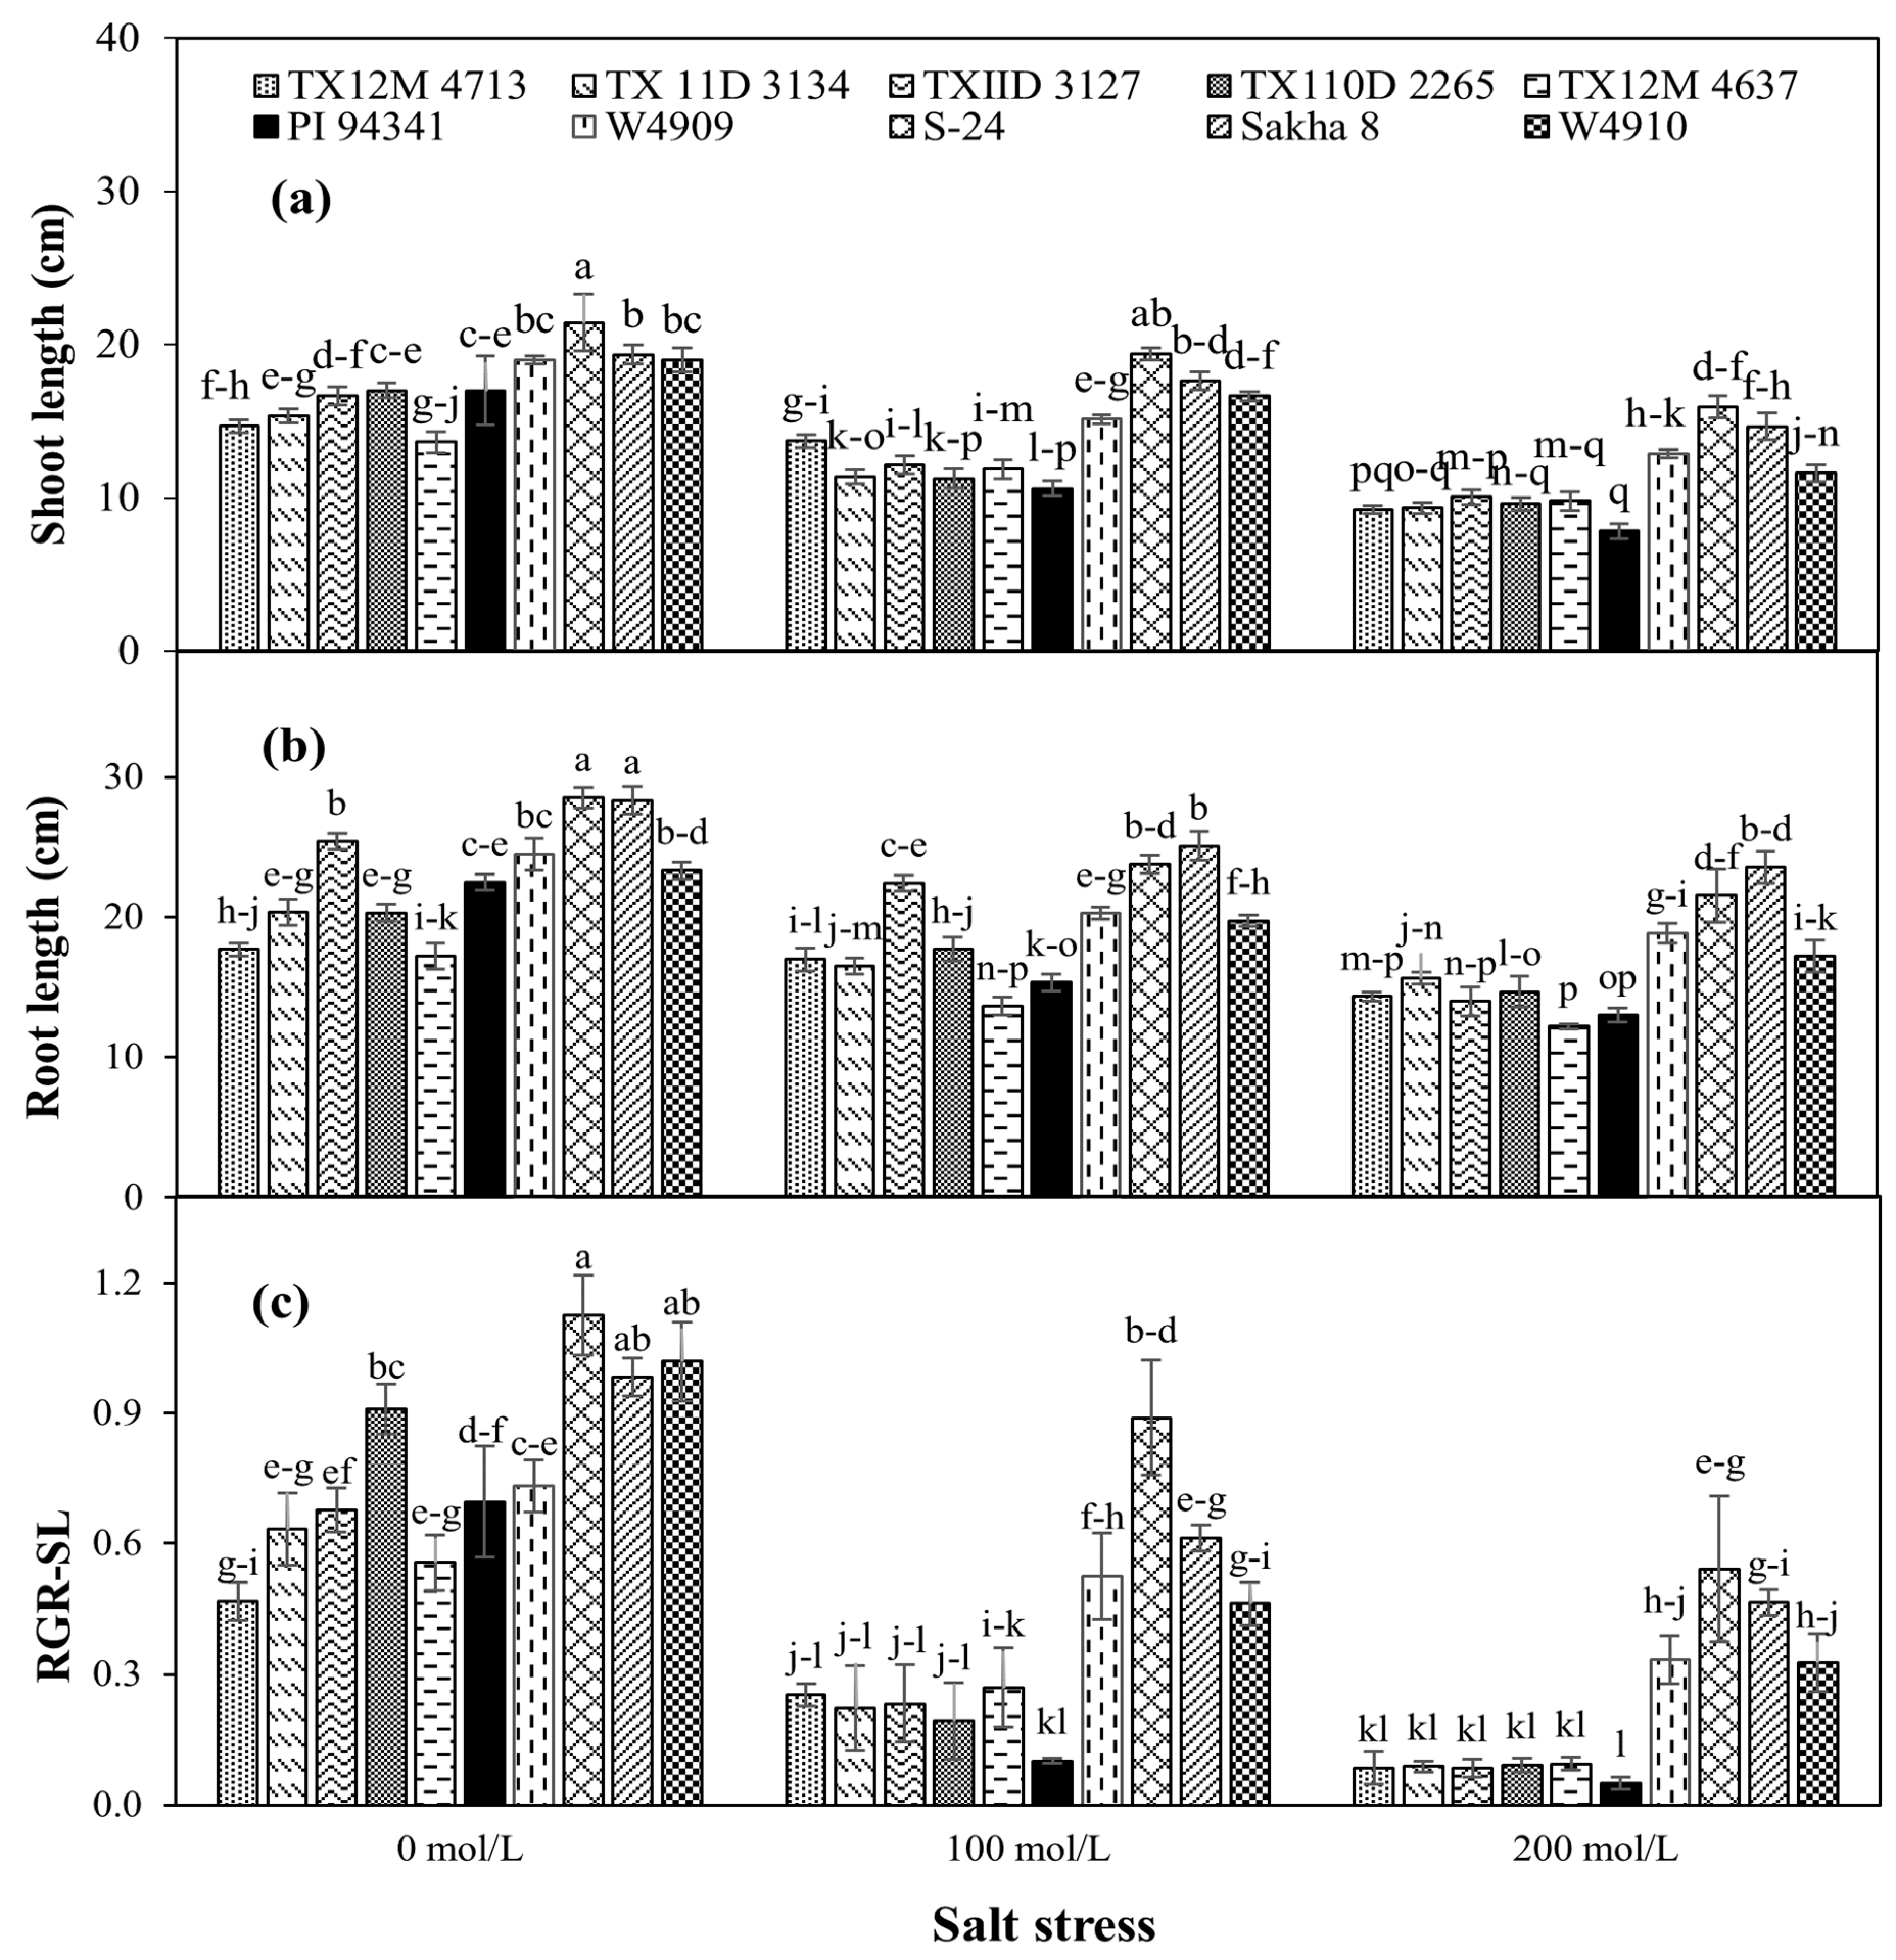
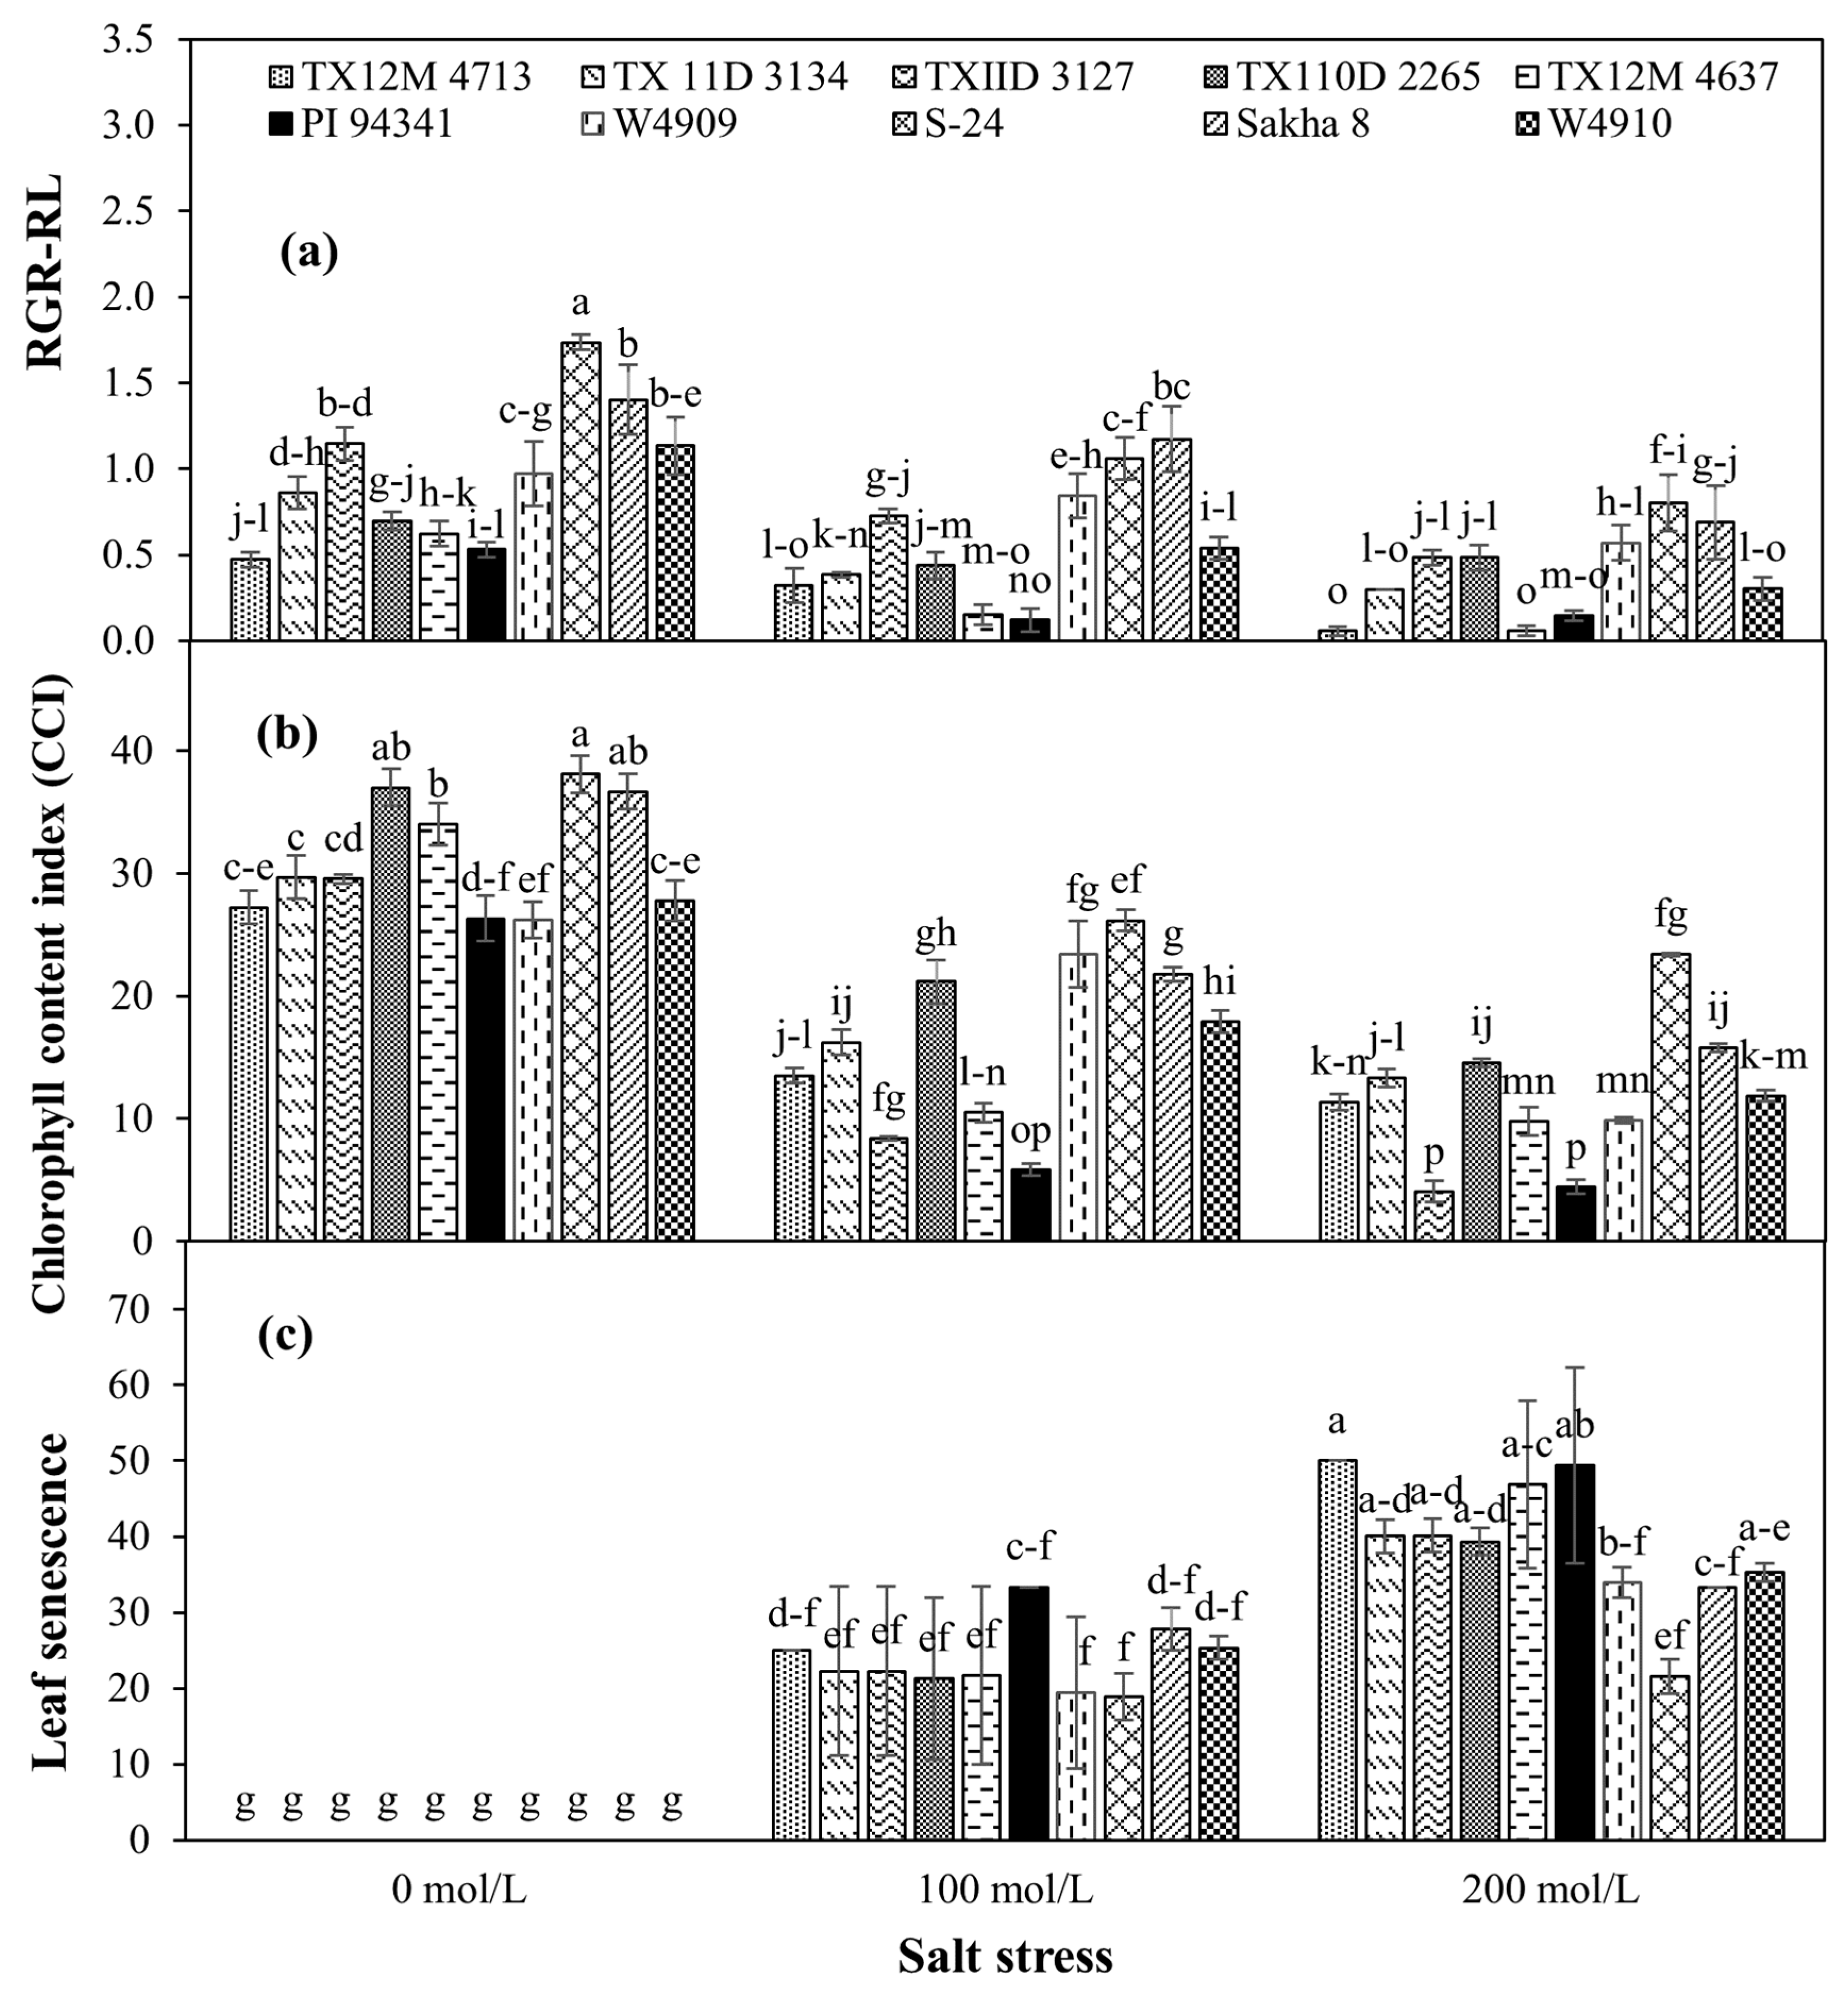
2.4. Shoot and Root Growth

Significant responses (p < 0.05) were observed for growth-related attributes among the genotypes for salt tolerance. Seedlings SL and RL were decreased by increasing the salt stress in all wheat genotypes (Figure 3a,b). Maximum SL were recorded in Sakha 8 (25.656 cm; SW), followed by S-24 (24.611 cm; SW), TXIID 3127 (22.611 cm; WW), W4909 (21.211 cm; SW), and W4910 (20.089 cm; SW), respectively (Figure 3a). The maximum RL was found in S-24 (18.917 cm; SW), followed by Sakha 8 (17.206 cm; SW), W4910 (15.741 cm; SW), and W4909 (15.663 cm; SW), respectively (Figure 3b).
Genotypes also showed significant variation in the RGR-SL and RGR-RL against salt stress level (Figure 3c and Figure 4a, respectively). Among the wheat genotypes, the maximum value of RGR-SL values was found in S-24 (1.20; SW), followed by Sakha 8 (1.08; SW), W4909 (0.79; SW), TXIID 3127 (0.78; WW), and W4910 (0.66; SW; Figure 3c). Meanwhile, the maximum RGR-RL values were recorded in S-24 (0.85; SW), followed by Sakha 8 (0.68; SW), W4910 (0.60; SW), and W4909 (0.53; SW), respectively (Figure 4a).

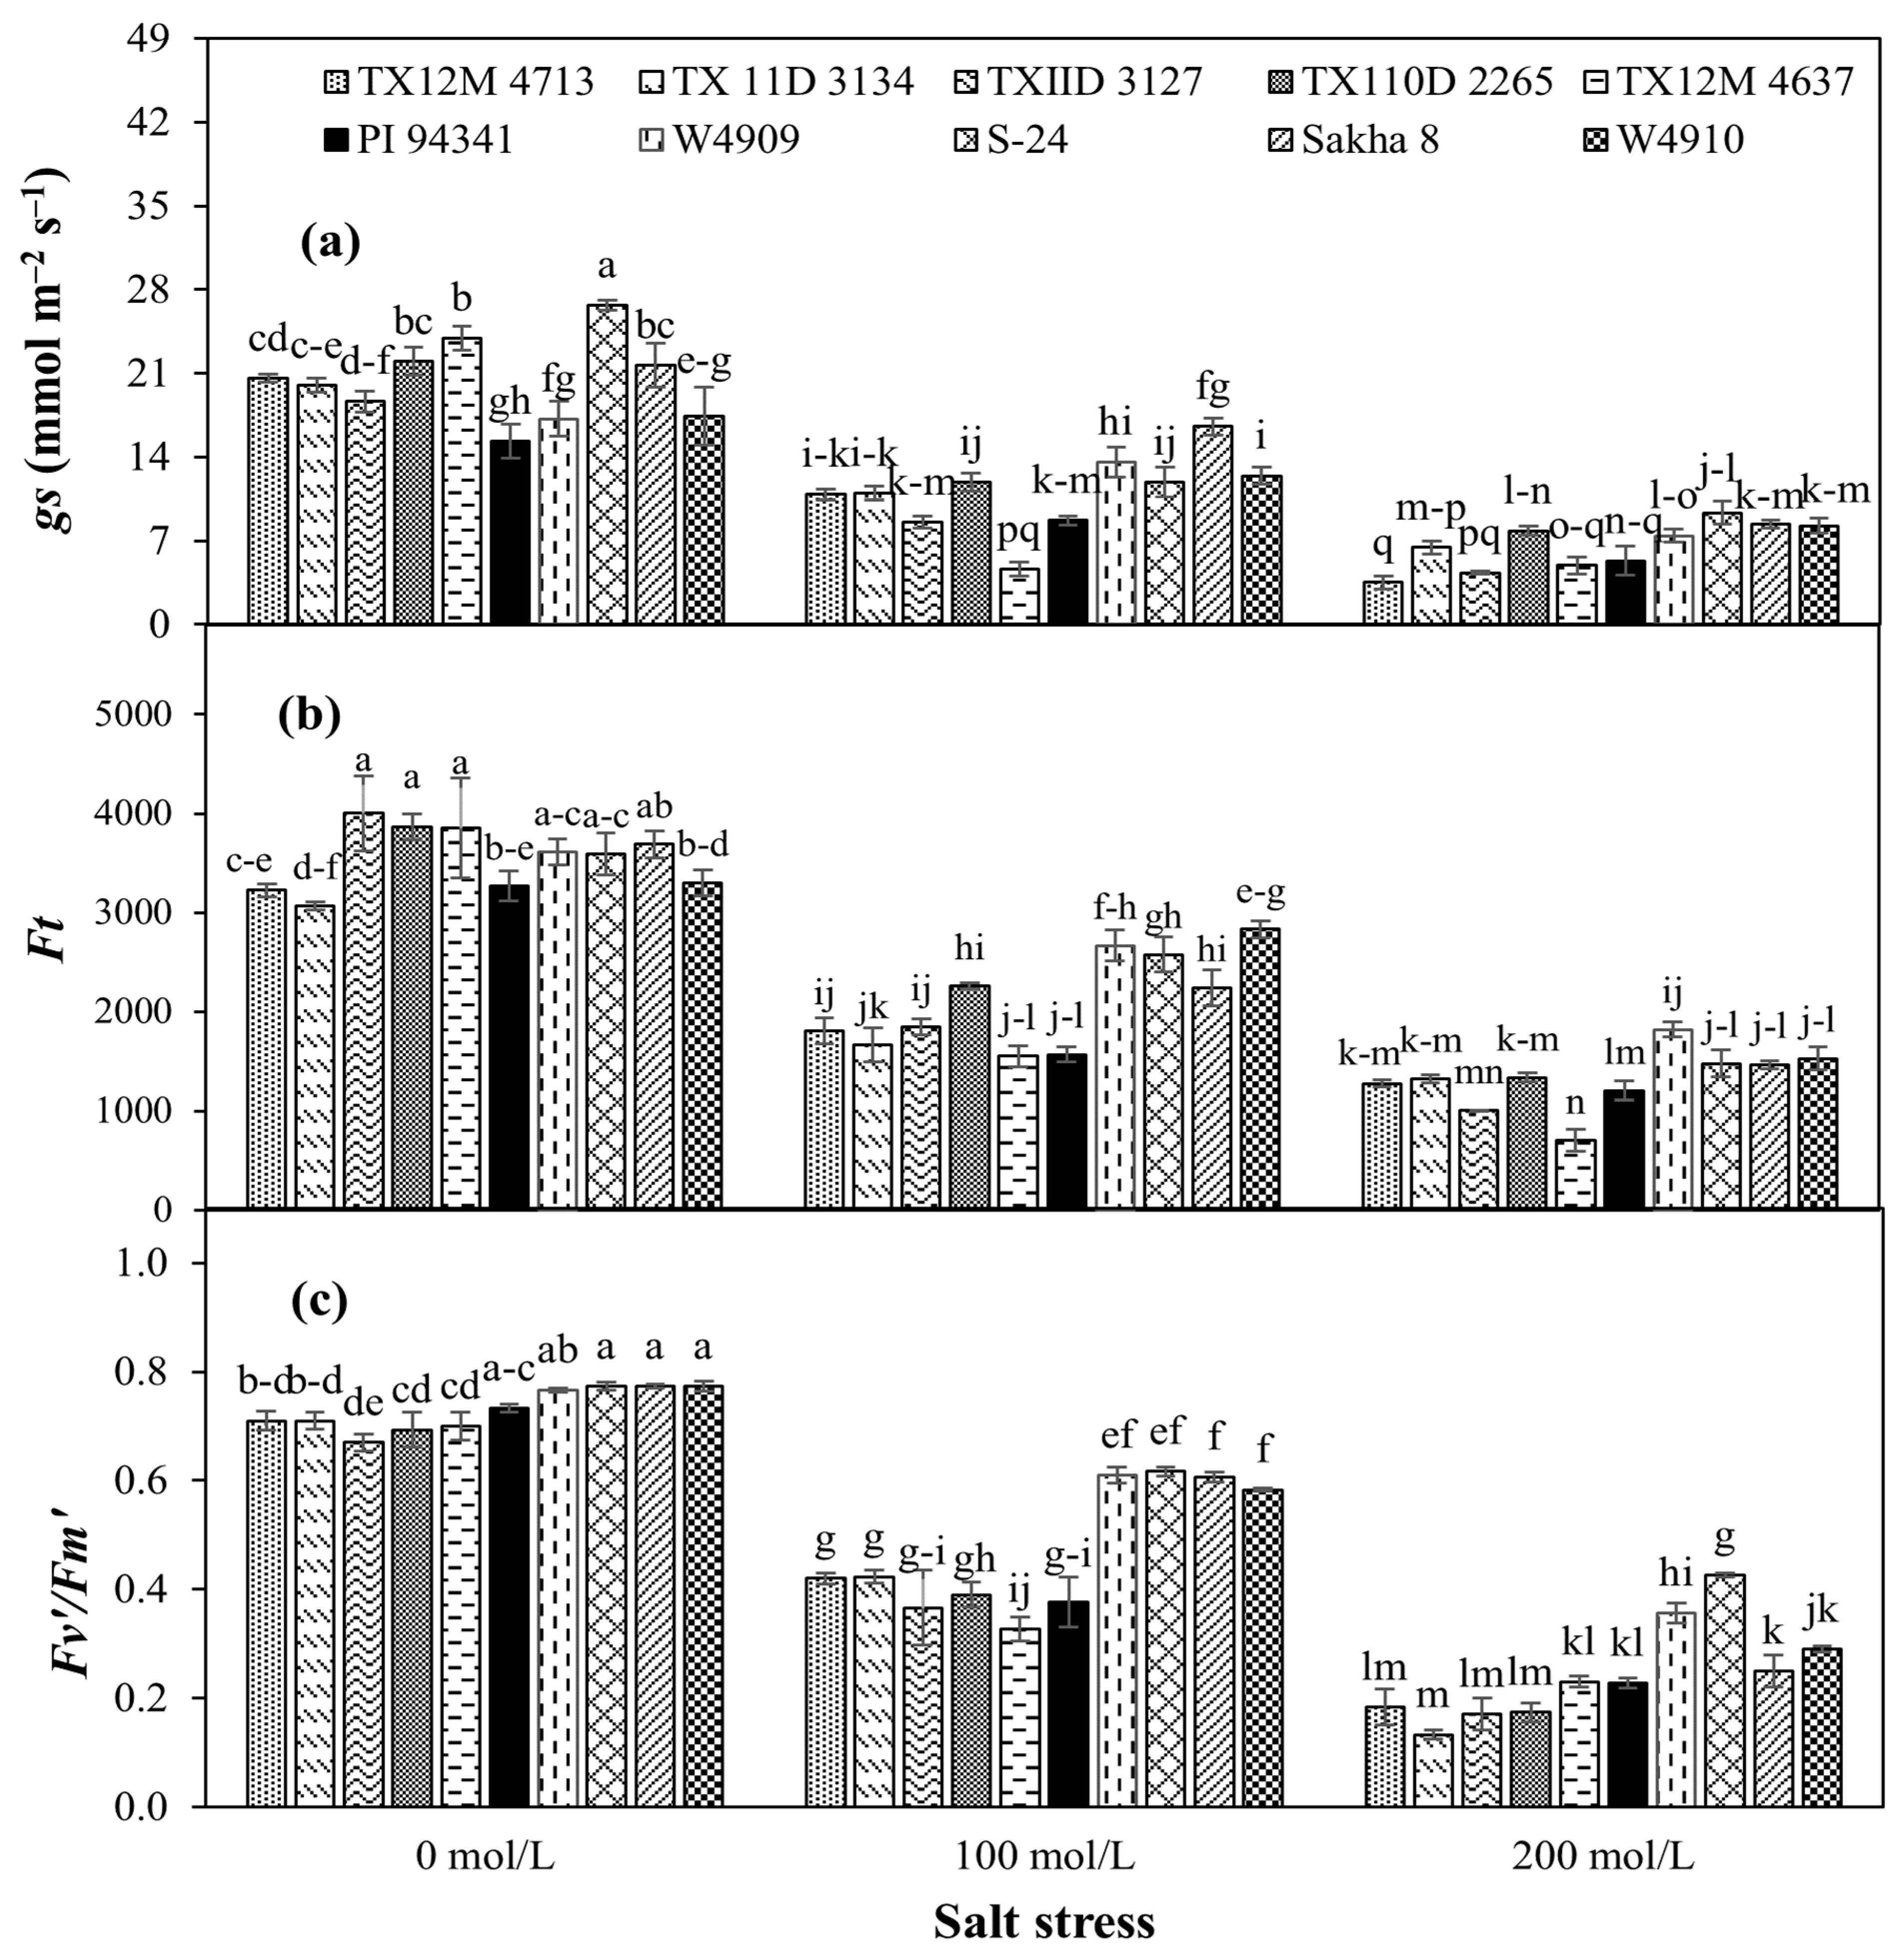
2.5. Physiological Traits

The CCI in all wheat genotypes decreased with increasing levels of salt stress (Figure 4b). Among the genotypes, the maximum CCI values were observed in S-24 (29.22; SW), followed by Sakha 8 (24.744; SW), TX110D 2265 (24.25; WW), W4909 (19.84; SW), and TX 11D 3134 (19.73; WW), respectively (Figure 4b).
A significant physiological response was observed among the genotypes for gs (Figure 5a). Genotype S-24 (15.98) showed the highest value of gs, followed by Sakha 8 (15.54), TX110D 2265 (13.91), W4909 (12.74), and W4910 (12.71; Figure 5a), whereas the minimum gs value was observed in PI 94341 (9.78) genotypes (Figure 5a).
The senescence of the leaves also increased in wheat genotypes by increasing the salinity stress, as shown in Figure 4c. The TX12M 4713 (26.22; WW) genotype showed the maximum leaf senescence, followed by PI 94341 (23.67; SW), TX12M 4637 (22.85; WW), TX 11D 3134 (20.86; WW), and TXIID 3127 (20.21; WW), respectively (Figure 4c).
Chlorophyll fluorescence, e.g., Fv/Fm′ and Ft values, declined under salt stress. There was a significant difference (p < 0.05) in chlorophyll fluorescence concerning genotypes, salinity level, and the interaction between genotypes × salinity level (Figure 5b,c).
A significant decrease in Ft was observed in all genotypes by increasing the salt stress level (Figure 5b). The maximum values of Ft were observed in W4909 (2700; SW), W4910 (2554.3; SW), S-24 (2547.3; SW), TX110D 2265 (2486.6; WW), and Sakha 8 (2464.3; SW), respectively (Figure 5b). Fv/Fm′ decreased in wheat genotypes with increasing levels of salt stress (Figure 5c). The maximum values of Fv/Fm′ were observed in S-24 (0.6056; SW), followed by W4909 9 (0.5778; SW), W4910 (0.5489; SW), Sakha 8 (0.5433; SW), and PI 94341 (0.4324; SW; Figure 5c).

2.6. Trait Correlations

A highly significant correlation was observed among the various traits under salt stress (Table 2). All traits were positively correlated except Na+ and the senescence of leaves, which were negatively correlated with all other attributes (Table 2). Na+ was positively correlated with the senescence of leaves (Table 2).

3. Discussion

Salt stress induces a number of negative effects including physiological and biochemical changes in plants which manifest as a reduction in plant biomass and crop yield. Different plants have different tolerance levels, as do most cereals, including wheat [17]. In the present study, five genotypes of winter wheat and five genotypes of summer wheat were considered in order to carry out a comparative study on the salt tolerance of new genotypes, with the exception of the S-24 genotype already extensively studied by Ashraf [31], that is better suited to grow on salinized soils. Overall, the results showed different responses between summer and winter genotypes in terms of physiological traits (Figure 1). Under salinity stress, all genotypes accumulated a higher Na+ content in their leaves compared with non-stress conditions (Figure 2a). However, the sodium uptake in leaves was different in spring and winter wheat (Figure 1a). Winter wheat accumulated more sodium compared with spring wheat (Figure 1a). Most of the salt-excluder genotypes were previously recognized as salt-tolerant by many scientists [32,33,34], which is further confirmed by this study’s results (Figure 1a and Figure 2a). The salt-tolerant genotypes may possess a better ability to maintain low Na+ in their leaves, as reported by Elkelish et al. [35]. Saddiq et al. [32] reported that tolerant genotypes preferred to accumulate low Na and high K in their leaves, which was also observed in this study (Figure 1a,b and Figure 2a,b). Munns and Tester [10] reported that the removal of Na+ from the cytoplasm into the apoplast is due to the salt-inducible enzyme Na+/H+ antiporter located at the plasma membrane. Moreover, Na+ accumulation in wheat is controlled by Nax1 and Nax2 genes, located on 2A and 5A chromosomes, respectively [36,37], which are being used as molecular marker cultivars in a breeding program. TNHX1, TNHX2, and TVP1 (vascular Na+/H+ antiporter) are responsible for improved seedling shoot growth by generating the pH gradient and facilitating sodium sequestration into values under salt stress [38]. Furthermore, salt-tolerant genotypes could have a sophisticated K+ regulation system, such as two-pore K+ channels and a shaker type, as described by Shabala and Pottosin [39], and on-selective cation channels, which aid the permeability of K+ and transporters (HKT, KUP/HAK/KT, and K+/H+). An inverse relationship exists between Na+ and K+ ions due to direct competition for ions in plant absorption [40].
The plants’ growth performance was also decreased under salt stress conditions (Figure 1e–g, Figure 3a–c, and Figure 4a). All genotypes had lower shoot lengths and root lengths in salt-stressed conditions compared with controls (Figure 3a–c and Figure 4a). Nevertheless, spring wheat genotypes improved their RGR-SL compared with winter wheat genotypes (Figure 1g). Janmohammadi et al. [41] reported that winter wheat had a lower root length than spring wheat under abiotic stress (e.g., cold stress), ultimately affecting the wheat’s growth performance. NaCl stress induced a significant reduction in plant height, root length, and dry weight of roots and shoots in winter wheat [42]. Qiong et al. [43] reported that salinity significantly increased Na accumulation in winter wheat, which significantly reduced shoot dry weight and plant height. Na remarkably reduced the accumulation of K+, K+/Na+ ratio, as well soluble proteins and proline. Brestic et al. [44] reported that chlorophyll fluorescence is a more effective method for screening PSII thermostability in winter wheat genotypes. A high concentration of salt in the soil causes water stress, which leads to a significant decrease in the yield of many crops worldwide. Zivcak et al. [45] reported that the photosynthesis efficiency of PSI of winter wheat was decreased by increasing the water stress. Damage caused by salt stress was more prominent at the donor side, rather than the acceptor side of PSII [46]. Munns and Tester [10] reported that the accumulation of Na+ at toxic concentrations in the leaf negatively affects the photosynthetic mechanism, resulting in a lower intake of carbohydrates to the young leaf, reducing root and shoot growth. Thus, spring wheat was considered a tolerant crop, with a greater supply of assimilates from leaves to growing parts, e.g., root and shoot length (Figure 3a–b). This might be linked with prolonged retention of chlorophyll in the leaves of spring wheat (Figure 1l and Figure 5b), which could stamp out Na+ from leaves, and thereby prevent Na+ from reaching toxic levels [41]. Poor performance in terms of growth might be linked with high cell membrane injury and senescence of leaves due to Na+ toxicity in growing embryos [4,39,47,48], and this suggestion is supported by the present study (Figure 1d and Figure 4c).
Salt stress has an adverse impact on photosynthesis by destroying chlorophyll pigments and inhibiting the PSII activity. In this study, photosynthesis efficiency declined in both winter and spring wheat genotypes under salt-stress conditions (Figure 5b,c), but winter wheat was more affected (Figure 1j,k). In fact, under saline stress, stomal closing results in a reduction in the photosynthetic rate of the plant. CO2 assimilation in leaves, the efficiency of PSII, and their relationship allow fluorescence to be used to screen salt-tolerant germplasm against abiotic stresses [49]. Kanwal and his coworkers [26] evaluated the effects of salt stress on newly licensed wheat cultivars using gas exchange parameters and chlorophyll fluorescence. The results reported a smaller reduction in plant biomass in cultivars S-24, Saher-226, and FSD-2008.
Measuring chlorophyll fluorescence is an excellent indicator to quantify salt-induced destruction in the photosynthetic apparatus [50]. Damage to photosystem II has been studied using this technique. Reactive oxygen species (ROS) degrade various proteins (a membrane linker protein, chlorophyll protein) that are necessary for the hooking of phycobilisomes to thylakoids [35,46]. ROS burst destroys thylakoid membranes, resulting in modulations in membrane protein profiles, which leads to decreased activity of the oxygen-evolving complex (OEC) of PS II and increases the working of PS I. Salt-tolerant plants grown under a salt regime downregulate PS II in order to improve the quantum efficiency of excitation energy (Fv/Fm′) [50], as found in this study (Figure 1j,k). The maximum quantum yield of PSII, i.e., Fv/Fm′, is an important parameter to discriminate wheat genotypes. Of the different physiological attributes, stomatal conductance and the chlorophyll content index have been reported to be of prime importance in screening crop plants for salt tolerance. Generally, salt stress is known to cause a marked reduction in stomatal conductance and the chlorophyll content index [35,51], as found in this study (Figure 1i,l; Figure 4b and Figure 5a). ROS are regarded as the main source of structural damages under abiotic stresses such as drought, salinity, and heat [52]. ROS are highly cytotoxic and can seriously react with vital biomolecules such as lipids, proteins, nucleic acid, and disturb normal metabolic pathways [52,53]. It has been well documented that during salinity stress, somatically stressed plants reduced CO2 assimilation due to the closing of stomatal pores, which generate ROS in the plant leaves [54]. In this study, spring wheat exhibited comparatively lower reductions in stomatal conductance and chlorophyll content index compared with winter wheat under salt stress (Figure 1i,l). The reduction in winter wheat might have been due to lower root water potential and the transport of plant hormone ABA from the root into different plant organs, thereby inducing stomatal closure [55]. Compared with spring wheat, winter wheat was more affected (Figure 1), which might be strongly linked with high Na levels in their leaves. The toxic concentration of Na+ in leaves encourages the reduction of stomatal conductance in wheat by limiting photosynthesis efficiency [32,47]. Abiotic stress conditions caused by exposure to salinity, drought, heat, and waterlogging cause the stressed plant to produce ROS. The plant also produces antioxidants, flavonoids, and secondary metabolites that detoxify the ROS, thus protecting the plant from abnormal conditions, i.e., abiotic stress [52,53,56]. Therefore, tolerant genotypes prefer to accumulate high K+ instead of Na+ [57]. In this study, the influx of K+ was higher in spring wheat compared with winter wheat, helping to mitigate the salinity stress. Over time, salinity causes Na+ toxicity in leaves [10]. Therefore, controlling the transport of Na+ in the plant through the exclusion of Na+ from mesophyll cells is an important and reliable trait used to improve the salinity tolerance in many crops, i.e., durum wheat [58] and bread wheat [32,59].

4. Materials and Methods

4.1. Germplasm Collection

Seeds of five winter and five spring wheat genotypes (Table 3) were obtained from the USDA-ARS National Small Grains Collection, Aberdeen, ID, USA.

4.2. Hydroponic Culture

A germplasm nursery (5 spring and 5 winter wheat genotypes) was raised in November 2015 in a growth chamber by sowing 50 seeds in 8 cm × 6 cm sand-filled polythene bags at 50% relative humidity and a light intensity of 400 mol m−2s−1. Plants were grown with a 14-h day length and with a 20 °C/17 °C day/night temperature cycle. Fifteen plants per genotype, replicated three times, were transplanted at the two-leaf stage into hydroponic tubs filled with 50 L of aerated half-strength Hoagland solution, which was changed fortnightly [60]. Seedling root length and shoot length were also recorded before being transplanted. The experimental design was a completely randomized design (CRD) factorial with three replications. Subsequently, commercial-grade salt was added in 50 mol/L increments twice daily to create different NaCl salt stress levels (0, 100, and 200 mol/L) to avoid osmotic shock.

4.3. Determination of Leaf Na+ and K+ Concentrations

After applying the salt in hydroponic culture, the expanded leaves that emerged under stress conditions were collected and put into the oven for drying. Leaf dry weight was determined. Dried leaves were put into falcon tubes filled with 25 mL of 1% HNO3 solution for digestion on a hot plate at 85 °C for 4 h. One milliliter was taken from the digested solution, and a volume of 10 mL was prepared to measure the K+ and Na+ concentration in the leaf samples using a flame photometer (Sherwood, U.K., Model 360) [58,61].

4.4. Morphological Traits

After 10 days in a saline environment, the performance of seedlings was assessed based on morphological traits such as seedling root length (RL), shoot length (SL), the relative growth rate of root length (RGR-RL), and the relative growth rate of shoot length (RGR-SL). The relative growth rate was calculated using the formula of Gardener et al. [62].
RGR = W2 − W1/T2 − T1
where:
W1 = root/shoot length at first harvest
W2 = root/shoot length at second harvest
T2 − T1 = time interval between two harvests (10 days)

4.5. Chlorophyll Index and Stomatal Conductance

From the seedlings in a saline environment, the topmost fully expanded leaf was used to determine the chlorophyll index using a chlorophyll meter (Model Spad-502) [63]. Stomatal conductance was measured using a leaf photometer (Model Sc−1).

4.6. Chlorophyll Fluorescence

The data for the chlorophyll fluorescence were recorded based on Baker [64] and Krame et al. [65] nomenclature. Chlorophyll fluorescence parameters, i.e., instantaneous chlorophyll fluorescence (Ft) and quantum yield of photosystem II (QY), were recorded by using the portable fluorescence meter, FluorPen FP 110 (Photon systems instruments, Czech Republic). The FluorPen FP 110 was equipped with a blue LED emitter (470 nm) optically filtered and precisely focused on delivering light intensities of up to 3000 µmol m−2 s−1 to measure plant tissues. QY is a measure of the Photosystem II efficiency. QY is equivalent to Fv/Fm′ and F0 is equivalent to Ft in a light-adapted leaf. Quantum yield of PSII (Fv/Fm′) was calculated as
Fv′/Fm′ = Fm F0′/Fm
where
F0′ or Ft: minimum fluorescence from a light-adapted leaf
Fm′: maximum fluorescence from a light-adapted leaf
Fv′: variable fluorescence from a light-adapted leaf (Fv′ = Fm′ − F0′)

4.7. Leaf Senescence

Three random plants in each treatment were tagged. At harvesting time, the total number of leaves and the number of green and senesced leaves were counted. A leaf was considered senesced if less than half of its area remained green.

4.8. Statistical Analysis

Quantitative observations of experiments were uploaded in SAS 9.4 (Texas A&M University, College Station, TX, USA) software to deduce the results in the form of variance analysis (ANOVA) for spring wheat genotypes, winter wheat genotypes, and all wheat genotypes. Data are presented in Table 1 with critical values to compare treatment means using the LSD test at the 5% probability level. The Statistix 8.1 package was also used to find correlations among the spring wheat genotypes, winter wheat genotypes, and all wheat genotypes for various growth, ionic, and physiological attributes (Table 2).

5. Conclusions

In this study, physiological comparisons of wheat genotypes under salt regimes Sakha 8, S-24, W4909, and W4910 performed better compared with PI 94341, TX12M 4713, and TX12M 4637, depicted by improved seedling growth, CCI, which was linked with better physiology traits, i.e., Fv/Fm′; Ft and gs due to preferential K+ uptake and translocation to leaves. The identified plant material can be a source for more deeper insight into determining the genes responsible for enhanced salt tolerance in wheat.

Author Contributions

Conceptualization, M.S.S. and A.M.H.I.; formal analysis, S.I., M.B.H. and A.R.; investigation, M.S.S.; writing—original draft preparation, M.B.H., A.R., E.M.F., H.B. and J.; writing—review and editing, A.R., M.B.H., M.S.S. and A.M.H.I.; review—final draft preparation, A.R., M.B.H., M.S.S. and A.M.H.I.; proofreading, review and editing, P.W. and L.F.C. All authors have read and agreed to the published version of the manuscript.

Funding

This research received no external funding.

Institutional Review Board Statement

Not applicable.

Informed Consent Statement

Not applicable.

Data Availability Statement

Not applicable.

Conflicts of Interest

The authors declare no conflict of interest.

References

  1. Wasaya, A.; Manzoor, S.; Yasir, T.A.; Sarwar, N.; Mubeen, K.; Ismail, I.A.; Raza, A.; Rehman, A.; Hossain, A.; EL Sabagh, A. Evaluation of Fourteen Bread Wheat (Triticum aestivum L.) Genotypes by Observing Gas Exchange Parameters, Relative Water and Chlorophyll Content, and Yield Attributes under Drought Stress. Sustainability 2021, 13, 4799. [Google Scholar] [CrossRef]
  2. Bhusal, N.; Han, S.-G.; Yoon, T.-M. Impact of drought stress on photosynthetic response, leaf water potential, and stem sap flow in two cultivars of bi-leader apple trees (Malus× domestica Borkh.). Sci. Hortic. 2019, 246, 535–543. [Google Scholar] [CrossRef]
  3. Woodrow, P.; Pontecorvo, G.; Ciarmiello, L.F.; Annunziata, M.G.; Fuggi, A.; Carillo, P. Transcription factors and genes in abiotic stress. In Crop Stress and Its Management: Perspectives and Strategies; Springer: Dordrecht, The Netherlands, 2012; pp. 317–357. [Google Scholar]
  4. Alamri, S.; Hu, Y.; Mukherjee, S.; Aftab, T.; Fahad, S.; Raza, A.; Ahmad, M.; Siddiqui, M.H. Silicon-induced postponement of leaf senescence is accompanied by modulation of antioxidative defense and ion homeostasis in mustard (Brassica juncea) seedlings exposed to salinity and drought stress. Plant Physiol. Biochem. 2020, 157, 47–59. [Google Scholar] [CrossRef]
  5. Hafeez, M.B.; Raza, A.; Zahra, N.; Shaukat, K.; Akram, M.Z.; Iqbal, S.; Basra, S.M.A. Gene regulation in halophytes in conferring salt tolerance. In Handbook of Bioremediation; Elsevier: Amsterdam, The Netherlands; Academic Press: Cambridge, MA, USA, 2021; pp. 341–370. [Google Scholar]
  6. Raza, A. Eco-physiological and Biochemical Responses of Rapeseed (Brassica napus L.) to Abiotic Stresses: Consequences and Mitigation Strategies. J. Plant Growth Regul. 2020. [Google Scholar] [CrossRef]
  7. Mahmood, Q.; Bilal, M.; Jan, S. Herbicides, pesticides, and plant tolerance: An overview. Emerg. Technol. Manag. Crop. Stress Toler. 2014, 423–448. [Google Scholar]
  8. Viehweger, K. How plants cope with heavy metals. Bot. Stud. 2014, 55, 1–12. [Google Scholar] [CrossRef] [PubMed] [Green Version]
  9. Shahid, S.A.; Zaman, M.; Heng, L. Soil salinity: Historical perspectives and a world overview of the problem. In Guideline for Salinity Assessment, Mitigation and Adaptation Using Nuclear and Related Techniques; Springer: Cham, Switzerland, 2018; pp. 43–53. [Google Scholar]
  10. Munns, R.; Tester, M. Mechanisms of salinity tolerance. Annu. Rev. Plant Biol. 2008, 59, 651–681. [Google Scholar] [CrossRef] [PubMed] [Green Version]
  11. Akhtar, J.; Zahid, M.; Parveen, S.; Naseem, A. Salt-tolerance of Wheat (Triticum aestivum L.) Genotypes: A Lysimeter Study. Pak. J. Biol. Sci. 2000, 3, 1627–1629. [Google Scholar] [CrossRef]
  12. Salim, N.; Raza, A. Nutrient use efficiency (NUE) for sustainable wheat production: A review. J. Plant Nutri. 2020, 43, 297–315. [Google Scholar] [CrossRef]
  13. Zahra, N.; Mahmood, S.; Raza, Z.A. Salinity stress on various physiological and biochemical attributes of two distinct maize (Zea mays L.) genotypes. J. Plant Nutr. 2018, 41, 1368–1380. [Google Scholar] [CrossRef]
  14. Javaid, T.; Farooq, M.A.; Akhtar, J.; Saqib, Z.A.; Anwar-ul-Haq, M. Silicon nutrition improves growth of salt-stressed wheat by modulating flows and partitioning of Na+, Cl− and mineral ions. Plant Physiol. Biochem. 2019, 141, 291–299. [Google Scholar] [CrossRef]
  15. Yadav, T.; Kumar, A.; Yadav, R.; Yadav, G.; Kumar, R.; Kushwaha, M. Salicylic acid and thiourea mitigate the salinity and drought stress on physiological traits governing yield in pearl millet-wheat. Saudi J. Biol. Sci. 2020, 27, 2010–2017. [Google Scholar] [CrossRef]
  16. Iqbal, S.; Basra, S.M.; Afzal, I.; Wahid, A.; Saddiq, M.S.; Hafeez, M.B.; Jacobsen, S.E. Yield potential and salt tolerance of quinoa on salt-degraded soils of Pakistan. J. Agron. Crop Sci. 2019, 205, 13–21. [Google Scholar] [CrossRef] [Green Version]
  17. Ami, K.; Planchais, S.; Cabassa, C.; Guivarc’h, A.; Véry, A.-A.; Khelifi, M.; Djebbar, R.; Abrous-Belbachir, O.; Carol, P. Different proline responses of two Algerian durum wheat cultivars to in vitro salt stress. Acta Physiol. Plant. 2020, 42, 1–16. [Google Scholar] [CrossRef]
  18. Shiferaw, B.; Smale, M.; Braun, H.-J.; Duveiller, E.; Reynolds, M.; Muricho, G. Crops that feed the world 10. Past successes and future challenges to the role played by wheat in global food security. Food Sec. 2013, 5, 291–317. [Google Scholar] [CrossRef] [Green Version]
  19. Chaves, M.S.; Martinelli, J.A.; Wesp-Guterres, C.; Graichen, F.A.S.; Brammer, S.P.; Scagliusi, S.M.; da Silva, P.R.; Wiethölter, P.; Torres, G.A.M.; Lau, E.Y. The importance for food security of maintaining rust resistance in wheat. Food Sec. 2013, 5, 157–176. [Google Scholar] [CrossRef] [Green Version]
  20. Becker-Reshef, I.; Justice, C.; Barker, B.; Humber, M.; Rembold, F.; Bonifacio, R.; Zappacosta, M.; Budde, M.; Magadzire, T.; Shitote, C. Strengthening agricultural decisions in countries at risk of food insecurity: The GEOGLAM Crop Monitor for Early Warning. Remote Sens. Environ. 2020, 237, 111553. [Google Scholar] [CrossRef]
  21. Aslam, M.; Prathapar, S.A.; Aslam, M.; Prathapar, S. Strategies to Mitigate Secondary Salinization in the Indus Basin of Pakistan: A Selective Review; Research Report 97; International Water Management Institute (IWMI): Colombo, Sri Lanka, 2006; p. 33. ISBN 92-9090-616-2. [Google Scholar]
  22. Woodrow, P.; Ciarmiello, L.F.; Annunziata, M.G.; Pacifico, S.; Iannuzzi, F.; Mirto, A.; D'Amelia, L.; Dell’Aversana, E.; Piccolella, S.; Fuggi, A. Durum wheat seedling responses to simultaneous high light and salinity involve a fine reconfiguration of amino acids and carbohydrate metabolism. Physiol. Plant. 2017, 159, 290–312. [Google Scholar] [CrossRef]
  23. Oyiga, B.C.; Sharma, R.; Shen, J.; Baum, M.; Ogbonnaya, F.; Léon, J.; Ballvora, A. Identification and characterization of salt tolerance of wheat germplasm using a multivariable screening approach. J. Agron. Crop Sci. 2016, 202, 472–485. [Google Scholar] [CrossRef]
  24. Raza, A.; Charagh, S.; Sadaqat, N.; Jin, W. Arabidopsis thaliana: Model Plant for the Study of Abiotic Stress Responses. In The Plant Family Brassicaceae; Springer: Singapore, 2020; pp. 129–180. [Google Scholar]
  25. Li, M.; Yang, Y.; Raza, A.; Yin, S.; Wang, H.; Zhang, Y.; Dong, J.; Wang, G.; Zhong, C.; Zhang, H. Heterologous expression of Arabidopsis thaliana rty gene in strawberry (Fragaria× ananassa Duch.) improves drought tolerance. BMC Plant Biol. 2021, 21, 1–20. [Google Scholar] [CrossRef] [PubMed]
  26. Kanwal, H.; Ashraf, M.; Shahbaz, M. Assessment of salt tolerance of some newly developed and candidate wheat (Triticum aestivum L.) cultivars using gas exchange and chlorophyll fluorescence attributes. Pak. J. Bot. 2011, 43, 2693–2699. [Google Scholar]
  27. Allakhverdiev, S.I.; Sakamoto, A.; Nishiyama, Y.; Inaba, M.; Murata, N. Ionic and osmotic effects of NaCl-induced inactivation of photosystems I and II in Synechococcus sp. Plant Physiol. 2000, 123, 1047–1056. [Google Scholar] [CrossRef] [Green Version]
  28. Genc, Y.; Oldach, K.; Taylor, J.; Lyons, G.H. Uncoupling of sodium and chloride to assist breeding for salinity tolerance in crops. New Phytol. 2016, 210, 145–156. [Google Scholar] [CrossRef] [PubMed] [Green Version]
  29. Genc, Y.; Mcdonald, G.K.; Tester, M. Reassessment of tissue Na+ concentration as a criterion for salinity tolerance in bread wheat. Plant Cell Environ. 2007, 30, 1486–1498. [Google Scholar] [CrossRef] [PubMed]
  30. Bhutta, W.M.; Hanif, M. Genetic variability of salinity tolerance in spring wheat (Triticum aestivum L.). Acta Agric. Scand. Section B Soil Plant Sci. 2010, 60, 256–261. [Google Scholar]
  31. Ashraf, M. Registration of ‘S-24’Spring Wheat with Improved Salt Tolerance. J. Plant Regis. 2010, 4, 34–37. [Google Scholar] [CrossRef]
  32. Saddiq, M.S.; Afzal, I.; Basra, S.M.; Ali, Z.; Ibrahim, A.M. Sodium exclusion is a reliable trait for the improvement of salinity tolerance in bread wheat. Arch. Agron. Soil Sci. 2018, 64, 272–284. [Google Scholar] [CrossRef]
  33. Majeed, A.; Haq, M.; Niaz, A.; Mahmood, A.; Ahmad, N.; Khan, H. Comparison of Soil and Hydroponic Based Screening Process to Select Salt Tolerant Wheat Varieties. Sarhad J. Agric. 2019, 35, 1107–1112. [Google Scholar] [CrossRef]
  34. Mahboob, W.; Khan, M.A.; Shirazi, M.U.; Mumtaz, S.; Shereen, A. Using growth and ionic contents of wheat seedlings as rapid screening tool for salt tolerance. J. Crop Sci. Biotechnol. 2018, 21, 173–181. [Google Scholar] [CrossRef]
  35. Elkelish, A.A.; Soliman, M.H.; Alhaithloul, H.A.; El-Esawi, M.A. Selenium protects wheat seedlings against salt stress-mediated oxidative damage by up-regulating antioxidants and osmolytes metabolism. Plant Physiol. Biochem. 2019, 137, 144–153. [Google Scholar] [CrossRef]
  36. James, R.A.; Davenport, R.J.; Munns, R. Physiological characterization of two genes for Na+ exclusion in durum wheat, Nax1 and Nax2. Plant Physiol. 2006, 142, 1537–1547. [Google Scholar] [CrossRef] [Green Version]
  37. James, R.A.; Blake, C.; Byrt, C.S.; Munns, R. Major genes for Na+ exclusion, Nax1 and Nax2 (wheat HKT1; 4 and HKT1; 5), decrease Na+ accumulation in bread wheat leaves under saline and waterlogged conditions. J. Exp. Bot. 2011, 62, 2939–2947. [Google Scholar] [CrossRef] [Green Version]
  38. Bulle, M.; Yarra, R.; Abbagani, S. Enhanced salinity stress tolerance in transgenic chilli pepper (Capsicum annuum L.) plants overexpressing the wheat antiporter (TaNHX2) gene. Mol. Breed. 2016, 36, 36. [Google Scholar] [CrossRef]
  39. Shabala, S.; Pottosin, I. Regulation of potassium transport in plants under hostile conditions: Implications for abiotic and biotic stress tolerance. Physiol. Plant. 2014, 151, 257–279. [Google Scholar] [CrossRef]
  40. Saddiq, M.S.; Iqbal, S.; Afzal, I.; Ibrahim, A.M.; Bakhtavar, M.A.; Hafeez, M.B.; Jahanzaib; Maqbool, M.M. Mitigation of salinity stress in wheat (Triticum aestivum L.) seedlings through physiological seed enhancements. J. Plant Nutri. 2019, 42, 1192–1204. [Google Scholar] [CrossRef]
  41. Janmohammadi, M.; Enayati, V.; Sabaghnia, N. Impact of cold acclimation, de-acclimation and re-acclimation on carbohydrate content and antioxidant enzyme activities in spring and winter wheat. Icel. Agric. Sci. 2012, 25, 3–11. [Google Scholar]
  42. Zheng, Y.; Jia, A.; Ning, T.; Xu, J.; Li, Z.; Jiang, G. Potassium nitrate application alleviates sodium chloride stress in winter wheat cultivars differing in salt tolerance. J. Plant Physiol. 2008, 165, 1455–1465. [Google Scholar] [CrossRef] [PubMed]
  43. Qiong, Y.; Guo, Y.; Zhixia, X.; Ke, S.; Jin, X.; Ting, Y.; Xiaojing, L. Effects of salt stress on tillering nodes to the growth of winter wheat (Triticum aestivum L.). Pak. J. Bot. 2016, 48, 1775–1782. [Google Scholar]
  44. Brestic, M.; Zivcak, M.; Kalaji, H.M.; Carpentier, R.; Allakhverdiev, S.I. Photosystem II thermostability in situ: Environmentally induced acclimation and genotype-specific reactions in Triticum aestivum L. Plant Physiol. Biochem. 2012, 57, 93–105. [Google Scholar] [CrossRef]
  45. Živčák, M.; Brestič, M.; Olšovská, K.; Slamka, P. Performance index as a sensitive indicator of water stress in Triticum aestivum L. Plant Soil Environ. 2008, 54, 133–139. [Google Scholar] [CrossRef] [Green Version]
  46. Mehta, P.; Jajoo, A.; Mathur, S.; Bharti, S. Chlorophyll a fluorescence study revealing effects of high salt stress on Photosystem II in wheat leaves. Plant Physiol. Biochem. 2010, 48, 16–20. [Google Scholar] [CrossRef] [PubMed]
  47. Husain, S.; Munns, R.; Condon, A.T. Effect of sodium exclusion trait on chlorophyll retention and growth of durum wheat in saline soil. Aust. J. Agric. Res. 2003, 54, 589–597. [Google Scholar] [CrossRef]
  48. Loutfy, N.; Sakuma, Y.; Gupta, D.K.; Inouhe, M. Modifications of water status, growth rate and antioxidant system in two wheat cultivars as affected by salinity stress and salicylic acid. J. Plant Res. 2020, 133, 549–570. [Google Scholar] [CrossRef] [PubMed]
  49. Arfan, M.; Athar, H.R.; Ashraf, M. Does exogenous application of salicylic acid through the rooting medium modulate growth and photosynthetic capacity in two differently adapted spring wheat cultivars under salt stress? J. Plant Physiol. 2007, 164, 685–694. [Google Scholar] [CrossRef]
  50. Baker, N.R.; Rosenqvist, E. Applications of chlorophyll fluorescence can improve crop production strategies: An examination of future possibilities. J. Exp. Bot. 2004, 55, 1607–1621. [Google Scholar] [CrossRef] [Green Version]
  51. Nawaz, K.; Hussain, K.; Majeed, A.; Khan, F.; Afghan, S.; Ali, K. Fatality of salt stress to plants: Morphological, physiological and biochemical aspects. Afr. J. Biotechnol. 2010, 9, 5475–5480. [Google Scholar]
  52. Hasanuzzaman, M.; Bhuyan, M.; Zulfiqar, F.; Raza, A.; Mohsin, S.M.; Mahmud, J.A.; Fujita, M.; Fotopoulos, V. Reactive Oxygen Species and Antioxidant Defense in Plants under Abiotic Stress: Revisiting the Crucial Role of a Universal Defense Regulator. Antioxidants 2020, 9, 681. [Google Scholar] [CrossRef]
  53. Bhusal, N.; Lee, M.; Lee, H.; Adhikari, A.; Han, A.R.; Han, A.; Kim, H.S. Evaluation of morphological, physiological, and biochemical traits for assessing drought resistance in eleven tree species. Sci. Total Environ. 2021, 779, 146466. [Google Scholar] [CrossRef]
  54. Geissler, N.; Hussin, S.; El-Far, M.M.; Koyro, H.-W. Elevated atmospheric CO2 concentration leads to different salt resistance mechanisms in a C3 (Chenopodium quinoa) and a C4 (Atriplex nummularia) halophyte. Environ. Exp. Bot. 2015, 118, 67–77. [Google Scholar] [CrossRef]
  55. Zahra, N.; Raza, Z.A.; Mahmood, S. Effect of salinity stress on various growth and physiological attributes of two contrasting maize genotypes. Brazilian Arch. Biol. Technol. 2020, 63. [Google Scholar] [CrossRef]
  56. Khaleghi, A.; Naderi, R.; Brunetti, C.; Maserti, B.E.; Salami, S.A.; Babalar, M. Morphological, physiochemical and antioxidant responses of Maclura pomifera to drought stress. Sci. Rep. 2019, 9, 1–12. [Google Scholar] [CrossRef]
  57. Zeng, L.; Shannon, M.C.; Lesch, S.M. Timing of salinity stress affects rice growth and yield components. Agric. Water Manag. 2001, 48, 191–206. [Google Scholar] [CrossRef]
  58. Munns, R.; James, R.A. Screening methods for salinity tolerance: A case study with tetraploid wheat. Plant Soil 2003, 253, 201–218. [Google Scholar] [CrossRef]
  59. Mansour, E.; Moustafa, E.S.; Desoky, E.-S.M.; Ali, M.; Yasin, M.A.; Attia, A.; Alsuhaibani, N.; Tahir, M.U.; El-Hendawy, S. Multidimensional evaluation for detecting salt tolerance of bread wheat genotypes under actual saline field growing conditions. Plants 2020, 9, 1324. [Google Scholar] [CrossRef] [PubMed]
  60. Hoagland, D.R.; Arnon, D.I. The water-culture method for growing plants without soil. Circ. Calif. Agric. Exp. Stn. 1950, 347, 32. [Google Scholar]
  61. Shavrukov, Y.; Langridge, P.; Tester, M. Salinity tolerance and sodium exclusion in genus Triticum. Breed. Sci. 2009, 59, 671–678. [Google Scholar] [CrossRef] [Green Version]
  62. Gardner, F.; Pearce, R.; Mitchell, R. Physiology of Crop Plants, 2nd ed.; Iowa State University Press: Ames, IA, USA, 1985. [Google Scholar]
  63. Fanizza, G.; Gatta, C.D.; Bagnulo, C. A non-destructive determination of leaf chlorophyll in Vitis vinifera. Ann. Appl. Biol. 1991, 119, 203–205. [Google Scholar] [CrossRef]
  64. Baker, N.R. Chlorophyll fluorescence: A probe of photosynthesis in vivo. Annu. Rev. Plant Biol. 2008, 59, 89–113. [Google Scholar] [CrossRef] [Green Version]
  65. Kramer, D.M.; Johnson, G.; Kiirats, O.; Edwards, G.E. New fluorescence parameters for the determination of QA redox state and excitation energy fluxes. Photosy Res. 2004, 79, 209–218. [Google Scholar] [CrossRef]
Figure 1. Effect of salt stress on winter and spring wheat. Diagrams are based on value of % control (salt-treated/control∗100) of Na+ in leaves (a), K+ in leaves (b), K+/Na+ ratio (c), leaf senescence % (d), shoot length (SL) (e), root length (RL) (f), relative growth rate of root length (RGR-RL) (g), relative growth rate of shoot length (RGR-SL) (h), stomatal conductance (gs) (i), instantaneous chlorophyll fluorescence (Ft; j), quantum yield of photosystem II (Fv′/Fm′; k), and chlorophyll content index (CCI; l).
Agronomy 11 01193 g001
Figure 2. Influence of salt stress on (a) Na+ concentration in leaves, (b) K+ concentration in leaves, and (c) K+/Na+ in leaves of wheat genotypes. Error bars indicate S.E. (n = 3). Different letters above the bars represent significant differences at the p < 0.05.
Agronomy 11 01193 g002
Figure 3. Influence of salt stress on (a) shoot length, (b) root length, and (c) relative growth rate of shoot length (RGR-SL) on wheat genotypes. Error bars indicate S.E. (n = 3). Different letters above the bars represent significant differences at the p < 0.05.
Agronomy 11 01193 g003
Figure 4. Influence of salt stress on (a) relative growth rate of root length (RGR-RL), (b) chlorophyll content index (CCI), and (c) senescence of leaves of wheat genotypes. Error bars indicate S.E. (n = 3). Different letters above the bars represent significant differences at the p < 0.05.
Agronomy 11 01193 g004
Figure 5. Influence of salt stress on (a) stomatal conductance (gs), (b) efficiency of photosystem II (PSII), and (c) maximum quantum yield of photosystem II (Fv/Fm′) of wheat genotypes. Error bars indicate S.E. (n = 3). Different letters above the bars represent significant differences at the p < 0.05.
Agronomy 11 01193 g005
Table 1. Mean square values (p < 0.05) for root length (RL), shoot length (RL), the relative growth rate of root length (RGR-RL), the relative growth rate of shoot length (RGR-SL), leaf Na+ and K+ concentration (mg g−1 dry wt), K+/Na+ ratio, stomatal conductance gs (mol/m2 s), maximum quantum efficiency of PSII (Fv/Fm′), instantaneous chlorophyll fluorescence (Ft), chlorophyll content index (CCI) of spring wheat genotypes, spring wheat genotypes, and ten wheat genotypes grown under various NaCl stress levels.
Among the Five Spring Wheat Genotypes
SourceDfRLSLRGR-RLRGR-SLNa+K+K+/ Na+Fv/FmgsFtLeaf SenescenceCCI
G446.6 ***2.1 *0.399 ***0.02 n.s.10.71 **12.41 n.s1.49 n.s0.002 n.s15.38 ***353972 **36.24 n.s.126.39 ***
SL1136.1 **130.2 ***0.943 ***1.26 ***1292.7 ***1023.0 ***158.14 ***0.621 ***989.45 ***2.441 × 101 ***7022.2 ***1886.48 **
G*SL310.1 ***3.5 ***0.034 ***0.033 **6.63 n.s.15.42 n.s.1.26 n.s.0.004 n.s.15.81 ***310460 ***20.7 n.s.23.00 ***
Among the Five Winter Wheat Genotypes
G4111.5 **61.9 ***1.233 ***0.39 ***47.74 ***10.91 n.s.2.66 *0.039 ***56.78 ***616640 ***236.8 **368.36 ***
SL1172.2 **162.3 ***1.624 ***1.27 ***589.1 ***678.2 ***142.7 ***0.749 ***538.58 ***1.500 × 101 ***4806.9 ***1252.4 ***
G*SL32.96 n.s.3.9 n.s.0.075 n.s.0.028 n.s.15.6 ***30.62 **2.00 n.s.0.008 ***18.63 ***196887 ***83.61 n.s.37.55 ***
Among the Ten Wheat Genotypes
G9119.3 **58.9 ***0.984 ***0.36 ***41.46 ***74.6 ***2.86 *0.053 ***36.98 ***614174 ***131.5 n.s.233.68 ***
SL1301.6 **291 ***2.511 ***2.53 ***1812.7 ***1678.4 ***300.26 ***1.77 ***1483.1 ***3.853 × 101 ***11578 ***3081.1 ***
G*SL36.6 ***3.5 **0.054 ***0.027 n.s.17.58 ***23.0 ***1.52 n.s0.0085 ***20.29 ***322609 ***74.3 n.s.33.33 ***
G = genotypes, SL = salinity level; * = significant (<0.05), ** = more significant (<0.01), *** = highly significant (<0.00), n.s. = non-significant.
Table 2. Correlations among different ionic, growth, and physiological traits of wheat genotypes grown under various NaCl stress levels.
Among the Five Spring Wheat Genotypes
Traits Senescence of LeafNa+ in LeafK+ in LeafgsFtFv/FmRoot Length
Na+ in leaf0.81
K+ in leaf−0.75−0.76 **
gs−0.76−0.73 **0.75 **
Ft−0.83−0.87 **0.77 **0.82 **
Fv/Fm−0.85−0.88 **0.79 **0.84 **0.93 **
Root length−0.75−0.74 **0.66 **0.76 **0.75 **0.84 **
Shoot length−0.67−0.65 **0.58 **0.75 **0.69 **0.70 **0.83 **
Among the Five Winter Wheat Genotypes
Na+ in leaf0.88 **
K+ in leaf−0.78 **−0.85 **
gs−0.82 **−0.85 **0.91 **
Ft−0.79 **−0.85 **0.89 **0.93 **
Fv/Fm−0.86 **−0.92 **0.87 **0.88 **0.83 **
Root length−0.84 **−0.86 **0.84 **0.82 **0.84 ** 0.86 **
Shoot length−0.49 **−0.47 **0.52 **0.47 **0.55 **0.43 **0.58 **
Among the Ten Wheat Genotypes
Na+ in leaf0.85 **
K+ in leaf−0.74 **−0.81 **
gs−0.79 **−0.81 **0.82 **
Ft−0.81 **−0.86 **0.83 **0.89 **
Fv/Fm−0.79 **−0.86 **0.85 **0.82 **0.84 **
Root length−0.70 **−0.74 **0.76 **0.72 **0.73 **0.87 **
Shoot length−0.54 **−0.56 **0.61 **0.59 **0.60 **0.66 **0.80 **
** Highly significant correlation.
Table 3. Spring and winter wheat genotypes were used in this study.
Spring WheatWinter Wheat
PI 94341TX12M 4713
W4909TX 11D 3134
W4910TXIID 3127
S-24TX110D 2265
Sakha 8TX12M 4637
Publisher’s Note: MDPI stays neutral with regard to jurisdictional claims in published maps and institutional affiliations.

