Article

Understanding the Dynamic of Rice Farming Systems in Southern Mozambique to Improve Production and Benefits to Smallholders

by
Fátima Ismael
1,2,3,*,
Aires A. Mbanze
2,4,5,*,
Alexis Ndayiragije
6 and
David Fangueiro
3
1
Department of Rural Development, Faculty of Agricultural Sciences, Campus Universitário de Unango, Universidade Lúrio, Sanga 3302, Mozambique
2
Nova School of Business and Economics, Campus de Carcavelos, Universidade Nova de Lisboa, Rua da Holanda 1, 2775-405 Lisbon, Portugal
3
Linking Landscape, Environment, Agriculture and Food (LEAF), Instituto Superior de Agronomia (ISA), Universidade de Lisboa, Tapada da Ajuda, 1349-017 Lisbon, Portugal
4
Department of Environment and Nature Conservation, Faculty of Agrarian Sciences, Campus Universitários de Unango, Universidade Lúrio, Sanga 3302, Mozambique
5
ECOSLIVE—Ecosystem Services and Livelihoods Enhancement (Serviços do Ecossistema e Melhoria dos Modos de Vida), Lichinga 3300, Mozambique
6
Internacional Rice Research Instituto (IRRI), Instituto de Investigação Agrária de Moçambique-IIAM, Avenida FPLM, Maputo 3658, Mozambique
*
Authors to whom correspondence should be addressed.
Agronomy 2021, 11(5), 1018; https://doi.org/10.3390/agronomy11051018
Submission received: 21 March 2021 / Revised: 2 May 2021 / Accepted: 9 May 2021 / Published: 20 May 2021
(This article belongs to the Special Issue Cropping Systems and Agronomic Management Practices of Field Crops)

Abstract

:
Rice farming systems (RFSs) in southern Mozambique are very heterogeneous and diversified, which has implications for smallholders’ adoption of each RFS, as well as on rice production and productivity in the region. In this regard, it is important to understand: (i) which RFS typologies can be leveraged to improve rice production and productivity; (ii) the drivers for smallholder farmers’ decisions to adopt an RFS; and (iii) which policies/incentives could enhance existing RFSs. The present study was based on surveys of 341 smallholder rice farmers in the Chókwè Irrigation Scheme (CIS), southern Mozambique. Data on the productivity of rice, size of the herd, and total other crop types were used to frame the RFS typologies. A multinomial logit model (MLM) and multiple linear regression (MLR) were applied to determine the driver for each RFS, and predict the constraints for production and yield. Based on cluster analysis, four typologies of RFSs were identified: the subsistence farming system (FS), specialised rice FS, mixed crops FS, and rice–livestock FS. Farms with longer experience reported applying more fertiliser and seedlings per unit hectare. The availability of labour increased the likelihood of adopting the mixed crops FS and rice–livestock FS. Older households were more likely to adopt the subsistence FS, and live closer to the farming fields. Yield of rice was positively associated with inputs such as fertilisers, pesticides, and seedlings, as well as years of experience of the household. Our results suggest that smallholder farmers need more assistance and technical support to identify and adopt more productive and less costly RFSs in this region.

1. Introduction

Global rice production reached 0.5 billion tonnes (on a milled basis) in 2018, which represents an increase of 1.4% [1], and it will continue to grow, especially in Africa, where production is far behind the global average [2]. This significant growth was driven by market demand, prices, and state subsidies [3]. The Asian region accounted for almost 80% of the increased production [4], while Sub-Saharan Africa is the only region in the world where food production per capita, including of staple cereals, has been growing slowly, leaving many people more vulnerable to food insecurity [5,6]. By 2050, the African population is predicted to reach 2.5 billion, more than double the current population [7]. Feeding this growing population will remain a great challenge for most of the African governments’, requiring rapid changes to policies and agricultural technology [8].
Global cereal production is increasing dramatically, providing a platform for rural and urban economic growth [9]. In Africa, as in many other parts of the developing world, cereals such as maize, rice, and wheat are essential for the daily diet of most rural and urban households, preventing them from falling into acute food insecurity [1,10,11]. Indeed, these three staple cereals together account for 94% of all cereal consumption in Africa [10], which also helps to frame the prevailing narrative that African agriculture has lagged behind the rest of the world [9].
Even in the context of lower staple cereal production, there is a widespread agreement that the agriculture sector will remain pivotal for the development of the sub-Saharan region [9], employing many rural people; up to 80% are smallholder farmers who produce most of their regional food [11,12]. Rural smallholder farms grow a wide variety of food grains, root crops, cash crops, and livestock that support diverse food and livelihood systems in different agricultural zones, and traditionally produce modest surpluses for local or distant trade [13].
Despite the availability of lowland and wetland suitable for sustainable rice-based cropping [14], rice production and productivity in sub-Saharan Africa is hindered by low soil fertility [5,15,16], a lack of technology [11,17], poor agricultural polices [18], and a lack of adequate infrastructure [6] and skilled workers [19]. As in most sub-Saharan countries, agriculture is a key sector in Mozambique, employing 80% of the labour force and contributing approximately 20% of the GDP [20]. Rice is the main cereal, second to maize, and its production area encompasses 204,000 ha, with an average paddy yield of 1.27 t/ha (Japan International Cooperation Agency [21]). This figure is remarkably low compared to the average paddy yields of 4.2 t ha−1 in Asia [22]. Most of the farming plots are located in lowlands, which are seasonally rain-fed and account for 90% of the total rice area (Ministry of Agriculture, [23]), and contribute about 10–15% of the cereal caloric supply at the national level [24].
The growing human population and increase in middle-class consumers have exacerbated the demand for rice in Mozambique [24]. This increasing demand has created 300,000 t year−1 of rice deficit, which has been covered by importation from Asian countries (National Institute of Statistics [25]). The production deficit is likely related to (i) a lack of technology (agricultural mechanization, use of chemical and organic fertilisers, herbicides, and improved rice varieties); (ii) insufficient support for smallholder farmers, who are the main rice producer in the country [26]; (iii) a lack of extension services to smallholders [27]; and (iv) high heterogeneity and diversity of farming systems (FS), which hampers the implementation of agriculture policies. The construction of specific typologies of FSs, and understanding of drivers that motivate smallholder farms to adopt each specific FS, will be a useful step forward to frame the aforementioned problems [13,28].
Although the country has a potential to reach 900,000 hectares of rice production, it is estimated that only 35% of this area is under cultivation, mostly in Gaza province (south Mozambique), Zambézia and Sofala provinces, in the centre of the country, and Nampula and Cabo Delgado provinces, in the north [23,29]. The majority of rice farming fields in the south and centre of the country are located in the Chókwè and Baixo Limpopo irrigation schemes, respectively [24]. The Chókwè Irrigation Scheme (CIS) is the largest irrigated area in Mozambique, and it has a vigorous agricultural community (including rice cultivation, horticulture, and sheep farming) in intensive and mixed FSs. However, the production volume has been remarkably low, with a lengthy stagnation since 1988, due to internal warfare, floods of the Limpopo River [21], and a lack of policies, especially around the difficulty of accessing credit [30]. Most rice producers are smallholders (>5 ha) and medium holders (5–20 ha), who also need to diversify their production to improve their livelihood and income generation. The spatial predominance of mixed FSs is dependent on the drivers and constraints. Thus, it is important to propose incentives to effectively improve the production of rice in the CIS. This will require an in-depth understanding of the existing FSs and other alternative livelihood options available in the region. The present study aimed to answer the following questions: (i) Which typologies of rice Farming Systems (RFSs) are predominant in the CIS? (ii) What are the drivers for each RFS in the area? (iii) Do different demographic patterns affect household decisions to embrace different FSs? (iv) What factors affect production and productivity for smallholder farmers in the CIS? (v) What policies/incentives can be proposed to enhance production and productivity of rice in the CIS?
To answer the above questions, a survey was carried out with smallholder rice farmers who were based adjacent to the CIS. Answering these questions was important in order to underpin development strategies, assess production constraints, prioritise research, and identify scaling potentials, which in turn will improve local food production and nutrition security, and the rice value scheme.

2. Materials and Methods

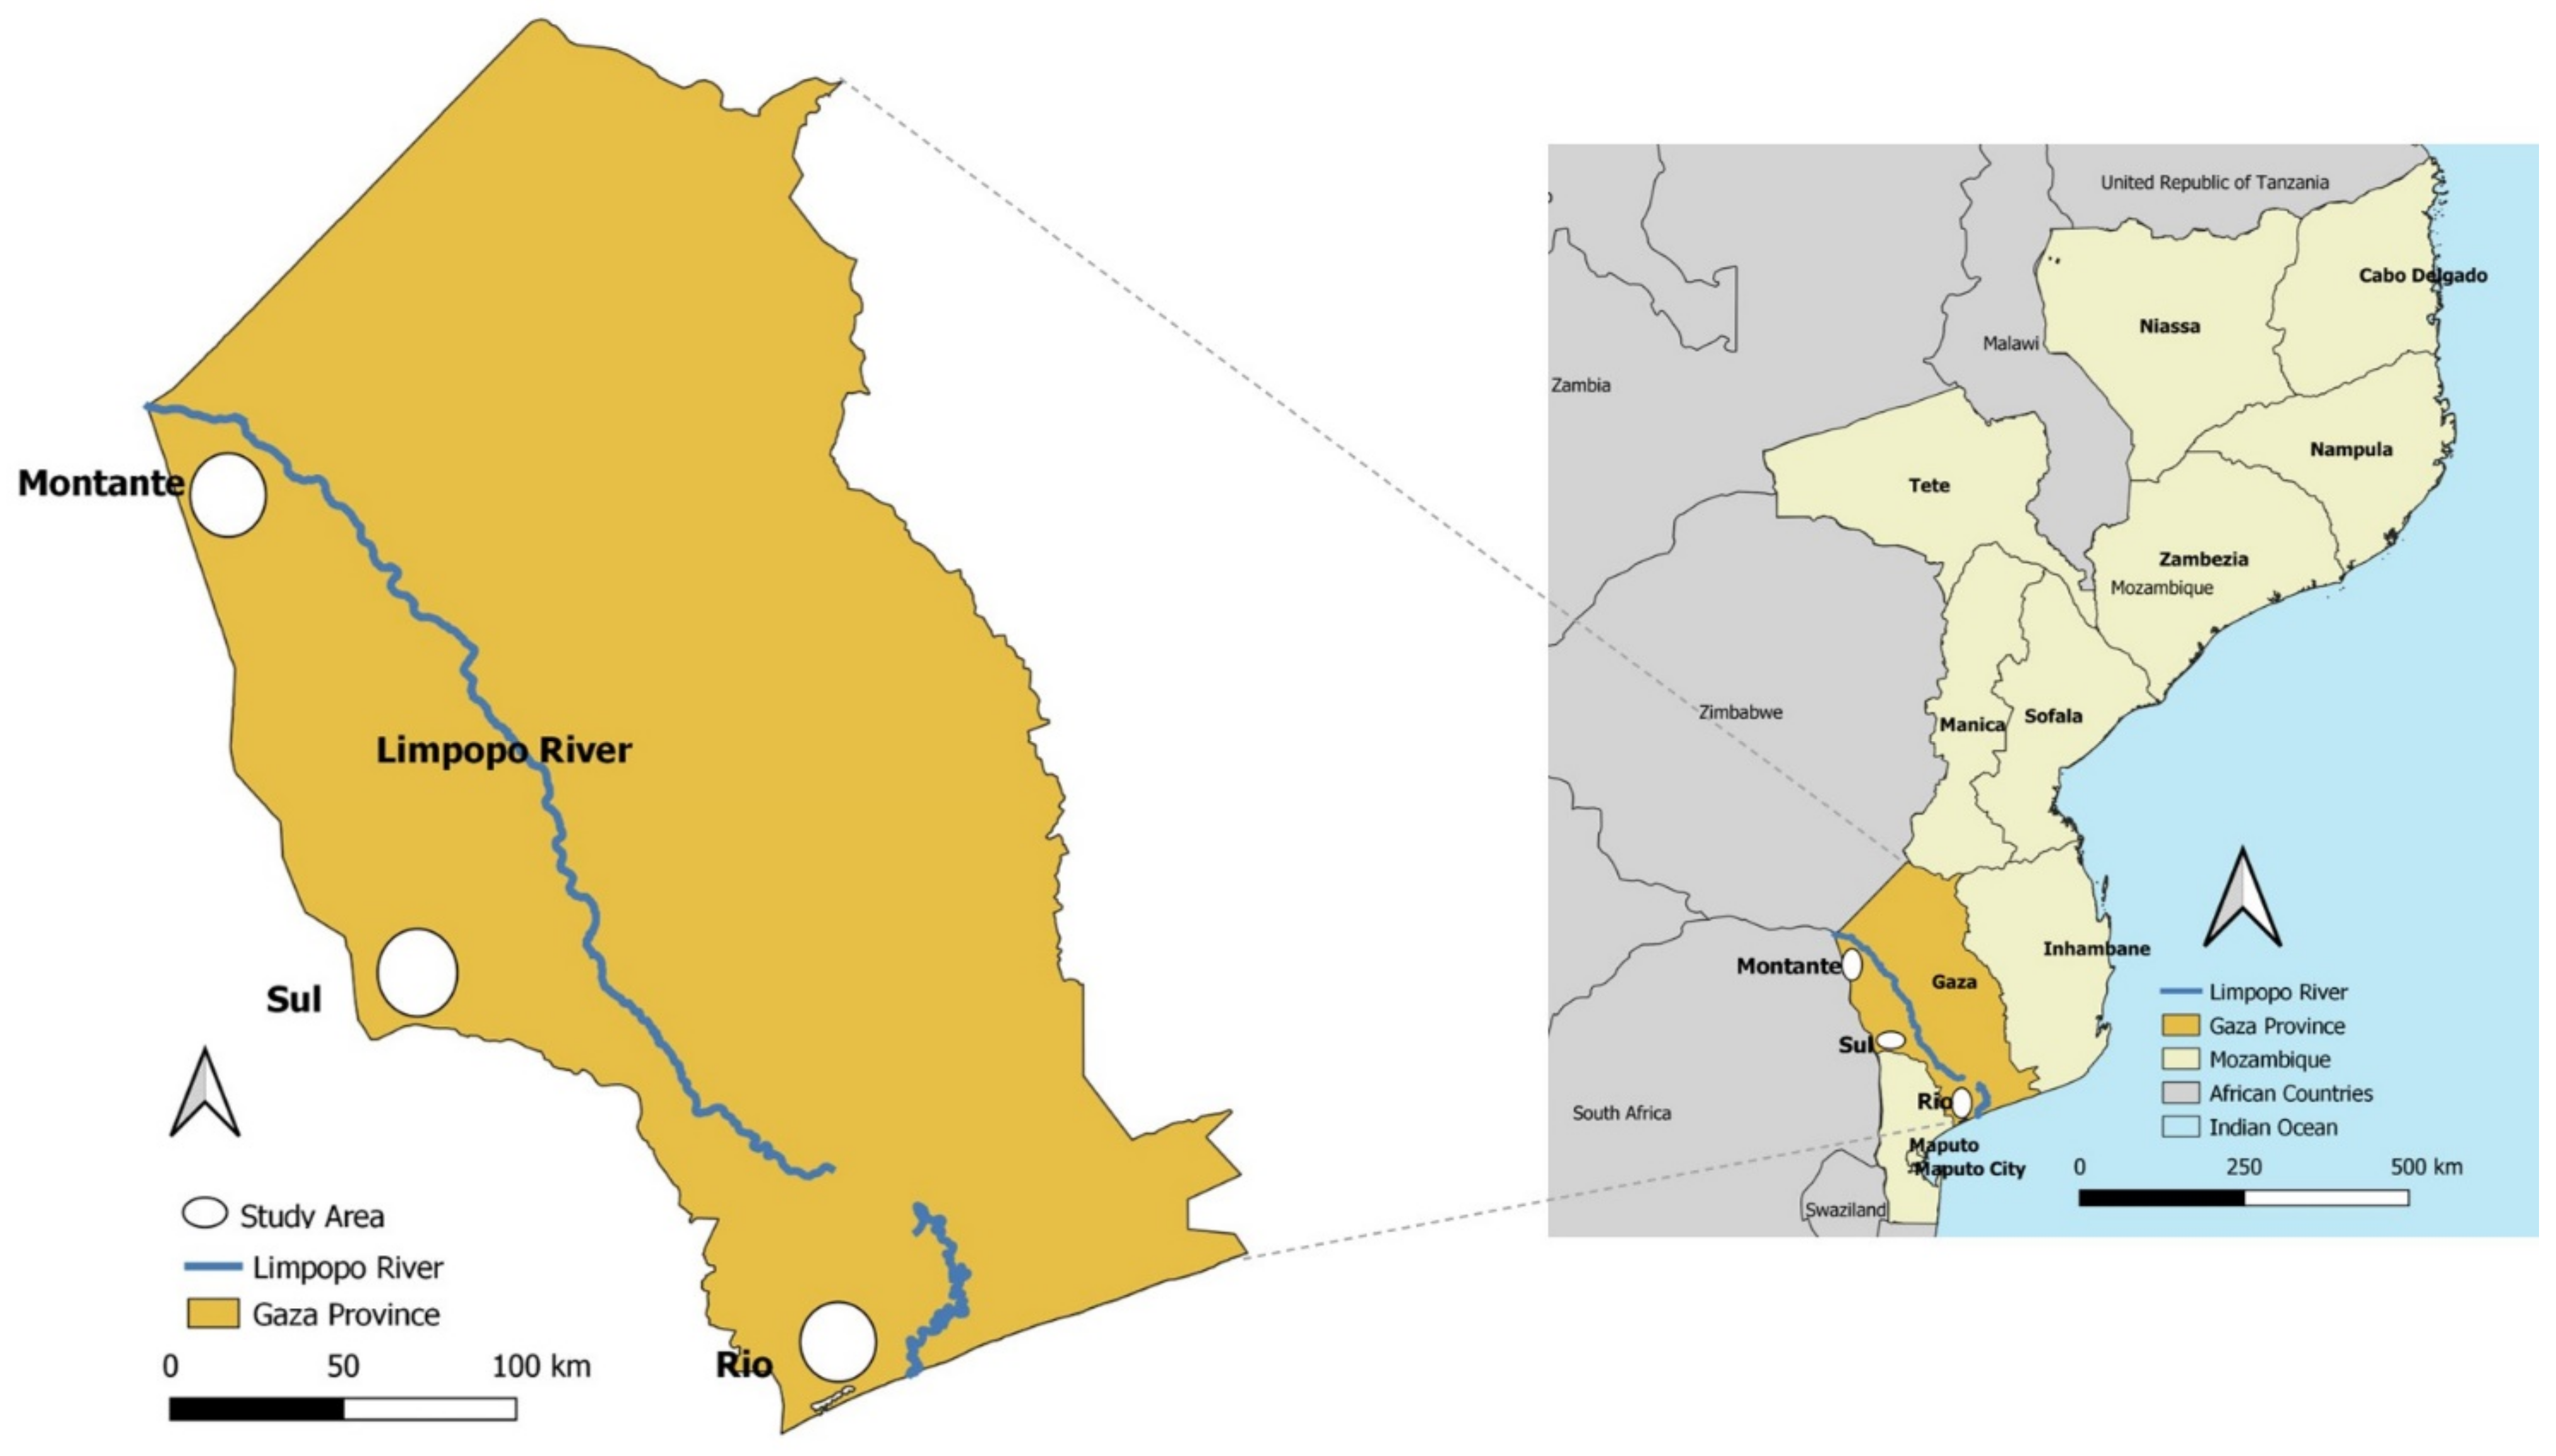
2.1. Study Area: Chókwè Irrigation Scheme (CIS)

The Chókwè Irrigation Scheme (CIS) is located in southern Mozambique, in the Chókwè District, adjacent to the Limpopo River [31,32] (Figure 1). It is the largest irrigation scheme in the country [23,24], covering 33,000 ha of land [21]. Its production potential has not yet been achieved, and is hindered by an insufficient supply of irrigation water, excessively expensive chemical fertiliser, and moderately costly labour [30]. The total population living in Chókwè district is about 212,071 people, with 56% living in rural areas (INE, 2017). The climate of the region is semi-arid [33], with an average annual temperature of 22–26 °C, and rainfall averaging between 500 and 700 mm/year [30,32]. The CIS is composed of three main hydraulic sectors: montante (upstream), sul (midstream), and rio (downstream) (Figure 1). The hydraulic structures in the irrigation scheme include the Massingir dam, Macarretane weir, and the main, secondary, and tertiary canals, as well as the drainage network [32].
The predominant FS in the area is agropastoral [13], with approximately 3500 farm households, extension workers, and technical staff. Small-scale farms hold on average less than 5 ha per plot of land for rice production [21]. Most of the agricultural activities in the area include mixed crops and livestock production, in which most of the vegetables are produced on wetlands in the dry season [33]. Rice yield is on average low in small scale FSs, but has slightly increased in the last few years [21]. Few commercial rice farmers use farm machinery, fertilisers, pesticides, and improved seeds varieties [30].

2.2. Data Collection

The survey was conducted in 25 villages, selected to cover the three main regions of the CIS: upstream/montante, midstream/sul, and downstream/rio (Figure 1). The villages were selected after an exploratory field visit and consultation with key informants (government entities and the village chairperson). Most of the households in the villages were essentially rice farmers, who also practiced other activities to sustain their daily livelihoods and generate income, such as cattle herding, fishing, and small-scale informal business, and who also cultivated fresh vegetables. Upstream, we surveyed eight villages representing a total of 93 farms (27.19%), while in the midstream and downstream a total of 5 and 12 villages were sampled, covering a total of 110 farms (32.16%) and 138 farms (40.35%), respectively (Table 1). The number of households sampled was more than 10% of the total in all of the sampled villages. According to Bartlett at al. (2001) [34] and Landry et al. [35], a 5% sampling intensity is sufficient for social studies.
The survey was conducted from February to June 2019. During this period, a total of 346 smallholder farmers were surveyed; of these, 5 surveys were not validated. The criteria used to select the 341 surveyed households was: (i) living in a village adjacent to the CIS for more than two years; and (ii) having a rice farming plot of less than 5 ha in size in the CIS.

Household Survey

The first section of the survey obtained the socio-economic characteristics of the surveyed households, and a description of their agriculture production system: (i) socio-demographic and socio-economic information of the household (gender, age, the composition of the family, and education); (ii) different sources of income; (iii) if the household held a permanent labour force or hired labour workers; and (iv) agricultural and livestock production. The second section obtained the characterisation of the RFS, including (i) type of land access; (ii) soil fertilisation; (iii) weed control; (iv) types of seeds and yield; and (v) the destination of the production, including market access. All questions included in the survey were based on a literature review, field visits, and meetings with key informants, and part of the questionnaire was from a similar study conducted in Angola, with some adjustments [36]. The survey was conducted in close collaboration with two field workers, who were native to the area and able to speak Changana, the native language, because most of the respondents either did not understand Portuguese or preferred to be interviewed in Changana. To control for potential mistranslation, the survey was translated to Changana and reverse translated to Portuguese, until a similar meaning was consistently achieved. The questionnaire was pre-tested with five respondents from upstream and was later adjusted based on their observations.

2.3. Data Analysis

Data were coded and analysed using R software. Exploratory analysis and descriptive statistics were performed. A table of frequencies and percentages was used to represent the socio-demographic and socio-economic characteristics of the households in the CIS. The information included gender of the household head, education, the main and secondary activities, accessibility of land, the number of households who hire or have permanent workers, average distance to the farming field, the use of fertiliser and types, livestock husbandry, and destination of production output.

2.3.1. Typology of Rice Farming Systems

The prevailing RFSs were developed based on three main variables: yield of rice, expressed in ton ha−1; livestock breeding; and total other types of crops (vegetables (cabbage, lettuce, tomato, etc.), maize (Zea mays), cowpea (Vigna unguiculata), common bean (Phaseolus vulgaris), and sweet potato (Ipomoea batatas), that households reported growing. Three livestock categories (cattle, swine, and goats) were considered. We used only these categories because: (i) these are the livestock categories that most households declared; (ii) households devote a considerable amount of time and effort to these activities; (iii) depending on the size of the herd, the household may need an additional labour force and it may impact resource allocation; (iv) a trade-off between livestock production and agricultural activities is also common, as suggested by [36,37]. Because the survey was focused only on rice, the yield of other crops was not assessed. Nevertheless, the annual yield of each crop was needed for construction of the FS typology [16,38,39]; an artefact was thus used to derive a proxy variable, which consisted of summing the number of all other crops the household reported growing, besides rice. Although we recognise the limitations of this approach, it was the most appropriate, in the sense that it best captured the main purpose of the work, which was to understand the basis of household decision making with regards to enterprise diversification, with an emphasis on rice. In future research, a more flexible approach to the typology of FS construction might provide further context and insight into the causes, consequences, and negotiations of farm diversity [40].
The classification of the RFS was assessed through cluster analysis of the household data on rice yield, total number of other types of crop the household reported growing, and household herd size [40,41]. We used the Minkoskwi distance as a measure of dissimilarity and ran Ward’s method because our variables were mixed between continuous and discrete. A Z transformation was also used to standardise the different scales of variables, minimising the object function error [42]. To understand to what extent each variable described the FS, an analysis of variance (ANOVA) was also conducted. If a significant difference between each variable that described the RFS was detected, the post hoc test of Tukey was used to test for statistical differences of means between pairs of clusters of the RFS.

2.3.2. Crop Patterns across Farming Systems

To characterise the distribution patterns of other crops at the FS level, a cross-tabulation between the FS and each crop type was assembled and tested to verify whether the null hypothesis of similar patterns of crop distribution across the FS could be rejected. Post hoc cell-wise tests were performed to find out which crop types were above/below what would be expected by chance in each FS [39,43]. The same procedure was also used to characterise the proportion of literate households across each FS. The ANOVA and a non-parametric Kruskal–Wallis (KW) test were required to test for statistical differences of average distances households travel to reach the farming field.

2.3.3. Drivers and Predictors of Rice Yield Production and Farming Systems

In Table 2, we present all variables used to compute the models for prediction of the driver of different RFSs, and the predictors of production and yield of rice in the CIS.
Socio-economic drivers and predictors were: (i) age and education of the household. Age was a numerical variable, while education was ordinal, they were coded in the following categories: (0 = illiterate, 1 = primary school, 2 = secondary school and 3 = high school); (ii) the distance to the farming field. This was the average time that the household spent travelling to the farming area; thus, this time represents how far the field was from the place where the family lived and was coded in four categories (1 for <30 min; 2 = 30–45 min; 3 = 46–60 min; and 4 for ≥60 min); (iii) the availability of labour in the family. This was the number of family members of active working age, including men, women, and youth; (iv) whether the household had permanent paid workers, and whether the household used fertilisers or not, were both coded as dummy variables (yes = 1 or no = 0); (v) the amount of seedlings and fertiliser that households use per hectare of rice; (vi) The total number of activities involved in rice production. The biophysical variable only considered the region in which the farming field was located. This variable was coded as a dummy (0 = if the household farm was in the upstream and 1 = if it was in the midstream or downstream).

2.3.4. Rice Farming Systems

A multinomial logistic model (MLM) was applied to investigate the importance of each driver of the RFSs. The importance of the variables in the fitted model was detected based on the log-likelihood, likelihood ratio, and Nagelkerke and Cox and Snell pseudo R-square. Predictors were selected based on their significance in the model, and possible meaningful interpretations. The importance of each predictor included in the model was assessed at the p ≤ 0.05 level of significance.

2.3.5. Predicting Factors Affecting Production and Yield

A multiple linear regression (MLR) was also applied to investigate the factors affecting the production and yield of rice in the CIS. The rice yield (tonnes ha−1) was used as a response variable to predict the factor constraint productivity, while the extension of rice farming (ha) was used as a response variable to predict the factors that positively or negatively affect the expansion of the rice area. The importance of each predictor in the model was assessed through the significance of each coefficient. A stepwise procedure was used to select the most parsimonious sub-model, based on the Akaike information criterion (AIC). All models were selected based on the significance of the p-value, residual standard error (RSE), multiple R-squared, and Adjusted R-square.

3. Results

3.1. Socio-Economic and Demographic Characteristics

The socio-economic and demographic characteristics of the respondents are presented in Table 3 and Table S1 (Supplementary Materials). More than half of the respondent farmers were men (210, 62%), while the remaining 131 (38%) were women. The predominant age group ranged from 35 to 64 years old, comprising 80% of all sample households. Only 19 (5.6%) respondents were in a younger (25–34) age group. The smallest group was the older population (65–79 years old, at 47, or 14%). Most of the households were either illiterate (55, 17.3%) or had a primary school level of education (230, 67.4%). Most respondents (256, 75.1%) reported they do not use fertiliser for their rice crop. Urea and Urea + NPK (84, 24.2%) were the most widely used fertilisers (Supplementary Materials).
Most of the households (294, 86%) reported paying for extra labour; only 13 (3.8%) farmers had permanent workers. Livestock rearing was also common among the farmers (246, 72%). Most of the farmers (224, 66%) reported that the largest proportion of production was for both consumption and sale (Supplementary Materials).

3.2. Typologies of Different Rice Farming Systems in the CIS

Four FSs of rice were identified in the CIS (Table 4): (i) the subsistence farming system, where the outputs of rice and livestock are relatively lower, but only two other crops (maize and common bean) beside rice are produced; (ii) the specialised rice FS, where rice production is on average higher and dominant. The average size of the livestock herd in this system is four animals, and the number of other crops besides rice that the household grows was slightly different from subsistence farming. The common bean is the most evident secondary crop; (iii) mixed crops, in which the rice yield is lower and statistically similar to the subsistence FS. In this system, the size of the herd of each household is relatively lower, but similar to the previous two systems, and on average each household grows more crops besides rice (vegetables, maize, cowpeas, and sweet potatoes); and (iv) crop-livestock, where livestock is clearly predominant compared to the rest of the systems, followed by rice. On average, each household reported growing four other crops besides rice; specifically, the same crops as in the previous FS.
Most smallholders (30.8%) in the CIS are subsistence farmers, followed by crop–livestock 26.4%, and 24.9% are specialised rice farmers. Mixed crops are the least adopted FS (17.9%). The proportion of literate farmers is on average higher in the mixed crops (91.8%), and lower in the specialised rice. Households who practice subsistence and specialised rice travel less distance from home to the field than those who have adopted mixed crop and crop–livestock FS.
All of the main variables that characterise the FSs (yield of rice, herd size, and other crops) are significantly (p < 0.001) different across FSs. The proportion of variance across the FSs is higher than in other crops; it represents more than half of the total variance (ETA2 = 0.73), and is moderate for livestock and rice (ETA2 = 0.478 and 0.374, respectively). All other crops, except maize (p = 0.015 and ETA2 = 0.175) and common beans, vary considerably across FSs. Maize is the only crop which has been adopted by almost all households in all RFSs.

3.3. Farmer Choices Regarding Different Rice Farming Systems in the CIS

The estimated multinomial logistic model of choice for different FSs is represented in Table 5. The model shows that the location of a smallholder farmer in the upstream increases the likelihood of choice of subsistence and specialised rice FSs, in opposition to mixed and crop–livestock FSs, which are more likely to be located in the midstream and downstream. Meanwhile, increases in the household age reduce the likelihood of adopting the mixed crop FS and crop–livestock FS, as opposed to the subsistence and specialised FSs.
Having more activities related to rice production increases the likelihood of choice of a mixed and crop–livestock FS, as opposed to a subsistence FS. Increasing the distance to the farming field increases the likelihood of a choice for crop–livestock, as opposed to a subsistence FS. The availability of permanent labour, either from the family or by hire, significantly increases the likelihood of adopting a mixed crop (α = 0.014) and crop–livestock (α = 0.000) FS, rather than subsistence farming. Increasing the seedling rate per hectares increases the likelihood of the choice to adopt a specialised rice FS (α = 0.001) and crop–livestock FS (α = 0.030), as opposed to the subsistence FS. Likewise, the use of fertiliser significantly increases the likelihood of choosing specialised rice over subsistence farming.

3.4. Production and Yield of Rice in the CIS

Table 6 presents the results of the multiple linear regression that predicts the factors that constrain or stimulate the yield of rice in the CIS. The four variables (fertiliser, seeds, pesticides, and age of the household) selected through the AIC algorithm explained 51% of the variance (p = 0.000). All variables selected positively affected the yield of rice in the CIS, although they were not equally significant.
Increasing the amount of fertiliser and seeds per hectare slightly increases the yield per hectare, with p = 0.056 and p = 0.000 significance, respectively. The application of pesticides has a positive effect on the rice yield, although the effect is not statistically significant. Increasing age of the household also has a positive effect on rice yield.
Table 7 presents the Multiple Linear Regression that describes the increase in production in the CIS. Only four variables (years of experience, total rice activities, and the amount of money invested in paying casual and permanent labour) were selected by the stepwise algorithm. Total rice activities were the only variable with a negative effect on production. The expansion of land for growing rice is positively affected by the years of household experience, the amount of money that the household spends to hire labour, and the availability of permanent labour for farming activities.
More years of experience also increases the likelihood of increased production (p = 0.035), while hiring permanent labour and increasing the amount of money that the household spends to hire labour also significantly increase the likelihood of expanding the farming area (p = 0.000). Both models, the MLM of yield and production, showed no significant effect of any interaction between factors (e.g., gender, education, hiring permanent labour, and application of pesticides) or covariates (e.g., amount of fertiliser and seeds per hectare, age of the household, distance to the farming field, and the amount of money paid for labour, etc.)

4. Discussion

4.1. Drivers of Rice Farming Systems

Livestock and other crop types, including vegetables, maize, cowpeas, common beans, and sweet potatoes, appear to be indispensable components of all RFSs in the CIS. Even in specialised rice FSs, most households grow other crops and raise livestock (e.g., cattle, swine, and goats). There are several reasons for households to diversify their FSs; most importantly, it can secure their livelihood, and protect against food scarcity [35,43,44] For instance, Mota et al. (2019) [38] reported less income generation and more food insecurity for farmers with no livestock, compared to those who owned livestock. Based on the average plot size allocated to rice in the surveyed households (min = 0.25 ha, max = 5.3 ha; mean = 0.94 ha and, mode = 1 ha), one can easily infer that only a few farmers can survive by specialising in rice production. This allocation of a small rice plot is also related to the fact that most households also grow maize, which is a rice substitute, as well as the existing land restrictions. The optimal allocation of substitute crops, such as maize and cassava, has also been reported in other FSs in north Mozambique [45]. The use of a small amount of land for subsistence agriculture is a widespread practice in the rural areas of developing countries, such as Mozambique [35] and the sub-Saharan region [41,43,46,47], due to the lack of technology and capital to hire a labour force [48]. Even in the specialised rice system, the average rice output of 3.24 ton/ha is still very low when compared to other regions [49]. The adoption of livestock rearing is a traditional practice in south Mozambique [13], as it confers a comparative advantage due to the availability of lower lands and favourable climate conditions [50]. To underline the above hypothesis, moving from upstream to downstream increases the likelihood of adoption of the rice–livestock FS, as opposed to other FSs. Rice is, on average, grown over a single rainy season from October to March [51], and other crops, such as sweet potatoes, vegetables, and cowpeas, are grown after harvesting the rice.
Increasing age of the household is associated with increased likelihood of adopting specialised rice and subsistence farming, as opposed to mixed and crop–livestock FSs; this is likely because either experience is important for specialised rice adoption, or because older households only grow a few other crops for subsistence (e.g., maize and common beans). Other studies conducted in Africa have also highlighted the importance of experience in rice production [52]. In contrast, Kajisa (2014) [49] argued that, for rice production, technology is more important than years of experience. However, technology is still very expensive for smallholder farmers in this region, hence it was not yet being used by the surveyed households.
A study conducted in the same region found that younger people are more willing to move closer to bigger cities, such as Maputo and Xai-Xai, seeking employment opportunities and better living conditions [50]. Thus, they are less likely to embrace farming. It is also important to highlight that the Chókwé district headquarters is in the upstream region, so most of the households in this region are formally employed in the government and in NGO institutions; they practice subsistence agriculture as a second occupation.
Labour availability significantly increases the likelihood of adoption of the mixed crops and rice–livestock FSs as opposed to the subsistence FS, which is probably related to the fact that, in rural areas of developing countries, farmers need to hire more workers or have a large family to overcome labour scarcity, especially when there are other off-farming activities such as animal rearing to consider [40]. A study conducted by Sraïri and Ghabiyel. (2017) [51], in the Gharb Irrigation Scheme in rural Morocco, found that crop–livestock farms devote, on average, 56.41% of their annual working time to livestock raising, and the remaining time to crop-related necessities. Increasing the labour force also increases the likelihood of choosing the specialised rice FS, although not as significantly as the crop–livestock FS, which is likely because an increase in the productivity of rice requires more rice-related activities (e.g., ploughing, harrowing, fertiliser and pesticide application, and weed control), hence requiring additional labour.

4.2. Promoting Factors and Constraints for Rice Productivity in the CIS

Based on the MLR, we have demonstrated that only four variables—seeds, fertilisers, pesticides, and age of the household—predict 51% of the variability in the rice yields in the CIS. Thus, optimising these inputs could greatly improve the productivity of rice in the CIS. Fertiliser and seeds appear to be the most important production inputs to improve the yield of rice (see, for instance, Afolami et al., 2012) [52]. However, in this study, only 24.5% of farmers reported applying fertiliser. This relatively low number of farmers is probably related to the following factors: (i) the lack of financial incentives, such as bank loans and low import tariffs, for rice inputs such as fertiliser and improved seeds, so that smallholder farmers can afford to purchase them, and (ii) lack of information and capacity-building required to take advantage of the available animal manure [53].
Based on the MLR (see Table 7), a lack of experience and lower labour availability (either permanent or hired) also hinder farmers’ decisions to expand their production area. Again, we might therefore infer that a lack of financial support constrains famers in terms of intensification and expansion of rice production in the CIS, which is also in line with conclusions from Chukwu et al. (2016) [45]. The number of activities that farmers carry out prior to harvesting the rice is negatively correlated with land expansion; this is likely because intensification requires more inputs (activities), such as weed and pest control, which in turn requires more labour and inputs, and these are out of reach for smallholder farms in the CIS. Thus, within the existing constraints that farmers are exposed to, they must choose to optimise scarce resources either by intensifying or diversifying their production. According to Ayoola and Dangbegnon (2011) [48], increasing the use of land and inputs such as fertilisers, herbicides, and labour could also increase the production and productivity of rice.

4.3. Policy Recommendations to Improve Production and Productivity for Smallholder Farmers in the CIS

The main constraints for productivity and production in the CIS are (i) land restriction; (ii) lack of inputs (e.g., fertilisers, herbicides, and labour); and (iii) poor training and lack of rural extension services. The expansion of farming areas appears to be hampered by a lack of capital for the acquisition of more land, since most households (70.4%) in our survey reported inheriting land from relatives (Supplementary Materials). To overcome this restriction, smallholder farmers need to strengthen corporativisms and intensify productivity in small plots by using more inputs [47]. However, to facilitate intensification, the government and NGOs operating in the CIS need to create incentives, such as providing loans and cheaper agrarian credits, so that farmers can better access market inputs (e.g., fertilisers, herbicides, and labour). Providing more extension services and training to smallholder farmers in the CIS should be the top priority to improve production and productivity in this area [27]. For instance, we noted that limited chemical fertiliser could be replaced by adopting animal manure, which has a great potential to contribute to the development of green agriculture in the area [53]. However, we also acknowledge the crop yield gap between organic and conventional agriculture [54]. Nevertheless, training households to adopt animal ploughing could minimise scarcity, without being constrained by the unaffordable price of human labour.
Despite the efforts towards fitting the destination of the rice output (e.g., for sale locally or for household consumption) as an FS driver, no meaningful explanation was captured. All FSs in the CIS appear to be more consumption-oriented than market-oriented (Supplementary Materials). Most of the FSs appear to have evolved towards mixed crop and rice–livestock production, which is typical of subsistence agriculture, even though the CIS was primarily designed for rice production. This remarkable dynamic is likely because there is a market opportunity for other crops and products, such as vegetables and meat, that can be sold at nearby towns such as Maputo and Xai-Xai. According to Glover and Jones (2019) [55], farms are highly selective in their locations, preferring areas close to existing infrastructure and markets. This hypothesis was highlighted by the fact that educated households are more likely to focus production on more cattle and vegetables, since they are also in a better position to see market opportunities and assess the viability of other commodities which do not demand higher production inputs. Second, rice appears not to be a profitable business for the smallholder farmer, since Asian rice (from China, Thailand, and Vietnam) is sold at a very competitive price in Mozambique. To make matters worse, maize is a competing product, and a substitute for rice that requires less water and production inputs, especially in the context of climate change.
To better advise decision-makers in this area, the hypotheses explored above need to be tested with comprehensive data on production, yield, value chain, and gross margin analysis of each crop and livestock type, in comparison to large and middle-sized farmers, since some authors have reported possible economic spillovers from commercial activities to local smallholders [55]. However, due to time and resource restrictions, this will be a focus for future research.

5. Conclusions

This study aimed to assess rice farming system typologies in the CIS to better understand the drivers and constraints for smallholder rice farmers, and proposes alternative policies for decision-makers to improve production and productivity. The results demonstrated that the use of different RFS typologies, rather than one FS for all farmers, can better capture the specific drivers for each FS in the region.
Four RFSs were identified: the subsistence FS, specialised rice FS, mixed crops FS, and rice–livestock FS. Subsistence and specialised rice are predominant in the upstream region of the CIS, while mixed crops and crop–livestock are predominant in the midstream and downstream. The households who adopted subsistence FS were on average older and had fewer resources. Specialized rice farmers had access to more resources and were driven by the household power for purchasing production inputs. Mixed crops and rice–livestock were driven by the availability of labour and possession of lower lands. In general, increased production inputs (e.g., fertiliser, pesticides, weed control, and the number of seeds per hectare) might greatly improve productivity, whilst household experience and labour availability could greatly improve production.
This research suggests that rice farmers in the region require more training opportunities to optimise the available resources, such as animal manure and animal traction, as well as to explore other more valuable trade-offs, such as potential market opportunities and the production cost of other crops and livestock in the region.

Supplementary Materials

The following are available online at https://www.mdpi.com/article/10.3390/agronomy11051018/s1, Table S1: Socio-economic and demographic characteristics of the surveyed households in the CIS. Survey to households head.

Author Contributions

Conceptualization, F.I., A.N. and D.F.; methodology, A.A.M., F.I., and D.F.; validation, A.A.M., F.I. and D.F.; formal analysis, A.A.M., F.I. and D.F.; investigation, all authors.; resources, F.I. and D.F.; data curation, A.A.M., and D.F.; writing—original draft preparation, F.I. and D.F.; writing—review and editing, all authors.; visualisation, all authors.; supervision, D.F.; project administration, F.I. and D.F.; funding acquisition, F.I. All authors have read and agreed to the published version of the manuscript.

Funding

This research received no external funding.

Institutional Review Board Statement

Not applicable.

Informed Consent Statement

Not applicable.

Data Availability Statement

Data available under request.

Acknowledgments

The authors would like to acknowledge all institutions and individuals who contributed to this work. We especially acknowledge the following institutions: Hidráulica de Chókwè, Empresa Pública (HICEP) and Serviço Distrital de Actividades Económicas (SDAE), for their support to conduct the research with the smallholders. We also acknowledge the field assistants Alexandre Quetane, Pedrito Quetane, and Argêncio Mucavel, and all of the surveyed smallholder farmers in the CIS, as well as Marina Temudo, who provided important inputs and ideas. Paula Alves carried out thorough English grammar correction. We also acknowledge the Fundação para Ciência e Tecnologia (FCT) of Portugal, which provided a scholarship to the first author (Ref no SFRH/BD/128098/2016) and support the LEAF center with the project UID/AGR/04129/2020 (LEAF).

Conflicts of Interest

The authors declare no conflict of interest.

References

  1. FAO. FAO Rice Market Monitor (RMM); FAO: Rome, Italy, 2018; Volume 21. [Google Scholar]
  2. Karimov, A.A.; Terefe, B.; Baye, K.; Hazard, B.; Abate, G.T.; Covic, N. Wheat contribution to food and nutrition security and leveraging opportunities for sustainability, nutrition and health outcomes. In Encyclopedia of Food Security and Sustainability; Elsevier: Amsterdam, The Netherlands, 2019; Volume 3, pp. 270–277. ISBN 9780128126882. [Google Scholar]
  3. FAO. FAO Rice Market Monitor; FAO: Rome, Italy, 2013; Volume 21. [Google Scholar]
  4. Fahad, S.; Adnan, M.; Noor, M.; Arif, M.; Alam, M.; Khan, I.A.; Ullah, H.; Wahid, F.; Mian, I.A.; Jamal, Y.; et al. Major Constraints for Global Rice Production. In Advances in Rice Research for Abiotic Stress Tolerance; Elsevier Inc.: Amsterdam, The Netherlands, 2019; pp. 1–22. ISBN 9780128143322. [Google Scholar]
  5. Sanchez, P.A. Soil fertility and hunger in Africa. Science 2002, 295, 2019–2020. [Google Scholar] [CrossRef] [Green Version]
  6. Meijer, S.S.; Catacutan, D.; Ajayi, O.C.; Sileshi, G.W.; Nieuwenhuis, M. The role of knowledge, attitudes and perceptions in the uptake of agricultural and agroforestry innovations among smallholder farmers in sub-Saharan Africa. Int. J. Agric. Sustain. 2015, 13, 40–54. [Google Scholar] [CrossRef]
  7. Adenle, A.A.; Wedig, K.; Azadi, H. Sustainable agriculture and food security in Africa: The role of innovative technologies and international organizations. Technol. Soc. 2019, 58, 101143. [Google Scholar] [CrossRef]
  8. Goldstone, J. Africa 2050: Demographic Truth and Consequences; Hoover: Stanford, CA, USA, 2019. [Google Scholar]
  9. Karingi, S.; Mwakubo, S. Promotion of Fertilizer Production, Cross-Border Trade and Consumption in Africa; African Development Bank Group: Addis Ababa, Ethiopia, 2018. [Google Scholar]
  10. Pretty, J.; Toulmin, C.; Williams, S. Sustainable intensification in African agriculture. Int. J. Agric. Sustain. 2011, 9, 5–24. [Google Scholar] [CrossRef]
  11. Ranum, P.; Peña-Rosas, J.P.; Garcia-Casal, M.N. Global maize production, utilization, and consumption. Ann. N. Y. Acad. Sci. 2014, 1312, 105–112. [Google Scholar] [CrossRef]
  12. Mutsvangwa-Sammie, E.P.; Manzungu, E.; Siziba, S. Key attributes of agricultural innovations in semi-arid smallholder farming systems in south-west Zimbabwe. Phys. Chem. Earth 2018, 105, 125–135. [Google Scholar] [CrossRef]
  13. Dixon, J. Concept and Classifications of Farming Systems; Elsevier: Ansterdam, The Netherlands, 2019; Volume 3, ISBN 9780081005965. [Google Scholar]
  14. Fagnombo, J.; Sintondji, L.O.; Malé, A.; Baggie, I.; Agbahungba, G.; Hamadoun, A.; Zwart, S.J. Predictors determining the potential of inland valleys for rice production development in West Africa. Appl. Geogr. 2018, 96, 86–97. [Google Scholar] [CrossRef]
  15. Sileshi, G.; Akinnifesi, F.K.; Ajayi, O.C.; Chakeredza, S.; Kaonga, M.; Matakala, P. Contributions of agroforestry to Ecosystem Services in the Miombo eco-region of Eastern and Southern Africa. Afr. J. Environ. Sci. Technol. 2007, 1, 68–80. [Google Scholar] [CrossRef]
  16. Makumba, W.; Janssen, B.; Oenema, O.; Akinnifesi, F.K.; Mweta, D.; Kwesiga, F. The long-term effects of a gliricidia-maize intercropping system in Southern Malawi, on gliricidia and maize yields, and soil properties. Agric. Ecosyst. Environ. 2006, 116, 85–92. [Google Scholar] [CrossRef]
  17. Kwesiga, F.; Akinnifesi, F.K.; Mafongoya, P.L.; McDermott, M.H.; Agumya, A. Agroforestry research and development in southern Africa during the 1990s: Review and challenges ahead. Agrofor. Syst. 2003, 59, 173–186. [Google Scholar] [CrossRef]
  18. Mills, G.; Obasanjo, O.; Herbst, J.; Davis, D. Making Africa Work, 1st ed.; Ronan, M., Moodie, G., Eds.; Tafelberg: Cape Town, South Africa, 2017; ISBN 978-0-624-08027-5. [Google Scholar]
  19. Balasubramanian, V.; Sie, M.; Hijmans, R.J.; Otsuka, K. Increasing Rice Production in Sub-Saharan Africa: Challenges and Opportunities. In Advances in Agronomy; Elsevier: Amsterdam, The Netherlands, 2007; Volume 94, pp. 55–133. ISBN 0123741076. [Google Scholar]
  20. Maclean, J.; Hardy, B.; Hettle, G. Rice Almanac: Source Book for One of the Most Important Economic Activities on Earth, 4th ed.; IRRI: Los Baños, Philippines, 2013. [Google Scholar]
  21. Cunguara, B.; Thompson, T.; Davis, K. Mozambique: Desk Study of Extension and Advisory Services Developing Local Extension Capacity (DLEC) Project; Feed the Future: Washington, DC, USA, 2018. [Google Scholar]
  22. JICA. The Project for Rice Produtivity Improvement in Chokwe Irrigation Scheme; JICA: Maputo, Mozambique, 2014. [Google Scholar]
  23. Zeigler, R.S. Rice. Encyclopedia of Applied Plant Sciences. Encycl. Appl. Plant Sci. 2016, 3, 45–49. [Google Scholar] [CrossRef]
  24. Ministry of Agriculture. National Rice Development Strategy Mozambique; Ministry of Agriculture: Maputo, Mozambique, 2009.
  25. Alasia, A.; Low, J.; Soregaroli, C. Food Demand Changes in Mozambique: Assessing the Role of the Rice Sector; FAO: Rome, Italy, 2003. [Google Scholar]
  26. Instituto Nacional de Estatística. Anuário Estatístico; Instituto Nacional de Estatística: Maputo, Mozambique, 2018. [Google Scholar]
  27. Silici, L.; Bias, C.; Cavane, E. Sustainable Agriculture for Small-Scale Farmers in Mozambique; Internationa Institute for Environment and Development: London, UK, 2015. [Google Scholar]
  28. Benfica, R.; Cunguara, B.; Thurlow, J. Linking agricultural investments to growth and poverty: An economywide approach applied to Mozambique. Agric. Syst. 2018, 172, 91–100. [Google Scholar] [CrossRef]
  29. Dixon, J.; Gulliver, A.; Gibbon, D. Farming Systems and Poverty: Improving Farmers’ Livelihoods in a Changing Word; FAO: Rome, Italy; Washington, DC, USA, 2001. [Google Scholar]
  30. MASA Plano Nacional de Arroz em Moçambique; Ministério de Agricultura e Segurança Alimentar: Maputo, Mozambique, 2019.
  31. Kajisa, K.; Payongayong, E. Potential of and constraints to the rice Green Revolution in Mozambique: A case study of the Chokwe irrigation scheme. Food Policy 2011, 36, 615–626. [Google Scholar] [CrossRef]
  32. Abbas, M. Chokwé: Efeitos Locais de Políticas Instáveis, Erráticas e Contraditórias; OMR: Maputo, Mozambique, 2018. [Google Scholar]
  33. De Sousa, L.S.; Wambua, R.M.; Raude, J.M.; Mutua, B.M. Assessment of Water Flow and Sedimentation Processes in Irrigation Schemes for Decision-Support Tool Development: A Case Review for the Chókwè Irrigation Scheme, Mozambique. AgriEngineering 2019, 1, 100–118. [Google Scholar] [CrossRef] [Green Version]
  34. Bartlett, J.E.; Kotrlik, J.W. Organizational Research: Determining Appropriate Sample Size in Survey Research. Sci. Open 2001, 19, 43–50. [Google Scholar]
  35. Landry, J.; Chirwa, P.W. Analysis of the potential socio-economic impact of establishing plantation forestry on rural communities in Sanga district, Niassa province, Mozambique. Land Use Policy 2011, 28, 542–551. [Google Scholar] [CrossRef] [Green Version]
  36. MAE Perfil do Distrito do CHÓKWE Provincia de Gaza; Governo do Mozambique: Maputo, Mozambique, 2012.
  37. Temudo, M.P.; Talhinhas, P. Dynamics of change in a ‘female farming system’, Mbanza Kongo/Northern Angola. J. Peasant Stud. 2019, 46, 258–275. [Google Scholar] [CrossRef]
  38. Mota, A.A.; Lachore, S.T.; Handiso, Y.H. Assessment of food insecurity and its determinants in the rural households in Damot Gale Woreda, Wolaita zone, southern Ethiopia. Agric. Food Secur. 2019, 8, 1–11. [Google Scholar] [CrossRef] [Green Version]
  39. Michalscheck, M.; Mellon-Bedi, S.; Kuivanen, K.S.; Alvarez, S.; Adjei-Nsiah, S.; Descheemaeker, K. Characterising the diversity of smallholder farming systems and their constraints and opportunities for innovation: A case study from the Northern Region, Ghana. Wageningen J. Life Sci. 2016, 78, 153–166. [Google Scholar] [CrossRef]
  40. Ribeiro, P.F.; Nunes, L.C.; Beja, P.; Reino, L.; Santana, J.; Moreira, F.; Santos, J.L. A Spatially Explicit Choice Model to Assess the Impact of Conservation Policy on High Nature Value Farming Systems. Ecol. Econ. 2018, 145, 331–338. [Google Scholar] [CrossRef]
  41. Legendre, P.; Legendre, L. Numerical Ecology. Dev. Environ. Model. 2003, 24, 870. [Google Scholar] [CrossRef]
  42. García-Pérez, M.A.; Núñez-Antón, V.V. Cellwise Residual Analysis in Two-Way Contingency Tables. Educ. Psychol. Meas. 2003, 63, 825–839. [Google Scholar] [CrossRef]
  43. Sharpe, D. Your Chi-Square Test Is Statistically Significant: Now What? Practical Assessment, Research & Evaluation. Pract. Assessment Res. Eval. 2015, 20, 1. [Google Scholar]
  44. Mbanze, A.M.; Viera da Silva, C.; Ribeiro, N.S.; Silva, J.; Santos, J.L. A Livelihood and Farming System Approach for Effective Conservation Policies in Protected Areas of Developing Countries: The Case Study of the Niassa National Reserve in Mozambique. Land Use Policy 2020, 99, 1–16. [Google Scholar] [CrossRef]
  45. Chukwu, V.A.; Eze, A.; Osuafor, O.O. Socio-Economic Determinants of Adoption of Improved Rice Production Technologies among Rice Farmers in Ebonyi State, Nigeria: A Logit Regression. Agriculture 2016, 94, 39900–39908. [Google Scholar]
  46. Ducrot, R.; Leite, M.; Gentil, C.; Bouarfa, S.; Rollin, D.; Famba, S. Strengthening the capacity of irrigation schemes to cope with flood through improved maintenance: A collaborative approach to analySe the case of Chókwè, Mozambique. Irrig. Drain. 2018. [Google Scholar] [CrossRef] [Green Version]
  47. Menete, M.Z.L.; van Es, H.M.; Brito, R.M.L.; DeGloria, S.D.; Famba, S. Evaluation of system of rice intensification (SRI) component practices and their synergies on salt-affected soils. Field Crop. Res. 2008, 109, 34–44. [Google Scholar] [CrossRef]
  48. Ayoola, J.; Dangbegnon, C. Socio-economic factors influencing rice production among male and female farmers in Northern Guinea Savanna Nigeria: Lessons for promoting gender equity in action research. Agric. Biol. J. N. Am. 2011, 2, 1010–1014. [Google Scholar] [CrossRef]
  49. Kajisa, K. Constraints on Rice Sector Development in Mozambique; JICA: Tokyo, Japan, 2014; ISBN 8134098045. [Google Scholar]
  50. Ibraimo, M. Observador Rural; OMR: Mozambique, Maputo, 2017. [Google Scholar]
  51. Sraïri, M.T.; Ghabiyel, Y. Coping with the work constraints in crop-livestock farming systems. Ann. Agric. Sci. 2017, 62, 23–32. [Google Scholar] [CrossRef]
  52. Afolami, C.A.; Obayelu, A.E.; Agbonlahor, M.U.; Lawal-Adebowale, O. Socioeconomic Analysis of Rice Farmers and Effects of Group Formation on Rice Production in Ekiti and Ogun States of South-West Nigeria. J. Agric. Sci. 2012, 4, 233–244. [Google Scholar] [CrossRef] [Green Version]
  53. Ismael, F.; Ndayiragije, A.; Fangueiro, D. New Fertilizer Strategies Combining Manure and Urea for Improved Rice Growth in Mozambique. Agronomy 2021, 11, 783. [Google Scholar] [CrossRef]
  54. De Ponti, T.; Rijk, B.; Van Ittersum, M.K. The crop yield gap between organic and conventional agriculture. Agric. Syst. 2012, 108, 1–9. [Google Scholar] [CrossRef]
  55. Glover, S.; Jones, S. Can commercial farming promote rural dynamism in sub-Saharan Africa? Evidence from Mozambique. World Dev. 2019, 114, 110–121. [Google Scholar] [CrossRef]
Figure 1. The location of the Chokwe Irrigation Scheme (CIS).
Agronomy 11 01018 g001
Table 1. Total number of smallholder rice farmers in the three main zones of the irrigation scheme, sample size and number of village samples per zone.
Chókwè SchemeNumber of Villages
Sampled
Total Small Rice FarmsNo and (%) of Household Sampled
Upstream/Montante878293 (11.9)
Midstream/Sul121137138 (12.1)
Downstream/Rio5994110 (11.1)
Total252913341 (11.7)
Table 2. Drivers for rice farming systems (RFSs), and predictors of production and productivity of rice, in the Chókwè Irrigation Scheme.
Variable Name/CodTypeUnity of
Measuring/Class
Min-MaxMean (SE)
Age of the householdNumericalNA25–7953.30 (±0.59)
Education Ordinal4 ClassesIlliterate (0)–high School (3)1.01 (±0.35)
Distance to the farming fieldOrdinal4 Classes<30 min (1)–>60 min (4)2.47 (±0.58)
Labour force in the familyNumericalNA1–2810.23 (±0.25)
Permanent workersCategoricalDummy0–1NA
SeedingNumericalKg/ha20–30050.98 (±1.47)
Application of fertiliserCategoricaldummy0–1NA
Quantity of fertiliserNumericalKg/ha0–20022.58 (±2.35)
Use of pesticidesCategoricalDummy0–1NA
Total rice activitiesNumericalNA0–31.3 (±0.04)
RegionCategoricalDummy0–1NA
Table 3. Socio-economic and demographic characteristics of surveyed households in the CIS.
Variables FrequencyPercentage %
Gender
Male21062
Female13138
Total341100
Age
25–34195.6
35–4910330
50–6417250
65–794714
Total341100
Level of education
Illiterate5917.3
Primary23067.4
Secondary4212.3
High School102.9
Total341100
Use of fertilisers
No25675.1
Yes8524.9
Total 341100
Table 4. Farming systems in the Chókwè Irrigation Scheme, and some of their socio-economic determinants.
Farming System
SubsistenceSpecialised
Rice
Mixed Crops Rice–Livestock
VariablesN = 105|30.8%N = 85|24.9%N = 61|17.9%N = 90|26.4%Meanp-ValueEta2
Rice (ton/ha)1.64 c3.24 a1.88 c2.49 b2.310.000 ***0.374
Livestock2.95 b3.59 b3.61 b18.46 a7.320.000 ***0.478
Other Crops1.61 c1.94 b3.59 a3.56 a2.560.000 ***0.729
Proportion of Households Growing Each Type of Other Crop (%)
Vegetables6.715.360.761.131.8(112)0.000 ***0.54
Adjusted residual−−−−−++++++
Maize 92.489.410097.894.4(322)0.015 *0.175
Adjusted residual +
Cowpeas26.737.610010061.9(211)0.000 ***0.705
Adjusted residual−−−−−++++++
Common beans35.235.30.01.119.9(68)0.000 ***0.430
Adjusted residual+++++−−−−−
Sweet potatoes0.016.598.495.646.9(160)0.000 ***0.898
Adjusted residual−−−−−−++++++
Other Characteristics of the Farming System
Distance to the farming field # (min)1.06 b1.05 b1.98 a1.99 a1.470.000 ***0.190
Proportion of literate households81.074.191.886.782.70.028 *0.164
Adjusted residual +
Note: α = *** and * denote significance at 0.1%, 1%, and 5%, respectively. Lowercase letters in the line indicate the difference between farming systems for each variable. Similar letters in the line are not statistically different. Proportions of households who reported growing other types of crops in each RFS were determined based on the adjusted residual: the symbols plus (+) and minus (−) indicate the existence of a relationship or no relationship between farming systems and the proportion of households who are literate, or grow each type of other crop. +|−; ++|−− and +++|−−− denote significance at 5%, 1%, and 0.1%, respectively. Values within brackets represent the total number of households in all RFSs who reported growing each crop. The value of the ETA is the proportion of variance between FS for the variables, (yield of rice, herd size, and other crops) that characterise each FS. The variance is higher when the Eta is close to one.
Table 5. Multinomial logistic model of farming system choice and its drivers/determinants.
Farming SystemDriversCoefficientStd. ErrorZ-ValueAlf (α)Exp(B)
Specialised RiceIntercept−1.4921.1261.7560.185
Region = mid + downstream −0.2620.2451.1480.2840.769
Age−0.0220.0161.8030.1790.978
Total rice activities 0.1140.3260.1230.7261.121
Distance to the farming field −0.2210.2051.1600.2810.802
Household labour force0.0440.0431.0730.3001.045
Permanent labour force = Yes 0.9511.2710.5590.4552.587
Seeding (kg/ha)0.0270.00810.5150.001 ***1.028
Fertiliser application = No−0.9660.4045.7350.017 **0.380
Mixed CropsIntercept−5.2061.62910.2130.001 **
Region = mid + downstream 0.8840.2978.8820.003 **2.421
Age−0.0730.02211.0280.001 **0.929
Total rice activities1.4800.43611.5330.001 **4.392
Distance to the farming field 0.4060.2223.3440.0671.501
Household labour force0.0910.0572.5210.1121.096
Permanent labour force = Yes 3.5841.4566.0560.014 **36.010
Seeding (kg/ha)−0.0070.0130.2690.6040.993
Fertiliser application = No0.7120.6101.3640.2432.038
Rice–livestockIntercept−7.0301.56520.1700.000 ***
Region = mid + downstream 0.8790.2879.4040.002 **2.408
Age−0.0700.02210.3440.001**0.933
Total rice activities 0.9520.4085.4400.020*2.590
Distance to the farming field 0.4550.2174.3700.037*1.576
Household labour force0.2010.05413.8780.000***1.223
Permanent labour force = Yes 2.4611.4362.9360.08711.718
Seeding (kg/ha)0.0220.0104.6870.030*1.022
Fertiliser application = No−0.1230.5250.0550.8150.884
Note: Subsistence farming system is a reference category; α = *** is significant at 0.1%, ** = 1%, * = 5%, NS = not significant. Model fit (log-likelihood = 650.61); likelihood ratio test (Chi-square = 282.67, α = 0.000). Number of observations = 341; Pseudo R-squared (Nagelkerke = 0.60, Cox and Snell = 0.56).
Table 6. Multiple linear regression to predict rice yield in the Chókwè Irrigation Scheme.
VariablesCoefficientStd. ErrorT-ValueAlf(α)
Intercept0.2270.4730.4790.633
Fertiliser (Kg/ha)0.0070.0031.9380.056 *
Seeds (Kg/ha)0.0160.0035.8130.000 ****
Pesticide (yes/no)0.5310.3351.5830.117
Age of the household0.0210.0092.3380.022 **
R20.5101
p-value0.000 ****
Start AIC−4.92
End AIC−12.83
Note: Model was plotted based on the Akaike information criterion (AIC). α = ****, ** and * is significant at 0.001; 0.05 and 0.1, respectively.
Table 7. Multiple linear regression to predict rice production in the Chókwè Irrigation Scheme.
VariablesCoefficientStd. ErrorT-valueAlf(α)
Intercept0.3170.1502.1190.035 **
Years of experience0.0220.0054.5760.000 ****
Total rice activities−0.3300.087−3.7840.000 ****
Amount of money paid for labour0.0090.0024.8900.000 ****
Permanent labour force2.6690.25910.3020.000 ****
R20.3501
R2 Adjusted0.3423
p-value0.000 ****
Start AIC−73.34
End AIC−82.15
Note: Model was plotted based on the AIC criterion. α = ****, and ** is significant at 0.001; and 0.05, respectively.
Publisher’s Note: MDPI stays neutral with regard to jurisdictional claims in published maps and institutional affiliations.

