
Growth, Quality, and Nitrogen Assimilation in Response to High Ammonium or Nitrate Supply in Cabbage (Brassica campestris L.) and Lettuce (Lactuca sativa L.)


Abstract
:1. Introduction
2. Materials and Methods
2.1. Plant Materials and Growth Conditions
2.2. Ammonium–Nitrate Ratio Treatments
2.3. Measurements of Growth Parameters
2.4. Analyses of the Photosynthetic Capacity
2.5. Destructive Sampling and Quantification of the Total Souble Protein Content
2.6. Determinations of the Soluble Sugar and Starch Contents
2.7. Measurements of NH4+, NO3−, and NO2− Concentrations
2.8. Monitoring the Activities of Key Enzymes in N Metabolism Pathway
2.9. Statistical Analysis and Data Processing
3. Results
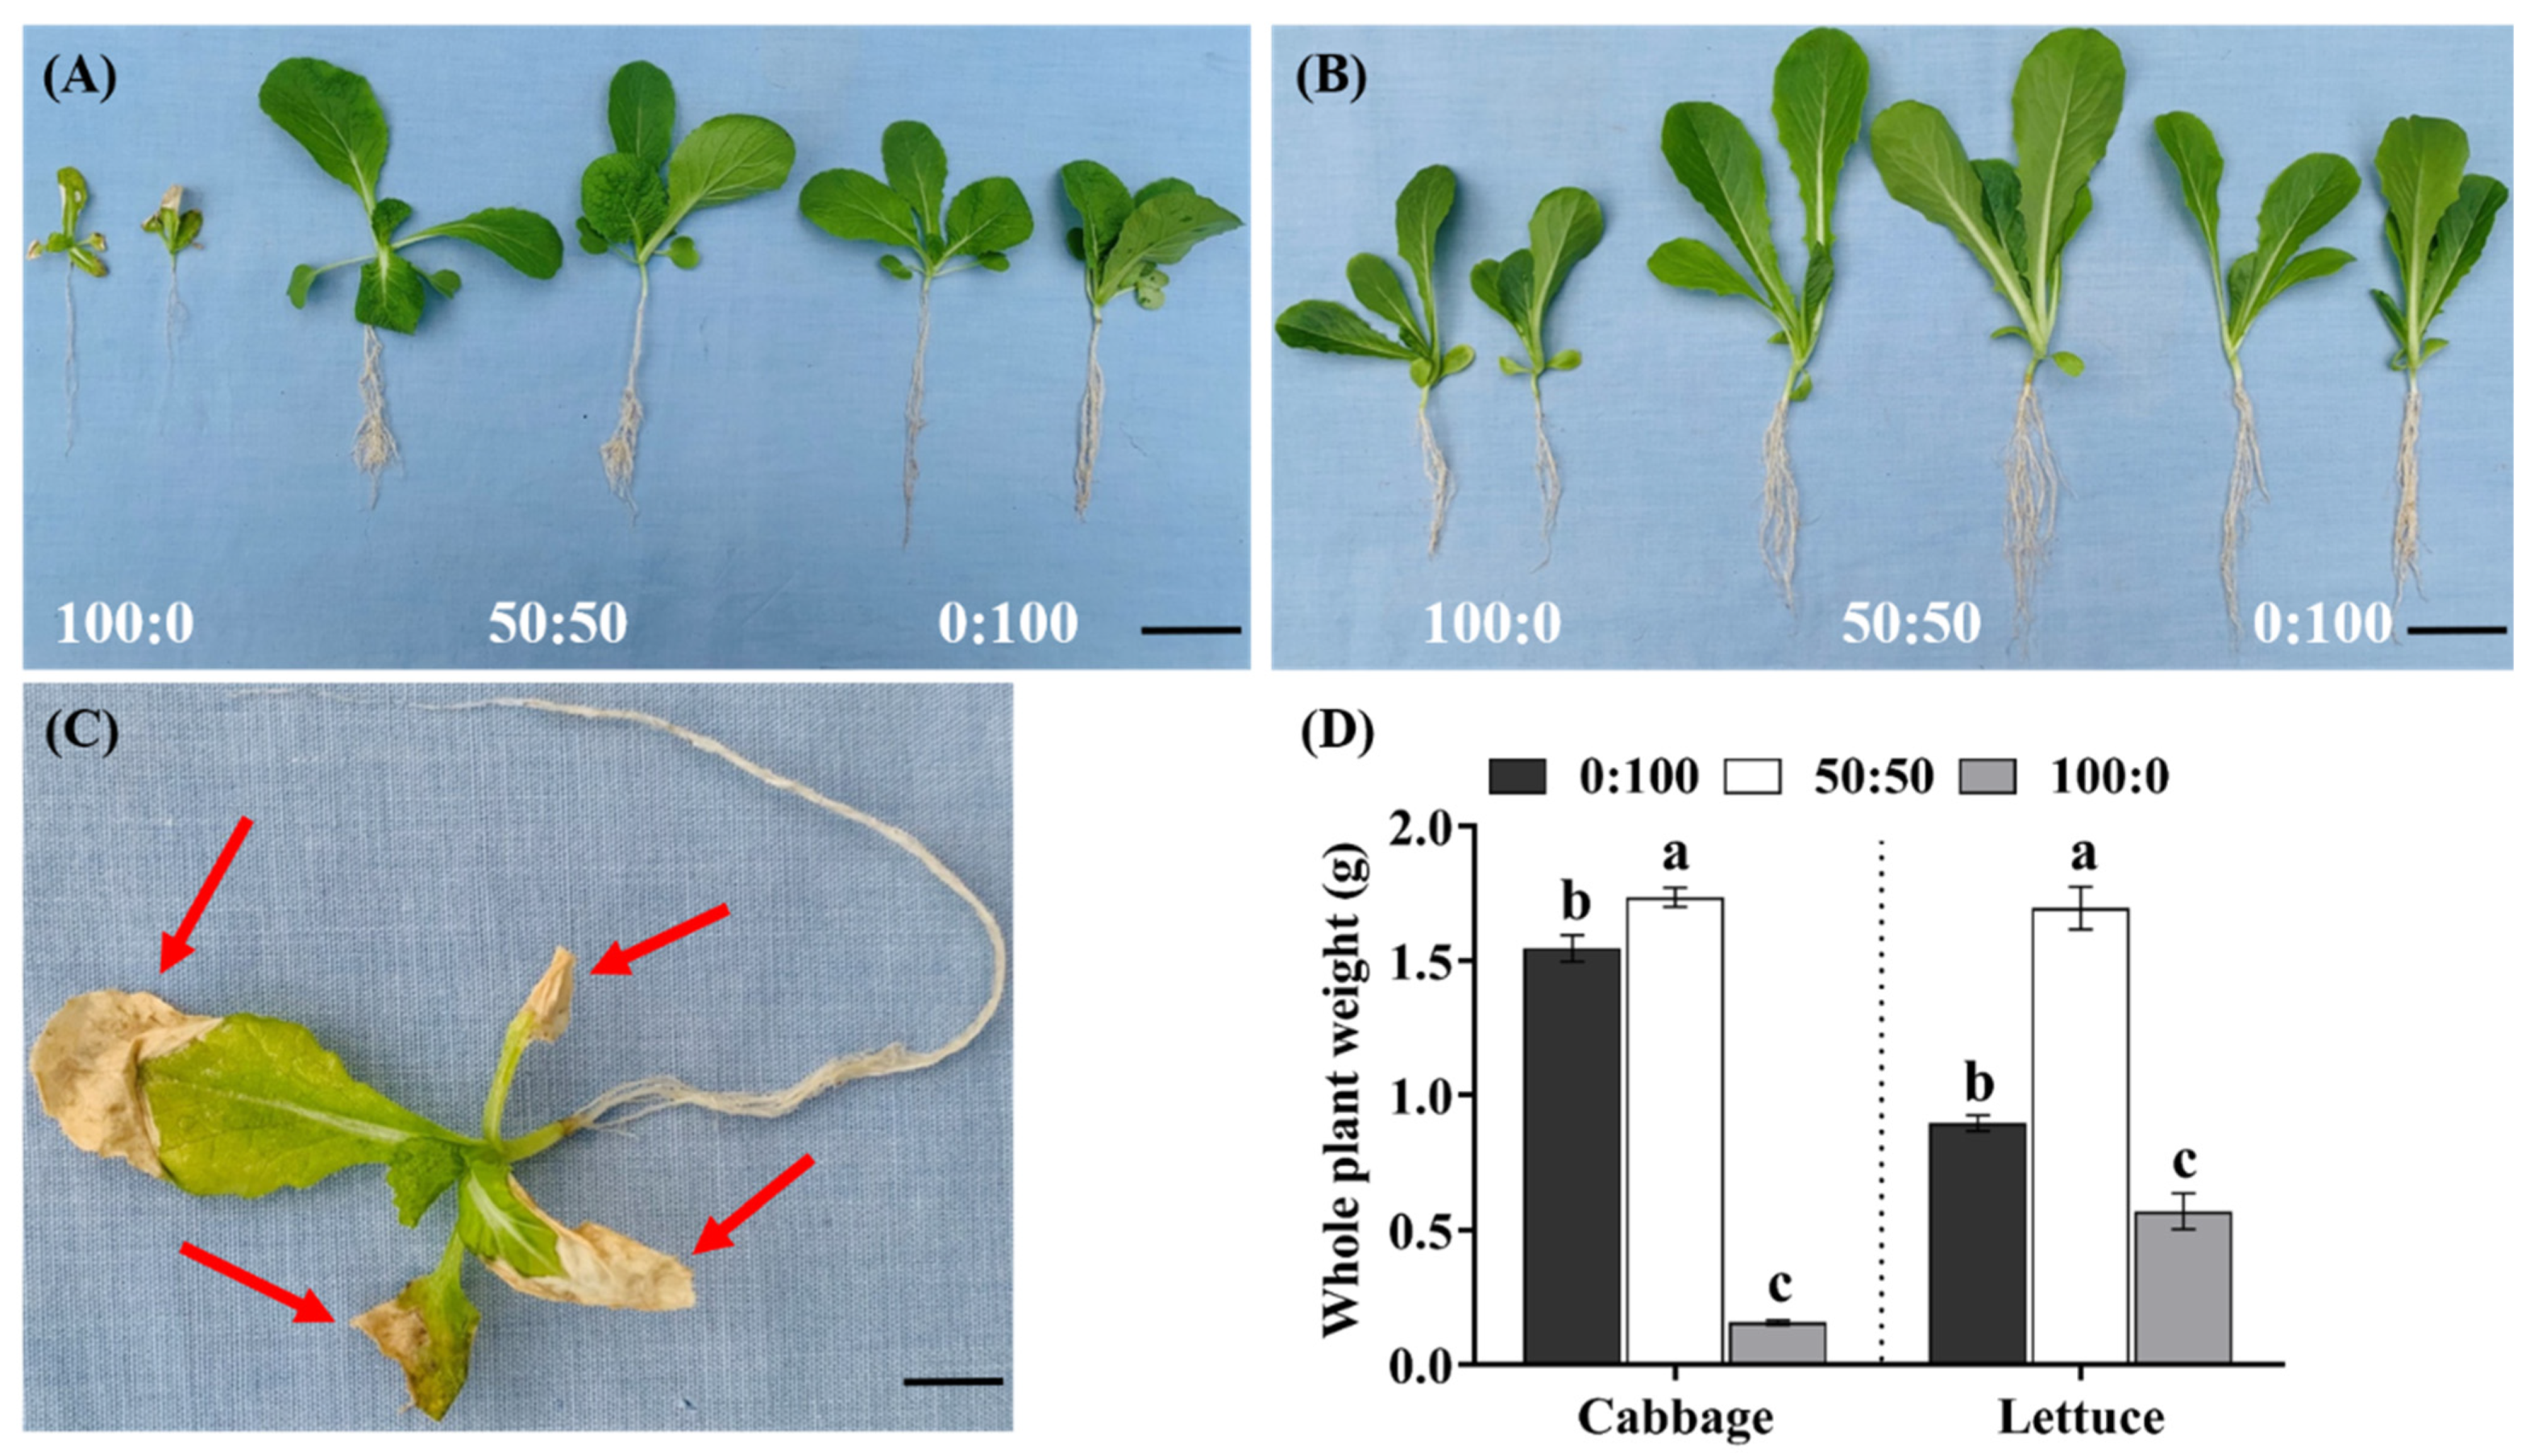
3.1. Plant Growth as Affected by the NH4+:NO3− Ratio
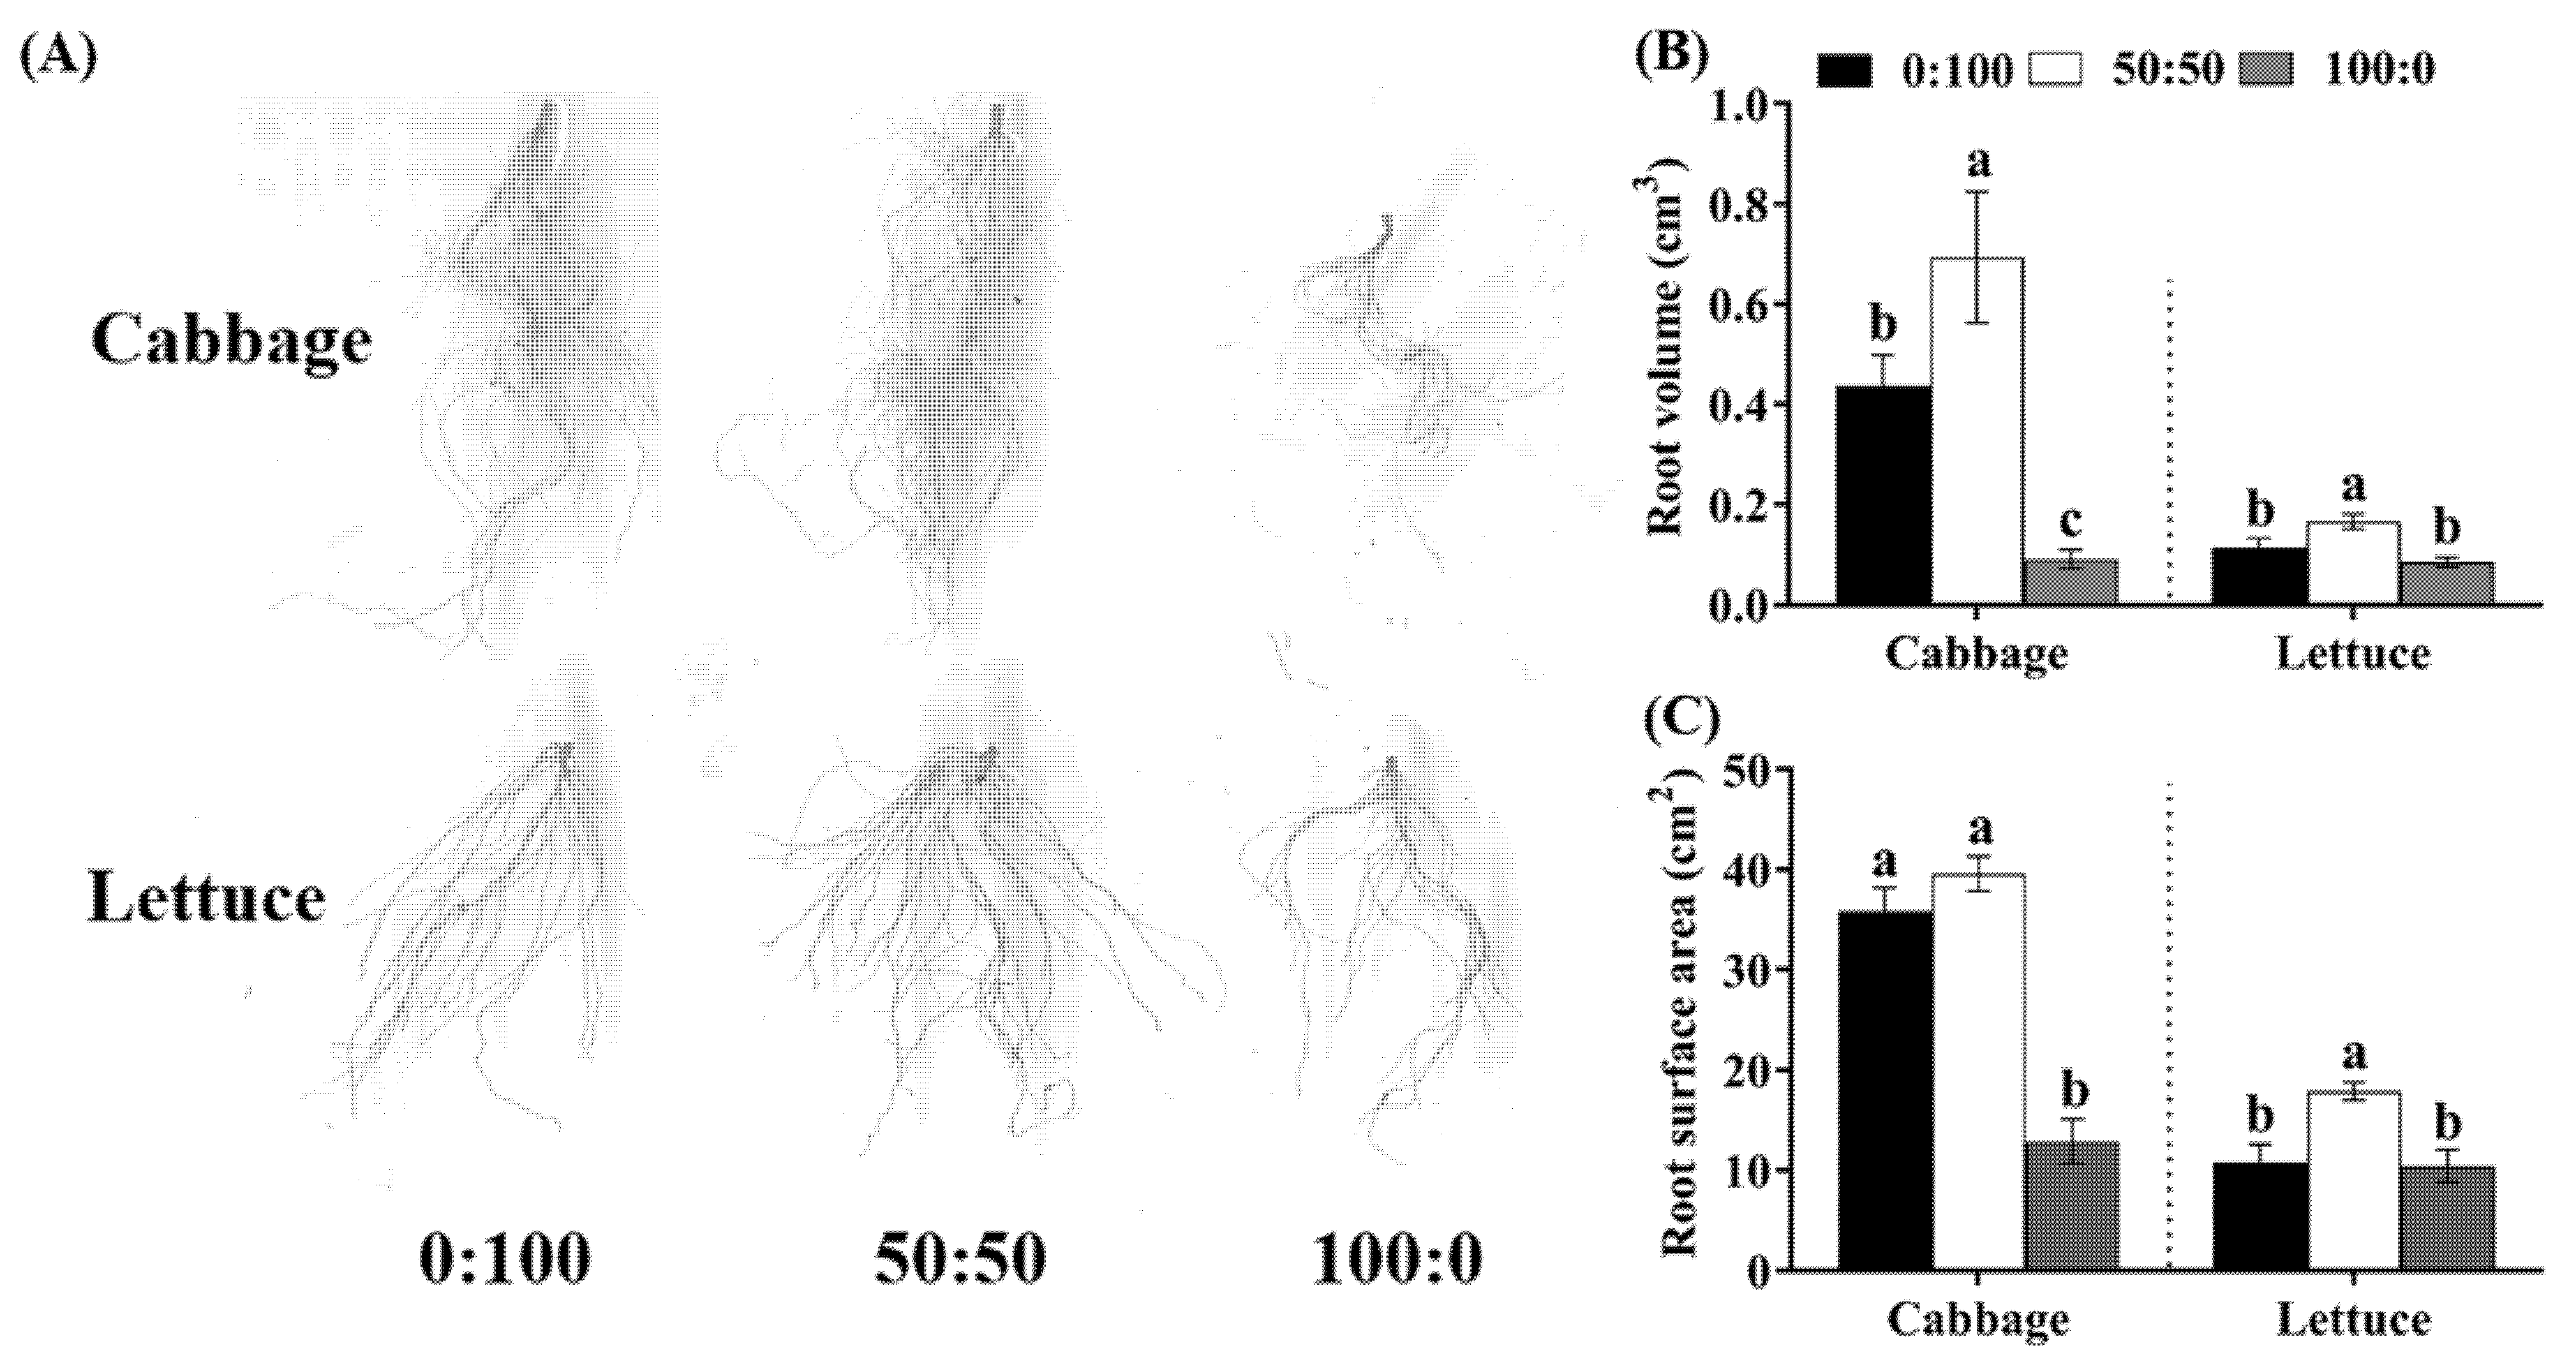
3.2. Root Morphology as Affected by the NH4+:NO3− Ratio
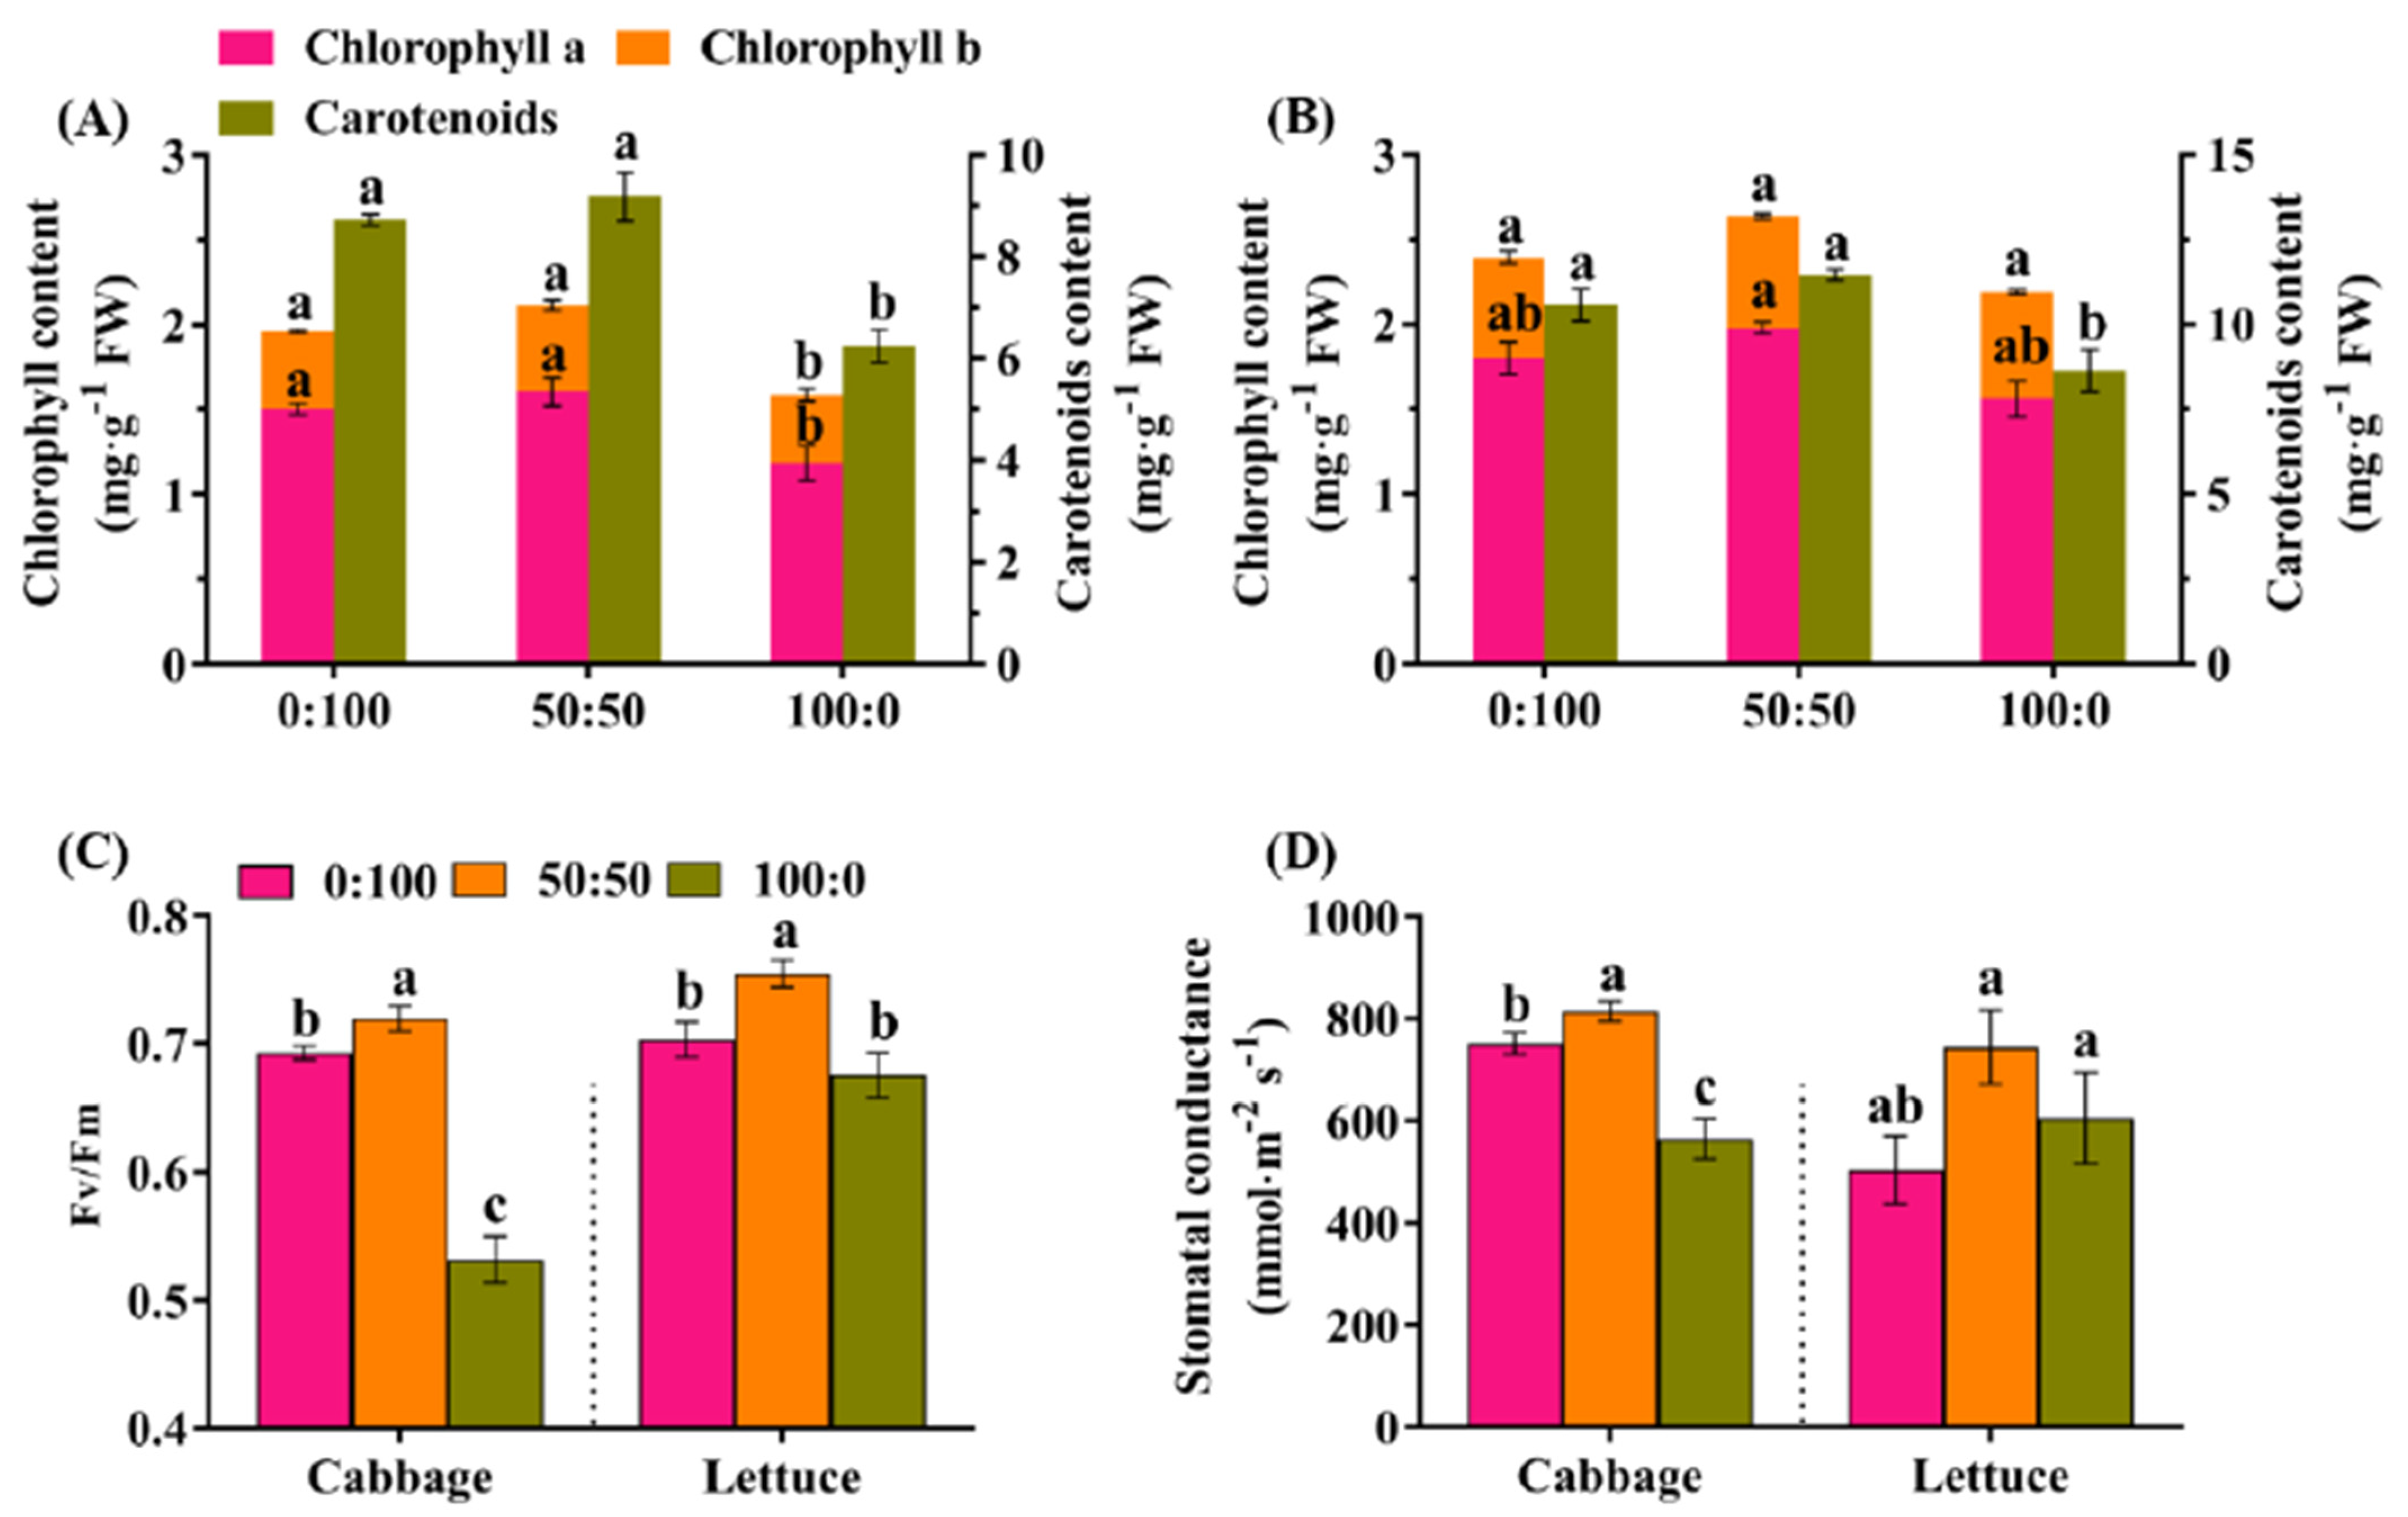
3.3. Effects of the NH4+:NO3− Ratio on the Photosynthetic Capacity
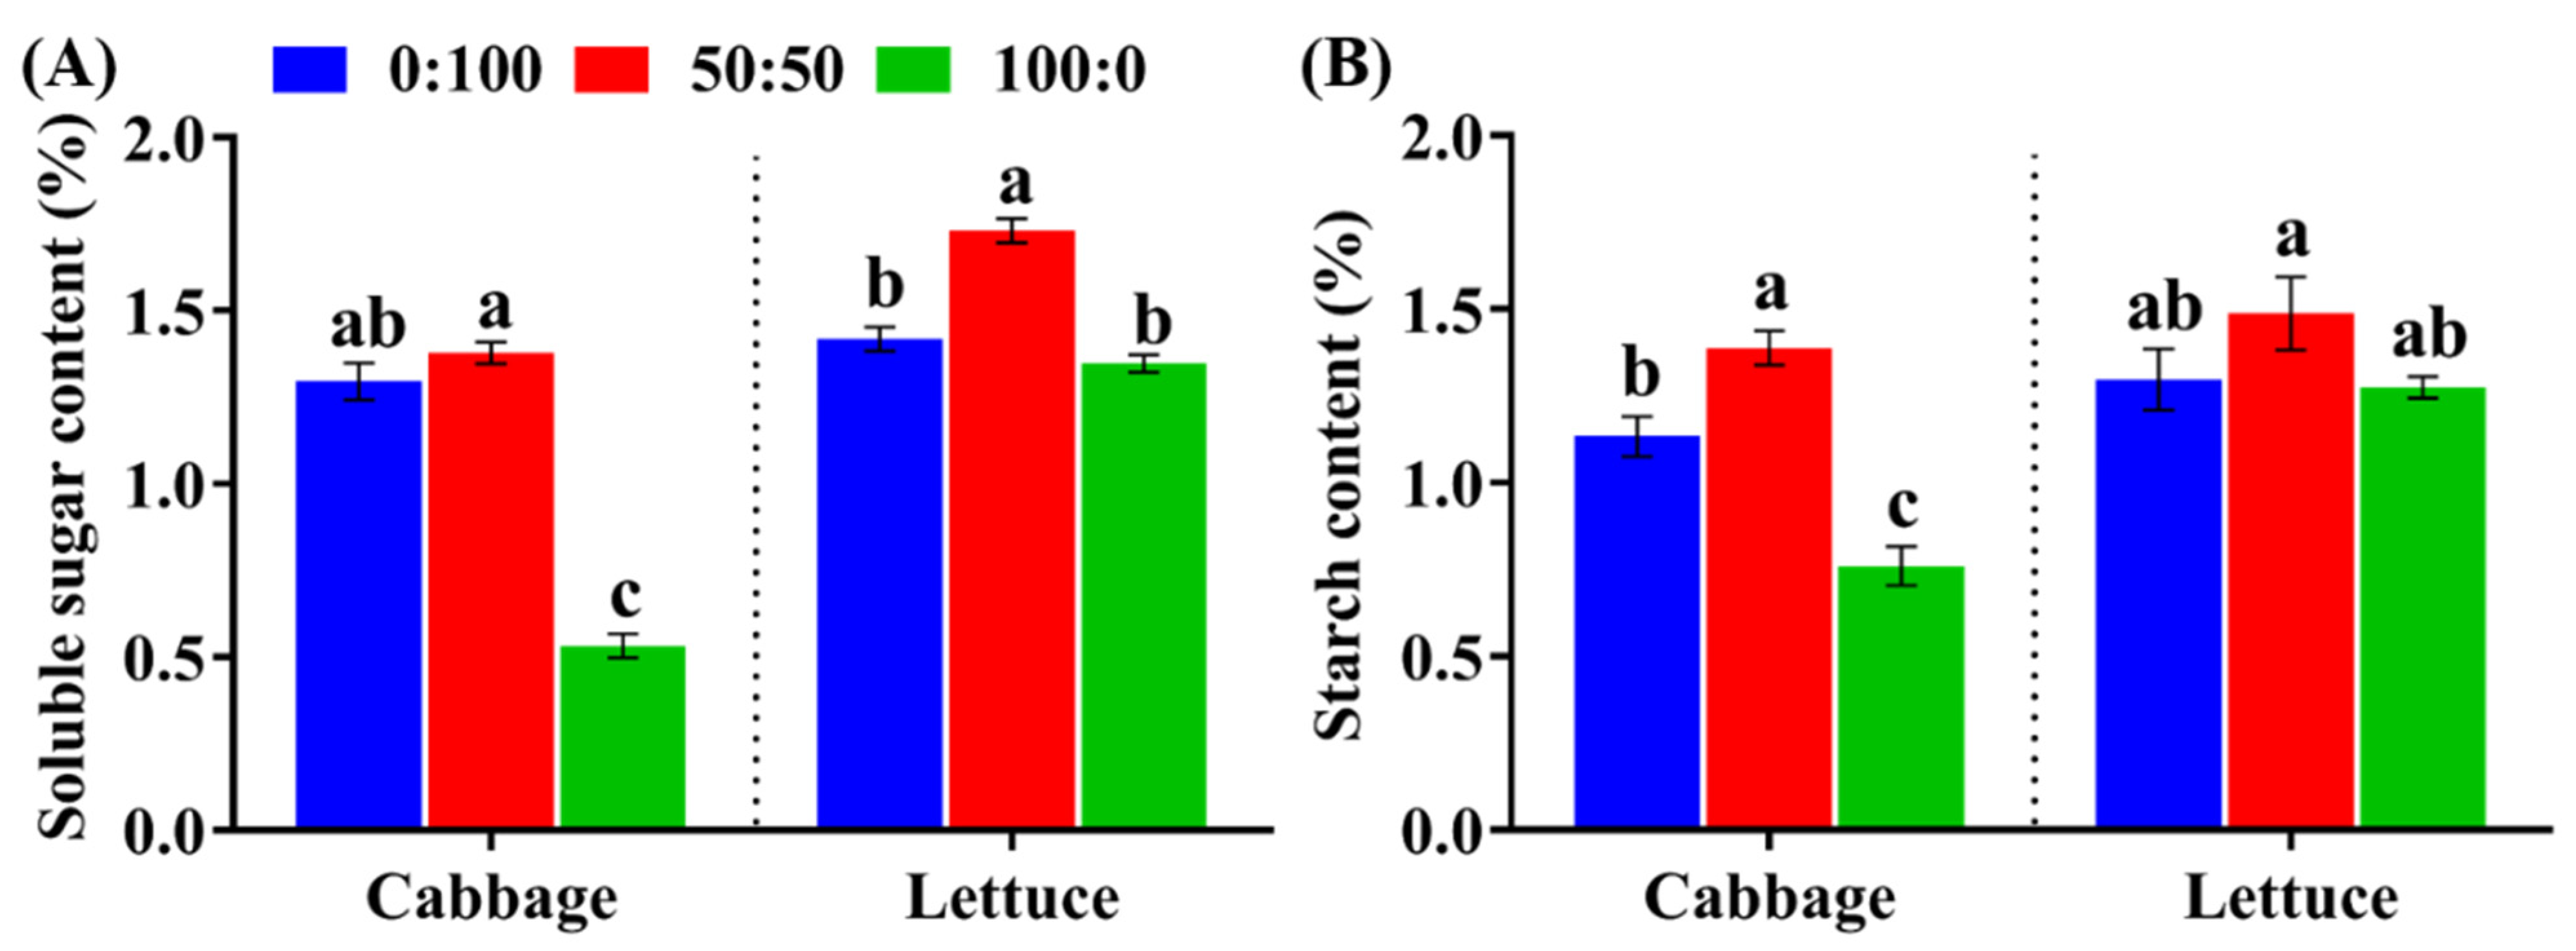
3.4. Carbohydrate Content as Affected by the NH4+:NO3− Ratio
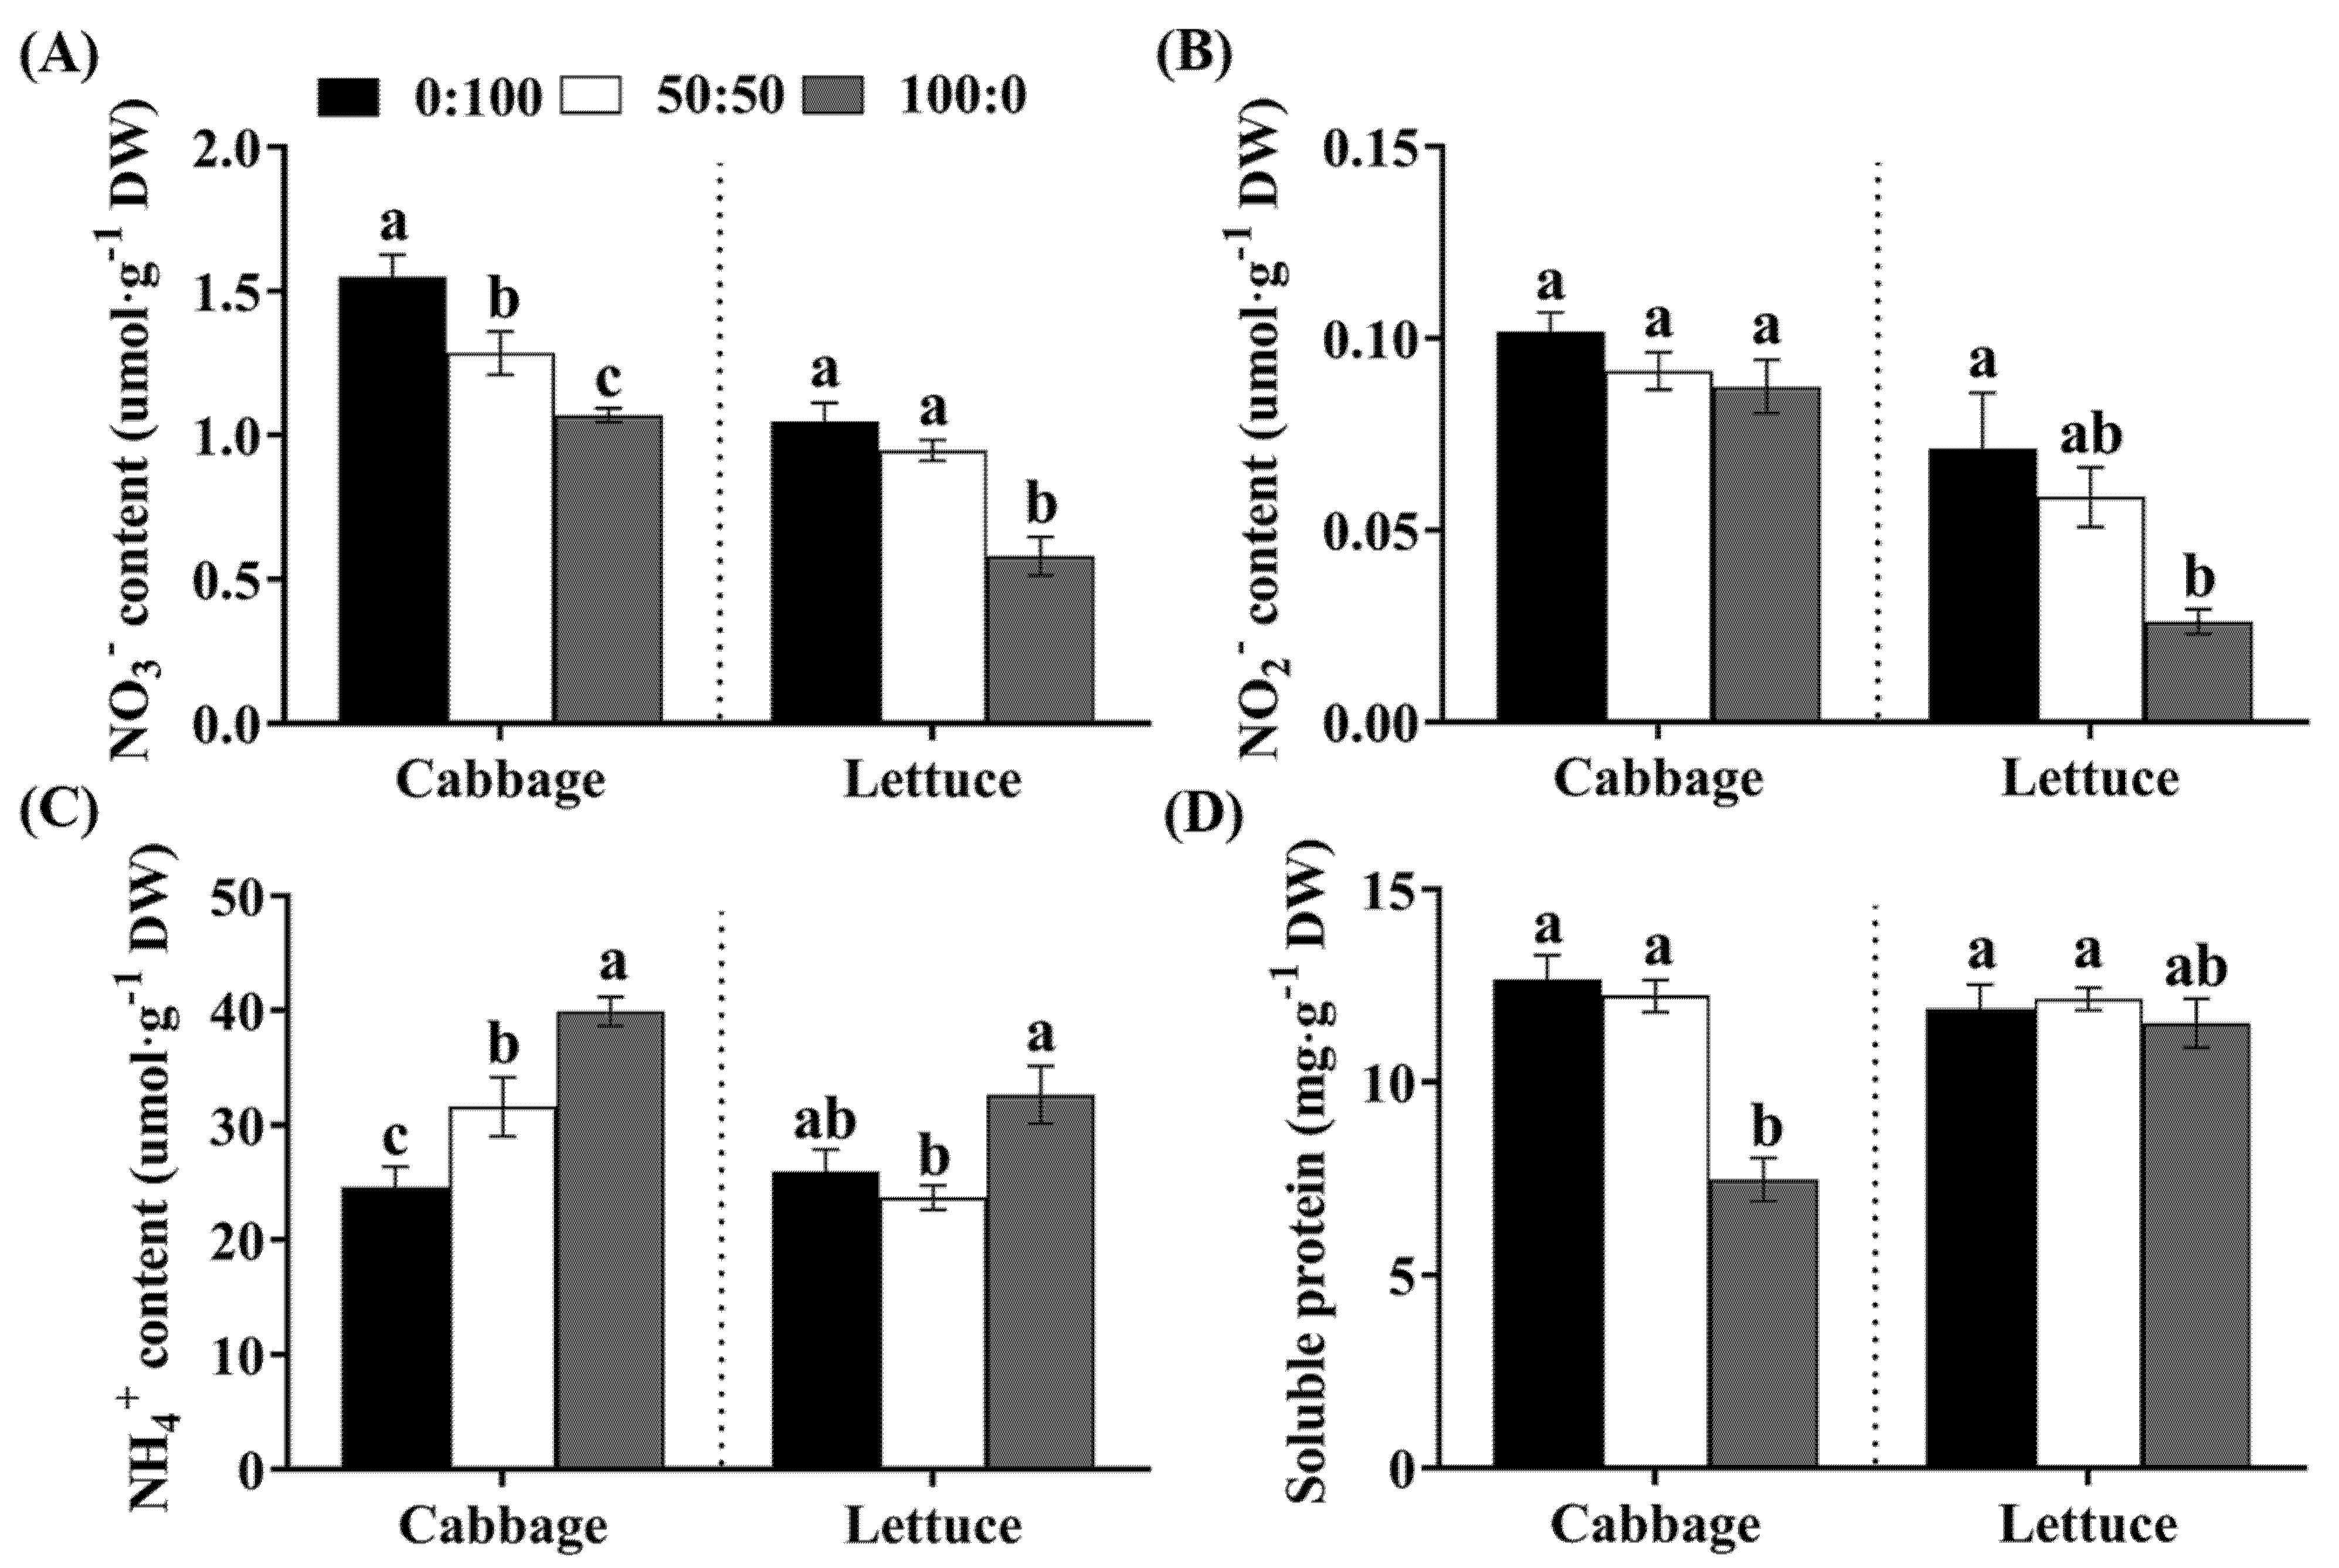
3.5. Analysis of the NO3−, NO2−, NH4+, and Total Souble Protein Contents
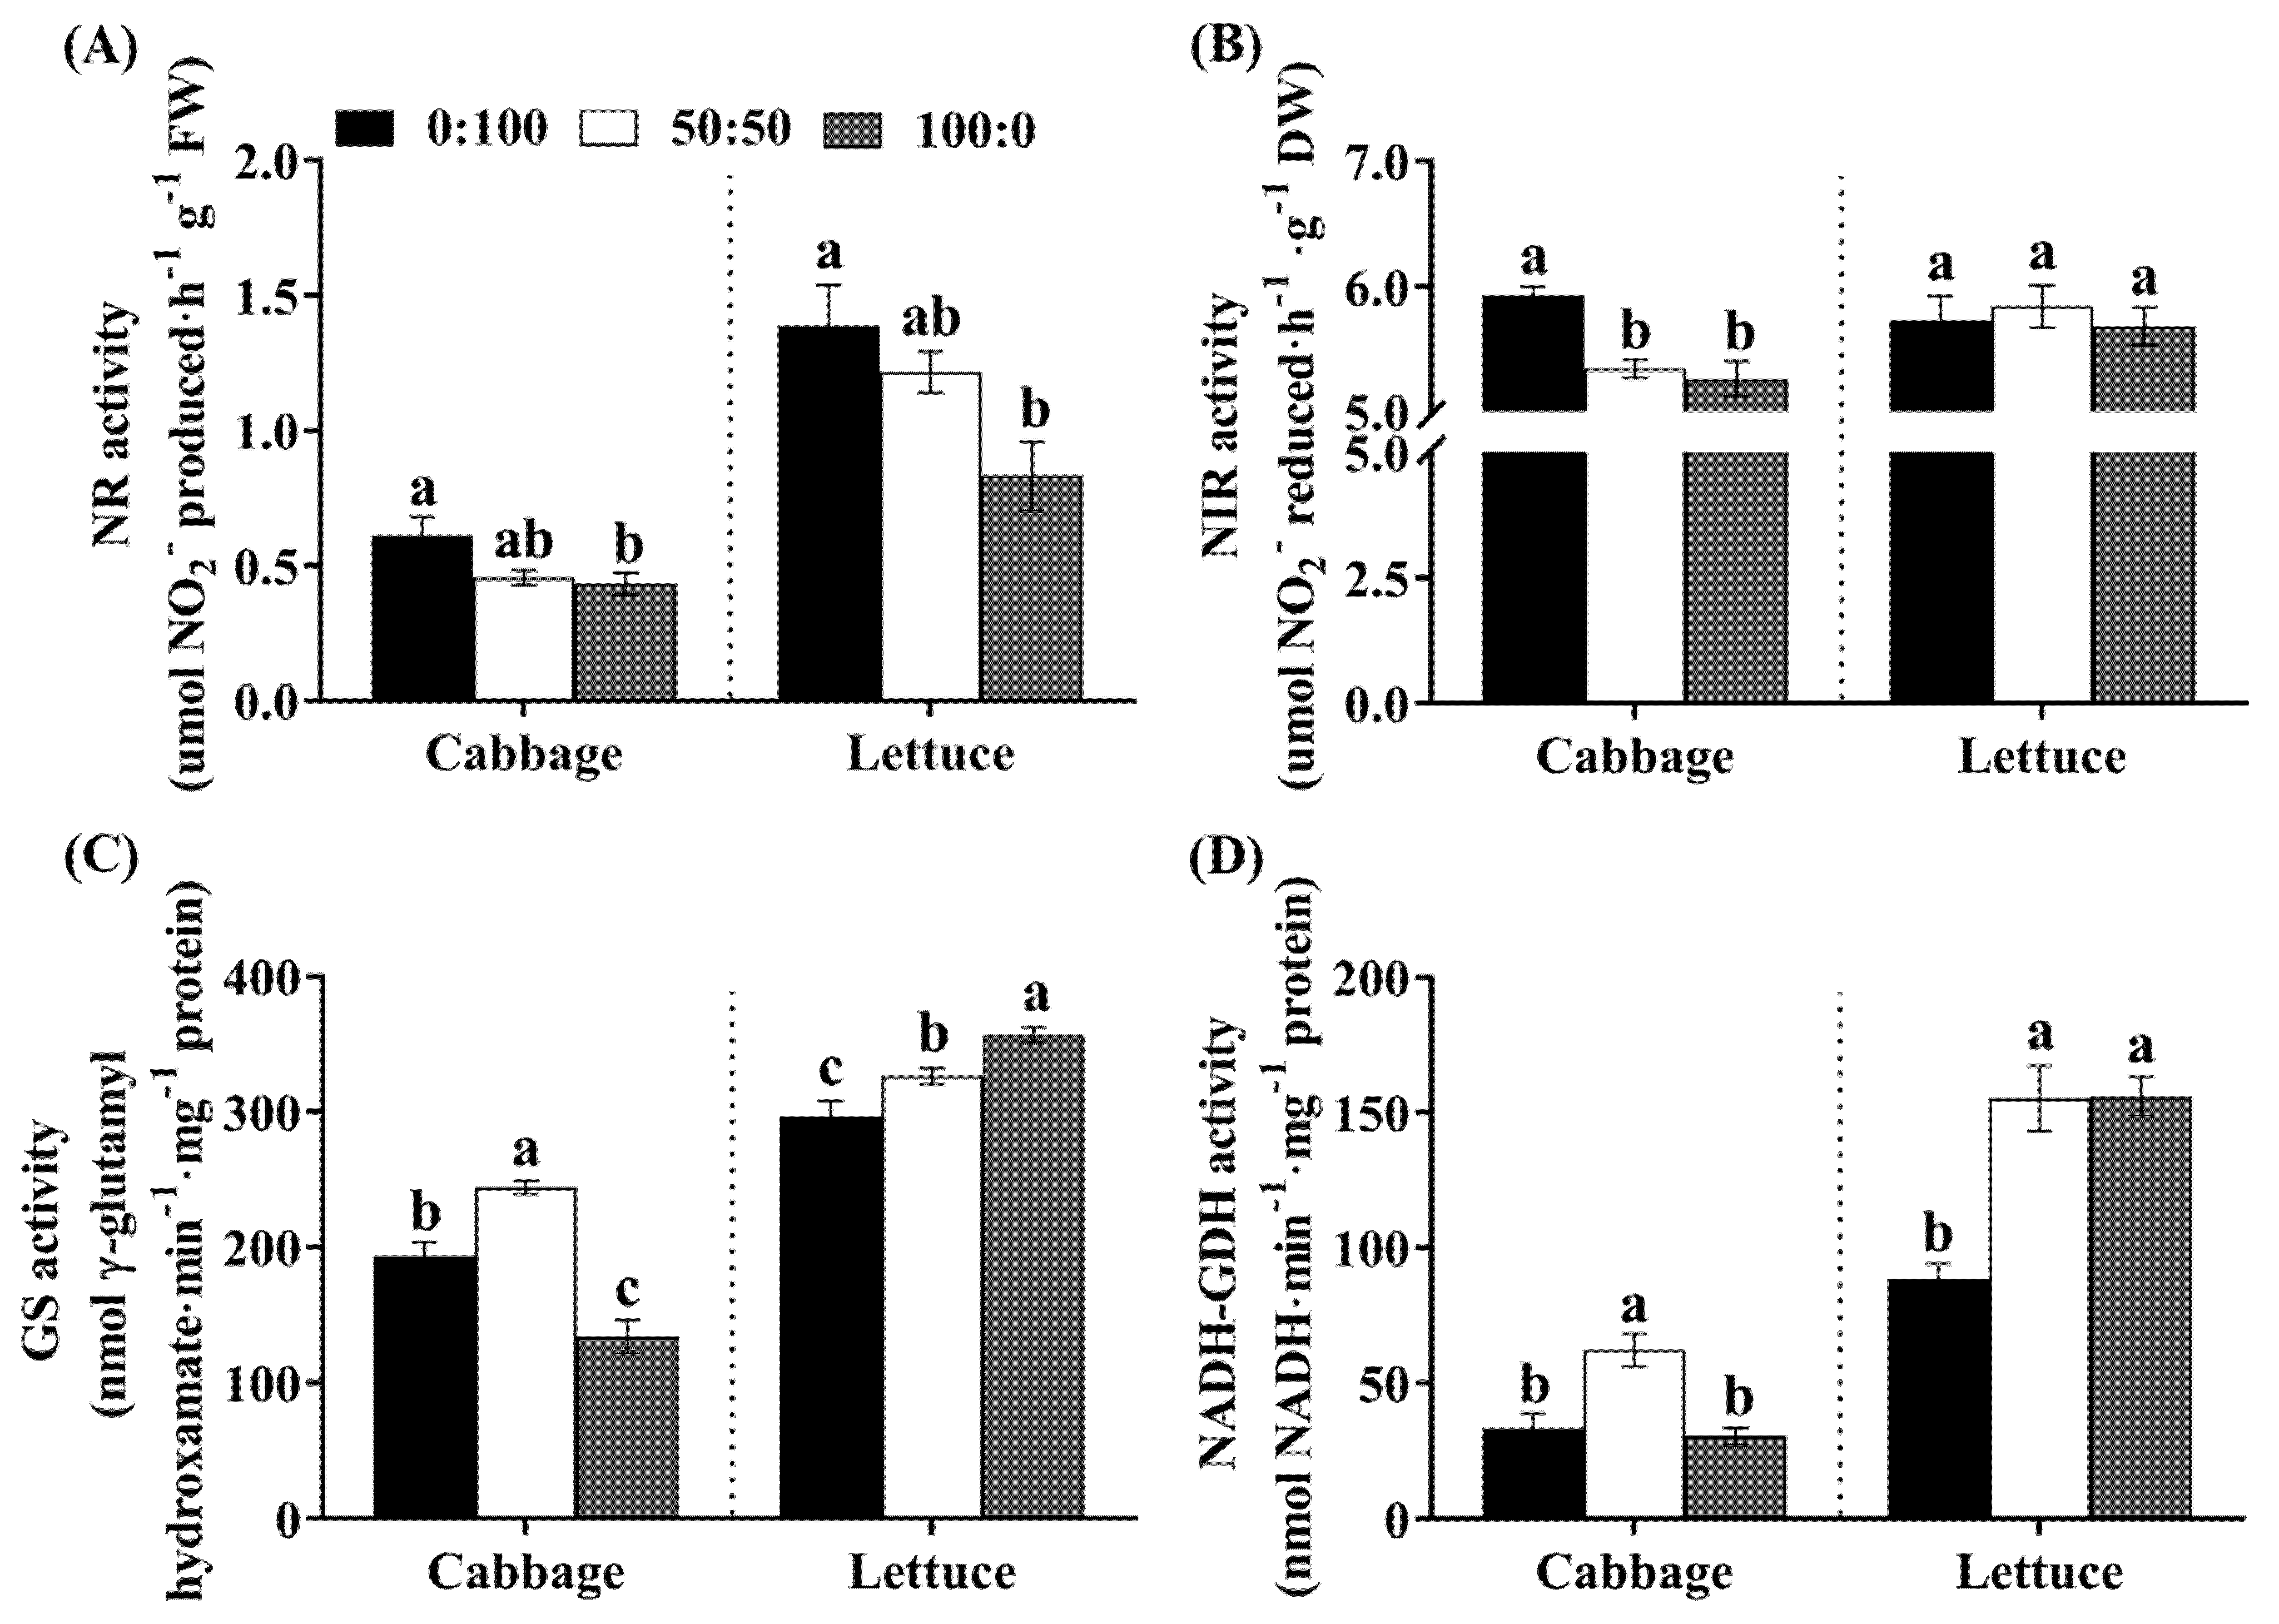
3.6. Activities of Key Enzymes in the N Assimilation Pathway
4. Discussion
5. Conclusions
Author Contributions
Funding
Conflicts of Interest
References
- Miller, A.; Cramer, M. Root nitrogen acquisition and assimilation. Plant Soil 2005, 274, 1–36. [Google Scholar] [CrossRef]
- Hanley, N. The economics of nitrate pollution. Eur. Rev. Agric. Econ. 1990, 17, 129–151. [Google Scholar] [CrossRef]
- Guerrero, M.G.; Vega, J.M.; Losada, M. The assimilatory nitrate-reducing system and its regulation. Annu. Rev. Plant Physiol. 1981, 32, 169–204. [Google Scholar] [CrossRef]
- Clarkson, D.T.; Hanson, J.B. The mineral nutrition of higher plants. Annu. Rev. Plant Physiol. 1980, 31, 239–298. [Google Scholar] [CrossRef]
- Li, Q.; Li, B.H.; Kronzucker, H.J.; Shi, W.M. Root growth inhibition by NH4+ in Arabidopsis is mediated by the root tip and is linked to NH4+ efflux and GMPase activity. Plant Cell Environ. 2010, 33, 1529–1542. [Google Scholar] [CrossRef] [PubMed]
- Darwin, C. The action of carbonate of ammonia on the roots of certain plants. Bot. J. Linn. Soc. 1882, 19, 239–261. [Google Scholar] [CrossRef]
- Britto, D.T.; Kronzucker, H.J. NH4+ toxicity in higher plants: A critical review. J. Plant Physiol. 2002, 159, 567–584. [Google Scholar] [CrossRef] [Green Version]
- Esteban, R.; Ariz, I.; Cruz, C.; Moran, J.F. Mechanisms of ammonium toxicity and the quest for tolerance. Plant Sci. 2016, 248, 92–101. [Google Scholar] [CrossRef] [Green Version]
- Xu, Z.; Gao, K. NH4+ enrichment and UV radiation interact to affect the photosynthesis and nitrogen uptake of Gracilaria lemaneiformis (Rhodophyta). Mar. Pollut. Bull. 2012, 64, 99–105. [Google Scholar] [CrossRef]
- Sharma, D.K.; Andersen, S.B.; Ottosen, C.O.; Rosenqvist, E. Wheat cultivars selected for high Fv/Fm under heat stress maintain high photosynthesis, total chlorophyll, stomatal conductance, transpiration and dry matter. Physiol. Plant. 2015, 153, 284–298. [Google Scholar] [CrossRef] [PubMed]
- Raab, T.K.; Terry, N. Carbon, nitrogen, and nutrient interactions in Beta vulgaris L. as influenced by nitrogen source, NO3− versus NH4+. Plant Physiol. 1995, 107, 575–585. [Google Scholar] [CrossRef] [Green Version]
- Claussen, W.; Lenz, F. Effect of ammonium and nitrate on net photosynthesis, flower formation, growth and yield of eggplants (Solanum melongena L.). Plant Soil 1995, 171, 267–274. [Google Scholar] [CrossRef]
- Evans, J.R.; Loreto, F. Acquisition and diffusion of CO2 in higher plant leaves. In Photosynthesis; Springer: Berlin/Heidelberg, Germany, 2000; pp. 321–351. [Google Scholar]
- Masclaux-Daubresse, C.; Daniel-Vedele, F.; Dechorgnat, J.; Chardon, F.; Gaufichon, L.; Suzuki, A. Nitrogen uptake, assimilation and remobilization in plants: Challenges for sustainable and productive agriculture. Ann. Bot. 2010, 105, 1141–1157. [Google Scholar] [CrossRef] [PubMed] [Green Version]
- Xu, G.; Fan, X.; Miller, A.J. Plant nitrogen assimilation and use efficiency. Annu. Rev. Plant Biol. 2012, 63, 153–182. [Google Scholar] [CrossRef] [Green Version]
- Labboun, S.; Tercé-Laforgue, T.; Roscher, A.; Bedu, M.; Restivo, F.M.; Velanis, C.N.; Skopelitis, D.S.; Moshou, P.N.; Roubelakis-Angelakis, K.A.; Suzuki, A. Resolving the role of plant glutamate dehydrogenase. I. In vivo real time nuclear magnetic resonance spectroscopy experiments. Plant Cell Physiol. 2009, 50, 1761–1773. [Google Scholar] [CrossRef] [PubMed] [Green Version]
- Cruz, C.; Bio, A.; Domínguez-Valdivia, M.; Aparicio-Tejo, P.M.; Lamsfus, C.; Martins-Louçao, M.A. How does glutamine synthetase activity determine plant tolerance to ammonium? Planta 2006, 223, 1068–1080. [Google Scholar] [CrossRef] [PubMed]
- Majerowicz, N.; Kerbauy, G.B. Effects of nitrogen forms on dry matter partitioning and nitrogen metabolism in two contrasting genotypes of Catasetum fimbriatum (Orchidaceae). Environ. Exp. Bot. 2002, 47, 249–258. [Google Scholar] [CrossRef]
- Hao, W.; Manivannan, A.; Yuze, C.; Jeong, B.R. Effect of Different Cultivation Systems on the Accumulation of Nutrients and Phytochemicals in Ligularia fischeri. Hortic. Plant J. 2018, 4, 24–29. [Google Scholar]
- Arnon, D.I. Copper enzymes in isolated chloroplasts. Polyphenoloxidase in Beta vulgaris. Plant Physiol. 1949, 24, 1. [Google Scholar] [CrossRef] [Green Version]
- Hammond, J.B.; Kruger, N.J. The bradford method for protein quantitation. In New Protein Tech.; Springer: Berlin/Heidelberg, Germany, 1988; pp. 25–32. [Google Scholar]
- McCready, R.; Guggolz, J.; Silviera, V.; Owens, H. Determination of starch and amylose in vegetables. Anal. Chem. 1950, 22, 1156–1158. [Google Scholar] [CrossRef]
- Bräutigam, A.; Gagneul, D.; Weber, A.P. High-throughput colorimetric method for the parallel assay of glyoxylic acid and ammonium in a single extract. Anal. Biochem. 2007, 362, 151–153. [Google Scholar] [CrossRef]
- Cataldo, D.; Maroon, M.; Schrader, L.E.; Youngs, V.L. Rapid colorimetric determination of nitrate in plant tissue by nitration of salicylic acid. Commun. Soil Sci. Plan. 1975, 6, 71–80. [Google Scholar] [CrossRef]
- Moshage, H.; Kok, B.; Huizenga, J.R.; Jansen, P. Nitrite and nitrate determinations in plasma: A critical evaluation. Clin. Chem. 1995, 41, 892–896. [Google Scholar] [CrossRef]
- Huang, L.; Li, M.; Zhou, K.; Sun, T.; Hu, L.; Li, C.; Ma, F. Uptake and metabolism of ammonium and nitrate in response to drought stress in Malus prunifolia. Plant Physiol. Biochem. 2018, 127, 185–193. [Google Scholar] [CrossRef]
- Högberg, P.; Granström, A.; Johansson, T.; Lundmark-Thelin, A.; Näsholm, T. Plant nitrate reductase activity as an indicator of availability of nitrate in forest soils. Can. J. For. Res. 1986, 16, 1165–1169. [Google Scholar] [CrossRef]
- Ogawa, T.; Fukuoka, H.; Yano, H.; Ohkawa, Y. Relationships between nitrite reductase activity and genotype-dependent callus growth in rice cell cultures. Plant Cell Rep. 1999, 18, 576–581. [Google Scholar] [CrossRef]
- Oaks, A.; Stulen, I.; Jones, K.; Winspear, M.J.; Misra, S.; Boesel, I.L. Enzymes of nitrogen assimilation in maize roots. Planta 1980, 148, 477–484. [Google Scholar] [CrossRef]
- Kanamori, T.; Konishi, S.; Takahashi, E. Inducible formation of glutamate dehydrogenase in rice plant roots by the addition of ammonia to the media. Physiol. Plant. 1972, 26, 1–6. [Google Scholar] [CrossRef]
- Tabatabaei, S.; Fatemi, L.; Fallahi, E. Effect of ammonium: Nitrate ratio on yield, calcium concentration, and photosynthesis rate in strawberry. J. Plant Nutr. 2006, 29, 1273–1285. [Google Scholar] [CrossRef]
- Horchani, F.; Hajri, R.; Aschi-Smiti, S. Effect of ammonium or nitrate nutrition on photosynthesis, growth, and nitrogen assimilation in tomato plants. J. Plant Nutr. Soil Sci. 2010, 173, 610–617. [Google Scholar] [CrossRef]
- Guo, S.; Zhou, Y.; Shen, Q.; Zhang, F. Effect of ammonium and nitrate nutrition on some physiological processes in higher plants-growth, photosynthesis, photorespiration, and water relations. Plant Biol. 2007, 9, 21–29. [Google Scholar] [CrossRef]
- Magalhaes, J.; Wilcox, G. Growth, free amino acids, and mineral composition of tomato plants in relation to nitrogen form and growing media. J. Am. Soc. Hortic. Sci. 1984, 109, 406–411. [Google Scholar]
- Ruan, J.; Gerendás, J.; Härdter, R.; Sattelmacher, B. Effect of nitrogen form and root-zone pH on growth and nitrogen uptake of tea (Camellia sinensis) plants. Ann. Bot. 2007, 99, 301–310. [Google Scholar] [CrossRef] [Green Version]
- Santamaria, P.; Elia, A. Producing nitrate-free endive heads: Effect of nitrogen form on growth, yield, and ion composition of endive. J. Am. Soc. Hortic. Sci. 1997, 122, 140–145. [Google Scholar] [CrossRef] [Green Version]
- Jeong, B.R.; Lee, C.W. Influence of ammonium, nitrate, and chloride on solution pH and ion uptake by ageratum and salvia in hydroponic culture. J. Plant Nutr. 1996, 19, 1343–1360. [Google Scholar] [CrossRef]
- Kura-Hotta, M.; Satoh, K.; Katoh, S. Relationship between photosynthesis and chlorophyll content during leaf senescence of rice seedlings. Plant Cell Physiol. 1987, 28, 1321–1329. [Google Scholar]
- Prieto, P.; Penuelas, J.; Llusia, J.; Asensio, D.; Estiarte, M. Effects of long-term experimental night-time warming and drought on photosynthesis, Fv/Fm and stomatal conductance in the dominant species of a Mediterranean shrubland. Acta Physiol. Plant 2009, 31, 729–739. [Google Scholar] [CrossRef]
- Ohsumi, A.; Kanemura, T.; Homma, K.; Horie, T.; Shiraiwa, T. Genotypic variation of stomatal conductance in relation to stomatal density and length in rice (Oryza sativa L.). Plant Prod. Sci. 2007, 10, 322–328. [Google Scholar] [CrossRef]
- Lammertsma, E.I.; de Boer, H.J.; Dekker, S.C.; Dilcher, D.L.; Lotter, A.F.; Wagner-Cremer, F. Global CO2 rise leads to reduced maximum stomatal conductance in Florida vegetation. Proc. Natl. Acad. Sci. USA 2011, 108, 4035–4040. [Google Scholar] [CrossRef] [Green Version]
- Purcell, C.; Batke, S.; Yiotis, C.; Caballero, R.; Soh, W.; Murray, M.; McElwain, J.C. Increasing stomatal conductance in response to rising atmospheric CO2. Ann. Bot. 2018, 121, 1137–1149. [Google Scholar] [CrossRef] [PubMed] [Green Version]
- Borgognone, D.; Colla, G.; Rouphael, Y.; Cardarelli, M.; Rea, E.; Schwarz, D. Effect of nitrogen form and nutrient solution pH on growth and mineral composition of self-grafted and grafted tomatoes. Sci. Hortic. 2013, 149, 61–69. [Google Scholar] [CrossRef]
- Takács, E.; Técsi, L. Effects of NO3−/NH4+ ratio on photosynthetic rate, nitrate reductase activity and chloroplast ultrastructure in three cultivars of red pepper (Capsicum annuum L.). J. Plant Physiol. 1992, 140, 298–305. [Google Scholar] [CrossRef]
- Tylová, E.; Steinbachová, L.; Votrubová, O.; Lorenzen, B.; Brix, H. Different sensitivity of Phragmites australis and Glyceria maxima to high availability of ammonium-N. Aquat. Bot. 2008, 88, 93–98. [Google Scholar] [CrossRef]
- Tabatabaei, S.; Yusefi, M.; Hajiloo, J. Effects of shading and NO3: NH4 ratio on the yield, quality and N metabolism in strawberry. Sci. Hortic. 2008, 116, 264–272. [Google Scholar] [CrossRef]
- Song, J.N.; Wang, Y.Q.; Li, F.L.; Hu, Y.J.; Yang, H.B. Effect of saline soil and amino acids on quality and yield of field Tartary buckwheat. Land Degrad. Dev. 2021, 32, 2554–2562. [Google Scholar] [CrossRef]
- Sarasketa, A.; González-Moro, M.B.; González-Murua, C.; Marino, D. Exploring ammonium tolerance in a large panel of Arabidopsis thaliana natural accessions. J. Exp. Bot. 2014, 65, 6023–6033. [Google Scholar] [CrossRef] [PubMed] [Green Version]
- Cramer, M.; Lewis, O. The influence of nitrate and ammonium nutrition on the growth of wheat (Triticum aestivum) and maize (Zea mays) plants. Ann. Bot. 1993, 72, 359–365. [Google Scholar] [CrossRef]
- Doganlar, Z.B.; Demir, K.; Basak, H.; Gul, I. Effects of salt stress on pigment and total soluble protein contents of three different tomato cultivars. Afr. J. Agr. Res. 2010, 5, 2056–2065. [Google Scholar]
- Hong, H.S.; Wang, Y.J.; Wang, D.Z. Response of phytoplankton to nitrogen addition in the Taiwan strait upwelling region: Nitrate reductase and glutamine synthetase activities. Cont. Shelf Res. 2011, 31, S57–S66. [Google Scholar] [CrossRef]
- Finch-Savage, W.E.; Cadman, C.S.; Toorop, P.E.; Lynn, J.R.; Hilhorst, H.W. Seed dormancy release in Arabidopsis Cvi by dry after-ripening, low temperature, nitrate and light shows common quantitative patterns of gene expression directed by environmentally specific sensing. Plant J. 2007, 51, 60–78. [Google Scholar] [CrossRef] [PubMed]
- Liu, G.; Du, Q.; Li, J. Interactive effects of nitrate-ammonium ratios and temperatures on growth, photosynthesis, and nitrogen metabolism of tomato seedlings. Sci. Hortic. 2017, 214, 41–50. [Google Scholar] [CrossRef] [Green Version]
- Skopelitis, D.S.; Paranychianakis, N.V.; Paschalidis, K.A.; Pliakonis, E.D.; Delis, I.D.; Yakoumakis, D.I.; Kouvarakis, A.; Papadakis, A.K.; Stephanou, E.G.; Roubelakis-Angelakis, K.A. Abiotic stress generates ROS that signal expression of anionic glutamate dehydrogenases to form glutamate for proline synthesis in tobacco and grapevine. Plant Cell 2006, 18, 2767–2781. [Google Scholar] [CrossRef] [PubMed] [Green Version]
- Magalhaes, J.; Huber, D. Response of ammonium assimilation enzymes to nitrogen form treatments in different plant species. J. Plant Nutr. 1991, 14, 175–185. [Google Scholar] [CrossRef]
- Lasa, B.; Frechilla, S.; Aparicio-Tejo, P.M.; Lamsfus, C. Alternative pathway respiration is associated with ammonium ion sensitivity in spinach and pea plants. Plant Growth Regul. 2002, 37, 49–55. [Google Scholar] [CrossRef]


| NH4+: NO3− Ratio (%) | Cation (me·L−1) | Anion (me·L−1) | Total | ||||||
|---|---|---|---|---|---|---|---|---|---|
| Ca2+ | Mg2+ | K+ | NH4+ | NO3− | SO42− | Cl− | H2PO4− | ||
| Standard (MNS) | 6.0 | 2.0 | 5.0 | 2.0 | 11.0 | 2.0 | 0.0 | 2.0 | 30.0 |
| 0:100 | 6.9 | 2.3 | 5.8 | 0.0 | 13.0 | 1.0 | 0.0 | 1.0 | 30.0 |
| 50:50 | 5.9 | 2.0 | 4.5 | 6.5 | 6.5 | 6.5 | 0.0 | 2.0 | 37.8 |
| 100:0 | 4.9 | 1.7 | 3.2 | 13.0 | 0.0 | 15.9 | 4.9 | 2.0 | 45.6 |
| Species | N Ratio (NH4+:NO3−) | Shoot Length (cm) | Root Length (cm) | Leaf Length (cm) | Leaf Width (cm) |
|---|---|---|---|---|---|
| Cabbage | 0:100 | 7.6b y | 10.0b | 6.9b | 3.3b |
| 50:50 | 9.7a | 13.0a | 8.7a | 4.3a | |
| 100:0 | 4.0c | 8.1b | 3.4c | 0.9c | |
| Lettuce | 0:100 | 9.5b y | 10.0b | 7.0b | 3.3b |
| 50:50 | 12.4a | 13.0a | 8.8a | 4.3a | |
| 100:0 | 7.6c | 7.5c | 6.7c | 2.3b |
Publisher’s Note: MDPI stays neutral with regard to jurisdictional claims in published maps and institutional affiliations. |
© 2021 by the authors. Licensee MDPI, Basel, Switzerland. This article is an open access article distributed under the terms and conditions of the Creative Commons Attribution (CC BY) license (https://creativecommons.org/licenses/by/4.0/).
Share and Cite
Song, J.; Yang, J.; Jeong, B.R. Growth, Quality, and Nitrogen Assimilation in Response to High Ammonium or Nitrate Supply in Cabbage (Brassica campestris L.) and Lettuce (Lactuca sativa L.). Agronomy 2021, 11, 2556. https://doi.org/10.3390/agronomy11122556
Song J, Yang J, Jeong BR. Growth, Quality, and Nitrogen Assimilation in Response to High Ammonium or Nitrate Supply in Cabbage (Brassica campestris L.) and Lettuce (Lactuca sativa L.). Agronomy. 2021; 11(12):2556. https://doi.org/10.3390/agronomy11122556
Chicago/Turabian StyleSong, Jinnan, Jingli Yang, and Byoung Ryong Jeong. 2021. "Growth, Quality, and Nitrogen Assimilation in Response to High Ammonium or Nitrate Supply in Cabbage (Brassica campestris L.) and Lettuce (Lactuca sativa L.)" Agronomy 11, no. 12: 2556. https://doi.org/10.3390/agronomy11122556